
Page 30
Data Mining and Visualization
RONNY KOHAVI
Blue Martini Software San Mateo, California
ABSTRACT
Data mining is the process of identifying new patterns and insights in data. As the volume of data collected and stored in databases grows, there is a growing need to provide data summarization (e.g., through visualization), identify important patterns and trends, and act upon the findings. Insight derived from data mining can provide tremendous economic value, often crucial to businesses looking for competitive advantages. A short review of data mining and important theoretical results is provided, followed by recent advances and challenges.
INTRODUCTION
Yahoo!'s traffic increased to 680 million page views per day on average. . . . Yahoo!'s communication platform delivered 4.4 billion messages . . . in June [2000].
—Yahoo! press release, July 11, 2000
The amount of data stored on electronic media is growing exponentially fast. Today's data warehouses dwarf the biggest databases built a decade ago (Kimball and Merz, 2000), and making sense of such data is becoming harder and more challenging. Online retailing in the Internet age, for example, is very different from retailing a decade ago, because the three most important factors of the past (location, location, and location) are irrelevant for online stores.
One of the greatest challenges we face today is making sense of all these data. Data mining—or knowledge discovery—is the process of identifying new patterns and insights in data, whether for understanding the human genome in
Page 31
order to develop new drugs, for discovering new patterns in recent census data in order to warn about hidden trends, or for understanding your customers better at an electronic webstore in order to provide a personalized one-to-one experience. The examples here are from the e-commerce world, but data mining has been used extensively in multiple domains, including many scientific applications. The paper is also restricted to structured mining; significant literature exists on text mining and information retrieval.
The paper is organized as follows. The next section introduces data mining tasks and models, followed by a quick tour of some theoretical results. Next, a review of the recent advances is presented, followed by challenges and a summary.
DATA MINING TASKS AND MODELS
The most exciting phrase to hear in science, the one that heralds new discoveries, is not “Eureka!”(I found it!) but “That's funny. . . .”
—Isaac Asimov
Data mining, sometimes referred to as “knowledge discovery” (Fayyad et al., 1996), is at the intersection of multiple research areas, including machine learning (Dietterich and Shavlik, 1990; Kearns and Vazirani, 1994; Mitchell, 1997; Quinlan, 1993), statistics (Breiman et al., 1984; Friedman et al., in press; Fukunaga, 1990), pattern recognition (Bishop, 1996; Duda et al., 2000; Ripley and Hjort, 1995), databases (Shafer et al., 1996; Srikant and Agrawal, 1995), and visualization (Cleveland, 1993; Tufte, 1983). Good marketing and business-oriented data mining books are also available (Berry and Linoff, 2000; Berson et al., 1999; Dhar, 1997). With the maturity of databases and constant improvements in computational speed, data mining algorithms that were too expensive to execute are now within reach.
Data mining serves two goals:
1. Insight: Identify patterns and trends that are comprehensible so that action can be taken based on the insight. For example, characterize the heavy spenders on a website or people who buy product X. By understanding the underlying patterns, one can personalize and improve the website. The insight may also lead to decisions that affect other channels, such as brick-and-mortar stores' placement of products, marketing efforts, and cross-sells.
2. Prediction: Build a model that predicts (or scores) based on input data. For example, a model can be built to predict the propensity of customers to buy product X based on their demographic data and browsing patterns on a website. Customers with high scores can be used in a direct marketing campaign. If the prediction is for a discrete variable with a few values (e.g., buy product X or not), the task is called “classification”; if the prediction is for a continuous variable (e.g., customer spending in the next year), the task is called “regression.”
Page 32
The majority of research in data mining has concentrated on building the best models for prediction. Part of the reason, no doubt, is that a prediction task is well defined and can be objectively measured on an independent test set. A dataset that is labeled with the correct predictions is split into a training set and a test set. A learning algorithm is given the training set and produces a model that can map new, unseen data into the prediction. The model then can be evaluated for its accuracy in making predictions on the unseen test set. Descriptive data mining, which yields human insight, is harder to evaluate yet necessary in many domains, because the users may not trust predictions coming out of a black box or because, legally, one must explain the predictions. For example, even if a Perceptron algorithm (Minsky and Papert, 1987) out-performs a loan officer in predicting who will default on a loan, the person requesting a loan cannot be rejected simply because he is on the wrong side of a 37-dimensional hyperplane; legally, the loan officer must explain the reason for the rejection.
The choice of a predictive model can have a profound influence on the resulting accuracy and on the ability of humans to gain insight from it. Some models are naturally easier to understand than others. For example, a model consisting of if-then rules is easy to understand, unless the number of rules is too large. Decision trees are also relatively easy to understand. Linear models get a little harder, especially if discrete inputs are used. Nearest-neighbor algorithms in high dimensions are almost impossible for users to understand, and nonlinear models in high dimensions, such as neural networks, are the most opaque.
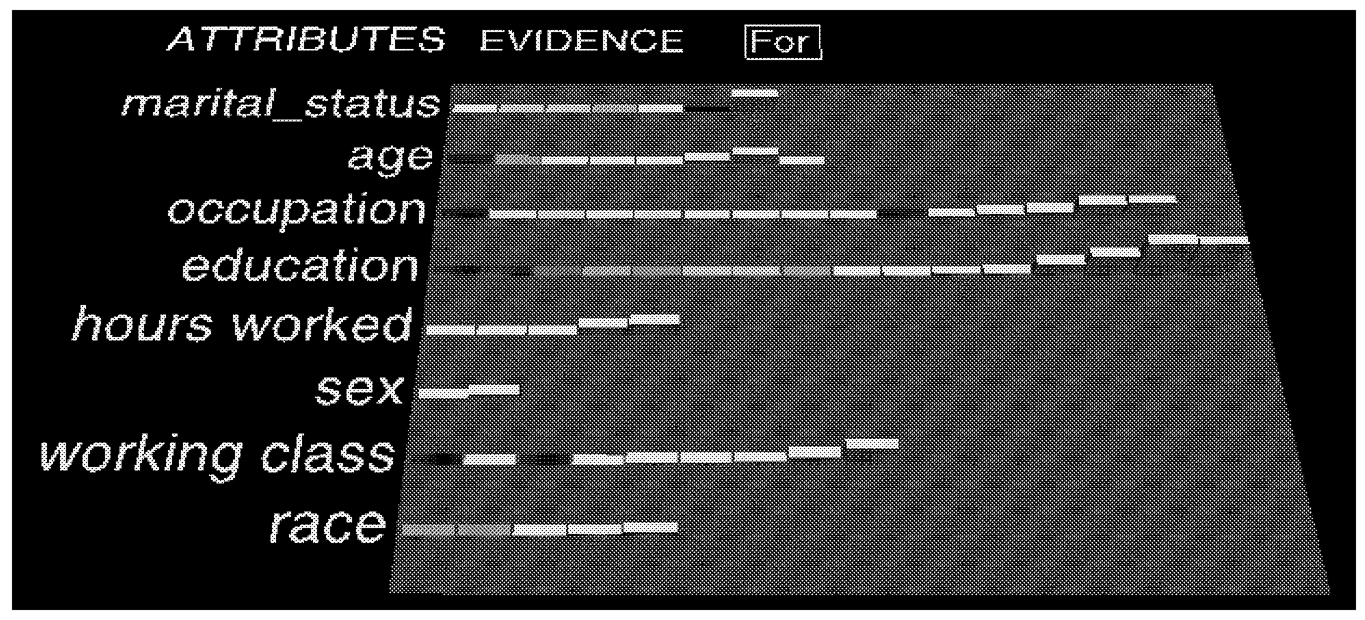
One way to aid users in understanding the models is to visualize them. MineSet (Brunk et al., 1997), for example, is a data mining tool that integrates data mining and visualization very tightly. Models built can be viewed and interacted with. (Several movies are available at http://www.sgi.com/software/mineset/demos.html.) Figure 1shows a visualization of the Naive-Bayes classifier. Given a target value—in this case those in the U.S. working population who earn more than $50,000—the visualization shows a small set of “important” attributes (measured using mutual information or cross-entropy). For each attribute a bar chart shows how much “evidence” each value (or range of values) of that attribute provides for the target label. For example, higher education levels (right bars in the education row) imply higher salaries because the bars are higher. Similarly, salary increases with age up to a point and then decreases, and salary increases with the number of hours worked per week. The combination of a back-end algorithm that bins the data and computes the importance of hundreds of attributes and a visualization that shows the important attributes makes this a very useful tool that helps identify patterns. Users can interact with the model by clicking on attribute values and seeing the predictions the model makes.
Page 33
~ enlarge ~
FIGURE 1 A visualization of the Naive-Bayes classifier. SOURCE: Reprinted with permission from AAAI Press (Brunk et al., 1997).
DATA MINING THEORY
Reality is the murder of a beautiful theory by a gang of ugly facts.
—Robert L. Glass (1996)
The following is a short review of some theoretical results in data mining.
-
No free lunch.A fundamental observation is that learning is impossible without assumptions. If all concepts are equally likely, then not only is learning impossible but no algorithm can dominate another in generalization accuracy (Schaffer, 1994; Wolpert, 1995). The result is similar to the proof that data compression is not always possible (yet everyone enjoys the savings provided by data compression algorithms). In practice, learning is very useful because the world does not present us with uniform worst-case scenarios.
-
Consistency.While parametric models (e.g., linear regression) are known to be of limited power, nonparametric models can be shown to learn “any reasonable” target concept, given enough data. For example, nearest-neighbor algorithms with a growing neighborhood have been shown to have asymptotically optimal properties under mild assumptions (Fix and Hodges, 1951). Similar results exist for the consistency of decision tree algorithms (Gordon and Olshen, 1984). While asymptotic consistency theorems are comforting because they guarantee that with enough data the learning algorithms will converge to the target concept one is trying to learn, our world is not so ideal. We are always given finite amounts of data from which to learn, and rarely do we reach asymptopia.
An excellent example of the problem of nearest neighbors not being so “near” is as follows (Friedman et al., in press). Assume a 20-dimensional unit
Page 34
ball (radius = 1) centered at the origin with 100,000 points uniformly distributed. The median distance from the origin to the closest point is 0.55, more than halfway to the boundary. Most points, therefore, are closer to the boundary of the sample space than to another point! In a few dimensions, standard visualization methods work well; in higher dimensions our intuition is commonly wrong, and data mining can help.
-
PAC learning.Probably Approximately Correct (PAC) learning (Kearns and Vazirani, 1994; Valiant, 1984) is a concept introduced to provide guarantees about learning. Briefly, assuming that the target can be described in a given hypothesis space (e.g., disjunctions of conjunctions of length k), a PAC learning algorithm can learn the approximate target with high probability. The two parameters typically given as input to a PAC learning algorithm are ε and δ. The algorithm must satisfy the condition that at least (1− δ) fraction of the time, the error between the actual target concept and the predictions made is bounded by ε. PAC learning theory defines bounds on the number of examples needed to provide such guarantees.
One of the more interesting results in PAC learning theory is that a weak learning algorithm, which can classify more accurately than random guessing (e.g., ε < 0.5), can always be boosted into a strong learning algorithm, which can produce classifiers of arbitrary accuracy (Schapire, 1990). (More training data will be needed, of course.) This theoretical result has led to interesting practical developments, mentioned below.
-
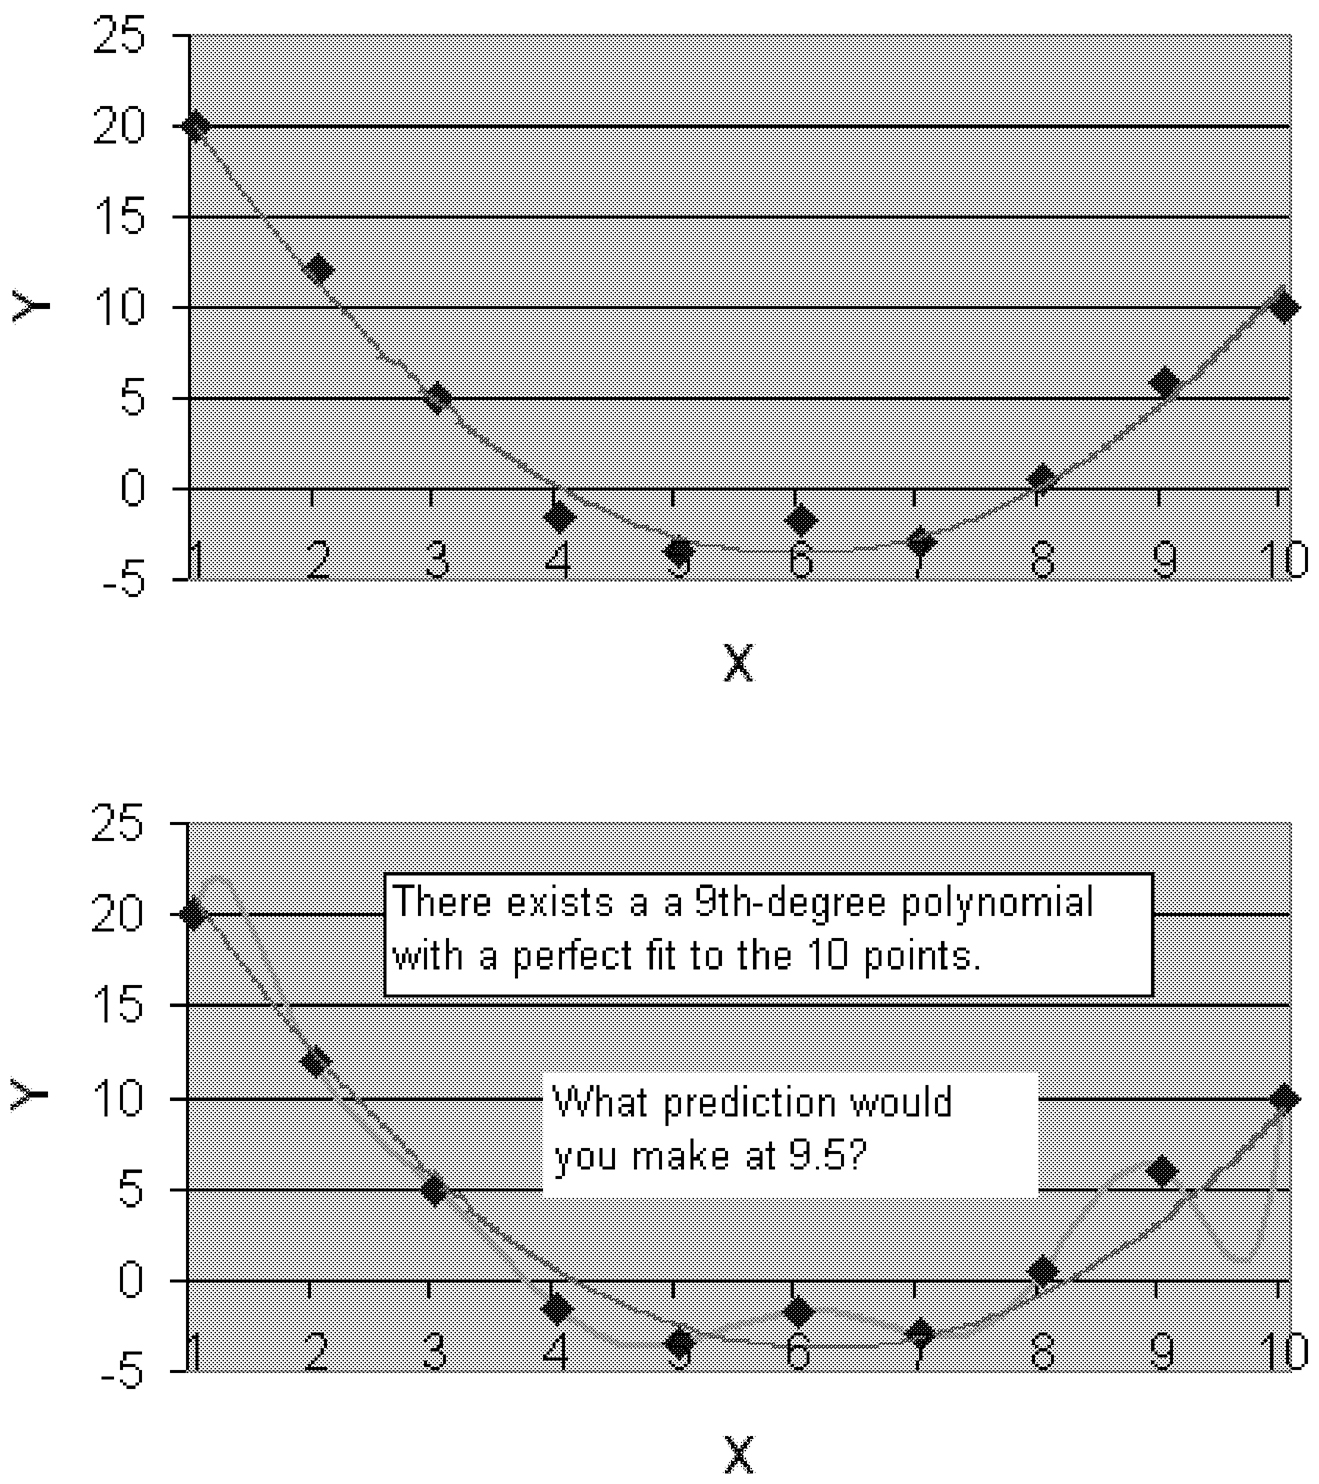
Bias-variance decomposition.The expected error of any learning algorithm for a given target concept and training set size can be decomposed into two terms: the bias and the variance (Geman et al., 1992). The importance of the decomposition is that it is valid for finite training set sizes—not asymptotically—and that the terms can be measured experimentally. The bias measures how closely the learning algorithm's average guess (over all possible training sets of the given training set size) matches the target. The variance measures how much the learning algorithm's guess varies for different training sets of the given size. Researchers have taken many unsuccessful and painful routes trying to improve a learning algorithm by enlarging the space of models, which can reduce the bias but may also increase the variance. For example, Figure 2shows how 10 data points, assumed to be slightly noisy, can be reasonably fit with a quadratic polynomial and perfectly fit with a ninth-degree polynomial that overfits the data. A learning algorithm trying to fit high-degree polynomials will generate very different polynomials for different training sets and, hence, have high variance. A learning algorithm that always fits a linear model will be more stable but will be biased for quadratic and higher-order models.
Making the analogy to decision tree models, finding the smallest decision tree that perfectly fits the data (an NP-hard problem) takes a long time and often results in worse generalizations than using a simple greedy algorithm that approximately fits the data. The reason is that the smallest perfect trees generat-
Page 35
~ enlarge ~
FIGURE 2 The upper figure shows a quadratic fit to data, but the fit is not perfect. The lower figure shows a ninth-degree polynomial fit that perfectly passes through all the data points. If the data are expected to contain some noise, the model on the top will probably make a better prediction at x = 9.5 than the squiggly model on the bottom, which (over) fits the data perfectly.
Page 36
ed for similar data sets of the same size vary significantly in structure and predictions, and, hence, the expected error has a large variance term. For several algorithms it is known how to move along this bias-variance tradeoff through regularization techniques.
RECENT ADVANCES
The advancement of the arts, from year to year, taxes our credulity and seems to presage the arrival of that period when human improvement must end.
—Henry Elsworth, U.S. Patent Office (1844)
Below is a brief summary of recent advances in the field of data mining. A description of several advances specific to machine learning can be found in AI Magazine(Dietterich, 1997).
-
Multiple model learning. Two learning techniques developed in the last few years have had a significant impact: Bagging and Boosting. Both methods learn multiple models and vote them in order to make a prediction, and both have been shown to be very successful in improving prediction accuracy on real data (Bauer and Kohavi, 1999; Quinlan, 1996). Bagging (Breiman, 1996) generates bootstrap samples by repeatedly sampling the training set with replacement. A model is built for each sample, and they are then uniformly voted. Boosting algorithms—and specifically the AdaBoost algorithm (Freund and Schapire, 1997)—generate a set of classifiers in sequence. Each classifier is given a training set in which examples are reweighted to highlight those previously misclassified.
-
Associations. A common problem in retailing is to find combinations of products that, when bought together, imply the purchase of another product. For example, an association might be that the purchase of hotdogs and a Coke® implies the purchase of chips with high probability. Several algorithms were developed to find such associations for market basket analysis (Srikant and Agrawal, 1995). Given a minimum support (percentage of the data that has to satisfy the rule) and a minimum confidence (the probability that the right-hand side is satisfied given the left-hand side), the algorithms find all associations. Note that unlike prediction tasks, this is a descriptive task where the result is well defined and the algorithms must be sound and complete. The main observation in these algorithms is that in order for a combination of size L to have minimum support, each of its subsets of size (L − 1) must have minimum support.
-
Scalability (both speed and data set size). Several advances have been made in scaling algorithms to larger data sets and parallelizing them (Freitas and Lavington, 1997; Provost and Kolluri, 1999; Shafer et al., 1996).
Page 37
CHALLENGES
Laggards follow the path of greatest familiarity. Challengers, on the other hand, follow the path of greatest opportunity, wherever it leads.
—Gary Hamel and C. K. Prahalad (1994)
Selected challenging problems are described below.
-
Make data mining models comprehensible to business users. Business users need to understand the results of data mining. Few data mining models are easy to understand, and techniques need to be developed to explain or visualize existing ones (e.g., Becker et al., 1997), or new models that are simple to understand with matching algorithms need to be derived. This is particularly hard for regression models. A related problem is that association algorithms usually derive too many rules (e.g., 100,000), and we need to find ways to highlight the “interesting” rules or families of associations.
-
Make data transformations and model building accessible to business users. An important issue not mentioned above is the need to translate users' questions into a data mining problem in relational format. This often requires writing SQL, Perl scripts, or small programs. Even defining whatthe desired transformations and features should be is a knowledge-intensive task requiring significant understanding of the tasks, the algorithms, and their capabilities. Can we design a transformation language more accessible to business users? Can we automatically transform the data?
-
Scale algorithms to large volumes of data. It has been estimated that the amount of text in the Library of Congress can be stored in about 17 terabytes of disk space (Berry and Linoff, 2000). The package-level detail database used to track shipments at UPS is also 17 terabytes. Most data mining algorithms can handle a few gigabytes of data at best, so there are three to four orders of magnitude to grow before we can attack the largest databases that exist today. In addition, most algorithms learn in batch, but many applications require real-time learning.
-
Close the loop: identify causality, suggest actions, and measure their effect. Discoveries may reveal correlations that are not causal. For example, human reading ability correlates with shoe size, but wearing larger shoes will not improve one's reading ability. (The correlation is explained by the fact that children have smaller shoe sizes and cannot read as well.) Controlled experiments and measurements of their effects can help pinpoint the causal relationships. One advantage of the online world is that experiments are easy to conduct: changing layout, emphasizing certain items, and offering cross-sells can all be done easily and their effects can be measured. For electronic commerce, the World Wide Web is a great laboratory for experiments, but our learning techniques need to be improved to offer interventions and take them into account.
Page 38
-
Cope with privacy issues. Data mining holds the promise of reducing the amount of junk mail we receive by providing us with more targeted messages. However, data collection can also lead to abuses of the data, raising many social and economic issues. This is doubly true in the online world, where every page and every selection we make can be recorded.
SUMMARY
You press the button, and we'll do the rest.
—Kodak advertisement
Taking pictures and developing them (or loading them into a computer) has become a trivial task: there is no need to focus, adjust the shutter speed and aperture, or know anything about chemistry to take great pictures. Data mining and related technologies have had significant advances, but we have yet to build the equivalent of the point-and-click cameras. This short review of the basic goals of data mining, some theory, and recent advances should provide those interested with enough information to see the value of data mining and use it to find nuggets; after all, almost everyone has access to the main ingredient needed: data.
ACKNOWLEDGMENTS
I thank Carla Brodley, Tom Dietterich, Pedro Domingos, Rajesh Parekh, Ross Quinlan, and Zijian Zheng for their comments and suggestions.
REFERENCES
, and . 1999. An empirical comparison of voting classification algorithms: Bagging, boosting, and variants. Machine Learning 36: 105–139.
, , and . 1997. Visualizing the simple Bayesian classifier. Presented at KDD Workshop on Issues in the Integration of Data Mining and Data Visualization, Newport Beach, Calif., August 17, 1997.
, and . 2000. Mastering Data Mining: The Art and Science of Customer Relationship Management. New York: John Wiley & Sons.
, , and . 1999. Building Data Mining Applications for CRM. New York: McGraw-Hill.
. 1996. Neural Networks for Pattern Recognition. New York: Oxford University Press.
1996. Bagging predictors. Machine Learning 24: 123–140.
, , , and . 1984. Classification and Regression Trees. Belmont, Calif.: Wadsworth International Group.
, , and . 1997. MineSet: An integrated system for data mining. Pp. 135–138 in Proceedings of the Third International Conference on Knowledge Discovery and Data Mining, D. Heckerman, H. Mannila, D. Pregibon, and R. Uthurusamy, eds. Cambridge, Mass.: AAAI Press. Website: http://mineset.sgi.com.
Page 39
. 1993. Visualizing Data. Summit, N.J.: Hobart Press.
. 1997. Seven Methods for Transforming Corporate Data into Business Intelligence. New York: Prentice–Hall.
1997. Machine-learning research: Four current directions. AI Magazine 18(4): 97–136.
Dietterich, T. G., and J. W. Shavlik, eds. 1990. Readings in Machine Learning. San Francisco: Morgan Kaufmann.
, and 2000. Pattern Classification. New York: John Wiley & Sons.
Fayyad, U. M., G. Piatetsky-Shapiro, P. Smyth, and R. Uthurusamy, eds. 1996. From data mining to knowledge discovery: An overview. Pp. 1–34 in Advances in Knowledge Discovery and Data Mining. Cambridge, Mass.: MIT Press and the AAAI Press.
, and . 1951. Discriminatory Analysis—Nonparametric Discrimination: Consistency Properties. Technical Report 21-49-004, Report No. 04. Randolph Field, Tex.: USAF School of Aviation Medicine.
, and . 1997. Mining Very Large Databases With Parallel Processing. New York: Kluwer Academic Publishers.
, and . 1997. A decision-theoretic generalization of on-line learning and an application to boosting. Journal of Computer and System Sciences 55(1): 119–139.
, , and . In Press. The Elements of Statistical Learning: Prediction, Inference and Data Mining.
1990. Introduction to Statistical Pattern Recognition. San Diego: Academic Press.
, , and 1992. Neural networks and the bias/variance dilemma. Neural Computation 4: 1–48.
1996. The relationship between theory and practice in software engineering. Communications of the ACM 39(11): 11–13.
, and . 1984. Almost sure consistent nonparametric regression from recursive partitioning schemes. Journal of Multivariate Analysis 15: 147–163.
, and . 1994. Competing for the Future. Boston: Harvard Business School Press.
, and 1994. An Introduction to Computational Learning Theory. Cambridge, Mass.: MIT Press.
, and 2000. The Data Webhouse Toolkit: Building the Web-Enabled Data Warehouse. New York: John Wiley & Sons.
, and . 1987. Perceptrons—Expanded Edition: An Introduction to Computational Geometry. Cambridge, Mass.: MIT Press.
1997. Machine Learning. New York: McGraw-Hill.
, and 1999. A survey of methods for scaling up inductive algorithms. Data Mining and Knowledge Discovery 3(2): 131–169.
1993. C4.5: Programs for Machine Learning. San Francisco: Morgan Kaufmann.
1996. Bagging, boosting, and C4.5. Pp. 725–730 in Proceedings of the 13th National Conference on Artificial Intelligence. Cambridge, Mass.: MIT Press and the AAAI Press.
, and . 1995. Pattern Recognition and Neural Networks. New York: Cambridge University Press.
1994. A conservation law for generalization performance. Pp. 259–265 in Machine Learning: Proceedings of the Eleventh International Conference. San Francisco: Morgan Kaufmann.
1990. The strength of weak learnability. Machine Learning 5(2): 197–227.
Page 40
, , and 1996. SPRINT: A scalable parallel classifier for data mining. Pp. 544-555 in Proceedings of the 22nd International Conference on Very Large Databases, T. M. Vijayaraman, A. P. Buchmann, C. Mohan, and N. L. Sarda, eds. San Francisco: Morgan Kaufmann.
, and 1995. Mining generalized association rules. Pp. 407–419 in, U. Dayal, P. M. D. Gray, and S. Nishio, eds . San Francisco: Morgan Kaufmann.
1983. The Visual Display of Quantitative Information. Cheshire, Conn.: Graphics Press.
1984. A theory of the learnable. Communications of the ACM 27: 1134–1142.
Wolpert, D. H., ed. 1995. The relationship between PAC, the statistical physics framework, the Bayesian framework, and the VC framework. The Mathematics of Generalization: The Proceedings of the SFI/CNLS Workshop on Formal Approaches to Supervised Learning. Reading, Mass.: Addison-Wesley.


