
5
PCCL to CCL: Classification Algorithm
INTRODUCTION
The intrinsic difficulty of identifying potentially harmful agents for resource-intensive scrutiny such as the selection of a drinking water contaminant from a preliminary Drinking Water Contaminant Candidate List (PCCL) for inclusion onto a CCL raises the question of what kind of process or method is best suited to this judgment. As discussed in Chapter 2, the sorting of perhaps thousands of PCCL contaminants into two discrete sets, one (the CCL) that probably will undergo research or monitoring of some sort preparatory to an eventual regulatory decision and another much larger set that will not, is an exercise in classification.
The committee considered three broad types of strategies for accomplishing this task: expert judgment, rule-based systems, and prototype classifiers. It is important to note at the outset that there are no sharp boundaries between these three classification strategies since all are based on data to some extent and expert judgments factor into all to some degree. The main differences are the specific mix of data and expert judgment and the extent to which explicit or implicit judgments come together to produce predictable results. This chapter begins with a general overview of classification schemes. It is followed by an example application, framework, and related recommendations for how the U.S. Environmental Protection Agency (EPA) might develop its own prototype classification scheme for use in the creation of future CCLs.
OVERVIEW OF CLASSIFICATION SCHEMES
Expert Judgments
Many decisions (and their associated classifications) are made on the basis of the collective experience of experts. EPA has made extensive and regular use of expert committees (including this National Research Council [NRC] committee), advisory panels, peer review committees, and the like to help its staff (another assemblage of experts) make important policy decisions.
Clearly the composition of any expert group is critical to the outcome, and in recent years there has been a concerted effort within EPA to include a wide spectrum of “stakeholder” opinion in the expertise solicited (e.g., the September 1999 workshop to discuss EPA’s draft CCL Research Plan; AWWARF, 2000). This is a recognition that where a particular expert stands on the issue is often influenced by where he or she sits in the real world (e.g., organizational affiliations). Of course, the outcome of any expert panel may be influenced equally, though to a largely unknown extent, by the absence of persons who could not participate in such meetings. Often the reasons for the absence of a particular perspective are random or accidental, as when schedules or timing do not permit participation at the last minute or result in a substitution for similar reasons.
Yet even when matters external to the question at hand are set aside, the dynamics of expert committees often influences the outcome in crucial ways. Thus, when a particular subject comes up (e.g., at the beginning of a meeting versus the end of a long day), who advocates for or against a position (involving questions of articulateness, seniority, and status) or the juxtaposition or context of agenda items can lead to very different outcomes for reasons unconnected with the content of the issues at hand. The presence or absence of EPA experts and the relative force-fulness of their participation can frequently alter the direction of a discussion in important ways, for example, directing it toward or away from regulatory and policy concerns that may not be apparent or uppermost in the minds of non-agency experts. For the same reasons, discussions of committees comprised solely of EPA staff and consultants are likely to have a different character than those with significant or predominant participation from experts outside the agency.
One strategy to neutralize these adventitious effects is to use a formal
Delphi procedure. The Delphi technique was introduced more than 30 years ago to limit interaction among participants and thereby optimize the quality of decisions (Dalkey, 1969; Linstone and Turoff, 1975). It is one of the formal group judgment methods used to obtain consensus and define disagreements on a specific question (Webler et al., 1991). The method assists in identifying important issues and needs (NRC, 1996, 1999c), integrating data and judgments (NRC, 1988, 1992), informing policy processes (NRC, 1996), structuring deliberations, modifying classification schemes, and ranking priorities (IOM, 1988; NRC, 1992). It may be used to obtain consensus on a time-limited issue or to facilitate longer-term building of common ground on issues. For example, the technique has been used by committees of the Institute of Medicine (IOM, 1992) and is being used at the U.S. Army’s Tooele Chemical Agent Disposal Facility to identify current issues to be included in a stakeholder survey (NRC, 1999c).
Briefly, the Delphi process includes the solicitation and compilation of responses to a specific question. The answers are summarized (typically displayed with the range and mean of all responses) and provided to the participants, with each person invited to reconsider his or her position in light of the compilation. The answers received from this second request are again compiled. This process is repeated until group consensus is obtained (IOM, 1995; NRC, 1988). The technique is traditionally conducted with participants responding remotely and independently of each other. The Delphi method has been implemented with mailed or faxed surveys, e-mail instruments, face-to-face meetings or workshops, and iterations of closed computer networks and group dialogues. The means selected to implement the Delphi process involve trade-offs of cost, time, and commitment of the participants; the impact of influential individuals; confidentiality; duration and intensity of the process; response rate; and clarity of the responses (IOM, 1995).
The Delphi technique may be implemented alone or as part of a multistep process such as Renn and colleague’s three-step procedure discussed in Chapter 2 (Renn et al., 1993), or it may be conducted for separate, dissimilar groups, commonly referred to as a double-Delphi system (NRC, 1992). For example, the same question could be asked of experts and nonexperts convened in two separate but simultaneous panels. The double-Delphi approach may be employed in workshops where the groups use separate computer networks in separate rooms and then share their consensus in reporting-out sessions with all groups present.
Although there has been relatively little evaluation of the effective-
ness of the Delphi process, there are indications that it may not result in decisions much improved over those obtained through less structured processes (IOM, 1992). Its use for selecting candidates for the CCL, therefore, is questionable, but it remains a technique that potentially avoids some of the traditional pitfalls of expert opinion methods of classification.
Rule-Based Methods
Rule-based schemes take as inputs various features or parameters of an object and weigh and combine these features according to an algorithm that is decided upon in advance—usually as a result of some expert judgment. One characteristic of rule-based and expert systems is that their classification strategy is what is often called “Aristotelian,” that is, objects (in this case potential drinking water contaminants) are assigned attributes (e.g., toxicity or solubility), and a set of rules is used to determine which class they are in (Bowker and Star, 1999). They are, thus, expert opinion strategies, in which the opinions are embedded into a fairly rigid algorithm. Their rigidity can be considered both their strength (they are objective and consistent, and they allow for high throughput) and their weakness (they do not easily allow for additional nuanced judgment). The weights and modes of combination used in a rule-based scheme are presumably determined using some preexisting idea or objective of what the scheme intends to capture; however, this is often not done in any systematic or explicit fashion.
The committee’s first report reviewed 10 rule-based ranking schemes whose objective was to use data about chemicals to establish a priority for regulation or attention (NRC, 1999a). As noted in that report, there are no formal schemes that might be considered for prioritizing microbial contaminants. However, EPA and the American Water Works Association Research Foundation have jointly sponsored a series of expert workshops beginning in 1996 to develop a decision process for prioritizing emerging waterborne pathogens. Although the final report of these workshops is nearing completion, it was not available for review at the time this report was written. At the request of EPA, the rule-based systems were evaluated for their potential to help select contaminants (including microorganisms) that are already on a CCL for future action. All of the systems reviewed had at least one shortcoming, but of special concern was the extent to which (often) arbitrary and nonexplicit expert
judgments were intrinsically embodied in what appeared to be objective ranking schemes. For example, various kinds of information (such as chemical persistence, solubility, and toxicity) had to be weighted and combined to produce a single number that allowed an ordinal ranking at the end of the process. The methods of combination (e.g., additive or multiplicative) and the weights given the various factors were all matters of judgment that were in place prior to the input of any data to the ranking system.
In short, the committee concluded that a ranking process that attempts to sort contaminants in a specific order is not appropriate for the selection of drinking water contaminants already on a CCL for regulation, research, or monitoring activities (NRC, 1999a). In the absence of complete information, the output of the prioritization schemes was found to be so uncertain (though this uncertainty is generally not stated) that they are of limited use in making more than preliminary risk management decisions about drinking water contaminants. The committee concluded, however, that they may provide a (semi)quantitative means for preliminarily screening and sorting large numbers of contaminants. Even with this limited use, however, the aforementioned considerations can still become serious issues.
Based on its collective experience, the committee emphasizes that there are some common and often troublesome problems that occur in developing new ranking systems and revising existing ranking systems to suit specific purposes. Many of these problems are similar to those noted earlier as related to the formation and deliberations of expert panels. For example, sometimes an expert group contains individuals who interpret the charge or understand the client’s intended purpose differently, because they bring different disciplines, experiences, and/or motives to the process. A perhaps surprisingly common problem is that many such groups think they have a consensus about the purpose of the system on which they are working, but in fact do not. Even when a goal is clearly stated and mutually understood, group members may envision different types of ranking processes and final products as appropriately meeting the goal. Some group members may believe a simple ranking process is adequate, whereas others believe the process should be somewhat to very complex. The final product may be conceived as quantitative, semiquantitative, or qualitative, with a whole range of outputs from a few to many and from categorical to specific. Some groups have had long debates about what process and form will best fit the purpose, and some have come to near deadlock over how much scoring or ranking is
enough or too much. Others have worked for months before they realized that they were trying to achieve different visions.
Another situation in which groups that are trying to develop ranking schemes have encountered difficulties is where science and policy issues meet. When there is a lack of clarity about which decisions are within the group’s charge and which are better left to policy settings, groups have often gotten focused on narrow scientific issues, either not recognizing that there is a policy issue in the matter or inadvertently believing that there is a scientific “solution” to a policy problem. Groups have also gotten bogged down in specific scientific issues when it has been too difficult to address broader points of disagreement. A report sponsored by the Society of Environmental Toxicology and Chemistry is available that might help reduce such problems because it provides an expert panel consensus framework along with principles and guidelines to promote consistency in the development and use of chemical ranking and scoring systems (Swanson and Socha, 1997).
Prototype Classification Methods
An alternative classification strategy is sometimes referred to as “prototype classification” (Bowker and Star, 1999). This strategy recognizes that in ordinary practice and discourse one does not usually classify objects on the basis of a fixed algorithm, but instead uses criteria based on prior classification of examples or prototypes. The classic example is character recognition of an individual letter in handwriting, most commonly recognized by its similarity to an idealized example rather than by any fixed features such as height-to-width ratios. Prototype classifiers take advantage of the prototyping activity at which humans generally (and intuitively) excel.
Prototype classification schemes usually take the form of neural networks, clustering algorithms, machine learning classifiers, and their hybrids. These methods start with a known classification of prototypes (a “training set”) that embody the kinds of outcomes one might wish to achieve. These prototypes are used to discern an algorithm that maps prototype features or attributes into classification outcomes. The prototype-based algorithm can then be used for classification of new objects. The neural network paradigm is discussed more fully later in this chapter.
Application of a prototype scheme for constructing the CCL would consist of a training set of chemicals, microorganisms, and other types of (potential) drinking water contaminants that would clearly belong on the CCL, such as currently regulated chemicals (if they were not already regulated), and those that clearly do not, such as food additives generally recognized as safe by the U.S. Food and Drug Administration. Each contaminant’s “features” or “attributes” must be extracted and characterized. In this case, these would include parameters such as solubility, various measures of toxicity (quantitative or categorical), and occurrence data, if any. Using this as a training set, the neural network constructs both the mode of combination and the weighting factors that seem best to differentiate between the two categories.
It is important to note that the distinction between Aristotelian and prototype classification strategies is not sharp but is more a matter of emphasis. What in the ranking scheme was done a priori by experts is done instead on the basis of the data that differentiated prototype examples. This a posteriori determination of weights on the basis of features sets these methods apart from rule-based methods, but it should be clear that rule-based methods also depend on the data in a fundamental way. Conversely, prototype schemes emphasize past classification decisions in the construction of a classification algorithm but necessarily involve some expert judgment in determining which features should be used to characterize the prototypes.
The committee notes that prototype strategies have found use in commerce and other sciences, although their use for constructing something like the CCL would be innovative. Keller et al. (1995) have compiled papers describing studies of neural network applications in hazardous waste disposal, environmental monitoring, and reliability analysis. The Federal Aviation Administration has used a neural network for analysis of radiation directed at travelers’ luggage at security check-points; numerous financial analysts have found neural networks to be useful in predicting stock performance and foreign exchange rates; and neural networks have been successful in the prediction of educational performance. These examples are well described by Garson (1998) and the references cited therein.
Which Strategy to Use?
To date, EPA has relied extensively on use of expert judgment and to
a lessor extent on rule-based prioritization schemes to identify and rank drinking water contaminants for regulatory and research activities. It is clear that contaminant-by-contaminant consideration by panels of experts as to whether something should be placed on a CCL is not possible if the entire universe of potential drinking water contaminants is to be considered, as recommended in the committee’s second report (NRC, 1999b) and again in this one. Some efficient screening method is required. Until now, this has usually meant the use of an a priori ranking or classifying system. However, none of the existing schemes for ranking chemicals that the committee previously reviewed (NRC, 1999a) seem able to fulfil this function readily, so one would have to be significantly modified or an entirely new one created. As discussed above, the difficulties are formidable, and there is no obvious reason why a new attempt will solve the problems of previous ones.
Use of a prototype classification strategy and neural network technology would seem to be an innovative new approach. Furthermore, since the objective is one of identification, not regulation per se, the method does not have to withstand regulatory challenge. The PCCL contaminants that it helps identify for inclusion on a CCL can be evaluated in conventional ways by EPA staff and external experts for further justification of why they do or do not belong on the CCL. The recommended system merely identifies and offers likely candidates in a systematic way.
The committee notes that a potentially serious drawback of using this technology is its perceived lack of “transparency” in that the neural network can easily appear as a black box, with little obvious indication of how it is “working.” The importance of transparency in decision-making is discussed extensively in Chapter 2. However, the committee reiterates that transparency is not necessarily synonymous with simplicity. A CCL decision-making process that uses complex classification modeling can be made relatively transparent by emphasizing that the classification is based on prototypes of past regulatory decisions and should, thus, be readily defensible. The difference in this regard from more conventional methods is perhaps misleading. The committee emphasizes that there is little that is “transparent” or easily reproducible about expert judgment, for example. The “black box” in this case is the human brain. Such expert judgments still must be justified for regulatory purposes, but this is no different than what will be required as output from a neural network approach. Ranking systems are only superficially transparent, in that the weights and modes of combination are explicit and open for all to see,
but how the weights are arrived at and the consequences of the modes of combination usually are not. As for the neural network approach, its outputs must also be justified for regulatory purposes.
The committee recommends, therefore, that EPA give careful consideration to and actively experiment with developing a prototype classification approach using neural network or similar methods (in conjunction with expert judgment) for identifying appropriate PCCL candidates for inclusion on the CCL. Further, EPA should use several training sets to gauge the sensitivity of the adopted method. As discussed in Chapter 2, the committee cautions that disputes may occur (e.g., among decision-makers and between decision-makers and the public) regarding the issue of what minimum levels of sensitivity and specificity the approach must have in order to be deemed “adequate.” A robust result over different training sets would clearly lend support for this approach. Additional details of the recommended approach to the development of future CCLs are presented later in this chapter.
ILLUSTRATIVE EXAMPLE OF A PROTOTYPE CLASSIFICATION SCHEME FOR CCL CONTAMINANTS
The remainder of this chapter presents a demonstration of prototype schemes for classifying drinking water contaminants. As previously noted, prototype classification methods require a training data set. For illustrative purposes, the committee constructed a training data set based on contaminants that are presumed worthy of regulatory consideration and contaminants for which the committee can presume regulatory consideration is not necessary. The contaminants included in the training data set were then assigned values for the five health effect and occurrence attributes discussed in Chapter 4. For purposes of mathematical modeling, the report uses the following notation to represent the values of the five attributes for each contaminant: X1 is severity, X2 is potency, X3 is prevalence, X4 is magnitude, and X5 is persistence-mobility. Depending on the category of the contaminant, each contaminant is assigned a value of the binary classification variable, the target (T). The committee uses T=1 for contaminants that are “presumed worthy of regulatory consideration” and T=0 for contaminants “presumed not worthy of regulatory consideration.”
The prototype classification approach does not require that the contaminant attributes be those specified by the committee. One could use
more attributes or fewer. They can be different attributes entirely. Redundant attributes can be integrated prior to processing. For example, in the absence of complete occurrence information one might use Boolean logic to combine prevalence and magnitude or persistence-mobility. Multidimensional attributes could be expanded. For example, the Henry’s law constant and aqueous solubility for chemicals could be used directly rather than combined in a single persistence-mobility score. Also, the attributes can be ordinal or categorical. The objective is to come up with contaminant features that comprehensively encompass the information that determines a regulatory action decision.
The overall objective is to mathematically represent the mapping between the contaminant attributes (the values of Xis) and the target value. This is expressed mathematically as
Y=f({Xi};θ), (5–1)
where Y is the predicted value of the classification variable and θ collectively describes the parameters of the mapping function f(). The most commonly used metric to evaluate the function’s ability to capture the training data set is the mean squared error (mse):
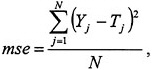
(5–2)
where N is the total number of contaminants in the training data set and the subscript j denotes contaminant j. There is a great deal of choice in selection of the mapping function f(). In this report, the committee presents two alternatives. One is based on a linear function, and the other derives from a neural network architecture. The training data set is used to “calibrate” the mapping function (i.e., to estimate the optimal values of the parameters).
The final step is to use an appropriate criterion to determine the optimal threshold value for Y that separates data into the two classes. One possible criterion is to set the threshold at that value of Y that minimizes the number of objects in the training data set that are misclassified. The resulting mapping can then be used to predict the classification for new contaminants to which values of Xi have been assigned. A predicted
value of Y greater than the threshold would indicate that the contaminant belongs in the T=1 category, and a predicted value of Y less than the threshold would indicate that the contaminant belongs in the T=0 category.
The following sections of this chapter present the details of such an analysis. The committee emphasizes that the classification analysis presented here is not intended to lead to definitive conclusions about specific contaminants. The committee was limited in time and resources; hence the training data set used for this analysis was smaller than ideal and the attribute values are far from certain. Nonetheless, the committee believes that this analysis provides a valid demonstration of the methodology and could serve as a framework for a similar analysis that EPA might conduct to help classify PCCL contaminants for inclusion on the corresponding CCL.
The Training Data Set
The committee constructed a training data set consisting of 80 chemical and microbial contaminants, 63 of which were assigned to the “presumed worthy of regulatory action” category (T=1) and 17 of which were assigned to the “presumed not worthy of regulatory action” category (T=0). The contaminants included in the training data set are listed in Table 5–1. Those in the T=1 category were selected from among currently regulated drinking water contaminants that have enforceable maximum contaminant levels (MCLs; see Chapter 1 for further information). Those in the T=0 category are considered to be safe for human ingestion. Some of these were taken from the list of substances generally recognized as safe (GRAS) by the U.S. Food and Drug Administration. In discussing this illustrative example, the committee reiterates that it was constrained by time and data resources, so the list of contaminants in the T=0 category is relatively small and includes only inorganic and organic chemicals. If the EPA conducts a similar analysis, the committee strongly recommends that it increase the size and types of drinking water contaminants (e.g., radionuclides) included in the training data set to improve predictive capacity.
TABLE 5–1 Contaminants Included in the Training Data Set
Attribute Scoring
For each contaminant in the training data set and for each of the validation test cases, values between 1 and 10 were assigned to each of five health effects and occurrence attributes. The committee used the contaminant attributes and associated scoring metrics and guidance outlined in Chapter 4. It is important to note that the contaminant attribute scores for chemicals and microorganisms in the training data set are considered rough estimates because they were generated in a very rapid fashion using limited sources of health effects and occurrence information. Thus, they are not provided in this report. However, the committee gained a number of important insights by going through this exercise; these insights form the basis for the “lessons learned” section at the end of Chapter 4. For the five regulated contaminants that were used as validation test cases, which are described later in this chapter, details of the attribute scoring scheme used by the committee are explained in the Box 5–1.
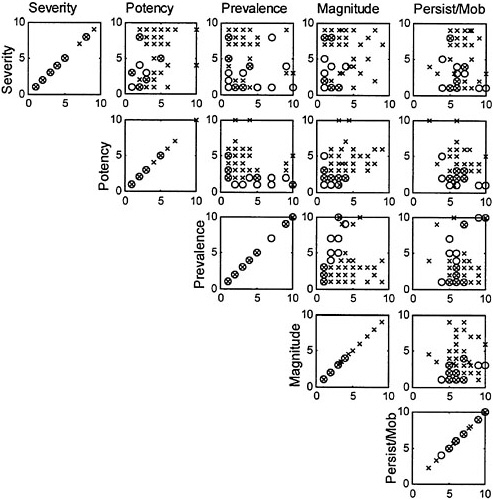
Despite the considerable uncertainty in attribute values in its training data set, the committee made every effort to be as precise and consistent as possible within the time frame allowed and feels that this analysis provides some very valuable insights into the usefulness of the approach. The first component of the analysis is an examination of the extent to which the attribute values are correlated (Figure 5–1). For the training data set constructed by the committee, there is no significant correlation between any of the attributes. This is interesting because the committee had expected at the outset that there would be some redundancy between the prevalence scores and the persistence-mobility scores, reasoning that if something persists in the environment and is mobile in water bodies, it is more likely to be prevalent in drinking water sources. Further, the absence of correlation between the attributes is encouraging because it implies that each contributes unique information that may be useful in the classification of PCCL contaminants. Figure 5–1 also shows that the values of each of the attributes are fairly well distributed over the assigned range of 1 to 10.
EPA will have to collect and organize available data and research for each PCCL contaminant and document the attribute scoring scheme used to help ensure a transparent and defensible process. One way in which EPA is encouraged to expand the training data set and classification algorithm is to allow for the expected case of missing data—that is, to purposefully include in the training data set contaminants for which values
|
BOX 5–1 Attribute Scoring for Validation Test Cases1 Arsenic Arsenic is an element that occurs naturally in rocks, soil, water, air, plants, and animals. It is a metalloid that exhibits both metallic and non-metallic chemical and physical properties and has several valence states. Although arsenic is found in nature to a small extent in its elemental form (0 valence), it most often occurs as inorganic and organic compounds in either the As(III) (+3) or As(V) (+5) valence states (see more below). There are numerous natural sources (e.g., geologic formations and volcanic activity) as well as anthropogenic sources (e.g., manufacture of semiconductors and animal feed additives (EPA, 2000i) of arsenic. The severity score was assigned based on the health end point associated with the potency score. For arsenic, the potency score associated with the lowest observed adverse effect level (LOAEL) for noncancer effects was higher than the potency score based on its cancer end point (EPA, 2000c). The adverse health effects at the LOAEL were hyperpigmentation, keratosis, and possible vascular complications in humans. Since these effects were considered irreversible changes, leading to a treatable disease, arsenic was assigned a severity score of 6. The reference dose (RfD) given in EPA’S Integrated Risk Information System (IRIS) database for arsenic is 3×10⁻⁴ mg/kg (EPA, 2000c). This is based on a no observed adverse effect level (NOAEL) of 8×10⁻⁴ mg/kg in humans. As noted above, the effect at the LOAEL is hyperpigmentation, keratosis, and possible vascular complications in humans. The range of LOAELs for the chemicals that were scored varied from a low of 2×10⁻⁸ mg/kg (dioxin) to a high of 1×10³ mg/kg (di(2-ethylhexyl) adipate). Based on the range of LOAEL values and the LOAEL for arsenic, it was assigned a potency score of 6.
|
|
The data used for obtaining arsenic’s prevalence score were taken from the Endocrine Disrupter Priority-Setting Database (EDPSD) currently being developed for use by EPA (ERG-EPA, 2000). The database contains information from the National Drinking Water Contaminant Occurrence Database (NCOD). Information from the EDPSD-NCOD about the estimated population exposed (127,350) to arsenic and the number of analyses with detectable levels (57) of arsenic was used to assign a prevalence score of 4. The range of population exposed in this particular database for the chemicals scored was 250 to 327,600, and the range in analyses with detectable levels was 0 to 2,970. The EDPSD-NCOD drinking water database also contains information about contaminant concentration. The EDPSD-NCOD reported a weighted average concentration in drinking water for arsenic of 410 µg/L. The weighted average concentration in drinking water for the chemicals scored in this database ranged from a low of 1 µg/L to a high of 8,343 µg/L. A magnitude score of 10 was assigned to arsenic using information on the weighted average concentration and the potency score. Scoring the persistence and mobility of arsenic exemplifies some of the difficulty of this exercise for contaminants exhibiting complex speciation under environmental conditions. Under oxidizing conditions, the stable form of arsenic is pentavalent (arsenate), whereas the trivalent form (arsenite) and various organoarsenic compounds are more prevalent in reducing environments. While arsenite is more mobile than arsenate, chemical or biological oxidation-reduction reactions can convert one form to the other (Nriagu, 1994). Since arsenate adsorbs rather strongly to soils, the overall mobility of arsenic was scored rather low. However, the overall persistence of arsenic was scored as high because most mechanism for detoxifying arsenic appears to be reversible. Thus, the resulting score for the persistence-mobility attribute was 6. Nitrate Inorganic nitrates often enter drinking water supplies through runoff from fertilizer use, leaching from septic tanks, sewage, and erosion of natural deposits (EPA, 2000a). The severity score for nitrate was based on the health effect associated with the potency score, (i.e., methemoglobinemia; see Chapter 4 for further information). Since this health effect is associated with significant, but reversible functional changes, a severity score of 5 was assigned to nitrate. |
|
The RfD for nitrate given in EPA’s IRIS database is 1.6 mg/kg (EPA, 2000d). This is based on a NOAEL of 1.6 mg/kg for early clinical signs of methemoglobinemia in excess of 10 percent in 0- to 3-month-old infants. A potency score of 4 was assigned for nitrate and was based on its LOAEL of 1.6 mg/kg and the range of LOAEL values. The scoring for nitrates was based on an effect in a vulnerable population that contains many individuals, and the committee considered this reasonable; this is also consistent with EPA’s current approach for evaluating nitrates. The data used to estimate nitrate’s prevalence score were taken from EDPSD-NCOD (ERG-EPA, 2000). The estimated population exposed to nitrate was given as 118,800 with the number of analyses with detectable concentrations given as 55. The range of information about population exposed and number of detects for all of the chemicals considered, along with this same information for nitrate, resulted in a prevalence score of 3. The EDPSD-NCOD reported a weighted average concentration for nitrate in drinking water of 821 µg/L. This average concentration along with potency information was used to assign a magnitude score for nitrate of 8. Many otherwise useful databases (e.g., the Hazardous Substances Database in TOXNET; NLM, 2000) are inconveniently organized for the purposes of this exercise since they contain no entry for the free aqueous nitrate anion—only entries for the various salts of nitrate (KNO3, etc.). Most of these salts are very soluble, and since sorption of nitrate to most mineral surfaces is not especially strong, it was considered highly mobile. The persistence of nitrate varies greatly with the microbiology of the local environment because nitrate reduction can be quite rapid under anaerobic conditions but is usually negligible under aerobic conditions. This led the committee to score nitrate’s persistence as intermediate. Combined with the highest possible score for mobility, this resulted in a combined persistence-mobility score of 8 for nitrate. Atrazine Atrazine is a herbicide that often enters drinking water supplies through runoff from its use in agriculture. The severity score was based on the health effects associated with the potency score for atrazine (degradation products were not considered) (i.e., a decrease in body weight gain compared to controls, cardiac toxicity, moderate to severe dilation of |
|
the right atrium). Since the cardiac toxicity and moderate to severe dilation of the right atrium are a single organ system pathology and function loss, atrazine was assigned a severity score of 7 (EPA, 2000e). The RfD for atrazine is 3.5×10⁻² mg/kg and is based on a NOAEL of 3.5 mg/kg in rats from a two-year feeding study (EPA, 2000e). The LOAEL from this study was 25 mg/kg for a decrease in body weight gain. A one-year feeding study in dogs was used as support for this RfD. The second study had a NOAEL of 34 mg/kg and a LOAEL of 4.97 mg/kg, with the adverse effect being cardiac toxicity and moderate to severe dilation of the right atrium. Atrazine’s potency score was based on its LOAEL of 25 mg/kg. The range of LOAELs for the chemicals that were scored varied from a low of 2×10⁻⁸ mg/kg (dioxin) to a high of 1×10³ mg/kg (di(2-ethylhexyl) adipate). Based on these LOAEL values, atrazine was assigned a potency score of 3. The data used for obtaining atrazine’s prevalence score were taken from EDPSD-NCOD (ERG/EPA, 2000). Information from EDSPD-NCOD about the estimated population exposed (223,550) to atrazine and the number of analyses with detectable levels (24) of atrazine was used to assign a prevalence score for atrazine of 3. The range for population exposed in this particular database for the chemicals scored was 250 to 327,600, and the range in analyses with detectable levels was 0 to 2,970. The EDPSD-NCOD reported a weighted average concentration value for atrazine of 1 µg/L. This information along with potency data was used to assign a magnitude score for atrazine of 2. The persistence and mobility of atrazine and other triazine herbicides have been studied and reviewed extensively (Ballantine and McFarland, 1998; NLM, 2000). Atrazine is a nonionogenic but moderately polar organic molecule, so it has a moderate solubility, relatively low volatility, and moderately high tendency to adsorb to soils. Atrazine is subject to photodegradation and biodegradation where conditions are favorable. Reported half-lives for biodegradation of atrazine in soils are typically on the order of months, whereas half-lives in groundwater are estimated to be in years. The moderate mobility and substantial persistence of atrazine resulted in an overall persistence-mobility score of 7. Tetrachloroethylene (PCE) Tetrachloroethylene is a solvent that can reach drinking water supplies through industrial discharges from factories and dry cleaners (EPA, |
|
2000a). PCE causes liver tumors in mice when administered by gavage (ATSDR, 1997). The oral cancer potency factor (CPF) given by EPA’s Region III for PCE is 5.2×10⁻² mg/kg/day (EPA, 1999i). Because PCE causes cancer, its severity score was 9. The potency score for PCE was based on its CPF (EPA, 1999i). The range in oral CPFs for the chemicals that were scored varied from 1.56× 10+5 mg/kg/day (dioxin) to 1.2×10⁻³ mg/kg/day (di(2-ethylhexyl) adipate). Based on the CPFs, the potency score for PCE was assigned a value of 3. The data used for obtaining PCE’s prevalence score were from EDPSD-NCOD (ERG-EPA, 2000). The estimated population exposed to PCE was given as 227,600, and the number of analyses with detectable levels was given as 124. Using this information along with information from the other chemicals scored resulted in a prevalence score for PCE of 10. The EDPSD-NCOD gave a weighted average concentration for PCE of 4 µg/L. This information along with potency information was used to assign a magnitude score for PCE of 4. The environmental fate of chlorinated ethenes has been reviewed from many perspectives (NLM, 2000; Pankow and Cherry, 1996). PCE is regarded as moderately mobile in natural waters, even though its solubility in water is fairly low, because retardation due to adsorption is also relatively low. In general, PCE is regarded as persistent, especially under aerobic conditions, although both aerobic and anaerobic pathways of PCE biodegradation are well documented. Combining a moderately high persistence with moderately mobility resulted in a combined persistence-mobility score of 7. Giardia Lamblia Giardia lamblia is a protozoan parasite that may reach drinking water supplies through human and animal fecal waste. It induces mild to severe diarrhea over a moderately prolonged (one-to-two week) period, with most cases either self-limiting or amenable to therapy (Steiner et al., 1997). There do not appear to have been significant reports of chronic sequelae.2 Thus, this organism was assigned a severity score of 6. |
|
There are only two pathogens other than G. lamblia for which regulations are set (or proposed): Cryptosporidium parvum and enteric viruses. The median infectious dose (N50) of rotavirus is 6.2 plaque-forming units (Regli et al., 1991), while that for C. parvum is 165 oocysts (Haas et al., 1996). The median infectious dose of G. lamblia is 34 cysts (Rose et al., 1991). Thus, the potency of Giardia is intermediate between C. parvum and rotavirus. To obtain a percentile, examination of a broader spectrum of human pathogens for which dose-response assessments have been made must be undertaken. The table below, adapted from Haas et al. (1999), shows that G. lamblia is the 3rd most potent of 11 organisms or classes of organisms. Assigning the most infectious (adenovirus 4) a score of 10 and the least infectious (nonenterohemorrhagic Escherichia coli) a score of 1, the potency score based on rank order would be 8.18, rounded to 8, for G. lamblia. Based on measurements of G. lamblia in source waters (LeChevallier et al., 1991, 1997; Rose et al., 1991) a spatial prevalence of 50–75 percent (accounting for both groundwater and surface water) and a temporal prevalence of 75–90 percent appear to be reasonable estimates. Thus, a prevalence value of 9 was assigned. To determine the score for magnitude first involved ranking the occurrence of Giardia versus other waterborne pathogens. In comparison with the two other regulated microorganisms (enteric viruses and Cryptosporidium), the median levels of Giardia in source waters are higher.3 Thus, it is considered to be in the ninth decile for concentration. The score, noted above for potency, is 8. The overall score for magnitude would be The two applicable subattributes for the evaluation of persistence-mobility of G. lamblia are amplification and stability. Since G. lamblia is an obligate parasite, there is no reproduction under environmental conditions and the score for this property is 0 (out of 3). Studies on persistence of the cyst in natural waters (DeRegnier et al., 1989) indicate a survival time in excess of weeks; thus, the score on the property of stability is 3 (out of 3). The average of these two scores, expressed on a scale of 10, is 5, which is taken as the score for the overall persistence-mobility attribute. |
 rounded to 9.
of some of the attributes are unknown and develop a scheme that allows prediction for contaminants for which some of the attributes are unknown. Statistical schemes have been developed to deal with missing and incomplete data (e.g., Little and Rubin, 1987; Weiss and Kulikowski, 1990). Some of the general techniques include filling in the missing values with the means of values for other cases in the same class, incorporating Boolean logic structures that allow for redundancy in expression of an attribute (i.e., A or B), and using smoothing methods to interpolate values based on assumed underlying data structures. There are, of course, risks in including incompletely characterized contaminants in the training data set because biases may be introduced in the mathematical treatment of missing values. However, these risks can be outweighed by the benefits of having a very large, information-rich training data set.
Prototype Classification Functions
The simplest function to represent the mapping between contaminant attributes and the binary classification variable is a linear model:
Y=w0+w1X1+w2X2+w3X3+w4X4+w5X5, (5–3)
where wi is the weight for attribute i. The optimal parameters (i.e., weights) are estimated, for example, by minimizing the mse (Equation 5–2). The linear model is an attractive alternative because the mapping function is readily understandable and the values of the weights are easy to interpret. Furthermore, calibrating a linear classification model can be done with very simple statistical procedures that are widely available. The disadvantage of the linear model is that its performance is poor if the training data are not “linearly separable,” as explained later in this chapter. To achieve good performance with linearly nonseparable data, one must use a model that is capable of nonlinear dependencies.
Neural networks provide the flexibility to capture linear as well as nonlinear dependencies (Hornik et al., 1989). Neural networks were originally conceived in the 1960s and were more formally developed in the 1980s. Their use has become widespread in the last decade, and a number of excellent textbooks have been written on the applications of neural networks in a variety of fields (Garson, 1998; Weiss and Kulikowski, 1990; Zupan and Gasteiger, 1993). Widely cited introductory articles include Bailey and Thompson (1990) and Hinton (1992).
A neural network is a mathematical representation of a network of biological neurons. Input data are fed into the network, and output from the network is computed based on the architecture of the network and the operative mathematical functions. The simplest neural network is a single neuron with a vector input and single output (Figure 5–2). In this network, the sum of the weighted inputs is passed through a transfer function f(). If the transfer function is linear, then this neural network is mathematically equivalent to the linear classifier in Equation 5–3. This neuron has a bias that is equivalent to w0, the intercept in Equation 5–3. More complex neural networks can be constructed by having multiple layers of neurons, multiple neurons within a layer, complex connectivity between the layers, and nonlinear transfer functions mapping the neuron input to the output. For example, a multilayer neural network has “hidden” layers, which are additional layers of neurons between the input and output layers.
One of the attractive advantages of using a neural network is that it is not necessary to specify a priori the mathematical relationship between input and output data. One chooses the architecture, which specifies the number of neurons and their organization, and the transfer functions op-
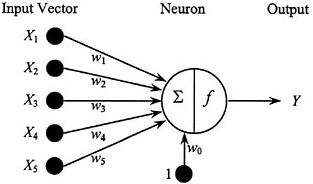
FIGURE 5–2 Single-neuron model with a vector input and single output.
perative at each information node. The more elaborate the architecture, the more flexible is the model in capturing the functionalities between input and output and the possibly numerous interactions in variables. It is precisely this advantage that leads to the primary disadvantage of using neural networks—the resulting classification algorithm is not readily extracted, and there is a necessary loss in transparency in exactly how the input variables determine the classification output.
A cautionary statement is appropriate at this point. In all prototype classification schemes, the user should be aware of the danger in overfitting the training data. Overfitting occurs when a modeler has undue confidence in the precision of the training data set and is overzealous in finding an algorithm that produces no classification error in representing these data. This can impose “false structure” on the mapping, which does not truly capture the functional dependencies. The danger of overfitting is especially present in neural network modeling because of the tremendous flexibility in the underlying mathematical relationships. The result is a sacrifice of generalization (predictive) ability. This issue has been discussed extensively in the literature of statistical learning theory and information theory (Vapnik, 1995).
The following sections present classification results for the committee’s illustrative example training data set. The committee presents results for both a linear classification model and a neural network. The
classification algorithms were developed using Matlab and the Matlab Neural Network Toolbox (Mathworks Inc., Natick, Massachusetts). The Matlab computer codes used for classification, error analysis, and prediction are included in Appendix B.
Classification Results Using a Linear Classifier
Using the model in Equation 5–3 and the training data set, a linear regression produced a mean squared error of 0.094. The resulting weights are listed in Table 5–2. The most important and statistically significant indicators are severity, potency, and magnitude. This implies that these are the metrics that have, in the past, determined whether a contaminant is appropriate for regulatory action. Although in principle prevalence and persistence-mobility are important indicators of human health hazard, the analysis did not show this. Either these factors have not been given significant weight in past regulatory decision making for drinking water safety or one’s ability to estimate these attribute scores accurately given available data, is poor. This finding may change when EPA constructs a formal training data set, but it illustrates the type of conclusion that can be derived.
The resulting distributions of Yi values for each of the two types of contaminants in the training data set are shown in Figure 5–3. Clearly, there is not a perfect separation between the two categories, which indicates that these data are not linearly separable. However, there is a clear
TABLE 5–2 Linear Regression Results for Illustrative Example
|
Attribute |
Weight |
Regression Estimate |
Significantly Different from Zero at the 95% Confidence Level? |
|
— |
w0 |
0.018 |
No |
|
Severity |
w1 |
0.043 |
Yes |
|
Potency |
w2 |
0.062 |
Yes |
|
Prevalence |
w3 |
−0.029 |
No |
|
Magnitude |
w4 |
0.044 |
Yes |
|
Persistence-Mobility |
w5 |
0.040 |
No |
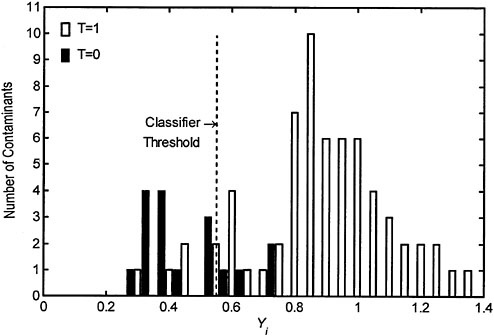
FIGURE 5–3 Histogram of Yi values for the training data set using the linear classifier.
trend that contaminants in the T=0 category tend to have smaller predicted values of Yi. This result alone is interesting because it serves to verify that past regulatory decisions do indeed separate contaminants in a manner consistent with the factors that the committee believes to be important indicators of human health risk.
The next step is the determination of an appropriate threshold value that separates the objects into the two categories. The committee decided to optimize the value of the threshold by minimizing the total number of misclassified contaminants. Figure 5–4 is a plot of the number of misclassified contaminants as a function of the threshold value. Because two values of the threshold (0.4 and 0.55), produce a minimum in the total number of misclassified contaminants, the committee employed a secondary criterion that minimized the sum of the percent errors for each of the categories (see Figure 5–5). A threshold value of 0.55 produces a smaller percent error in both categories, so this was chosen as the optimal threshold.
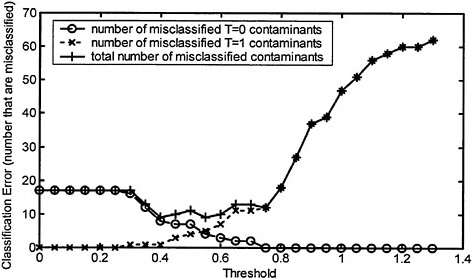
FIGURE 5–4 Classification error as a function of threshold value, in which classification error is defined as the number of misclassified contaminants linear classifier).
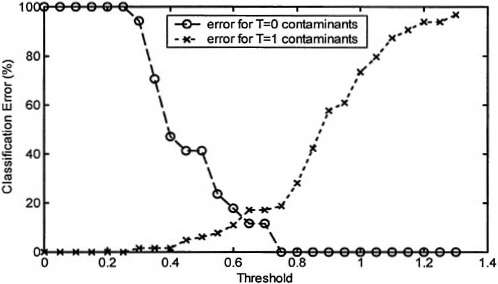
FIGURE 5–5 Classification error as a function of threshold value, in which classification error is defined as the percentage of the number of contaminants within a category that are misclassified (linear classifier).
The ability of the classification scheme to separate the training data set is one way to estimate the classification error that is expected when used for prediction. With a threshold value of 0.55, the error in misclassifying T=1 contaminants is 8 percent (5 out of 63) and the error in misclassifying T=0 contaminants is 24 percent (4 out of 17). The larger error in misclassifying T=0 contaminants reflects the fact that this portion of the training data set was smaller, so there is less confidence that the contaminants used are representative of the population of contaminants in this category. These errors can be interpreted as follows: If this classification algorithm is used for prediction, 92 percent of the time a contaminant that should be on the CCL will be classified correctly. This represents the “sensitivity” of the classification. The other characteristic is the “specificity,” which is that 76 percent of the time a contaminant that should not be on the CCL will be classified correctly. That is, the probability of a false negative is 8 percent and the probability of a false positive is 24 percent. This estimation of errors is essentially a demonstration of what the committee discussed in Appendix A of its first report (NRC, 1999a).
Classification Results Using a Neural Network Classifier
The neural network used for this classification problem has two layers connected in a feed-forward configuration (Figure 5–6). The first is a hidden layer containing two nodes (neurons). A hyperbolic tangent sigmoidal function was chosen as the transfer function for each node in this layer. This transfer function is one of several commonly used nonlinear functions. The second is the output layer with a single node and a linear transfer function. All nodes have biases. Other possible network architectures could have been used for this problem (e.g., additional nodes in the hidden layer or different transfer functions). The committee chose this architecture because it is one of the simplest but has sufficient flexibility to capture nonlinear dependencies.
The training algorithm used to calibrate the neural network was a conjugate gradient method that constitutes a family of efficient search algorithms. This search method converges much faster than the simpler gradient descent methods, but as is true with all nonlinear optimization problems, care must be taken to ensure robustness in the solution by running several training sessions with different initial conditions. Network
performance is measured according to the minimum of mse (Equation 5–2).
Using the committee’s training data set, the resulting mean squared error was 0.018, which is considerably smaller than that achieved using the linear classifier. This clearly demonstrates the improvement in fitting capabilities of a neural network model over a linear model. The classification results using the neural network model are shown in Figure 5–7. The enhanced ability of the neural network classifier to separate the training data is clearly seen by comparing the histograms in Figures 5–3 and 5–7. The improved performance of the neural network is rather remarkable considering that the neural network architecture (Figure 5–6) is one of the simplest possible for this problem. Classification error analysis indicated that the optimum threshold value of Y for the neural network classifier is 0.55, which coincidentally is the same as the resulting optimal threshold for the linear classifier. The predicted classification error for the neural network classifier is 3 percent for false negatives (2 out of 63). Because there were no misclassifications of the T=0 contaminants, the false-positive rate is estimated to be near zero.
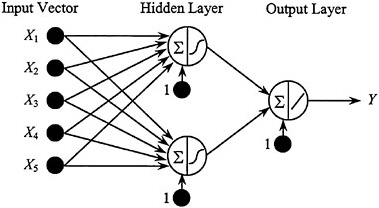
FIGURE 5–6 Multilayer neural network used for contaminant classification. Weights are not shown, for simplicity.
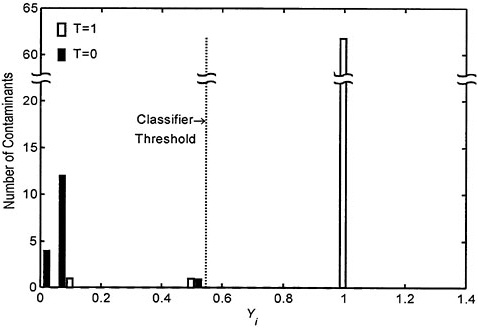
FIGURE 5–7 Histogram of Yi values for the training data set using the neural network classifier.
For the linear classifier it was possible to examine the values of the weights and their statistical significance to determine the relative importance of the different attributes in determining the classification outcome. Because of the greater complexity of the neural network model, there is less transparency in the functional mapping. In most computer programs, the weights can be examined, but it is very difficult to extrapolate these weights mentally to readily understandable rules. For example, in this neural network, there are 10 weights in the first layer, 2 weights in the second layer, and a total of 3 bias weights. Because these parameters relate to cross-products and nonlinear functions of the attributes, it is not immediately obvious what the values mean. One way to probe the importance of various attributes in a neural network is to leave out certain attributes in the training data set and examine the effect on the classification of the training data. Indeed, this practice is discussed in Chapter 2 as a means to enhance the transparency of the approach, and the committee recommends that EPA conduct such a sensitivity analysis on any classification model it develops and intends to use to assist in the creation of future CCLs.
DEMONSTRATED USE OF THE TRAINED CLASSIFIER
Examination of Misclassified Contaminants
Misclassification of contaminants in the training data set can be interpreted in three ways: Either (1) the training data (i.e., the attribute scores) do not capture the information that determines regulatory action for drinking water contaminants; (2) the model relating the input to the output does not adequately capture the process by which this information is used in regulatory decision-making; or (3) the target values are wrong, implying that some of the regulatory decisions made in the past are inconsistent with regulatory decisions for the bulk of drinking water contaminants. If one operates on the presumption that the training data are accurate, precise, and complete, then classification errors can be reduced by exploring modeling alternatives. That is precisely what was done in the analysis in this chapter. A large number of classification errors resulted from the linear model, so a neural network model was used that greatly reduced classification error. One can continue to try to eliminate all classification errors by using more and more elaborate neural networks (or other classification models such as support vector machines, cluster algorithms, radial basis functions). However, as mentioned previously, this endeavor may lead the analyst down the potentially dangerous path of overfitting the data. Thus, an analyst must question whether persistent errors are indicative of true classification errors.
If one operates on the assumption that the attribute scores should combine in a linear fashion to determine classification output, then some insights can be gained by examining which of the contaminants in the training data set were misclassified using the linear classifier. These are listed in Table 5–3. Total coliforms and heterotrophic plate count (HPC) are misclassified because these contaminants are not inherently hazardous, but rather are indicators of the potential presence of hazardous microorganisms. For this reason, the committee believes it is appropriate for these two contaminants to fall below the threshold. The linear classifier also misclassified toluene, o-dichlorobenzene, and trans-1,2-dichloroethylene, which are currently regulated chemicals. These chemicals score relatively low on severity and potency because their health effects are smaller than those of other regulated drinking water contaminants that are of greater concern possibly because of their carcinogenic potential or their potential to cause health effects at low
TABLE 5–3 Contaminants in the Training Data Set That Were Misclassified Using the Linear Classifier
|
Misclassified T=1 Contaminants |
Yi |
Misclassified T=0 Contaminants |
Yi |
|
o-Dichlorobenzene |
0.47 |
Ethanol |
0.57 |
|
trans-1,2-Dichloroethylene |
0.54 |
Folic acid |
0.72 |
|
Toluene |
0.43 |
Olestra |
0.63 |
|
HPC |
0.28 |
Saccharin |
0.70 |
|
Total coliforms |
0.42 |
|
|
concentrations. Toluene is a chemical that is generally known to be rather prevalent, but the occurrence data available were insufficient to represent this fact. In general, the data used to score prevalence for all contaminants in the training data set were found to be lacking in several respects (see Chapter 4). These misclassifications may be indicative of a paucity of good information on which to base occurrence metrics. Of the T=0 contaminants that were misclassified in the linear classifier, the committee notes that ethanol, folic acid, and saccharin have potentially severe health impacts, and Olestra has significant potential for persistence and mobility in the environment. Like other substances in the T=0 category, however, these are substances that many people purposefully and regularly ingest.
Rather than placing emphasis on the misclassifications obtained using the linear classifier, one can operate on the assumption that the underlying process by which the attribute scores determine classification output is complex and requires nonlinear functionalities to represent it mathematically. This makes the case for the use of neural networks rather than linear classifiers. The misclassified contaminants for the neural network classifier are listed in Table 5–4. The neural network classifier had a much smaller number of misclassified contaminants, indicating that it was able to capture the data mapping process mathematically. It is interesting to note that the misclassified contaminants in this case are not a subset of those misclassified in the linear classification. Here, ethylbenzene has been misclassified, whereas it had not been misclassified in the linear classification. This indicates the strong underlying nonlinearity that is being modeled by the neural network.
TABLE 5–4 Contaminants in the Training Data Set That Were Misclassified Using the Neural Network Classifier
|
Misclassified T=1 Contaminants |
Yi |
Misclassified T=0 Contaminants |
|
Ethylbenzene |
0.50 |
— |
|
HPC |
0.08 |
— |
Validation Test Cases
The contaminants in the training data set in the T=1 category did not include all those that have MCLs. Five such chemical and microbial contaminants were withheld as validation test cases to examine the predictive accuracy of the classification algorithm as required in the second phase of study (see Preface to this report). Details of how health effect and occurrence attributes were scored for these regulated contaminants are discussed earlier in this chapter. The predicted values of Yi for the five validation test cases are listed in Table 5–5. All contaminants are correctly classified as being in the T=1 category because their Yi values are well above the thresholds. These correct predictions, albeit few in number, provide additional supporting evidence of the validity of the classification algorithm. EPA should make every effort to increase the number of both types of validation test cases (especially for T=0 contaminants) to assess more thoroughly the predictive accuracy of any classification algorithm developed for use in the creation of future CCLs.
Prediction for Interesting Test Cases
The committee selected five potential drinking water contaminants for which data were available that may be of interest in the future (Table 5–6). Two of these, aluminum and methyl-t-butyl ether (MTBE), are currently included on the 1998 CCL (EPA, 1998b). The linear classifier predicts that all five should be considered for regulatory action. However, the neural network classifier predicts that silver, chloroform, aspirin, and MTBE should be placed on the CCL, but aluminum should not (based on data available at this time). The committee emphasizes that these results do not indicate a recommendation that any of these con-
TABLE 5–5 Classification Prediction Accuracy for Validation Test Cases
|
Validation Test Cases |
Predicted Yi Using Linear Classifier (Threshold = 0.55) |
Predicted Yi Using Neural Network (Threshold = 0.55) |
|
Arsenic |
1.2 |
1.00 |
|
Nitrate |
1.1 |
1.00 |
|
Atrazine |
0.79 |
1.00 |
|
Tetrachloroethylene |
0.76 |
0.99 |
|
Giardia lamblia |
1.1 |
1.00 |
TABLE 5–6 Classification Prediction for Interesting Test Cases
|
Interesting Cases |
Predicted Yi Using Linear Classifier (Threshold=0.55) |
Predicted Yi Using Neural Network (Threshold=0.55) |
|
Aluminum |
0.61 |
0.08 |
|
Silver |
1.2 |
1.00 |
|
Chloroform |
0.8 |
1.00 |
|
Aspirin |
1.0 |
1.00 |
|
MTBE |
0.98 |
1.00 |
taminants be placed on a future CCL or removed from the 1998 CCL. Rather, the results are intended to demonstrate how the EPA can develop and use a classification scheme to help select PCCL contaminants for inclusion on the CCL. The committee also believes that this demonstrates the sensitivity of the results to choices made in constructing the classification algorithm.
SUMMARY: CONCLUSIONS AND RECOMMENDATIONS
The purpose of this analysis was to demonstrate how existing contaminant data and past regulatory decisions could be used to develop a prototype classification algorithm to determine, in conjunction with expert judgment, whether a particular drinking water contaminant is of regulatory concern or not. More specifically, the committee has demon-
strated a prototype classification approach that must first be trained (calibrated) using a training data set containing prototype contaminants and can then be used in conjunction with expert judgment to predict whether a new (PCCL) contaminant should be placed on the CCL or not. The use of the majority of currently regulated drinking water contaminants in the training data set can be described simply as “making decisions that are consistent with and build upon what has been done in the past.” If this is deemed defensible, the prototype classification approach can be regarded as valid. It is important to realize that this approach is then constrained by the data (i.e., past regulatory decisions).
What has been presented in this chapter is a framework and demonstration of how EPA might develop its own prototype classification scheme for use in the creation of future CCLs. In this regard, the committee makes the following recommendations:
-
A linear model and a neural network are discussed and demonstrated for potential use in a prototype classification scheme. Although the neural network performed better than the linear model (with respect to minimizing the number of misclassified contaminants), at this time the committee cannot make a firm recommendation as to which model EPA should use because of the aforementioned uncertainties in the training data set. Thus, the committee recommends that EPA explore alternative model formulations and be cognizant of the dangers of overfitting and loss of generalization.
-
To adopt and implement the recommended approach for the creation of future CCLs, EPA will have to employ or work with persons knowledgeable of prototype classification methods and devote appreciable time and resources to develop and maintain a comprehensive training data set. In this regard, the committee recommends strongly that EPA greatly increase the size of the training data set that is used illustratively in this chapter to improve predictive capacity. One way in which EPA can expand the training data set and classification algorithm is to allow for the expected case of missing data—that is, to purposefully include in the training data set contaminants for which values of some of the attributes are unknown and develop a scheme that allows prediction of contaminants for which some of the attributes are unknown.
-
EPA will also have to accurately and consistently assign attribute scores for all contaminants under consideration. To do this, it will have to collect and organize available data and research for each PCCL contaminant and document the attribute scoring scheme used to help ensure
-
a transparent and defensible process, the importance of which is discussed in Chapter 2. As recommended in Chapter 3, the creation of a consolidated database that would provide a consistent mechanism for recording and retrieving information on the contaminants under consideration would be of benefit.
-
EPA will also have to withhold contaminants from inclusion in the training data set to serve as validation test cases that can assess the predictive accuracy of any classification algorithm developed. While the committee was able to withhold five contaminants presumed worthy of regulatory consideration (T=1) for this purpose (see Table 5–5), it had insufficient numbers of contaminants presumed not worthy of regulatory consideration (T=0) to similarly withhold. All withheld validation contaminants were classified correctly as belonging in the T=1 category and such results provide (albeit limited) additional support for the validity of the classification algorithm approach. EPA should make every effort to increase the number of both types of validation test cases (especially for T=0 contaminants) to assess more thoroughly the predictive accuracy of any classification algorithm developed for use in the creation of future CCLs.
-
If neural networks are used for prototype classification, the transparency in understanding which contaminant attributes determine the category of a contaminant will be less than that of a linear model or a more traditional rule-based scheme. However, if one acknowledges that the underlying process that maps attributes into categorical outcomes is very complex, then there is little hope that an accurate rule-based classification scheme can be constructed. The fact that the nonlinear neural network performed better than the linear classifier is a strong indicator that the underlying mapping process is complex, and it would be a difficult task for a panel of experts to accurately specify the rules and conditions of this mapping. Furthermore, the loss in transparency in using a neural network is not inherent, but rather derives from the difficulty in elucidating the mapping.
-
The underlying mapping in a neural network classifier can be examined just as one would conduct experiments to probe a physical system in a laboratory. Through numerical experimentation, one can probe a neural network to determine the sensitivity of the output to various changes in input data. Although a sensitivity analysis was not conducted because of time constraints, the committee recommends that EPA should use several training data sets to gauge the sensitivity of the method as part of its analysis and documentation if a classification ap-
-
proach is ultimately adopted and used to help create future CCLs.
-
Finally, EPA should realize that the committee is recommending a prototype classification scheme to be used in conjunction with expert judgment for the future selection of PCCL contaminants for inclusion on a CCL. Thus, transparency is less crucial (though no less desired) at this juncture than when selecting contaminants from the CCL for regulatory activities as discussed in the committee’s first report (NRC, 1999a).


