
Page 21
2
Overview of NASA Data Sets
As a first step in assessing data sets with relevance to research in high latitudes, it is important to describe the broad context—that is, to introduce NASA's Earth Science Enterprise (ESE) and to provide examples to illustrate the great diversity of available and expected products. The ESE, formerly Mission to Planet Earth, uses space-, ground- and aircraft-based systems to measure relevant attributes of the Earth system and quantifies responses to natural and human-induced changes. The ESE also seeks to improve predictive capabilities for climate, weather, global air quality, and natural hazards. To accomplish these goals, the program seeks to describe how Earth-system components and their interactions have evolved, how they function, and how they may be expected to continue to evolve on all relevant time scales. ESE is driven by recognition that the planetary environment has natural variability and that humans are no longer passive participants in the evolution of the Earth system; its research activities are important parts of the U.S. Global Change Research Program.
The fundamental question that ESE addresses is: “How is the Earth changing and what are the consequences for life on Earth?” Key research topics fall largely into three categories: forcings, responses, and the processes that link the two and provide feedback. The science strategy is guided by five fundamental questions, each of which can be addressed only by a range of cross-disciplinary research programs (NASA, 2000). These questions are discussed in detail in Chapter 3.
Many ESE research activities have a polar component. This chapter
Page 22
describes examples of some of the polar-specific activities funded by NASA, including POLar Exchange at the Sea Surface (POLES); RADARSAT Geophysical Processing System (RGPS) and the RADARSAT Antarctic Mapping Project; Snow and Hydrology Group; Program for Arctic Regional Climate Assessment (PARCA); and Polar Pathfinder products. These products, together with the detailed listings of data sets held at the National Snow and Ice Data Center (NSIDC) and the Alaska Synthetic Aperture Radar Facility (ASF), represent the data sets generally thought of as the “polar” data sets.
NASA's polar-relevant data holdings, however, are considerably larger than this list suggests. It is notable that in the survey discussed later, respondents frequently asked for atmospheric and cloud-radiation data sets, although most of the respondents study sea ice, snow, and ice sheets. Since such data sets exist elsewhere in NASA, this suggests the need for the polar parts of the data system to provide links and directions to all the polar-relevant data sets held by NASA, along with guidance about quality and usage (preferably by reference to the literature). A similar situation exists regarding international data sets and data sets held by other U.S. agencies, many of which NASA also archives.
EXAMPLES OF NASA-SUPPORTED ACTIVITIES
Polar Exchange at the Sea Surface
A component of NASA's Earth Observing System (EOS), POLES is an interdisciplinary project investigating the exchange of mass and energy at the polar air-ice-ocean interface. POLES is located at the Polar Science Center, Applied Physics Laboratory, University of Washington. Scientists from eight disciplines and four institutions have joined together to use the rich array of satellite data collected from polar regions. The data have been collected using a variety of satellite-based sensors, including passive microwave radiometers, the TIROS-N Operational Vertical Sounder (TOVS), Advanced Very High Resolution Radiometer (AVHRR), and synthetic aperture radar (SAR).
Historically, satellite data have been used for short-term weather forecasts. POLES scientists, however, are using the data to build an understanding of long-term patterns in the fluxes of heat, moisture, and momentum across the surface of the polar oceans. Their goal is to assimilate satellite (and some buoy) observations into polar ocean-atmosphere models that not only refine the treatment of surface exchange processes but also quantify the roles of horizontal transports, oceanic mixing, and deep convection. With better data use, researchers can move beyond
Page 23
present climatological descriptions and document interannual variability. For more information see < http://psc.apl.washington.edu/poles/>.
RADARSAT Geophysical Processing System Products
Polar products of the RGPS measure such variables as sea-ice motion and the thickness distribution of thin ice using SAR archived at the ASF. The scientific goal of the RGPS is to provide data sets that improve the current understanding of the impact of sea ice on climate. Interactions between sea ice, the ocean, and the atmosphere in the polar regions strongly affect the Earth's climate. Sea ice growth, movement, and decay affect energy and mass balance of the polar ocean system. The surface heat and brine fluxes associated with sea ice growth contribute significantly to convection of the ocean and thermohaline circulation. Snow-covered sea ice reflects most of the incident solar radiation back into space, while fresh water fluxes associated with melting ice retard vertical mixing and thus serve as stabilizing elements in the circulation of the North Atlantic waters. Processes along the ice margin and coastlines are important in water-mass formation, development of upwelling, convection, sediment transport, and other phenomena. Understanding and modeling these phenomena requires information on sea ice motion, thickness, and concentration.
The fundamental data set provided by the RGPS is ice motion obtained from tracking common features in successive SAR images. RGPS products ( Box 2-1) include derived ice age and ice thickness histograms of the thin-ice fraction of the ice cover in the winter. In the summer, they also include an estimate for the open water fraction. The time of melt-onset in the spring and freeze-up in the late fall are estimated from changes in backscatter signature of the ice cover. These geophysical variables support model improvements and the development of climatologies of sea ice processes. Products are currently maintained by NASA's Jet Propulsion Laboratory (JPL) and will eventually be archived and distributed by the ASF; more information is available at < http://www-radar.jpl.nasa.gov/rgps/radarsat.html>.
RADARSAT Antarctic Mapping Project
The RADARSAT Antarctic Mapping Project (RAMP), a collaboration between the Canadian Space Agency and NASA, has created the first seamless, high-resolution-radar, map-quality mosaic of Antarctica (see Figure 2-1). The goal of the project is to use the map and resulting data products to study Antarctica's ice cover and its response to climate change.
Page 24
BOX 2-1RADARSAT GEOPHYSICAL PROCESSING SYSTEM PRODUCTS
Ice Motion (Lagrangian trajectories). A regular array of points is defined initially on the first image of a long time series of SAR images and an ice tracker finds the positions of those points in all subsequent images of the series. This product contains a record of the trajectories or an array of position measurements of the “ice particles” that are located on an initial grid which covers the entire Arctic Ocean. The sampling interval is determined by the available repeat coverage of these points by the SAR sensor (usually 3 days). The initial grid spacing is 10 km. The accuracy of the position measurements is typically 300m in areas with moderate deformation with higher uncertainties in areas with intense deformation. Ice Deformation. The local deformation of the ice is computed using the velocity gradients at the vertices of the cells. The deformation fields characterize the opening, closing, and shear of the ice cover. Ice Age Histogram. The ice age distribution of sea ice specifies the fractional area covered by ice in different age categories as a function of time. This ice age distribution is computed from the field of Lagrangian trajectories described above. The algorithm for determining ice age works only in the winter: the assumption is that there is ice growth in all new leads. It is initialized shortly after fall freeze-up and is operated until the onset of melt. The resolution of age is dependent on the sampling interval of the area of interest. The multiyear ice fraction is obtained with a backscatter-based ice classification algorithm. The accumulated freezing-degree days associated with each age class are tracked. The surface air temperatures for computing the freezing-degree days are extracted from analyzed air temperature fields. Closings are interpreted as ridging events and the amount of ice that participates in this processes is recorded. This product contains records of local ice age distributions and the accumulated freezing-degree days of each age category within the distributions, and the ridged ice area. Ice Thickness Histogram. The ice thickness distribution specifies the fractional area covered by ice in different thickness ranges within a given region as a function of time. The ice thickness distribution is estimated from the ice age distribution using an empirical relationship between the accumulated freezing-degree days and ice thickness. The local age distributions are converted to ice thickness distributions and accumulated over large areas to provide regional scale products. Open Water Fraction. Summer ice conditions are characterized by an open water fraction. The summer open water fraction in a Lagrangian cell (defined by line segments connecting the tiepoints) is estimated from kinematics and backscatter data. Backscatter Histogram of Lagrangian Cells. The backscatter histograms of the Lagrangian cells are recorded in this product. Date of Melt-onset in Spring/Freeze-up in Fall. There is a fairly well-defined change in the backscatter of the snow/ice to the onset of melt and freeze-up. The analysis algorithm will detect and estimate the date of this seasonal transition using the time series of backscatter product. |
Page 25
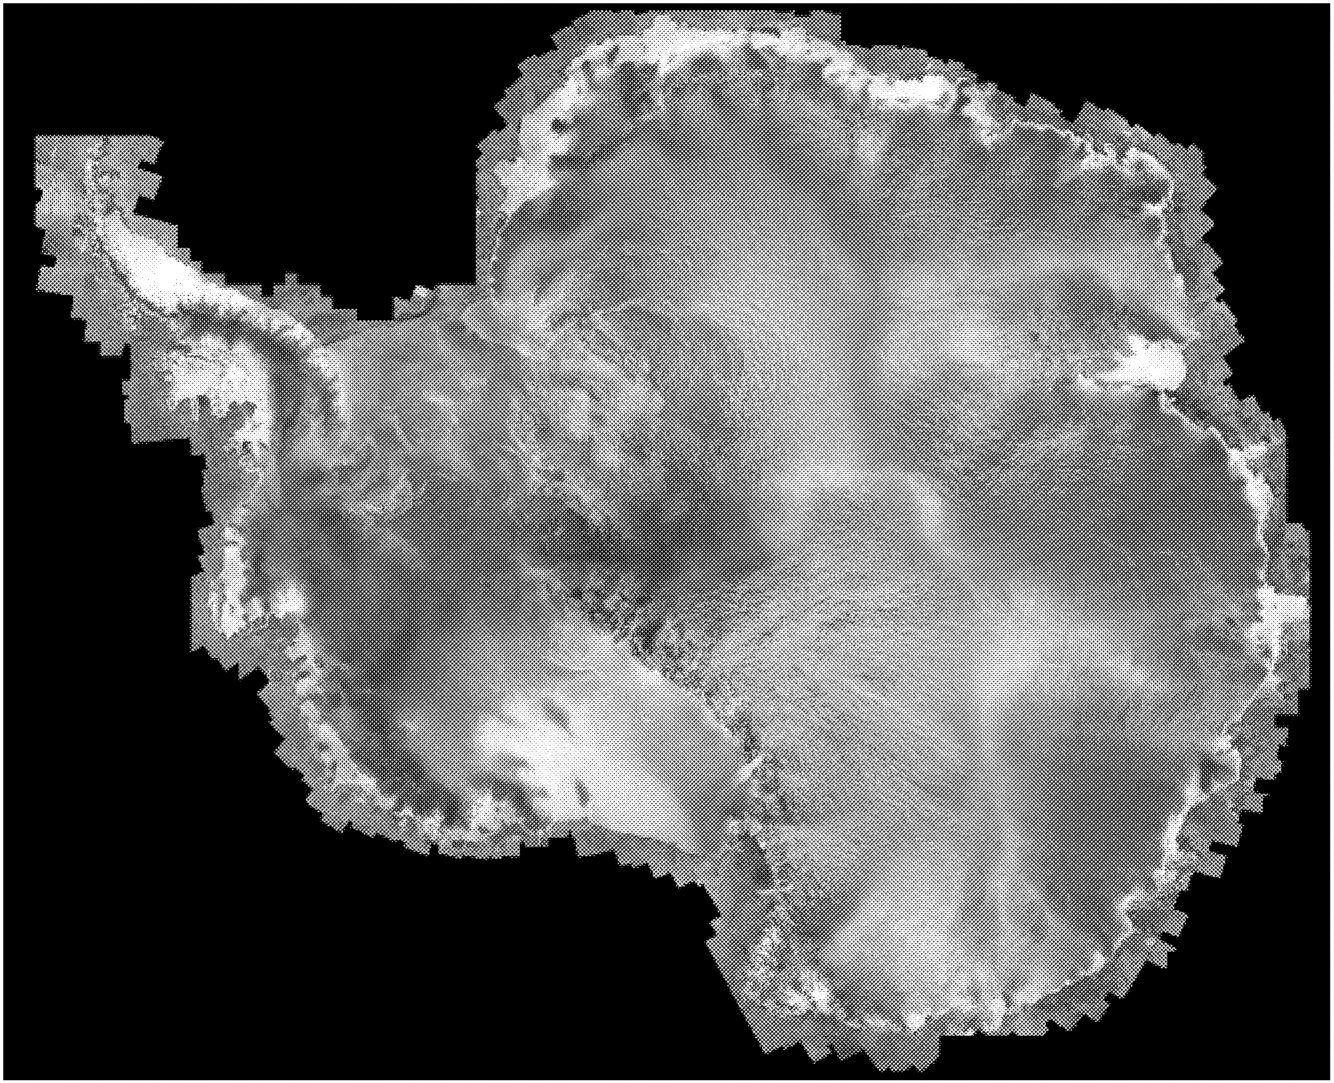
~ enlarge ~
FIGURE 2-1 First complete seamless radar mosaic of Antarctica. Courtesy Canadian Space Agency, © Canadian Space Agency, 2000 ( http://www-bprc.mps.ohio-state.edu/radarsat.html).
The first Antarctic imaging campaign was held during the fall of 1997, after the Canadian Space Agency successfully performed a difficult rotation maneuver that enabled the U.S.-launched RADARSAT to become the first SAR instrument capable of viewing the South Pole. Over 7,000 image frames were acquired as part of a mission plan devised by the JPL. Over 4,000 frames were processed to images by the ASF and provided to Ohio State University, which assembled the mosaic using a Vexcel-designed mapping system. The remaining frames were acquired after one repeat cycle of the satellite, and are suitable for interferometric analysis of ice sheet motion.
RAMP has produced some notable scientific accomplishments, such as identifying the southward extent of the East Antarctic Ice Streams and measuring the extent of physical properties of snow dunes and their contributions to mass transport. It is worth special note that in completing
Page 26
the radar imaging of Antarctica (see Figure 2-1), RADARSAT completed radar imaging of the entire Earth. Participants in the RADARSAT Antarctic Mapping Project activity were the Canadian Space Agency, NASA, The Ohio State University, Jet Propulsion Laboratory, Alaska SAR Facility, Vexcel Corporation, Goddard Space Flight Center, Canadian Center for Remote Sensing, Environmental Research Institute of Michigan, and RADARSAT International. The project received scientific and technical support from many organizations in a wide range of nations: British Antarctic Survey (Cambridge), International Center for Antarctic Research (New Zealand), Institute for Glaciology (Argentina), Institute for Geodesy (Germany), Antarctic Cooperative Research Center (Australia), National Institute for Polar Research (Japan), U.S. National Science Foundation, U.S. National Imagery and Mapping Agency, U.S. National Snow and Ice Data Center, and the Scientific Committee on Antarctic Research. More information on the data-set needs of Antarctic scientists is in Box 2-2. The RAMP mosaic and individual SAR images that comprise the mosaic are available from the ASF. The RAMP digital elevation model is available from NSIDC.
BOX 2-2POLAR GEOPHYSICAL DATA SETS: AN ANTARCTIC PERSPECTIVE
The needs of Antarctic scientists for geophyscial data sets are similar to those of their Arctic counterparts. In particular, just as the NASA ESE objectives can be cast with an Arctic perspective, there are corollary objectives related to ice and snow mass, the lateral and vertical distribution of snow and ice, precipitation patterns, and how these attributes change over time in the southern cryosphere. Use of Antarctic geophysical data sets relates primarily to sea ice and ice sheet measurements. The most obvious distinction between the two polar regions are that Arctic water and ice dynamics primarily relate to floating sea ice whereas the bulk of ice and snow in the southern hemisphere is grounded on land. This basic difference provides challenges for detection systems and for the collection of relevant quantitative data on the mass and thickness of Antarctic ice sheets. Floating sea ice is a seasonally significant feature of the southern oceans as well. A second major difference is that Antarctica has no indigenous populations, whereas the Arctic has a human population that interacts with changes in the environment, not only responding to change but in some instances inducing change. In Antarctica, the major forces affecting climate and the environment are global and generally not locally derived. Antarctica is seen as providing a bellwether of future global changes. The dynamic ebb and flow among the major reservoirs of water, snow, and ice that reside in the southern polar regions are a sensitive barometer of climatic change. |
Page 27
|
Antarctica is a major consideration in any global inventories of water retained in ice and snow. Antarctic research focuses on the (1) air-sea-ice interactions from both a local and a global perspective; (2) ice sheet processes; and (3) ice shelf mapping. Air-sea-ice interactions are monitored using ice motion data sets and measurement of sea ice distribution and thickness. Studies of changes in the extent and dynamics of glaciers are important research areas for Antarctic glaciologists. Challenges in providing high quality quantitative data to support these programs include the development of common reference data and precise measurements of elevation over time. Accurate and dense topographic coverage of the vast Antarctic ice sheets is needed for glaciological research, including numerical modeling of ice dynamics, with particular reference to mapping and quantifying ice drainage basins, ice shelf grounding lines, ice divides, sub-glacial lakes, ice shelf fronts, and ice rises. Studies are under way to map the extent and concentration of sea ice; ice motion; estimate ice thickness; map sea ice surface temperatures, and map albedo and cloud cover. The data sets typically support (in conjunction with in situ measurements) studies of ice flux; brine production; heat flux; seasonal, interannual, and decadal variability; and validation of models. Long-time series altimetry data have been provided by the NASA Pathfinder Program. Satellite radar imagery has been used in the southern hemisphere to quantify, map, and monitor: the boundaries of glaciers and ice sheets; the location of surface features such as crevasses, flow lines, moraines, ice streams; snow properties; ice temperature; snow facies; glacial ice motion; and the size, density, and rate of iceberg production. The data sets typically support studies of interannual and decadal variability of the transitions of the snow facies, timing of melt, glacial ice motion and grounding lines for mass balance analyses based on the flux method, and ice sheet elevation changes as an indicator of mass balance changes. The primary satellites are DMSP with SSM/I microwave radiometer; LANDSAT, the ERS-2 and Canadian RADARSAT with synthetic aperture radar, and the ERS-2 altimeter. The suite of sensors available are not adequate to address all the important climatology issues. Improvements and enhancements in current products would include better coverage of the southern ocean using high resolution radar for ice motion measurement, a better understanding of the retrieved quantities, and coordination of efforts to map ice sheet and sea ice motion. In general, the data used to support Antarctic research are readily available, but issues related to the cost of managing ever-larger data sets and how the community is provided access to this data remain a challenge. |
Program for Arctic Regional Climate Assessment
The Program for Arctic Regional Climate Assessment (PARCA) is a NASA project with the goal of measuring and understanding the mass balance of the Greenland ice sheet. The program began in 1993, but significantly increased in scope starting in 1995 when a number of inves-
Page 28
tigations were brought together under one coordinated program. The program includes a mix of satellite and aircraft remote-sensing and in situ measurements from about 25 investigations that address different components of the problem.
The prime PARCA tool has been aircraft laser altimetry, which measures directly the rate of surface elevation change, and ice thickness along all flight lines. Field measurements include shallow to intermediate coring (for average accumulation rates and their temporal and spatial variability), velocity measurements around the ice-sheet perimeter at an elevation of about 2,000 m, local measurements of ice thickening and thinning rates, and climatological observations from automatic weather stations. Data from various satellite sensors are also used: elevation change from satellite radar altimetry; mapping of snow facies and zones of summer melt from passive and active microwave; ice velocities from interferometric SAR and from repeat high-resolution visible and SAR imagery; and mapping surface and 10-m temperatures, accumulation rates, and surface albedo from microwave and AVHRR data.
PARCA is making significant contributions to our understanding of the mass balance of the Greenland ice sheet, proving a baseline set of measurements that will be compared with precise surface-elevation measurements to be provided by NASA's Geoscience Laser Altimeter System (GLAS), to be launched aboard ICESAT in late 2001. Data products are in various stages of completion and many of the source satellite data that PARCA uses are available from the NSIDC and the ASF DAACs. Satellite radar-altimeter data can be obtained from the Pathfinder activity at the Goddard Space Flight Center. Satellite scatterometer data are available from the physical oceanography DAAC (PO.DAAC) at the JPL. LANDSAT imagery is available from the EROS Data Center and SPOT imagery is available through commercial purchase. Data from the recently declassified Defense Intelligence Satellite Program dating back to the 1960s are also available from the EROS Data Center.
Polar Scatterometer Pathfinder Products
Scatterometers offer the longest continuous synoptic microwave record of the globe other than the ongoing Defense Meteorological Satellite Program (DMSP) series of Special Sensor Microwave/Imager (SSM/I) instruments. This NASA Pathfinder uses precisely calibrated non-ocean data streams from the SeaWinds scatterometer instruments on board QuikScat (QSCAT) and ADEOS-II, the NASA Scatterometer (NSCAT) onboard ADEOS-I, and the European Remote Sensing Satellite scatterometer (EScat), and SEASAT scatterometer (SASS) scatterometer instruments to cover both terrestrial and polar ice-covered ocean surfaces.
Page 29
Innovative techniques will generate products from presently underused scatterometer measurements to maximize their scientific returns for seasonal to interannual and long-term climate change research. These data address a direct scientific requirement in the Earth science community for active microwave data with improved resolution and equivalent time and space coverage to existing passive microwave data. Data that might be analyzed to provide useful geophysical products include:
-
Ku-band SEASAT SASS (August–October 1978 [limited images available]);
-
Ku-band NSCAT (September 1996–June 1997, daily);
-
C-band ERS-1 and ERS-2 (1991 to the present, daily); distribution of derived products must be cleared with ESA.
-
Ku-band SeaWinds onboard QSCAT (ongoing from July 1999 at daily intervals).
Consistent polar stereographic image data records are expected to be available by mid-2001 for each of the above instruments for the Arctic (generally between 52 and 90 degrees latitude through the JPL PO-DAAC).
NASA'S DISTRIBUTED ACTIVE ARCHIVE CENTERS
As noted earlier, the objective of NASA's Earth Science Enterprise is to obtain a broad-based understanding of the functioning of the Earth as a system, with particular reference to global environmental change. The data needed to study these processes are necessarily diverse, comprising observations from a wide variety of remote sensing and in situ instruments and experiments collected by several government agencies and academic institutions at different temporal and spatial scales (NRC, 1998). To integrate disparate data types and allow more comprehensive analyses NASA established the Earth Observing System Data and Information System (EOSDIS).
One element of this system is the Distributed Active Archive Centers (DAACs). Seven DAACs1 process and disseminate remote sensing and in situ data and data products related to the Earth system and provide services primarily to scientists and agency partners. According to a recent review, each DAAC has an individual role in some part of the overall
1 Goddard Space Flight Center DAAC, Langley Research Center DAAC, Eros Data Center DAAC, Alaska SAR Facility DAAC, Physical Oceanography DAAC, National Snow and Ice Center DAAC, and Oak Ridge National Laboratory DAAC. See NRC (1998) for descriptions and reviews of each. Information about the Alaska SAR Facility DAAC and National Snow and Ice Center DAAC in this section is taken largely from that report.
Page 30
enterprise, with little overlap or redundancy, although “for the DAACs effectively to fulfill the expectations for them, EOSDIS will need inspired leadership to create a practical network of information centers that truly enables scientific discovery and assessment. . . .” (NRC, 1998). Data sets most relevant to polar regions are managed at the Alaska SAR Facility DAAC and the National Snow and Ice Center DAAC. Both have holdings of relevance to global, Arctic, and Antarctic observations.
Alaska Synthetic Aperture Radar Facility
The Alaska Synthetic Aperture Radar Facility DAAC is located at the Geophysical Institute, University of Alaska, Fairbanks. It was established in 1986 to process, distribute, and archive SAR data collected exclusively by foreign spacecraft: the European Remote Sensing Satellites 1 and 2; the Japanese Earth Remote-Sensing Satellite-1; and the Canadian RADARSAT-1 ( Box 2-3). As specified in an international memorandum of understanding (IMOU) between NASA and the foreign space agencies, only limited quantities of data are acquired by ASF and distributed to NASA-approved researchers. The data that are the most accessible are largely from the Alaska and McMurdo Station, Antarctica, masks. The data, acquired and distributed since 1991, are useful for applications ranging from sea-ice dynamics and volcanology to permafrost and glacial loss and ecosystem change. The user community is relatively small but growing, albeit hindered by data restrictions in the IMOU. There were about 400 users in fiscal year (FY) 1997. The international character of this DAAC is unique within the EOSDIS system.
National Snow and Ice Data Center
The National Snow and Ice Data Center DAAC is hosted by the Cooperative Institute for Research in Environmental Sciences, University of Colorado at Boulder, and includes the DAAC, the NSIDC itself, and the World Data Center (WDC) for Glaciology. This DAAC, which manages data related to snow and ice, climate, and the cryosphere, was created by NASA in 1991, although its roots go back to 1957 when the World Data Center for Glaciology was established at the American Geographical Society in New York.
All three NSIDC centers serve the cryospheric and polar science communities, and data are available on snow cover, freshwater ice, sea ice, glaciers, ice sheets, and ground ice ( Box 2-4). NSIDC provides access to EOS satellite data, ancillary in situ measurements, and necessary baseline data, model results, and relevant algorithms relating to cryospheric and polar processes. Although the operations and staff are commingled, the
Page 31
BOX 2-3ALASKA SAR FACILITY DAAC HOLDINGS
European Remote-Sensing Satellites (ERS-1 and -2): Complex Synthetic Aperture Radar (SAR) data (10-m resolution), full-resolution SAR images (30-m resolution), and low-resolution SAR images (240-m resolution) from 3,000-km-radius circles centered over Fairbanks, Alaska, and McMurdo Station, Antarctica. Data are available beginning August 1991 from the Alaska mask and October 1995 from the McMurdo mask. Japanese Earth Remote-Sensing Satellite: Complex SAR data (10-m resolution), full-resolution SAR images (30-m resolution), and low-resolution SAR images (240-m resolution) from a 2,600-km-radius circle centered over Fairbanks, Alaska, and other limited areas. Data are available from May 1992 to October 1998. RADARSAT-1: Complex SAR data (10-m resolution), standard beams; full-resolution SAR images (25-m resolution); low-resolutions SAR images (150-m resolution); full-, medium-, and low-resolution (50, 100, and 400 m, respectively) ScanSAR wide (500-km-swath width); and full-, medium-, and low-resolution (50, 100, and 400 m, respectively) ScanSAR narrow (300-km-swath width) data from 3,000-km-radius circles centered over Fairbanks, Alaska, and McMurdo Station, Antarctica. Significant coverage outside these masks is also available. Data are available from February 1996 to present. RADARSAT-1: Antarctic Mapping Mission-1 (25-m resolution) RAMP Data (October 1997) RADARSAT-1: Modified Antarctic Mapping Mission-2 (25-m resolution) RAMP Data (October to December 2000) RAMP Antarctic mosaic and individual SAR images that comprise the mosaic, obtained September through October 1997. Source: NASA, 1998. |
DAAC holdings are distinct from the other two centers. Current DAAC holdings include passive microwave and AVHRR products, altimetry and elevation data, and remotely sensed and in situ polar atmospheric science data.
All other NASA DAACs hold global data sets that are directly relevant to polar studies, but NASA and polar researchers do not think of them in this light. Two examples are particularly notable because the need for them is frequently mentioned in both the science-driving ques-
Page 32
BOX 2-4NASA-FUNDED DATA SETS AT THE NATIONAL SNOW AND ICE DATA CENTER
The National Snow and Ice Data Center (NSIDC) maintains a large number of relevant polar geophysical data sets, among its other holdings. A list of many of the most significant appears below, and more information can be obtained at < http://nsidc.org/NSIDC/GUIDE/index.html>. Information can also be obtained from NSIDC User Services, Campus Box 449, University of Colorado, Boulder, CO 80309-0449 USA, 303-492-6199, fax: 303-492-2468, or email: nsidc@kryos.colorado.edu. See Appendix A for a list of acronym descriptions. BRIGHTNESS TEMPERATURE DATA SETS DMSP SSM/I Pathfinder Daily EASE-Grid Brightness Temperatures DMSP SSM/I Daily Polar Gridded Brightness Temperatures Near Real-Time DMSP SSM/I Daily Polar Gridded Brightness Temperatures AVHRR Leads-ARI Polar Gridded Brightness Temperatures Nimbus-5 ESMR Polar Gridded Brightness Temperatures, Revision 1 Nimbus-7 SMMR Antenna Temperatures Nimbus-7 SMMR Pathfinder Brightness Temperatures NOAA/NASA SSM/I Pathfinder Antenna Temperatures NOAA/NASA SSM/I Pathfinder Level 2 and Level 3 Land Surface Products DMSP Special Sensor Microwave/Imager (SSM/I) F8 and F10 Wentz Antenna Temperatures SEA ICE DATA SETS Nimbus-7 SMMR Polar Radiances and Arctic and Antarctic Sea Ice Concentrations DMSP SSM/I Daily and Monthly Sea Ice Concentration Grids for the Polar Regions Near Real-Time DMSP SSM/I Daily Polar Sea Ice Concentrations Sea Ice Concentrations from Nimbus-7 SMMR and DMSP SSM/I Passive Microwave Data DMSP-F8 SSM/I Pathfinder Global Level 2 Sea Ice Concentrations Navy/NOAA National Ice Center Weekly Sea Ice Concentration and Extent, Arctic and Antarctic Arctic Ocean Drift Tracks from Ships, Buoys, and Manned Research Stations IABP Drifting Buoy Gridded Pressure, Temperature, Position, and Interpolated Ice Velocity Nimbus-5 ESMR Polar Gridded Sea Ice Concentrations SNOW COVER AND PRECIPITATION DATA SETS Historical Soviet Daily Snow Depth Version 2 (HSDSD) Nimbus-7 SMMR Derived Global Snow Cover and Snow Depth 1978-1987 Former Soviet Union Monthly Precipitation Archive, 1891-1993 |
Page 33
|
COMBINED SEA ICE AND SNOW COVER DATA SETS Northern Hemisphere EASE-Grid Weekly Snow Cover and Sea Ice Extent Near Real-Time SSM/I EASE-Grid Daily Global Ice Concentration and Snow Extent ICE SHEET AND ELEVATION DATA SETS Digital SAR Mosaic and Elevation Map of the Greenland Ice Sheet SEASAT and GEOSAT Altimetry Data for the Antarctic and Greenland Ice Sheets GEOSAT Radar Altimeter DEM Atlas of Antarctica North of 72.1 Degrees South Antarctic Ice Velocity Data POLAR ATMOSPHERE DATA SETS Arctic Water Vapor Characteristics from Rawinsondes Comprehensive Ocean-Atmosphere Data Set LMRF Arctic Sub-set Coordinated Eastern Arctic Experiment (CEAREX), Volume 1 Daily Arctic Ocean Rawinsonde Data from Soviet Drifting Ice Stations Historical Arctic Rawinsonde Archive (HARA) NCEP/NCAR Arctic Marine Rawinsonde Archive TOVS Pathfinder Path-P Daily Arctic Gridded Atmospheric Parameters OTHER DATA SETS Polar Pathfinder Sampler: Combined AVHRR, SMMR-SSM/I, and TOVS Time Series and Full-Resolution Samples AVHRR Polar 1 km Level 1b Data Set Global Annual Freezing and Thawing Indices State of the Cryosphere EXPECTED DATA SETSa Bootstrap Sea Ice Concentrations from Nimbus-7 SMMR and DMSP SSM/I ERS-1 Altimeter Digital Terrain Ice Model of Antarctica ERS-1 and GEOSAT Altimetry Data for the Antarctic and Greenland Ice Sheets Antarctic Ice Sheet Digital Elevation Model RAMP (RADARSAT Antarctic Mapping Project) Digital Elevation Model RADARSAT Antarctic Mapping Project (RAMP) Canadian Monthly Precipitation AVHRR Polar Pathfinder 1.25 KM Data Set AVHRR Polar Pathfinder 5 KM Data Set MODIS Terra Snow Cover Products MODIS Terra Sea Ice Extent Products a Some of these data sets may be available by the time this report is published. We supply this list only to illustrate the types of products expected within a reasonable timeframe. |
Page 34
tions and in the survey of polar researchers. The first example is surface radiation, which is controlled by the properties of the polar atmosphere, particularly its clouds. The most extensive global data set that contains polar cloud information is produced by the International Satellite Cloud Climatology Project (ISCCP), which is archived at the NASA Langley DAAC. Two other NASA projects are now producing systematic and global surface radiative flux data sets based on this project and other data products, which are being archived at NASA Langley. Many satellite sensors are sensitive to surface temperature and albedo, including the sensors used to determine cloud properties. The ISCCP data set also contains global surface temperature and visible reflectance information; however, insufficient attention has been paid to examining the quality of these and other satellite determinations of surface temperature and albedo in the polar regions. As a second example, we note that land vegetation properties have been characterized by a number of sensors that could also be studied in the polar regions. Such data products and the satellite data sets from which they are produced are archived at NASA Goddard DAAC and the EROS DAAC. The NASA terrestrial biosphere program supports the analysis of many of these satellite data sets, but they need to be more thoroughly evaluated for polar conditions. There is also a need for improvement in how satellite remote sensing is used for biological oceanography ( Box 2-5).
OTHER AGENCY DATA SETS
NASA is not the sole provider of data sets related to polar regions. NOAA, the Department of Defense, and the National Science Foundation also provide related information, and thus must be considered when judging NASA's strategy for providing such data, particularly in terms of identifying gaps and redundancies in the nation's overall capabilities. The National Science Foundation's Arctic System Science Program,2 which consists of the following sub-programs, is especially relevant:
-
Land-Atmosphere-Ice Interactions (LAII)3
-
Ocean-Atmosphere-Ice Interactions (OAII)4
-
Synthesis, Integration, and Modeling Studies, and Paleoenvironments of the Arctic System, (which combine the Paleoclimates of Arctic Lakes and Estuaries [PALE],5 the Greenland Ice Sheet Project 2
2 http://arcss.colorado.edu/projects/
3 http://www.laii.uaf.edu/
4 http://arcss-oaii.hpl.umces.edu/
5 http://www.ngdc.noaa.gov/paleo/pale/index.html
Page 35
BOX 2-5SATELLITE REMOTE SENSING FOR BIOLOGICAL OCEANOGRAPHIC INVESTIGATIONS
Because primary production depends mostly on the availability of light and nutrients and photosynthetically derived material supports the entire marine food web, biological oceanographers need to know as much as possible about factors that influence key environmental variables. For example, clouds, snow cover, and sea ice have a large impact on albedo and the transmission of light into the ocean. Nutrient fluxes depend on the degree of stratification and mixing so winds, ice melt and movement, currents, fronts, etc. are all of interest. Satellites offer a way to monitor many forms of biological activity in the vast and inhospitable polar oceans. They provide data about photosynthetically available radiation, phytoplankton chlorophyll, clouds, sea ice, sea surface temperature, surface albedo, winds and data telemetry capabilities for instrumentation packages. However, the coverage and resolution for various sensors and products are very different and software to manipulate, replot, and analyze these disparate data sets are not readily available. Improved resolution (~100 m) coverage (several overpasses per day or an innovative higher-latitude quasi-geostationary approach), and inexpensive software/hardware to analyze imagery within standard coordinate systems would provide a better understanding of biological variability over time, from hours to interannual scales. New and improved algorithms to understand phytoplankton biomass, primary production, and colored dissolved organic material are also needed. When using remote sensing to study biological oceanography in polar regions, direct satellite observation can be constrained because clouds are a ubiquitous problem. In addition, sea ice—whether snow-covered or not—is a bright target that saturates highly sensitive marine sensors. Based on the dominant primary producers, marine ecosystems in polar regions can be characterized into two types: those closely associated with sea ice and seasonal, open water communities. The transition area between ice and open water is the marginal ice zone (MIZ), which advances and retreats seasonally. Open water areas rely on phytoplankton production, whereas ice-associated foodwebs are supported by ice algae attached to sea ice or by adjacent phytoplankton blooms in the MIZ. The MIZ is a well-known locus for high primary production, but the proximity to ice can limit useful imagery and distort retrievals. There is a seasonal progression between these two types of ecosystems in regions covered by annual ice versus those under perennial pack ice. By virtue of their increased mobility, larger organisms such as birds and mammals can exploit both ecosystems. Many of these larger organisms move to leads and ice edges to exploit elevated prey concentrations and breathing access. Satellite tracking transmissions of “tagged” marine mammals is common in open water but is challenging beneath heavy ice cover. Biologists have a critical need to assess environmental conditions and food web structure to better understand interactions between physical, chemical, and biological processes. Open waters are directly accessible to visible sensors to estimate the biomass of primary producers, but the dynamics of under-ice communities must be modeled with surface inputs. Knowledge of photosynthetically available radiation, clouds, snow and ice cover are necessary to predict light transmission accurately. SOURCE: G. Cota, Research Professor, Dalhousie University, private communication, 2000. |
Page 36
[GISP 2],6 and the Human Dimensions of the Arctic System Science Program [HARC]7).
Similarly, NOAA produces significant data of relevance to high latitudes and the ESE questions. For example, the science-driving questions and responses to this committee's survey both highlight the need for measurements of polar atmospheric properties (temperature, humidity, winds), even though these data are routinely produced by NOAA to support global weather forecasting activity. Moreover, NOAA also produces global analyses that integrate satellite and conventional observations of these quantities into global data products, which can also be used as a source of this information. NOAA supports this activity by producing sea surface temperature (SST) and vegetation index data from the same sensors. Note that the polar Pathfinders have produced special versions of some of these data products for the Arctic; a similar analysis should be conducted for the Antarctic.
A number of NASA principal investigators (PIs) distribute data sets from Web sites specific to their projects. Examples include meteorological data, data from aircraft and surface measurements as part of field campaigns, and other data sets that may be the subject of active research or processing efforts, and so continue to be updated. There are many reasons why university and PI-based Web sites are not suitable for long-term storage and distribution; it is, therefore, important that these data sets be placed in permanent archives. The committee believes that the DAACs should be the permanent archives for satellite-derived data sets to which NASA has been the dominant contributor, for example, the 22-year record of sea ice concentrations from passive microwave sensors.
INTERNATIONAL DATA SETS
To appreciate NASA's contribution to satellite data sets, it is necessary to consider the international context because there are a number of relevant satellite missions by other nations, as well as various projects with significant international components. For instance, valuable international satellite projects include the joint French/German/Russian mission called ScaRab, which measured the top-of-atmosphere radiation budget (like the Earth Radiation Budget Experiment) and its products cover
6 http://arcss.colorado.edu/Projects/gisp2.html and http://arcss.colorado.edu/Gispgrip/index.html
7 http://arcss.colorado.edu/Projects/harc.html
Page 37
the period March 1994 through February 1995. (For further information, contact < scarab@cst.cnes.fr>). Another international satellite is the Japanese experimental satellite ADEOS-I, which operated for eight months between November 1996 and June 1997 and which will have a follow-on mission in 2001. The payload is expected to include a number of important instruments, including an Ocean Color and Temperature Scanner, an Advanced Visible and Near-Infrared Radiometer, a NASA Scatterometer to measure ocean surface winds (for information see < http://winds.jpl.nasa.gov/missions/nscat/nscatindex.html>), and a Total Ozone Mapping Spectrometer < http://jwocky.gsfc.nasa.gov/adeos/adeos.html>. Another international satellite project of importance is the European Earth Remote Sensing (ERS) satellite mission. ERS-1 and -2 are research satellites that carry a combined wind scatterometer (also useful for land and ice surface characterization) and SAR, a radar altimeter, an infrared and microwave atmospheric sounder; an ozone radiometer (ERS-2 only); an imager (the Along-Track Scanning Radiometer is like AVHRR but with two look angles). However, researchers have noted many difficulties in obtaining data from these satellites, especially ERS-1.
A good example of a U.S.-led activity with important international components is the project Surface Heat Budget of the Arctic Ocean (SHEBA). SHEBA's field program included an ice camp experiment investigating sea ice and upper ocean and atmosphere interactions for one annual cycle in the Beaufort Sea as part of an investigation of the role of Arctic climate in global change (see < http://sheba.apl.washington.edu>). The primary goals are: To determine the ocean-ice-atmosphere processes that control the surface albedo and cloud-radiation feedback mechanisms over Arctic pack ice, to use this information to improve models of Arctic ocean-atmosphere-ice interactive processes; and to develop and implement models that improve the simulation of the present Arctic climate, including its variability, using coupled global climate models. SHEBA is scheduled to run from 1995 until 2002. The primary sponsor is the National Science Foundation (Office of Polar Programs, Division of Ocean Sciences, and Division of Atmospheric Sciences), with significant direct funding provided by the Office of Naval Research (High Latitude Dynamics Program). Additional support has been provided by SHEBA partners, including: Japan Marine Science and Technology Center (JAMSTEC), Department of Energy (Atmospheric Radiation Measurement Program - ARM), National Aeronautics and Space Administration (First ISCCP Regional Experiment III Arctic Cloud Experiment - FIRE ACE); RADARSAT Geophysical Processing System - RGPS, Alaska SAR Facility (ASF), the Department of Fisheries and Oceans Canada (Canadian Coast Guard), and the Scientific Ice Expeditions (SCICEX - U.S. Navy and National Science Foundation).
Page 38
Finally, an excellent example of a broad international activity with many components is the World Climate Research Programme (WCRP). Some of these elements are described below in some detail to illustrate the complexity of activities and thus the need for careful planning to ensure that duplication is minimized and opportunities pursued.
World Climate Research Programme
The World Climate Research Programme (WCRP) was established in 1980 under the joint sponsorship of the International Council for Science, the World Meteorological Organization, and since 1993 the Intergovernmental Oceanographic Commission of UNESCO. The program seeks to develop a fundamental scientific understanding of the physical climate system and climate processes needed to determine the extent to which climate can be predicted and the extent of human influence on climate. The program encompasses studies of the global atmosphere, oceans, sea and land ice, and the land surface that together constitute the Earth's physical climate system. Studies are directed to provide scientifically founded quantitative answers to the questions being raised on climate and the range of natural climate variability, as well as to establish the basis for predictions of global and regional climatic variations and of changes in the frequency and severity of extreme events. The cryospheric component of the WCRP is known as Climate and the Cryosphere (CliC), which is an outgrowth of WCRP's Arctic Climate System Study (see below).
Global Energy and Water Cycle Experiment
The WCRP initiated the Global Energy and Water Cycle Experiment (GEWEX) in 1988 to observe and model the hydrologic cycle and energy fluxes in the atmosphere, at the land surface and in the upper oceans. An integrated program of research, observations, and science activities, GEWEX will ultimately allow the prediction of global and regional climate change. GEWEX has contributed significant data and data sets to scientists addressing ESE questions and the polar science-driving questions of interest in this study. For information on how to obtain these data sets, see < http://www.gewex.com>.
International Satellite Cloud Climatology Project
The International Satellite Cloud Climatology Project was established in 1982 as part of the WCRP to collect and analyze satellite radiance measurements to infer the global distribution of clouds, their properties,
Page 39
and their diurnal, seasonal, and interannual variations (e.g., cloud cover, optical thickness, top temperature/pressure). Data collection began in July 1983 and is planned to continue through June 2005. The resulting data sets and analysis products are being used to improve understanding and modeling of the role of clouds in climate, with the focus on understanding the effects of clouds on the radiation balance.
Three products contain information with different space-time resolutions: 30 km and 3 hr, 280 km and 3 hr, and 280 km and monthly. Data processing is ongoing. Note that clouds are particularly difficult to detect and measure over the colder and brighter surfaces occurring in the polar regions; however, a revision of the processing specifically focused on these problems has somewhat reduced the errors. For more information, see < http://isccp.giss.nasa.gov>.
Surface Radiation Budget/Baseline Surface Radiation Network
The Surface Radiation Budget (SRB) produces a global data set providing upward, downward, shortwave, and longwave radiative fluxes at the surface, calculated from satellite determinations of atmosphere, cloud, and surface properties (mainly from the ISCCP). Currently, a monthly average shortwave product with a 280-km resolution is available covering the period July 1983 through June 1991. Another prototype product containing monthly averages of all flux components is also available covering the same period. The complete product with 3-hr and 110-km resolution should begin to appear in 2001. The Baseline Surface Radiation Network (BSRN) provides validation data sets by direct high-quality measurements of all flux components, with ancillary atmospheric and surface property information. Note that calculation of radiative fluxes under the severe conditions in polar regions is difficult. The main problems are accurate determination of cloud optical thicknesses, which affect shortwave fluxes the most, and proper determination of lower atmosphere temperature inversions and surface temperature, which affect longwave fluxes the most. For more information, see < http://agni.larc.nasa.gov/SRB_homepage.html and http://bsrn.ethz.ch>.
Global Precipitation Climatology Project
A global data set providing monthly average precipitation amounts covering the period from January 1988 through December 1996 is a merged analysis of surface gauge measurements and satellite microwave and infrared radiance measurements. A new product with 110-km and daily resolution is planned. Note that neither satellite analysis actually produces reliable results at high latitudes when precipitation is in the
Page 40
solid phase, so that all information available in this data set at these latitudes is from surface gauges, which have well-known difficulties with snow. For more information, see < http://orbit-net.nesdis.noaa.gov/arad/gpcp>.
International Satellite Land Surface Climatology Project
The International Satellite Land Surface Climatology Project (ISLSCP) has produced a global collection (Initiative I) of surface and atmospheric data suitable for forcing land hydrology models. The collection is a mix of satellite analyses, surface measurements, survey results (mainly for specifying surface physical properties, including topography and vegetation) and weather model output (mainly for meteorological information), all placed in a common 1-degree map grid. Time-dependent data cover the period from January 1987 through December 1988. A new version (Initiative II) is to be produced in 2001 covering a 10-year period with a 0.5-degree grid. The quality and completeness of the data for polar conditions is not known. See < http://daac.gsfc.nasa.gov/CAMPAIGN_DOCS/ISLSCP/islscp_i1.html>.
Global Water Vapor Project
The Global Water Vapor Project is a new activity proposed as part of the GEWEX. Water vapor plays a vital role in shaping weather and climate, and this project is intended to improve understanding of fundamental aspects of the atmospheric system, including radiative heating, precipitation, cloud formation, and horizontal and vertical moisture transport and convergence. This project seeks to improve the accuracy and availability of global water vapor data through the development of a global water vapor data set, establish reference stations, and conduct intercomparison of studies among the existing water vapor data sets. Although in its early stages, this project has produced a prototype global water vapor data set (called NVAP) that reports daily and monthly profiles of tropospheric water vapor covering the period January 1988 through December 1996 with 110-km resolution. The product is produced by merging rawinsonde results, where available, with satellite sounder products (NOAA operational), the latter modified to be consistent with a microwave (SSM/I) analysis over oceans.
Arctic Climate System Study
Another WCRP-associated program is the Arctic Climate System Study (ACSYS) < http://www.npolar.no/oelke/adis.html>. The ACSYS
Page 41
project is to ascertain the role of the Arctic in global climate by answering questions such as: What are the global consequences of natural or human-invoked change in the Arctic climate system? Is the Arctic climate system as sensitive to increased greenhouse gases as climate models suggest?
This study is now evolving into an expanded program called the Climate and Cryosphere Initiative, which is intended to investigate the role of the entire cryosphere for global climate and as an early indicator of change. It will integrate studies of the impact and response of the cryosphere in the global climate system and the use of cryospheric change indicators for climate change detection. All elements of the seasonal and perennial cryosphere are included, as are their interactions with the atmosphere and ocean on a global scale, and between the atmosphere, snow/ice, and land; between land ice and sea level; and between sea ice, oceans, and the atmosphere. The Arctic Climate System Study (ACSYS) produces the RADARSAT Eulerian ice motion data set for Surface Heat Budget of the Arctic project (SHEBA).
World Ocean Circulation Experiment
The World Ocean Circulation Experiment (WOCE) < http://www.soc.soton.ac.uk/OTHERS/woceipo/data.html> is a fundamental element of the WCRP scientific strategy to understand and predict changes in the world ocean circulation, volume, and heat storage that might result from changes in atmospheric climate and net radiation. It uses a combination of in situ oceanographic measurements, observations from space, and global ocean modelling, as well as the Topex-Poseidon Sea Surface (height) Anomaly data set (see < http://podac.jpl.nasa.gov/toppos>).
Oceans Pathfinder Data Sets
The NOAA/NASA AVHRR Oceans Pathfinder data sets < http://podaac.jpl.nasa.gov/sst> are derived from the 5-channel AVHRR onboard the NOAA-7, -9, -11, and -14 polar-orbiting satellites. Daily, 8-day, and monthly averaged data for both the ascending pass (daytime) and descending pass (nighttime) are available on equal-angle grids of 4096 pixels/360 degrees (nominally referred to as the 9 km resolution), 2048 pixels/360 degrees (nominally referred to as the 18 km resolution), and 720 pixels/360 degrees (nominally referred to as the 54 km resolution or 0.5-degree resolution). Data in different spatial and temporal resolutions are available from 1985 to 1999 (November 20). Global files are available through the PO.DAAC Internet ftp or order form and desired regions are available through the AVHRR Pathfinder sub-setting system.
Page 42
Baltic Sea Experiment
The Baltic Sea Experiment (BALTEX) is a hydrology-meteorology-oceanography experiment covering the Baltic Sea and its drainage basin. This experiment, which is a continental-scale investigation associated with GEWEX, is designed to explore and model the various mechanisms determining the space and time variability of energy and water budgets of the Baltic Sea area and its interactions with surrounding regions; to relate these mechanisms to the large-scale circulation systems in the atmosphere and oceans over the globe; and to develop transportable methodologies in order to contribute to basic needs of climate, climate impact, and environmental research in other regions of the world.
BALTEX comprises both meteorological and hydrological research and it has a strong oceanographic research component, at present a unique feature among the GEWEX regional projects. Designed to assess the total heat and water flux divergence of the Baltic Sea area, program includes numerical modeling, data assimilation, experimental and numerical process studies, re-analysis of existing data sets, and application of remote sensing (see < http://w3.gkss.de/baltex/baltex_home.html>).
Mackenzie GEWEX Study
The Mackenzie GEWEX (MAGS) Study is a hydrology-meteorology investigation of the water and energy cycles of a northern river system, the Mackenzie River drainage basin in Canada. This study, which is also associated with GEWEX, includes a series of large-scale hydrological and related atmospheric and land-atmosphere studies. Within this region, there are many important cold-region phenomena, such as snow and ice processes, permafrost, and arctic clouds and radiation interactions that are essential components of any global climate system model. The Mackenzie basin and an associated similar initiative in the Mississippi River basin taken together provide a true continental area in which to test and validate macro-scale coupled hydrological and other models (see < http://www1.tor.ec.gc.ca/GEWEX/MAGS.html>).
Future International Satellite Missions
There are a number of potentially significant international satellite missions planned for the near-future that should provide data important to polar scientists. For example, ADEOS-II is a Japanese follow-on mission to ADEOS-I. Its instrument payload will include the Advanced Microwave Scanning Radiometer, Global Imager, Improved Limb Atmospheric
Page 43
Spectrometer (ILAS), Seawinds (scatterometer), and Polarization and Directionality of Earth's Reflectances (POLDER).
Another planned mission is Envisat, a European research satellite scheduled for launch in 2001; its instrument payload will include a SAR, an ozone spectrometer, an infrared sounder, a multiwavelength imaging radiometer, a microwave imager, an infrared spectrometer, and a lightning sensor.
A European technology-experiment satellite, called Project for On-Board Autonomy (PROBA), carries a high-resolution imaging spectrometer (visible and near-infrared wavelengths).
The Aqua satellite, to be launched in 2001, will provide information on several key variables discussed in this report. For example, Aqua will carry an Advanced Microwave Sounding Unit (AMSU) for atmospheric temperature profiles as well as cloud and aerosol properties; an Advanced Microwave Scanning Radiometer for EOS (AMSR-E) for precipitation, columnar water vapor and cloud water, aerosol properties, sea surface wind speed, snow depth on sea ice, and snow water equivalent; a Moderate-Resolution Imaging Spectroradiometer (MODIS) for atmospheric profiles, land surface characteristics, ocean primary productivity, and snow and ice albedo; and a Clouds and the Earth Radiant Energy System (CERES) for radiative fluxes and cloud-radiative interactions.
Although only in the early stages of its product assessment and utilization, the recently (December 1999) launched Terra satellite carries MODIS and CERES instruments as well as an Advanced Spaceborne Thermal Emission and Reflection Radiometer (ASTER), a Multi-angle Imaging Spectral Radiometer (MISR), and an instrument for Measurements of Pollution in the Troposphere (MOPITT). Applications of the Terra are directed toward aerosols characterization, changes in global cloudiness, changes in the global land surface, and the roles of the ocean in global change.


