
5
The Demographic Analysis of Mortality Crises: The Case of Cambodia, 1970-1979
Patrick Heuveline
As best as can now be estimated, over two million Cambodians died during the 1970s because of the political events of the decade, the vast majority of them during the mere four years of the “Khmer Rouge ” regime. This number of deaths is even more staggering when related to the size of the Cambodian population, then less than eight million. In my estimation, about a third of the 1970 population would have survived to the end of the decade under “normal” demographic conditions but did not under the circumstances that prevailed. No single factor alone explains the rare intensity of the Cambodian mortality crisis. Instead, the excess mortality pattern reflects one of the worst imaginable mixes of conditions, including war casualties, massive population displacement, ethnic cleansing, health system collapse, and famine.
I begin this chapter with a brief summary of the various political events that had demographic consequences in the 1970s. I continue with a discussion of the different sources of data and corresponding techniques for estimating the volume of deaths during a mortality crisis. I then discuss further the estimation of the cause-of-death, sex and age patterns of crisis mortality. To illustrate how particular conditions and data availability constrain the choice of methods and the implementation of the selected methods, the last section describes past estimations of mortality patterns in Cambodia during the 1970s.
CAMBODIA IN THE 1970s 1
At the onset of this terrible decade in Cambodian history, the Communist Party of Kampuchea's (CPK) armed opposition to prince Norodom Sihanouk was gaining momentum. Those who would be remembered as the “Khmers Rouges,” a term coined by Sihanouk himself, occupied bases in the northeast and northwest corners of the country from which they rendered unsafe as much as a fifth of Cambodia's territory (Chandler, 1996). To the west, Vietnamese communist troops held bases on Cambodian soil. Up to this point, the population of Cambodia can be reasonably well extrapolated from the demographic analysis of its 1962 census (Migozzi, 1973; Siampos, 1970).
In March 1970, the National Assembly voted Sihanouk out of power to the benefit of his own Prime Minister, Lon Nol. Sihanouk learned of the coup while on holiday, out of the country. With the support of North Vietnam, he took command of an opposition alliance whose military force on the ground consisted mostly of his former foes of the CPK. In part because of the North Vietnamese support to the opposition, the new Cambodian government started a strong campaign against the half million ethnic Vietnamese then living in Cambodia and suspected of supporting Sihanouk. The Cambodian army killed thousands of Vietnamese civilians (Chandler, 1996:205), and about 300,000 people are believed to have fled—or to have been expelled by force—to Vietnam during the first eight months of 1970 (Migozzi, 1973:44). But the inexperienced and ill-equipped army failed to drive North Vietnamese forces out of the country.
Over the next four years, the Lon Nol government gradually lost control over the Cambodian countryside. The mortality impact of the civil war is difficult to assess, but the main controversy in this respect concerns the impact of a massive bombardment of eastern Cambodia by U.S. planes in early 1973—sometimes referred to as the “Kissinger war” because of former U.S. Secretary of State Henry Kissinger's involvement— meant to weaken the North Vietnamese troops. Sihanouk (1986:144) mentions a widely circulated but unsubstantiated estimate that 700,000 Cambodians were killed under the Lon Nol government. Kiernan (1989) argues that the impact of the U.S. bombing could not be more than 150,000 deaths, and subsequent reevaluations of the demographic data situated
|
1 |
Although more emphasis is given here to deaths and refugees movements, the historical account in this section borrows liberally from Chandler (1996), to which the reader is referred for more details about the political developments of the decade. For an unforgettable, personal account of the post-1975 period, see Ung (2000). For a discussion of the available demographic data, see Huguet (1992), Banister and Johnson (1993), and Heuveline (1998a). |
the death toll for the four years in the order of 300,000 or less (Banister and Johnson, 1993:87-90; Sliwinski, 1995:48).
The Khmers Rouges took Phnom Penh in April 1975. The population of the capital had swollen with the influx of about two million refugees that had moved with the front. One of the first decisions of the new Democratic Kampuchea (DK) was to empty the cities, pushing the formerly urban population on the road to rural areas with no delay or explanation. While food shortages were looming, political purposes likely motivated the decision (Chandler, 1996:210). Forced to walk along long roads, these “new people”—by opposition to rural people, referred to as “base” people in the DK revolutionary terms—began to experience what would be their lot for the four years of the DK: exhaustion, lack of food, and executions. Due to long days of physical labor, exposure to deadly malaria strains, and insufficient food rations, the mortality of the relocated “new people” was dramatic, in particular for the sick, the elderly, and youngest children. The Khmers Rouges also engaged in political and ethnic purges against those connected to the Lon Nol government and former ruling elite, the remaining ethnic Vietnamese, the Muslim Chams, and more generally all those deemed enemies of the revolution (Kiernan, 1996). Mortality increase was not contained to any specific sub-population, however. As early as 1976, food was scarce for the entire civilian population as the food produced was allocated in priority to the troops and even exported to generate revenues to pay back arms. The sanitary conditions deteriorated as clinics lost their trained medical staff and medicine supplies. Executions could punish any minor violations of the Khmers Rouges ' orders as well as internal dissension within the party ranks.
From the beginning, the DK maintained a defiant attitude toward Vietnam but the tensions escalated rapidly toward the end of 1977. After a first successful penetration into Cambodia in December 1977, followed by a voluntary withdrawal a few weeks later, Vietnamese troops entered Cambodia again at the end of 1978. This time they continued toward Phnom Penh, reaching as early as January 1979 a capital abandoned by the Khmers Rouges for the north and northwest mountains. As the Khmers Rouges retreated, many Cambodians returned to their original residence or moved to search for family members from whom they had been separated. An unfortunate consequence was that much of the crops were left untended, which combined with a drought and the lack of food stocks from previous years to create dramatic food shortages that impacted all the more a population already exhausted by years of bare subsistence. An international campaign was quickly launched to send relief to Cambodia but was hampered by a destroyed infrastructure and various bureaucratic constraints. Food supply remained deficient for most of 1979 and the famine could not be completely avoided. The most dramatic
estimates of its toll are around 500,000 deaths (Ea, 1987; Banister and Johnson, 1993; Sliwinski, 1995) but those are again contested as much too high (Kiernan, 1986).
As the DK was closed to foreigners and did not maintain national statistics, for a while no quantitative estimate of mortality during the DK was available. Some demographic data on the population of Cambodia became available in the early 1980so Suspicions about the quality of these data arose because they were mere administrative counts that served political purposes, by entering into the regional allocation scheme of international aid (Huguet, 1992). Moreover, tallying population estimates from local registers must have been quite difficult at a time of high population mobility. Better data became available in the 1990s, starting with the 1993 electoral lists (United Nations, 1995), the 1996 Demographic Survey, and the 1998 General Population Census (National Institute of Statistics, 1996; National Institute of Statistics, 1999).
Estimates were derived from these data by the methods discussed in the next section but they vary tremendously, with respect to overall mortality as well as to the particular contribution of the executions (Heuveline, 1998b). The pro-Vietnamese government of the 1980s claimed that the Khmers Rouges were accountable for three million lives. At the low end of the range, an estimate of one million victims has widely circulated in the Western press. While the figure is consistent with some demographic accounts (Ea, 1981; Vickery, 1988; Banister and Johnson, 1993), most estimates now cluster around one and a half to two million deaths (Sliwinski, 1995; Kiernan, 1996; Heder, 1997; Heuveline, 1998a). There is even more disagreement concerning the number of executions. While Ea (1981) considers they numbered at most 120,000, most analysts believe they accounted for a third to one half of excess mortality during the period, thus 500,000 to 1 million deaths (Vickery, 1988; Sliwinski, 1995; Kiernan, 1996; Heder, 1997; Heuveline, 1998a).
Many people also fled the country, most often westward to Thailand, and sometimes by sea. The number of those who survived the dangers of the sea or the landmines is relatively well recorded in refugee camps statistics. The number of refugees repatriated from Thailand by the United Nations High Commissioner for Refugees (UNHCR) on the eve of the 1993 elections 2 was nearly 400,000 (United Nations, 1995), whereas about 200,000 more refugees emigrated abroad, foremost to Australia, France, and the United States. The number of those who fled toward Vietnam and stayed there is more difficult to estimate, but except for
|
2 |
This number is higher than the number of people who had emigrated from Cambodia because of the fast population growth of the population in refugee camps (on the order of 4 percent annually). |
what was left of the ethnic Vietnamese population in 1975 (about 200,000 people), this was not the most likely destination as civilians were pushed westward by the moving military front. (For a fuller description of migration data, see Banister and Johnson, 1993.) Finally, fertility appears to have begun falling in the early 1970s, and from 1975 on, the decline has been fairly drastic. The size of adjacent age groups in the 1998 census data suggests that the annual number of births could have been reduced to between one-half to three-fourths of antebellum levels, implying a deficit in these four years in the order of 300,000 to 600,000 births.
DATA SOURCES AND MORTALITY ESTIMATION
Vital Statistics
Continuous registration of deaths is the preferred source of data when the recording is believed to be accurate and complete. Several methods can be used, depending on the nature of ancillary data, to assess the completeness of mortality registers (e.g., Chandra Sekar and Deming, 1949; Brass, 1975; Preston and Hill, 1980; for a description of these and other techniques see Preston et al., 2001).
There are reasons to doubt the availability and quality of vital statistics during mortality crises. Registration systems are typically maintained by civil servants. The crisis can be expected to disrupt the recording of vital events, either because political upheavals means a change of personnel with a period of vacancy, or because the crisis is so intense that record keeping takes a low priority. The Khmers Rouges proved to be capable of accurate record keeping as shown by the chilling records of jail administrators (Kiernan, 1996). They apparently did not attempt to achieve complete national vital statistics, however, and the demographic data they released reflected more their propaganda strategy than their statistical efforts. More reliable death statistics might be available from an external administration, such as those on refugee populations in UNHCR-administered camps. Other chapters in this volume may offer such examples. But most often, continuous recording during mortality crises should be expected to provide data that are too partial—in both meanings of the term—to be reliable.
Census Data
A general census may include questions to the household heads about the selected characteristics of any past household member deceased in the 12 months before the census. These data can occasionally provide a com-
plete count of deaths in countries without complete vital registration but accurate periodical censuses. In practice, this approach has not proved most reliable. Precisely in places where death registration is not common, respondents may not remember well the date of death and deaths can be wrongly included in or omitted from the recall period. Since the likelihood of false inclusion and omission typically vary with the age of the deceased, the age pattern of deaths thus reported is not reliable either.
This approach is even more problematic to use for the retrospective evaluation of a mortality crisis. The first reason is that it may take years after the crisis for a government to have the capacity to conduct a complete household census operation, and the longer the time elapsed since the events, the less reliable the retrospective data are. When the crisis is associated with military conflict, a census conducted shortly after the events might have to exclude some zones that are still unsafe, as was the case in Cambodia in the early 1980s (and in fact through the late 1990s). This may introduce a selection bias since such zones might have been disproportionately affected by the conflict during the period of interest. Finally, the approach implicitly assumes some stability in household membership, which may not hold when many people are displaced. The retrospective questions may instead concern a fixed set of family members, for instance, biological parents, siblings, and children, instead of household members but then this raises concerns about possible double counting, especially when mortality is very high.
Sample Survey Data
Similar retrospective questions can be asked to a sample of respondents. The sample-based approach is of course much easier to implement than the census-based one and under certain conditions the results can be confidently extrapolated to the entire population. These conditions are difficult to meet in post-crisis situations that typically prevent the use of traditional sampling procedures. This might be particularly problematic when the mortality risks and patterns vary substantially across sub-populations, as was the case in Cambodia among ethnic minorities and, among Khmers, between the new and base people, or simply across regions differently affected by the civil war. To begin with, the distribution of the Cambodian population by relevant characteristics such as those above was not that well documented at the onset of the civil war. Thus, the relative size of the different “risk groups ” can be only roughly estimated. Moreover, if the interviews take place shortly after the events, some subgroups are likely to be less accessible than others are, and the selected sample is likely to be a sample of convenience rather than a random
sample with desirable statistical properties. Often, the survey takers will be restricted to a few areas of easier access or worse, if the country is still inaccessible, to the refugee population. If the original population is universally at risk, the refugees may constitute a selected sub-population, since those who stay behind continue to be exposed to that risk. In other situations, on the contrary, the refugees might have been those most at risk and thus most likely to flee.
Another type of selection effect is that at least one of the immediate relatives of a person must be alive at the time of the survey for that person's experience (death or survival) to be recorded. In other words, the probability of inclusion in the sample is conditional on the survival of parents, children, and siblings. This introduces a bias as long as the survival probabilities of close family members are related, which was clearly the case in Cambodia as probably in most such mortality crises whichever their causes. In the event of the execution of an entire family (both parents and all their children), for instance, the death of the children could not be recorded by this method, while the death of the parents could only be recorded if one of their own parents or siblings survived. In general, those with surviving immediate relatives are more likely to have survived themselves. This “clustering” of mortality within families might be negligible under most normal conditions but becomes problematic when a sizeable share of deaths are due to politically or ethnically motivated executions or bombardment of villages.
With typically small sample sizes, double counting is probably not as important an issue as in a census-based operation. But the sample-based approach is susceptible of the same recall errors as mentioned above for the census questions. Concerning such dramatic events, it is less likely that respondents would not remember what happened or when it did since the reference recall period can be delineated by salient events. In many emergency situations, though, it is possible that respondents would not know what happened even to close family members. In Cambodia, it took years for members of dispersed families to reunite. According to Sliwinski's 1989-1991 data, 12.5 percent of the relatives reported as presumed or known to have died in 1975-1979 were in fact still missing at that time (Sliwinski, 1995:60).
The sample approach, with retrospective questions on immediate family members, has a number of methodological shortcomings. It cannot be overemphasized, however, that this is often the only technique that can be implemented by a lone investigator and a few collaborators very shortly after the mortality crisis. It thus provides invaluable preliminary estimates when other techniques are much harder and costlier to implement.
Two Population Estimates
When there are no registration or retrospective data on deaths, mortality can be estimated indirectly from relationships between different demographic variables. Most of these so-called indirect estimation techniques cannot be used in the analysis of mortality crisis because the estimation of one variable from another one relies on some empirical regularity in the relationship between the two variables across populations. These empirical regularities are embedded in demographic models that often cannot be applied to the populations of interest here, precisely because of the exceptional nature of the situations these populations have been exposed to.
One demographic relationship that applies to all populations no matter how exceptional the circumstances is often referred to as the balancing equation of population change. This accounting identity basically expresses that there are only two ways to leave a population, emigration and death, and two ways to enter it, immigration and birth. Thus the change in population size between two dates, P(t) and P(t+n), depends on four flows: births, B(t,t+n); deaths, D(t,t+n); immigration, I(t,t+n); and emigration, O(t,t+n), or
![]()
If population estimates by age and sex were available just at the beginning and the end of the period of interest, this logic could be used to study the mortality of people already born at the beginning of the period. The most common strategy is to follow birth cohorts over their life course (along diagonals in a Lexis diagram, see Figure 5-1). Equation (2) expresses that changes in the size of a birth cohort result only from migrations and deaths of cohort members:
![]()
where nPx−n(t) and nPx(t+n) are, respectively, the number of people aged x− n to x at time t and aged x to x+n at time t+n, and nDct−x(t,t+n), nIct−x(t,t+n), and nOct−x(t,t+n) are, respectively, the number of deaths, in-migrations, and out-migrations between time t and t+n of people born between time t-x-n and t-x. Equation (2) simply restricts the terms in Equation (1) to certain birth cohorts, and for those cohorts that are already born at time t, there is no fertility term in Equation (2).
If there is no migration, the remaining two terms in the right-hand side of Equation (2) correspond to the number of survivors at time t+n among the birth cohort survivors at time t. This is often expressed as a
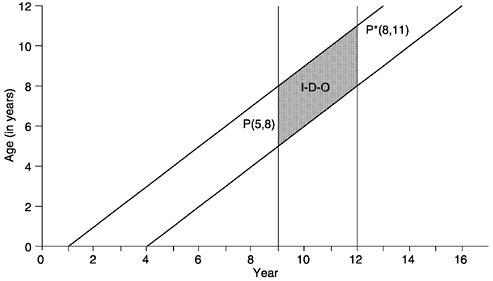
FIGURE 5-1 Illustration of the cohort-component estimation of population change. Note: P(5,8) is the population aged 5 to 8 in year 9 and P*(8,11) is the population aged 8 to 11 in year 12. I, D, and O are, respectively, the numbers of in-migrations, deaths, and out-migrations between year 9 and 12, of people born between year 1 and year 4 (with reference to time and birth cohort dropped for notational simplicity.)
life-table survival ratio, as suggested by Coale and Demeny (United Nations, 1983):
Equation (3) provides the basis of a simple method for constructing a life table for the period. 3 This approach requires that the length of the period be equal to the width of the age group or multiples thereof. This requirement can be waived with so-called variable-r techniques that compare the size of the same age group at two different times (nPx(t+n) and nPx(t) with the above notations). These techniques will not be described in details here but when the length of period is a multiple of the width of the
|
3 |
Coale and Demeny (United Nations, 1983) also suggest to work with successive open age groups (e.g., age five and above, age ten and above, etc.) rather than with closed age groups in order to minimize the effects of age misstatement at older ages. |
age group, these techniques are exactly equivalent to those based on changes in cohort size. 4
Whether the cohort or age-group approach is chosen, these techniques only estimate the mortality of those born at the beginning of the period, and the corresponding life table starts at age n, where n is the length of the crisis period. To obtain mortality estimates from birth requires data on birth during the period. Such data are often unavailable and it is also problematic to assess how much the mortality crisis might have affected reproductive behavior. In Cambodia, for instance, fertility in the worst years might have declined down to half its pre-crisis level. 5
The population totals at the onset and at the end of the events of interest, P(t) and P(t+n), are seldom directly available and need to be estimated from population data pertaining to earlier and later dates. When statistics are available and reliable up to the onset of the period, the extrapolation of the population P(t) can proceed in an additive manner from the last population size estimate and the different flows in and out of the population between the time of that last estimate and time t as in Equation (1). When these flows cannot be estimated directly, population P(t) can be best estimated by a forward projection, with the cohort-component technique detailed in standard demography textbooks (e.g., Shryock and Siegel, 1975; Preston et al., 2001). The forward projection does not require exact counts of births and deaths but instead indicators of fertility and mortality levels (e.g., total fertility rate and life expectancy at birth), together with models of fertility and mortality by age, and the initial age structure of the population. In the pre-crisis period, several indirect techniques can provide the required estimates of fertility and mortality levels from incomplete vital statistics (United Nations, 1983).
Similarly, the population at the end of the crisis period must be estimated. This can be done by calculating a backward population projection from any post-crisis population estimate. Although backward projections may be less intuitive than forward ones, the process is quite similar. The data requirements are slightly less intensive, because the number of births in a given period is implied by the number of people under a certain age alive at the end of the period and by their mortality and migration rates. Fertility rates are not needed.
If migration can be accurately estimated, these techniques can still be
|
4 |
For a description of some variable-r techniques, the reader is referred to United Nations (1983) and Preston et al. (2001). |
|
5 |
A gradual fertility reduction, reaching at its trough about 50 percent of pre-crisis fertility levels, was also observed in China (Ashton et al., 1984). For a review of demographic responses to short-term shocks, see Lee (1997:1078-85). |
used by adjusting nPx−n(t) and nPx(t+n) before entering them in Equation (3). 6 When the mortality crisis is associated with a massive displacement of people, uncertainty about population movements can make this method useless. Note, however, that only the difference between immigration and emigration during the period, in other terms the net total of migrants during the period, affects the left-hand side estimate in Equation (2).
The logic of indirect estimation using the balancing equation of population change is similar to assembling a jigsaw puzzle with a single missing piece, whose size and shape can be revealed by fitting together the remaining pieces. But most often, the other pieces can only be estimated more or less precisely, and the size and shape of the missing piece only appears fuzzy. The quality of the estimation thus depends on the precision of the other pieces of demographic information. Direct estimation with survey data is sensitive to the estimated mid-period population size that is required to translate the estimated proportion of deaths among the sample's relatives into a total number of deaths in the population. Indirect techniques with two population estimates are sensitive to the underestimation or overestimation of population size at the beginning of the period relative to population size at the end of the period, and to migration, the other cause of changes in cohort size. 7
NATURAL AND CRISIS MORTALITY PATTERNS
In this section, I discuss likely changes in mortality patterns during mortality crises. A mortality crisis is not defined exactly but it refers to a situation where mortality increases suddenly. Pre-crisis mortality trends will be referred to as “normal” mortality and the difference between the prevailing crisis mortality and the mortality extrapolated to the crisis period from normal mortality trends will be referred to as “excess” mortality. When the level of mortality increases sharply, mortality patterns can often be expected to change as well, that is, the distribution of death (by sex, by age, by cause, by region, by ethnic group, etc.) is also likely to be modified. Demographers and actuaries have long documented the
|
6 |
A common population projection strategy consists of adding half of the net number of migrants aged x to x+n in the period t to t+n to the population aged x to x+n at time t and the other half to the population aged x to x+n at time t+n. This arithmetic approximation is not entirely consistent with the projection framework based on rates but the numerical implications of this slight inconsistency are usually not important. |
|
7 |
Note that an underestimation of, say, mortality both before and after the crisis period would lead to underestimate population size at the beginning of the period (in the forward projection from census date 1) and to overestimate population size at the end of the period (in the backward projection from census date 2). |
typical sex, age, and cause-of-death patterns of normal mortality and I concentrate here on changes in these patterns during mortality crises. (For a discussion of the ethnic and regional mortality patterns during the Cambodian crisis, see Kiernan, 1996.)
Age Patterns
The time-honored tradition of studying mortality at different ages established that in most human populations mortality follows a “ J-pattern,” namely that it decreases from birth to a minimum before sexual maturity and then increases with age. Demographers have thus attempted to capture this empirical regularity in mathematical functions (mortality law) or tabular representations with few parameters that account for interpopulation variations associated with their specific environments (e.g., diet or exposure to infectious agents). In one of the most commonly used examples, Coale and Demeny (1983) system of model life tables, these variations are represented by four different “regional ” patterns. Each model pattern consists of a set of life tables, with each table providing mortality rates corresponding to a given level of mortality (i.e., a summary indicator of mortality such as life expectancy at birth).
These life tables have become central to the direct and indirect techniques of mortality estimation. Because age reporting is deficient in many populations, demographers usually prefer to assume that the age pattern is one of the existing model built from reliable sources and to concentrate on the estimation of the level of mortality. For instance, registered or reported data on deaths by age can be “smoothed ” with a model age pattern of mortality (United Nations, 1983). When using the techniques based on two population estimates, it is also suggested to select a model pattern and record the level implied by each cohort or age group. To select the model life table whose level best matches those recorded across cohorts or age groups is often thought more reliable than to put together the mortality rates obtained from each cohort or each age group.
These empirical similarities in mortality age patterns reflect human populations' common experience of so-called “natural” causes of death and are expected as long as such natural mortality dominates. Mortality also comprises “accidental” mortality—labeled as such by opposition to natural mortality—that typically includes suicide, homicide, and unintentional injuries. These causes of death—thereafter referred to as “violent” mortality—do not necessarily follow the overall J-pattern of mortality but they typically account for a small fraction of all-age deaths and do not affect the overall age pattern. In mortality crises such that the vulnerability of the population to natural mortality increases dramatically with little change in the proportion of deaths due to violent mortality, model
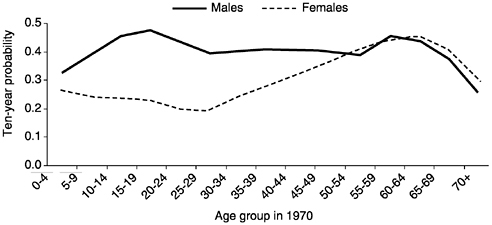
FIGURE 5-2 Sex and age pattern of mortality in Cambodia, ten-year probability of dying, 1970-1979. Source: Heuveline (1998a).
age patterns of mortality and the methods built thereon should still be applicable. Model life tables based on data from medium-to-low mortality populations do not seem to provide a very good extrapolation of mortality patterns under higher mortality conditions (Bhat, 1987), however, and the analyst should preferably turn to model age patterns specifically designed for high-mortality populations (Preston et al., 1993).
On the contrary, when violent mortality becomes an important part of overall mortality, the mortality pattern may have little in common with the nearly universal J-pattern and model age patterns cannot be used. Figure 5-2, for instance, presents the age pattern of excess mortality estimated for Cambodian males and females during the 1970s. These age patterns of mortality, especially the male one, bear no resemblance with any model age pattern. This finding is not particularly surprising since wartime life tables are typically excluded from the empirical basis on which the model age patterns are constructed (e.g., Coale and Demeny, 1983). The reason is precisely that the age pattern of war-related deaths differs from that of natural mortality and reflects idiosyncratic conditions at a particular time and place that should not be generalized to other populations.
Decomposition by Cause
Existing model age patterns of mortality can not be used to assess and improve the quality of such an unusual age pattern of mortality as shown in Figure 5-2 . But the unusual aspect of this age pattern is also useful because the departure from the original pattern is caused by the rise of a few formerly rare causes of death, typically associated with the mortality
crisis. Mortality age patterns thus reflect the prevalence of different causes of death in the population (Preston, 1976) and below I discuss an approximate breakdown between mortality from natural causes from violent causes. A simpler decomposition between normal and excess mortality is presented first.
The idea of both decompositions is to return to Equation (2) but to further decompose the number of deaths, D(t,t+n), as the sum of a first component that one can estimate, D*(t,t+n), and a residual component that one tries to estimate, E(t,t+n). In the case of a mortality crisis, for instance, we could estimate the number of excess deaths from change in population size and other flows during the period, including the number of deaths due to normal mortality, as shown in Equation (4):
![]()
where E(t,t+n) is now the number of excess deaths and D*(t,t+n) the expected number of deaths under normal mortality conditions in the period t to t+n.
Just as Equation (3) restricts Equation (2) to certain birth cohorts, Equation (4) can be applied separately to different birth cohorts, an approach developed originally to estimate international migration (Shryock and Siegel, 1975:595-6):
![]()
where n∆x(t+n) is the residual difference at time t+n among people aged x to x+n, that is, a residual term in the forward projection of nPx−n(t) to time t+n. The residual term is not exactly the number of people who died from excess mortality or migrated during the period. It is more exactly the number of people missing (in case of excess mortality or predominantly out-migration) at the end of the period. In a growing population, the residual term at the end of the period overestimates the additional deaths or migrations because the number of people added to (or subtracted from) the population during the period contributed to (or would have contributed to) the growth of the population till the end of the period. A numerically satisfactory solution suggested by Shryock and Siegel is to also compute:
![]()
and to take the average of n∆x(t) and n∆x(t+n) as the net number of excess deaths or migrations of people aged x to x+n in the period.
As in the case of total mortality estimation, the assessment of excess mortality can be implemented by age groups rather than by cohorts. This approach was introduced, again in the context of international migration,
by Hill (1987), who also discusses the advantages and disadvantages of the two approaches. For either approach to be applied to a decomposition of mortality, the beginning and the end populations must be adjusted for international migrations using ancillary data.8 Then, survival ratios must be selected to represent either normal or natural mortality. The selection of normal mortality survival ratios can be based on a simple extrapolation of pre-crisis mortality trends. The residual number of deaths is readily interpreted as excess mortality.
A second decomposition, based on the same logic, is perhaps less compelling, but it considers two main types of death during the mortality crisis. The first type corresponds to the stark increase in natural mortality and includes all biological causes of death that became more prevalent because of a combination of harder environment (e.g., in Cambodia, malaria, sanitation in general), a weakened population (e.g., physical labor, food deficiency), and a near absence of medical remedies. The second one corresponds to violent mortality, which in Cambodia included war casualties such as combat deaths, bombardment or mines victims, and executions. To the extent that the pattern of the first type of mortality bears some similarity with age patterns of normal mortality embodied in the existing model age patterns while the pattern of the second type of mortality does not, a decomposition might be attempted based on the age structure of overall mortality.
The idea of this decomposition is thus to simulate the increase of natural mortality by selecting the model age pattern of mortality with the highest mortality level (e.g., lowest survival ratios) consistent with the pre- and post-crisis population data. This natural mortality pattern replaces normal mortality in Equations (5a) and (5b), and the new residual difference now corresponds to violent deaths only, instead of all excess deaths. The highest possible level is obtained when all deaths are accounted for in a given cohort (a higher mortality level would then predict too few people at the second date among that cohort). In other age groups, residual numbers of deaths remains positive and refer to deaths that could not be explained by an increase in natural causes of death. On the one hand, some natural deaths are likely to remain in the residual component because the actual pattern of natural mortality may have deviated from the model pattern. On the other hand, it is unlikely that any age group
|
8 |
Just like the mortality estimation techniques, the decompositions are sensitive to the relative underestimation of population size at one time relative to its size at the other time. Hill (1987) suggests a technique to separate the relative underestimation from international migration. This technique can be applied to excess mortality but would work better the more the age pattern of excess mortality differs from the expected age pattern of relative underestimation. |
experienced no violent mortality at all and the decomposition pushes natural mortality to its lowest possible level. Even though these two possible biases would partially compensate one another, the decomposition is only indicative of the relative share of the two mortality types.
It is not entirely clear a priori whether deaths from famine should be considered part of natural mortality in this decomposition. On one hand, they could be considered separately because it is a category of death virtually absent under normal conditions that in Cambodia, for instance, rose to 35.4 percent of all reported deaths according to survey data (Sliwinski, 1995). On the other hand, famine may be considered as the extreme form of malnutrition, which intertwines with natural causes-of-death (e.g., Martorell and Ho, 1984). Since the decomposition is based on the difference in age patterns, the answer depends mostly on whether the age pattern of famine mortality is similar to that of natural mortality.
Famine mortality has been observed to most affect the youngest (after weaning) and the oldest persons, during European famines (e.g., Lebrun, 1971) as well as during more recent ones in Asia (Ashton et al., 1984; Maharatna, 1996). The observation is sustained by data collected by Sliwinski (1995) from Cambodian survivors about their relatives that died, with death reported in one of five categories: natural causes, famine, execution, war-related injuries, and missing (or unknown cause). As expected, the pattern of natural mortality follows the usual J-pattern even in these exceptional circumstances ( Figure 5-3 ). The last three categories correspond to violent mortality (people still “missing” at the time of the survey ten years later had likely been executed without the knowledge of their immediate relatives, an assumption supported by the similar age patterns of the two categories). Among those, executions constitute the most frequent category, with 37.5 percent of all reported deaths, and they exhibit an age pattern quite distinct from that of natural mortality by peaking during adulthood (war-related injuries, a lesser category not shown on Figure 5-3 , do so at even younger adult ages). Mortality due to natural causes and mortality due to famine mortality also have similar patterns, except that famine mortality continues to decrease into adulthood. This translation of the mortality minimum between natural causes and famine might be due to a particular feature of the social organization of the DK, namely that food rations were allocated based on the perceived value of the individual to the society. Soldiers were a priority and productive adults in general received more appropriate food than children did.
ESTIMATIONS OF EXCESS MORTALITY IN CAMBODIA
Vital registration statistics in Cambodia were already incomplete before the 1970s but they were interrupted during the DK. As for direct
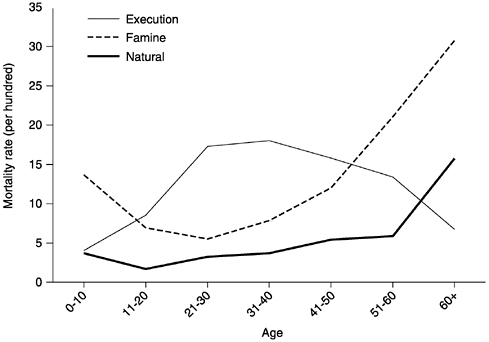
FIGURE 5-3 Age pattern of mortality from natural causes, famine, and execution in Cambodia, mortality rate, 1975-1979. Source: Adapted from Sliwinski (1995: 52, 82).
census data on excess mortality, questions were included in an early 1980s administrative census. They resulted in an estimate of 3.3 million deaths, a tally inflated by multiple counts, the number of which could never be fully accounted for, as the records were not computerized and name matching almost impossible. Moreover, parts of the country not under governmental control could not be included, and those typically included sparsely populated but high mortality zones.
Estimation from Survey Data
Direct estimation has been mostly based on small sample survey data. As early as 1979, Ben Kiernan interviewed about 100 Cambodian immigrants in France and followed with about 400 interviews in Cambodia in 1980. Similarly, Stephen Heder conducted interviews in parts of Cambodia and at the Thai border in 1980 and 1981, obtaining separate estimates of relative loss for Khmer and ethnic Chinese “new” people (33 percent and 50 percent, respectively), and for Khmer “base” people (25 percent). Operating shortly after the fall of the DK, when many parts of the country
were still unsafe, the authors must have limited themselves geographically. In spite of their efforts to stratify their estimates by reaching different segments of the population, the representativeness of their sample is difficult to assess. Even a decade later (1989-1991) when Marek Sliwinski undertook a more thorough and methodologically sophisticated study of the dead relatives of Cambodian survivors in France, in Thai border camps, and in Cambodia, safety and logistical considerations constrained his Cambodian sample to a 100-mile radius from the capital city.
In spite of the methodological shortcomings of the approach described in a section above, it is quite remarkable that both Kiernan and Heder first came up with an estimate of around one and a half million excess deaths with rudimentary techniques and what may appear to the statistically inclined reader as “cavalier” adjustments. Yet, more extensive data collected a decade or more later and with greater methodological care (1989-1991 interviews analyzed by Sliwinski; 1992-1993 electoral data analyzed by Heuveline) provided slightly higher but roughly comparable estimates. The reason is probably that a deep understanding of the local situation guided the intuition of the first authors and allowed them judicial adjustments regardless of how little justified they may appear to be on paper.
Estimation from Two Population Estimates
Several analysts have used this method to estimate excess mortality during the peak mortality period, the four years of the DK, 1975-1979 (Ea, 1981; Vickery, 1988; Banister and Johnson, 1993). All used the 1962 census to reach a population estimate for 1975 and some population data in the early 1980s (different across authors) to derive the 1979 estimate. While the authors seem to agree about a figure of excess deaths around one million, they faced several difficulties. The first one is the unreliability of the 1975 estimate thus obtained. While the population can be reasonably extrapolated from the 1962 census to 1970, the events of the early 1970s render perilous the estimation of the 1975 population that would be required to study excess mortality during the DK.
The second one relates to concerns about the reliability of the early 1980s data used by these authors. This is best illustrated by the different mid-1980 population size estimates that, in the early 1990s, still ranged from 5.7 million (U.S. Bureau of the Census, 1991:A-5) to 7.0 million (Banister and Johnson, 1993:91-3). The controversial extent of the 1979 famine poses an additional problem to the retroprojection of the population at the fall of the DK in January 1979 from population estimates in the early 1980s.
The third difficulty concerns the estimation of births in the 1975-1979 period. Even with the most recent census data (unavailable to the above
authors at the time), the extent of the fertility decline can only be assessed with a fairly high level of uncertainty because the mortality conditions the 1975-1979 birth cohorts faced until the 1998 census date are not precisely known either. This uncertainty about the exact number of births (in the order of 300,000) is not at all negligible in the reconstruction since the number of deaths estimated by these authors is about one million.
As was the case with the direct methods, we must bear in mind that in spite of these limitations, the first attempts to use indirect techniques of analysis provided invaluable information on the Cambodian mortality crisis. Contrary to the situation with direct methods, though, the early estimates thus obtained disagree substantially with more recent estimates. While the early direct estimates clustered around one and a half million excess deaths, the early indirect estimates centered around one million victims. Later data led Sliwinski (1995) to a direct estimate of 1.9 million, and a reconstruction using the 1993 data yielded a central estimate of more than two million excess deaths (Heuveline, 1998a). While in any of those numerical attempts, the uncertainty is such that other estimates cannot be entirely ruled out, the estimates of one and a half million and above now appear more likely (Heuveline, 1998b).
In contrast with these previous studies also based on two population estimates, I based my analysis of Cambodian excess mortality on a 1970 population estimate and a 1980 population estimate, and I used this approach to assess excess deaths for the entire decade of the 1970so I believe it is as accurate and more transparent to work from that estimate and subtract ancillary estimates of the death toll of the civil war and of the famine in order to obtain a tally for the DK years only. In addition, I reconstructed post-1980 trends from the electoral data gathered by the United Nations in the process of organizing the 1993 general elections (United Nations, 1995). Data of this nature are not among the typical sources of demographic analysis but those appeared to be the first national data after 1980 to be of reasonable quality and available by single year of age. In general, using data for a later date imposes to carry the backward projection on a longer time interval, which increases the uncertainty of the projected outcome. But in this particular case, it was balanced by the fact that it was easier to estimate net international migration between 1979 and 1993 than it was up to the mid-1980s, when refugee movements were still taking place.
Since the interval was ten years and the age groups five years wide, the cohort and age groups approaches were equivalent. The decomposition of normal and excess mortality is easier to conduct using the cohort approach than the age-group one because the former has been incorporated in population projection software. Since many estimates were not estimated with precision, this flexibility proved useful as it allowed for
many different projections with different demographic parameters, whose outcomes mapped the range of possible estimates of excess deaths. The possibility to obtain not only a central or best estimate in the analyst's judgment, but also a sense of the uncertainty involved in the reconstruction, is a comparative advantage of the indirect approach. My specific assumptions are described below.
As in earlier studies, I began with an assessment of the 1962 census data to obtain an adjusted population sex and age structure and indirect estimates of fertility and mortality at the time (Migozzi, 1973; Siampos, 1970; Heuveline, 1998a). From 1962 to 1970, demographic trends can be assumed to be smooth: a slight decline of mortality over the period, constant fertility, and no international migration. The population by sex and five-year age groups can then be projected forward five years at a time. This yields the 1967 and 1972 populations by sex and five-year age groups, from which the January 1, 1970, population by sex and five-year age groups can be interpolated. The results, shown in Table 5-1 , suggest that the population size had grown fast, from 5.7 million in 1962 to 7.7 million in 1970. For the backward projection, the population by sex and five-year age group in 1993 can also be projected backward five years at a time. An interpolation between the 1978 and 1983 estimates yields the January 1, 1980, estimates. 9 Mortality data after 1980 were poor and I simply assumed that mortality returned to its normal level quickly after the 1979 famine and resumed its pre-crisis declining trend thereafter, apparently a common feature in post-crisis situations (Murray and Chen, 1994:18). 10
Important migrations to and from Vietnam were also poorly documented. The impact of these undocumented immigrants on the population reconstruction is limited because the 1993 electoral law barred most of the new migrants from Vietnam from registering; therefore, those who were able to register were mostly returning migrants. The timing of those movements back and forth during the period 1980-1993 may affect the population size at a given date within the period, but as mentioned earlier, the 1980 population size estimated backward from 1993 data depends only on the net number of migrants between 1980 and 1993. The same applies to the impact of the refugees to and back from Thailand,
|
9 |
Only the population above age 18 was registered in the electoral data. The 1993 population is thus limited to age 20 and above. The 1978 and 1983 population estimates are limited to age five and above and ten and above, respectively. The interpolated 1980 population is thus also limited to age ten and above. This is sufficient to assess the survival of the 1970 population. |
|
10 |
In particular, this seems to have been the case in Vietnam (Banister, 1993; Barbieri et al., 1995). The situation of Vietnam is of further interest because of the similar public infrastructure in the two countries since 1980. |
TABLE 5-1 Population, 1970 and 1980 and Residual Population Deficit in the 1970-80 Interval, by Age and Sex (in Thousands)
|
1970 Population |
1980 Population |
Forward Projection Residual |
Backward Projection Residual |
Excess deaths |
||||||
|
Age in 1970 |
Males |
Females |
Males |
Females |
Males |
Females |
Males |
Females |
Males |
Females |
|
0-4 |
715.7 |
691.2 |
455.9 |
450.6 |
225.4 |
178.4 |
233.8 |
182.6 |
229.6 |
180.5 |
|
5-9 |
582.0 |
564.0 |
564.5 |
548.5 |
221.3 |
134.5 |
227.2 |
134.9 |
224.3 |
134.7 |
|
10-4 |
490.2 |
479.2 |
435.0 |
461.6 |
216.4 |
110.3 |
224.5 |
110.9 |
220.4 |
110.6 |
|
15-9 |
411.8 |
404.6 |
325.4 |
396.0 |
187.3 |
91.6 |
196.3 |
92.6 |
191.8 |
92.1 |
|
20-4 |
313.5 |
311.8 |
241.4 |
338.6 |
131.1 |
60.0 |
138.1 |
60.6 |
134.6 |
60.3 |
|
25-9 |
244.9 |
249.8 |
194.1 |
284.8 |
93.3 |
47.4 |
98.6 |
48.0 |
95.9 |
47.7 |
|
30-4 |
214.0 |
223.5 |
157.4 |
228.1 |
81.8 |
53.3 |
87.4 |
55.1 |
84.6 |
54.2 |
|
35-9 |
191.6 |
199.3 |
130.6 |
182.0 |
73.6 |
54.7 |
80.1 |
57.8 |
76.8 |
56.3 |
|
40-4 |
166.6 |
169.2 |
111.9 |
150.6 |
63.1 |
51.9 |
70.6 |
56.1 |
66.9 |
54.0 |
|
45-9 |
135.9 |
138.6 |
96.8 |
125.2 |
49.9 |
47.3 |
58.3 |
53.0 |
54.1 |
50.1 |
|
50-4 |
111.5 |
114.5 |
81.0 |
98.2 |
38.1 |
42.3 |
47.7 |
49.9 |
42.9 |
46.1 |
|
55-9 |
91.0 |
94.3 |
62.7 |
72.0 |
34.2 |
36.0 |
47.5 |
46.0 |
40.8 |
41.0 |
|
60-4 |
69.1 |
72.3 |
48.3 |
51.7 |
22.8 |
26.2 |
37.0 |
38.2 |
29.9 |
32.2 |
|
65-9 |
48.6 |
51.7 |
29.6 |
35.5 |
11.8 |
14.5 |
24.2 |
26.4 |
18.0 |
20.5 |
|
70+ |
52.5 |
59.5 |
36.3 |
42.7 |
5.0 |
7.3 |
21.6 |
28.0 |
13.3 |
17.7 |
|
Total |
3838.8 |
3823.6 |
2971.1 |
3466.1 |
1454.9 |
955.7 |
1592.9 |
1040.1 |
1523.9 |
997.9 |
|
Source: Author's estimates. See Heuveline (1998a) for further details about projectionparameters. |
||||||||||
even though those would be easier to estimate yearly. Finally, the emigration of people who did not return to Cambodia by 1993 is mostly captured in the immigration statistics of receiving countries (about 250,000 after 1980). Data on the sex and age distribution of these migrants were too sketchy to use. Model age patterns of migration (Rogers and Castro, 1981) represent migration movements driven by single adults in the labor force and are not applicable when most moves are by entire families. Consistent with limited data from the refugee camp (Lynch cited in Banister and Johnson, 1993:112), the age- and sex-structure of the migrants was assumed to be that of the total population.
Even though demographic data was partly deficient to assess the post-1980 trends at the time of my analysis, more appropriate data from the 1996 Demographic Survey supported the outcomes of the backward projection. Huguet (1997) reconstructed post-1980 population dynamics with the advantage of these better data and estimated a mid-1980 population size that was 1.7 percent higher than my population size estimated for January 1, 1980 ( Table 5-1 ).
That a population that had grown from 5.7 million to 7.7 million in less than eight years (from April 1962 to January 1970) was down to 6.4 million ten years later (in January 1980) clearly establishes the dramatic demographic impact of the 1970s. To more precisely estimate the number of excess deaths by 1970 age groups, each five-year cohort is projected forward from 1970 to 1980 and compared with its estimated size in 1980. The projection is based on normal mortality, simply extrapolated from the pre-1970 mortality trends, with about 200,000 emigrants to Vietnam between 1970 and 1975, and another 150,000 between 1975 and 1980. The residual of 2.41 million people, as shown in Table 5-1 , can now be attributed to the number of excess deaths among people born in 1970. These numbers can then be averaged with similar numbers obtained by retroprojecting the 1980 population back to 1970 by cohorts (above age ten). The result is slightly higher in this case (2.63 million) and the average of the two provides our estimate of excess deaths as 2.52 million for the decade. 11 Each parameter can be varied from its minimum to its maximum plausible value, yielding a range of 1.17 million to 3.42 million excess deaths for the decade.
To obtain the number of excess deaths corresponding strictly to the DK years requires ancillary estimates. As mentioned in a section above, 300,000 might be a reasonable estimate of the mortality impact of the
|
11 |
As noted earlier, in a population that is growing, the residual based on the backward projection to the earlier population underestimates the actual number during the period, while the forward projection to the later population overestimates it. The contrary is happening here because population actually decreased between 1970 and 1980. |
1970-1975 civil war, while a similar number might also be reasonable for the impact of the famine, although the range of estimates for the latter is quite wide. Finally, the excess mortality of those born after 1970 (not included in Table 5-1) is quite difficult to estimate because of the uncertainty about fertility. Its meaning is perhaps not intuitive either, since excess deaths have been defined as the difference between the actual number of deaths and the number of deaths predicted under normal demographic conditions. Thus, if fertility was halved and child mortality doubled, the number of excess deaths among these birth cohorts might be zero. In my best judgment, a rough approximation of the number of excess deaths for the 1970-1979 births might also be 300,000. 12 Combining a central estimate of 2.5 million for the decade, and approximations of 300,000 each for the mortality impact of the civil war, the death toll of the 1979 famine, and mortality of the 1970-1978 cohorts yields an estimate of 2.2 million excess deaths for the four years of the DK.
A Decomposition by Cause
The decomposition between natural and violent mortality was reached by modeling natural mortality using the high-mortality pattern in Preston et al. (1993) life tables corresponding to life expectancies at birth for both males and females to 12 years.13 The corresponding pattern is shown in
|
12 |
Table 5-1 shows about 400,000 excess deaths in the youngest five-year age groups and Figure 5-1 shows that the excess mortality rate is going up for males and down for females at the youngest ages. We may thus assume that under the same fertility and mortality conditions, the number of excess deaths among the next cohorts would also be in the order of 400,000 for each five-year birth cohort. But the 1970-1975 birth cohorts might have been about 20 percent smaller because of reduced fertility in the period, and by 1975 their cohort size relative to earlier cohorts might have been reduced further because of the 1970-1975 mortality increase that affected the youngest ages most. Thus among the 1970-1975 birth cohorts, the total number of deaths between 1975 and 1979 was reduced by perhaps 25 percent or more, and excess deaths, as defined here, probably fell below 300,000 for those cohorts. A similar reasoning suggests that the number of excess deaths should not be very large among the 1975-1978 birth cohorts. First, the initial size of these cohorts might have been reduced by as much as 50 percent. Then, normal mortality is also higher among these cohorts than among earlier cohorts whose members were older in the period (because normal mortality declines from birth to late childhood). |
|
13 |
This estimate of life expectancy at birth accounts only for natural mortality causes (including famine) and refers to the 1975-1979 period only. An estimate of life expectancy including all causes of death can be derived by age-specific growth rates method (Preston and Bennett, 1983) for the 1972-1979 period, the shortest period for which reasonable estimates of starting and ending populations can be obtained by age and sex. The corresponding life expectancies at age five are 14.4 years for males and 22.0 years for females. Maximum estimates of life expectancy at birth during the DK period can be obtained for each sex by combining the 1972-1979 expectancy at age five with the 0-5 mortality corresponding to a life expectancy at birth of 12 years in the Preston et al. (1993) life tables. The resulting estimates, 6.6 years for males and 10.9 years for females, likely overestimate life expectancy at birth during the DK. First, they do not account for violent mortality from birth to age five, and second, beyond age five they are based on averages for the 1972-1979 period while mortality was most intense between 1975 and 1978. |
Figure 5-4 , together with the pattern of residual mortality. The decomposition yields plausible results, including a residual number of violent deaths of 1.1 million deaths for the 1975-1979 period. This estimate is one half of the total number of excess deaths during the DK estimated above, a proportion consistent with direct reports about causes of death (Heder, 1997; Sliwinski, 1995). The residual age pattern is also plausible overall. Male violent mortality exceeds female violent mortality in adulthood, especially for younger adults. The male age pattern clearly exhibits a peak for men in their teens in 1970 (seven years older, on average, during the DK). More surprising is the female violent mortality peak in older adulthood, matching male mortality. As the elite of the former government was initially the prime target of the Khmers Rouges, a mortality peak in those ages is plausible even though executions became less and less confined to that group. A second surprising finding is the violent mortality rate of children. It is possible that these high rates indeed reflect the residual mortality of the children of adult victims, especially their youngest children. A less sinister explanation would be the relative underestimation of the natural mortality of children (under age 15) compared to that of young adults. Our model age pattern of natural mortality is lowest for the 10- to 14-year olds, but as discussed above their mortality might actually be higher than that of young adults under famine conditions. 14
In closing, I must apologize for spending so much more space on my own efforts to assess what happened in Cambodia during the 1970s. This bias reflects no belief that these efforts were more successful than others were. As argued elsewhere (Heuveline, 1998b), the uncertainty surrounding any single attempt is too large to attach much confidence to any single
|
14 |
Of course, the possibility of bad data always provides alternative explanations. Too many excess deaths would be produced by overestimating the size of the cohort in 1970 and underestimating its size in 1980. For the cohorts under age 10 in 1970, a large underestimation in 1980 is unlikely. The reasons are first that these people were aged 23 to 33 during the 1993 electoral registration, ages that are believed to have been comparatively well registered. Second, the normal mortality of young adults is low and thus the results of the backward projection from 1993 to 1980 show little sensitivity to the mortality assumptions made for the period. An overestimation of the size of these cohorts in 1970 might be produced by overestimating fertility and underestimating mortality between 1962 and 1970. In my estimation, the lowest plausible fertility and highest plausible mortality assumption would reduce the number of excess deaths among 1960-1970 birth cohorts by a third, still more than 500,000. For a fuller discussion of results elasticity to the different parameters of the demographic reconstruction, see Heuveline (1998a). |
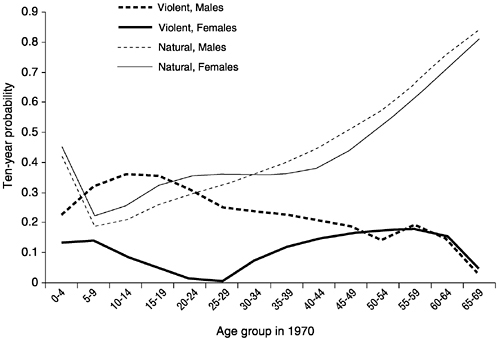
FIGURE 5-4 Sex-, age-, and cause-specific pattern of mortality in Cambodia, ten-year probability of dying, 1970-1979. Source: Adapted from Heuveline (1998a) and Preston et al. (1993).
estimate. In the end, it is rather from the limited convergence of some of these independent attempts that a sense of confidence might be gained. The disproportionate emphasis resulted from wanting to describe the different considerations and difficult decisions that the analyst must face to customize existing techniques to the available data and the expected pattern of mortality crisis, while being of course most familiar with those involved in my own work.
How can the available estimates and techniques be improved? New data can always be collected. The 1998 General Census of Cambodia will contribute to refine the estimation of the post-1980 trends. As the country becomes more accessible a small team of dedicated investigators may collect better survey data before survivors' memory begin to decline (see for instance, a related study in Vietnam by Hirschman et al., 1995). Perhaps mortality models that have proved so useful to estimate “normal” mortality in populations with poor data could also be developed for mortality crises. The example of Cambodia suggests that a general pattern would not be applicable to all situations, but models could probably be developed to fit a typology of such crises as one might emerge from this
volume. Preston et al. (1993) already developed a model of high mortality that may apply to crises characterized primarily by a rise in infectious diseases, 15 as may affect refugees or urban populations when basic services have collapsed. As mentioned above, data on famine mortality appears to show a consistent pattern, close to the former one, except perhaps for young adults. A third distinct pattern is that of war casualties, which predominantly affects young adult males. This pattern will be more manifest the more those casualties are confined to combatants. In the case of Cambodia, military and political violence affected civilians as well through bombardments, landmines, and widespread executions. This fourth set of causes of death was probably less distinctly age patterned and made the characterization of the Cambodian mortality pattern of the 1970s even more difficult.
REFERENCES
Ashton, B. , K. Hill , A. Piazza , and R. Zeitz 1984 Famine in China, 1958-61 . Population and Development Review 10(4) : 613-645 .
Banister, J. 1993 Vietnam: Population Dynamics and Prospects, Indonesia Research Monograph 6 . Berkeley : Institute of East Asian Studies, University of California at Berkeley .
Banister, J. , and E. Paige Johnson 1993 After the Nightmare: The Population of Cambodia . Pp. 65-140 in Benedict Kiernan, ed. , Genocide and Democracy in Cambodia: The Khmer Rouge, the United Nations and the International Community . New Haven : Southeast Asia Studies, Yale University .
Barbieri, M. , J. Allman , B.S. Pham , and M.T. Nguyen 1995 La situation demographique du Viet Nam . Population 50(3) : 621-652 .
Bhat, M.P.N. 1987 Mortality in India: Levels, Trends, and Patterns . Unpublished Ph.D. Dissertation, University of Pennsylvania .
Brass, W. 1975 Methods for Estimating Fertility and Mortality from Limited and Defective Data . Chapel Hill, NC : Carolina Population Center, Laboratories for Population Studies .
Chandler, D.P. 1996 A History of Cambodia . 2nd ed., updated ed. Boulder , Colorado and Oxford , U.K. : Westview Press .
Chandra Sekar, C. , and W.E. Deming 1949 On a method of estimating birth and death rates and the extent of registration . Journal of the American Statistical Association 44(1) : 101-115 .
Coale, A.J. , and P. Demeny 1983 Regional Model Life Tables and Stable Populations . 2nd ed. with Barbara Vaughan . New York : Academic Press .
|
15 |
These models are based on the mortality experience of American immigrants to Liberia in the 19th century. The cause of death most responsible for their extremely high mortality was malaria infection. |
Ea, M.T. 1981 Kampuchea: A country adrift . Population and Development Review 7(2) : 209-228 .
1987 Recent Population Trends in Kampuchea . Pp. 3-15 in David A. Ablin and Marlowe Hood, eds. , The Cambodian Agony . Armonk, New York : M. E. Sharpe .
Heder, S. 1997 [ Personal communication ].
Heuveline, P. 1998a “Between one and three million”: Towards the demographic reconstruction of a decade of Cambodian history (1970-79) . Population Studies 52(1) : 49-65 .
1998b L'insoutenable incertitude du nombre: Estimation des décès de la période Khmer Rouge . Population 53(6) : 1103-1118 .
Hill, K. 1987 New approaches to the estimation of migration flows from census and administrative data sources . International Migration Review 21(4) : 1279-1303 .
Hirschman, C. , S. Preston , and M.L. Vu 1995 Vietnamese casualties during the American War: A new estimate . Population and Development Review 21(4) : 783-812 .
Huguet, J. 1992 The demographic situation in Cambodia . Asia-Pacific Population Journal 6(4) : 79-91 .
1997 The Population of Cambodia, 1980-1996, and Projected to 2000 . Phnom Penh, Cambodia : United Nations Population Fund for the National Institute of Statistics, Ministry of Planning .
Kiernan, B. 1986 Review essay: William Shawcross, declining Cambodia . Bulletin of Concerned Asian Scholars 18(1) : 56-63 .
1989 The American bombardment of Kampuchea, 1969-1973 . Vietnam Generation 1(1) : 4-42 .
1996 The Pol Pot Regime . New Haven and London : Yale University Press .
Lebrun, F. 1971 Les hommes et la mort en Anjou aux XVIIe et XVIIIe siècle: Essai de démographie et de psychologie historiques . In Civilisations et Societés 25 . Paris and La Haye : Mouton .
Lee, R.D. 1997 Population Dynamics: Equilibrium, Disequilibrium, and Consequences of Fluctuations . In Mark R. Rosenzweig and Oded Stark, eds. , Handbook of Population and Family Economics, vol. 1B . Amsterdam : Elsevier Science B.V.
Maharatna, A. 1996 The Demography of Famines: An Indian Historical Perspective . Delhi : Oxford University Press .
Martorell, R. , and T.J. Ho 1984 Malnutrition, Morbidity, and Mortality . In W. Henry Mosley , and Lincoln C. Chen, eds. , Child Survival: Strategies for Research. Population and Development Review 10(Supp.) : 49-68 .
Migozzi, J. 1973 Cambodge: Faits et problèmes de population . Paris : Editions du Centre National de la Recherche Scientifique .
Murray, C.J.L. , and L.C. Chen 1994 Dynamics and patterns of mortality change . Pp. 3-23 in Lincoln C. Chen , Arthur Kleinman , and Norma C. Ware, eds. , Health and Social Change in International Perspective, Harvard Series on Population and International Health . Cambridge, MA : Harvard University Press .
National Institute of Statistics 1996 Demographic Survey of Cambodia: General Report . Phnom Penh, Cambodia : United Nations Population Fund for the National Institute of Statistics, Ministry of Planning .
1999 General Population Census of Cambodia 1998: Final Census Results . Phnom Penh, Cambodia : United Nations Population Fund for the National Institute of Statistics, Ministry of Planning .
Preston, S.H. 1976 Causes of Death and Age Patterns of Mortality . Pp. 89-119 in Samuel H. Preston , Mortality Patterns in National Populations, With Special Reference to Recorded Causes of Death . New York , San Francisco , London : Academic Press .
Preston, S.H. , and N.G. Bennett 1983 A census-based method for estimating adult mortality . Population Studies 37(1) : 91-104 .
Preston, S.H. , P. Heuveline , and M. Guillot 2001 Demography: Measuring and Modeling Population Processes . Oxford, England : Blackwell Publishers .
Preston, S.H. , and K. Hill 1980 Estimating the completeness of registration data . Population Studies 34(2) : 349-366 .
Preston, S.H. , A. McDaniel , and C. Grushka 1993 New model life tables for high-mortality populations . Historical Methods 26(4) : 149-159 .
Rogers, A. , and L.J. Castro 1981 Model Migration Schedules . Laxenburg, Austria : International Institute for Applied Systems Analysis .
Shryock, H.S. , and J.S. Siegel 1975 The Methods and Materials of Demography . Washington, D.C. : U.S. Government Printing Office .
Siampos, G.S. 1970 The population of Cambodia, 1945-1980 . Milbank Memorial Fund Quarterly 48 : 317-360 .
Sihanouk, N. 1986 Prisonnier des Khmers Rouges . Paris : Hachette .
Sliwinski, M. 1995 Le génocide Khmer Rouge: Une analyse démographique . Paris : L'Harmattan .
Ung, L. 2000 First They Killed My Father: A Daughter of Cambodia Remembers . New York : HarperCollins .
United Nations 1983 Manual X: Indirect Techniques for Demographic Estimation . New York : United Nations .
1995 United Nations in Cambodia . New York : United Nations .
U.S. Bureau of the Census 1991 World Population Profile, 1991 . Washington, D.C. : U.S. Government Printing Office .
Vickery, M. 1988 How many died in Pol Pot's Kampuchea? Bulletin of Concerned Asian Scholars 20(1) : 70-73 .


