
2
The Evolution of Mortality Among Rwandan Refugees in Zaire Between 1994 and 1997
Dominique Legros, Christophe Paquet, and Pierre Nabeth
INTRODUCTION
The civil war and the genocide that occurred in Rwanda between April and July 1994 killed an estimated 500,000 to 800,000 people. As a consequence, approximately 1 million Rwandans were internally displaced and 1.2 to 1.5 million fled to neighboring countries. Among the latter, probably 1 million settled in Eastern Zaire, in camps located in the Kivu provinces, along the border with their country of origin.
The influx of refugees in Goma, in the North Kivu province of Zaire, between July 14 and July 18, 1994 was considerable: between 500,000 and 850,000 persons, mostly from the Hutu ethnic group, crossed the border in a 5-day period (Millwood, 1996). During the first weeks of the emergency the mortality rates were very high, but very rapidly, by September 1994, after huge resources had been channelled to the area, the situation stabilized and mortality rates fell dramatically.
In the following period, most of the external assistance consisted of improving the health situation of the refugees by trying to reach international standards, particularly in terms of water supply, latrine construction, and food distribution. However, the situation remained very unsafe as the former Rwandan army (Forces Armées Rwandaises, or FAR) and the Interhamwe militia were active in the camps, preparing for military action. Protesting against insecurity and the indirect support they perceived was being given to the perpetrators of the genocide, some agencies withdrew all their personnel and assistance in November 1994.
In spite of this spectacular action, the situation remained unchanged in the camps until the emergence of the Alliance des Forces Démocratiques de Libération du Congo-Zaire (AFDL) movement in September 1996 in South Kivu. Laurent D. Kabila led this movement of rebellion against the Zairean state with the support of the governments of Uganda, Rwanda, and Burundi. The support to Kabila was a good opportunity for the government of Rwanda to eliminate the threat at its Western border represented by the refugee camps of Kivu.
In an attempt to evacuate the camps and force the refugees back to Rwanda, AFDL and its allies attacked the camps of Kivu between October and November 1996. As a result, around 900,000 refugees went back to their country of origin, while the remaining (including the ex-FAR) refugees fled into Zaire in an attempt to escape the AFDL forces which were heading towards Kinshasa. For some of them, this second forced migration in their country of asylum would last until May 1997 and bring them into Congo-Brazzaville after a trip of 1,500 kilometers. During their trip, these refugees faced extremely harsh conditions of living and were continuously pursued and attacked by the AFDL forces. In a few places, like in Tingi Tingi camp or along the Ubundu-Kisangani axis, they were able to settle down for some weeks, and external aid was provided until the camps were attacked. But most of the time, the access to this population was almost non-existent and very little information on their situation was available.
The purpose of our study was to review the several acute phases experienced by the Rwandan refugees from the first influx in Kivu in July 1994 until the settlement in the camps in Congo-Brazzaville in May 1997, concentrating on the ways in which mortality figures were collected. The objectives were to examine the importance of mortality data in complex emergency situations and to analyze the feasibility of the organization of a basic surveillance system in the most precarious conditions. Our goal was also to underline the limitations of the retrospective mortality surveys and the caution required in the extrapolation of their results.
MORTALITY DURING THE GOMA INFLUX
The refugees settled down initially in Goma town and later in Kibumba and Katale camps, situated north of the town, and in Mugunga camp to the west ( Figure 2-1 ). During the initial emergency phase, the occurrence of major cholera and dysentery outbreaks and the precarious environmental conditions resulted in high mortality rates, which were recorded by a retrospective survey and a dead body collection system.
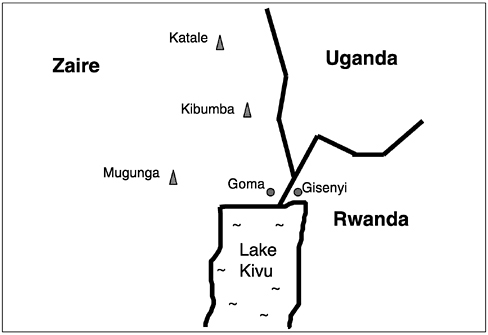
FIGURE 2-1 Location of the refugee camps in North Kivu. Not drawn to scale.
Methods
Surveillance System
From the first days of the intervention of the international agencies, emphasis was put on mortality and morbidity data collection. As the ground where most refugees settled was hard volcanic rock, the digging of graves was almost impossible, and dead bodies were left along the roads and tracks or in public places. A dead body collection system was therefore organized using trucks for burial in mass graves. It provided records of numbers of bodies collected per day.
A mapping exercise was performed in each camp. The geographical limits of the camps were first estimated, as a whole and by zones of shelter density (low, medium, and high), using a geographical positioning system (GPS). This gave an estimate of the surface of the camp. Within each zone of shelter density, squares of 25 meters by 25 meters were selected at random. The number of persons living within these squares was counted. This gave an estimate of the population density per square meter by zone, which, when multiplied by the area of each zone, gave a rough estimate of the total population of the camps.
The population figures were also estimated from the number of doses
delivered during a mass vaccination campaign against meningitis, and from the vaccine coverage evaluated during a subsequent vaccine coverage survey.
Retrospective Mortality Surveys
Population retrospective mortality surveys were conducted in Katale, Kibumba, and Mugunga camps from August 4 to August 14, 1994. These surveys were designed to estimate the average mortality rate in each camp since the arrival of the refugees, and to evaluate the nutritional status of children under age five.
Each survey was conducted using a two-stage cluster sampling method. Within each camp, 30 clusters of 20 households were selected at random. Household composition and information on mortality since arrival in Zaire were obtained by interviewing the head of the family.
Results
The populations of Katale, Kibumba, and Mugunga camps were estimated at 80,000, 180,000, and 150,000, respectively. Some refugees had settled down in Goma town, to the north of Katale, and to the west of Mugunga and were not counted.
The first case of cholera in Goma was diagnosed on July 20, 1994. This led to a major cholera outbreak of 58,000 to 80,000 cases within a month after the influx (Goma Epidemiology Group, 1995). The cholera outbreak was still active when an outbreak of bloody diarrhea, due to Shigella dysenteriae type 1, erupted in the first days of August and persisted in all the camps until November 1994.
These successive outbreaks contributed greatly to the unprecedented mortality rates observed during the first weeks of the emergency. A total of 48,347 dead bodies were buried between July 14 and August 14 (Goma Epidemiology Group, 1995). Although this might be an underestimation of the true figures (because of private burials), the estimate of 50,000 deaths occurring during the first month of the emergency has been generally accepted (Millwood, 1996).
The average daily crude mortality rates (CMRs) estimated by the retrospective mortality surveys were two to three times higher than the death rates reported from previous complex emergency situations in Ethiopia and Sudan (1985), Somalia (1992), and Iraq (1991) ( Table 2-1 ). According to the surveys, 85 to 90 percent of the deaths reported were related to diarrheal diseases. In Katale, adults and children under age five appeared equally affected by diarrhea-related deaths (Paquet and Van Soest, 1994).
TABLE 2-1 Comparison of Crude Mortality Rate Estimates Derived from Dead Body Count and from Population Surveys, Goma to Zaire, July - August 1994
|
Survey or Count |
Survey Period (July 14 to) |
Estimated Population |
Crude Mortality Rate (per 10,000 per day) |
Percentage of Population Dying During the Period [95 % confidence interval] |
|
Katale survey |
August 4 |
80,000 |
41.3 |
8.3 [7.1–9.5] |
|
Kibumba survey |
August 9 |
180,000 |
28.1 |
7.3 [6.2–8.6] |
|
Mugunga survey |
August 13 |
150,000 |
29.4 |
9.1 [7.9–10.3] |
|
Body count (all areas) |
August 14 |
500,000-850,000 |
31.2–19.5 |
9.7–6.0 |
|
Source: Goma Epidemiology Group (1995). |
||||
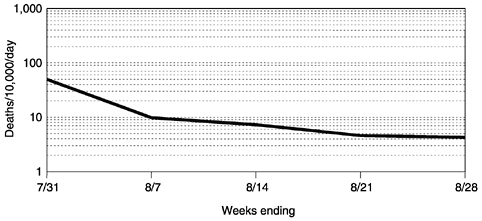
FIGURE 2-2 Crude daily mortality rates per week, Katale Camp, Goma, Zaire, July-August 1994.
Surveillance and survey data were consistent. Depending on population estimates, 6 to 10 percent of the refugees who arrived in Goma between July 14 and July 18, 1994 died within a month after their arrival. The high mortality rates recorded, and explained almost entirely by the outbreaks of cholera and dysentery, confirm the occurrence of a public health disaster of major proportions.
However, within some weeks, CMRs declined sharply, and by the end of August was estimated at 3.0 per 10,000 per day in Katale, for instance ( Figure 2-2 ). This result can be related to the international community's huge response to the Goma crisis. Even if the level of performance of some agencies was poor and their impact on the crisis questionable (if not negative), it is generally accepted that, overall, the results of the humanitarian intervention were impressive. In particular, the speed with which enormous quantities of water of good quality were supplied to most camps was commendable and had a key role in the control of the outbreaks of diarrheal diseases.
MORTALITY IN TINGI TINGI
The attacks of the refugee camps in Kivu by the troops of the AFDL in October and November 1996 marked the beginning of a period during which the humanitarian situation of the refugees deteriorated. According to figures from the United Nations High Commissioner for Refugees (UNHCR), over 340,000 refugees remained in Zaire, hiding in the forests of Kivu, or fleeing west ahead of the advancing front line. From October 1996 until June 1997, the refugees were victims of intimidation, ill treat-
ment, and killings, and were denied adequate protection and assistance. In mid-December 1996, groups of refugees who had been forced out of the camps in Eastern Zaire and had since been missing, resurfaced at Tingi Tingi, Shabunda, and Amisi camps, in Maniéma province, where they received assistance until those camps were also attacked on February 28, 1997. Later on, and except during a short period in the south of Kisangani, the humanitarian agencies had almost no access to these populations until they reached Congo-Brazzaville.
Methods
A surveillance system was established in Tingi Tingi, which provided mortality data from the beginning of the intervention (Nabeth, 1997). The number of deaths was computed on a daily basis by age group: under five and five and over. Deaths were recorded from the hospital, the intensive feeding center, and the cholera isolation unit. In addition, a “grave watcher” had been hired to report the number of new graves dug per day and the place of the death (e.g., hospital or home). A mapping of the camp was conducted initially to estimate the population figures. Later on, a registration system was set up for new arrivals.
Results
The population of Tingi Tingi was estimated at 80,000 persons, of which 12,000 (15 percent) were children under five years old (Nabeth, 1997). From December 18, 1996 to February 26, 1997, a total of 1,703 deaths were recorded by the surveillance system, of which 831 (48.8 percent) occurred among children under five. Over the period, the average crude and under-five mortality rates were 3.0 and 9.8 per 10,000 per day, respectively. Although a phenomenon of double counting might have occurred in some cases, because of the double sources of information, the observed rates were well above the limits generally admitted for situations out of control (2.0 and 4.0 per 10,000 per day for the crude and under-five mortality rates, respectively).
The trends showed a clear and constant deterioration of the health status of the refugees over time ( Figure 2-3 ) (Nabeth et al., 1997b). This was primarily due to the absence of adequate food supplies. Between December 27, 1996 (the first day of food distribution), and January 24, 1997, a daily average of 900 kilocalories per person was provided to the refugees (UNHCR recommends a daily ration of 2,100 kilocalories per person per day). The high mortality rates were also explained by the development of a dysentery outbreak followed by a cholera outbreak (Nabeth, 1997).
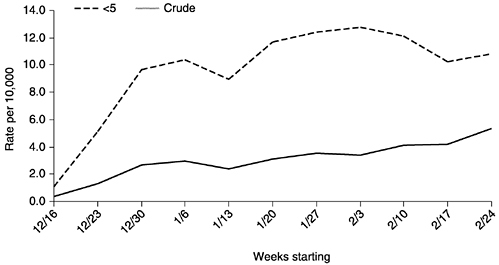
FIGURE 2-3 Average daily mortality rates per week among refugees in Tingi Tingi, Maniéma, Zaire, December 1996-February 1997.
MORTALITY IN THE CAMPS ALONG THE UBUNDU-KISANGANI RAILWAY
By the end of February 1997, the AFDL forces reached Tingi Tingi, and most of the refugees fled to the west, in the direction of Ubundu and Kisangani. In late March 1997, the first groups of refugees reached Ubundu, 100 kilometers south of Kisangani. From there, they moved north along the railway to Kisangani. AFDL did not allow them passage through this town, and by mid-April, refugees had set up camps at several locations along the railway line from Ubundu to Kisangani.
Methods
In spite of the very difficult conditions and limited access to the refugee populations, temporary hospitals and dispensaries were set up. They allowed the collection of mortality data on a daily basis, by age group (under-five and five and over). In addition, a network of community health workers was rapidly created in Kasese. Population figures were estimated empirically.
Results
Overall, it was estimated that 80,000-85,000 refugees had settled in multiple camps along the railway line. Overcrowding and poor sanita-
tion made the living conditions in the camps particularly difficult, and, as expected in those conditions, the estimated mortality rates were extremely high. By mid-April, 1,581 deaths had been officially registered since the beginning of the month (the CMR was 11.6 to 12.4 per 10,000 per day). Access to the refugees remained very limited and logistic difficulties were considerable. The camps were attacked during the last week of April 1997. Some refugees continued their flight to the west, some hid in the forest and came back some days later, and many disappeared.
Groups of refugees were again located in May 1997 in Mbandaka and Wenji, on the eastern bank of the Congo River. After a final attack on the camps, they crossed over towards Congo-Brazzaville.
MORTALITY IN NDJOUNDOU AND LOUKOLÉLA, CONGO-BRAZZAVILLE
By mid-May 1997, several hundred Rwandan refugees were identified in Congo-Brazzaville in a swampy area located 600 kilometers north of Brazzaville along the Oubangui River. They had settled in camps located in three villages: Loukoléla, Liranga, and Ndjoundou.
Methods
Surveillance System
An epidemiological surveillance system was rapidly established in all the camps. The number of deaths was collected on a daily basis from the hospital registers. In addition, right from the beginning, the local authorities organized a registration system of the new arrivals and assigned a separate cemetery to the refugee population with a system to register deaths. A census was carried out prior to a general food distribution. A list of all the families present in the camp was therefore available.
Retrospective Mortality Survey
A retrospective mortality survey was conducted in July 1997 in Ndjoundou with the objective of reconstituting a posteriori the group of origin in the camps of Kivu and of documenting the sequence of events that occurred in that population since the attacks at the end of 1996 (Nabeth et al., 1997a). A systematic random sample of 266 families was selected from the list of families of Ndjoundou. One person per family was interviewed. The questions were about the extended family while in Kivu (persons living together, not necessarily under the same roof), and included: the camp of origin in Kivu, the number of persons in the family
while in Kivu with their age and sex, the date of departure from the camp in Kivu, the names of the places where the family stopped for at least several days and, for each of those places, the members of the family present and the events explaining the absence of the other members. The following events were documented: death (by illness, accident or murder), repatriation to Rwanda, spontaneous return to Rwanda, and disappearance. Only confirmed deaths were recorded as such; if the death was simply assumed, the person was reported missing.
Results
At the end of June 1997, the total population of Loukoléla was estimated at 6,400 persons and that of Ndjoundou at 3,370 persons (1,650 families). At that time (that is, one and a half months after the arrival of the first refugees), the mortality rate recorded by the surveillance system in both camps was below 1.0 per 10,000 per day; for the last week of June the average daily CMR was 0.2 in Loukoléla and 0.5 in Ndjoundou ( Figure 2-4 ). The main causes of death were typical for refugee situations: malaria and diarrhea (including cholera) in the five and above age group, and malaria, acute respiratory infections, diarrhea and malnutrition among the under-five age group.
A total of 266 heads of families were interviewed during the retrospective mortality survey in Ndjoundou. They represented a population of 530 persons (15.7 percent of the total population of the camp). Men aged 20 to 39 were clearly over-represented in the sample ( Figure 2-5 ).
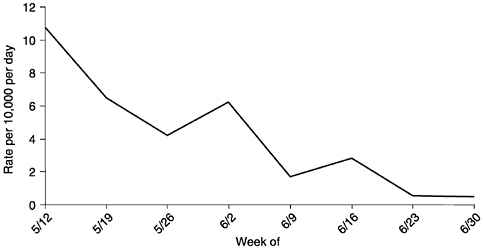
FIGURE 2-4 Average daily crude mortality rate per week, Ndjoundou, Congo-Brazzaville, May-June 1997.
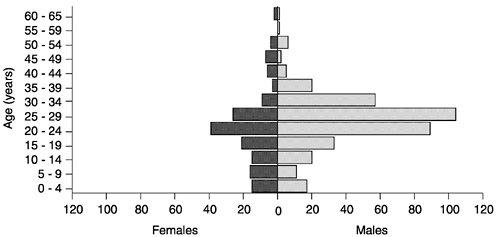
FIGURE 2-5 Distribution by age and sex of the population of the sample (N=530), Ndjoundou, Congo-Brazzaville, July 1997.
But this was also the case in the entire population of Ndjoundou ( Table 2-2 ), and in the initial group reconstituted from the information collected during the survey ( Figure 2-6 ). The 530 persons included in the sample in Ndjoundou came from an estimated group of 3,121 persons in the camps of Kivu. Of this initial group, 651 persons died (20.9 percent, with a 95 percent confidence interval of 19.5-22.3) and 1,857 disappeared (59.5 percent, with a 95 percent confidence interval of 57.8-61.2) during their trip through Zaire. Most of the persons who died were killed ( Table 2-3 ).
TABLE 2-2 Age and Sex Distribution in the Sample and in the Total Population of the Camp, Ndjoundou, Congo-Brazzaville, July 1997
|
Population Parameter |
Sample (n = 530) |
Camp (n = 3370) |
|
|
Sex |
Male |
367 |
2429 |
|
Female |
163 |
941 |
|
|
Sex Ratio (Males/Females) |
2.25 |
2.58 |
|
|
Age (Years) |
Median |
24.0 |
24.0 |
|
Number (Percentage) |
32 |
263 |
|
|
under Five Years of Age |
(7.9%) |
(8.5 %) |
|
|
Age of Males |
Median |
25.0 |
25.0 |
|
Age of Females |
Median |
22.0 |
21.0 |
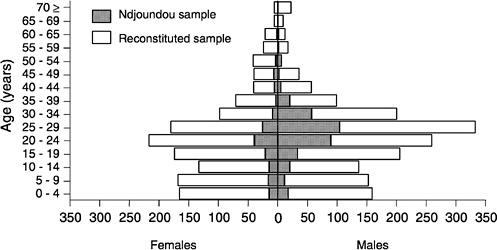
FIGURE 2-6 Distribution by age and sex of the sample in Ndjoundou (N=530) and of the reconstituted sample (N=3,121), Ndjoundou, Congo-Brazzaville, July 1997.
The trip of the refugees through Zaire was reconstituted from the interviews. Each family had its own itinerary, but four gathering places were clearly identified: Shanje (for the refugees coming from the Bukavu area), Tingi Tingi, Ubundu, and Wenji.
It was also possible to find the places and the dates when refugees were killed or disappeared. A high proportion of the population living in the camps of Mugunga, Sake, Shanje, Ubundu-Obilo, and Wenji were killed or disappeared during the various attacks ( Table 2-4 ).
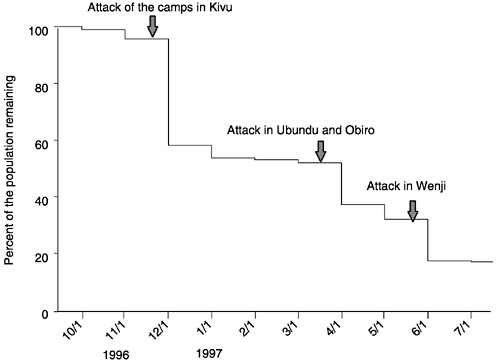
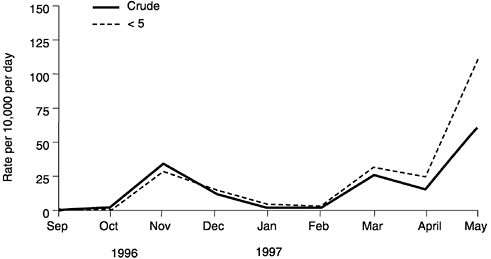
When considering the evolution of the size of the reconstituted group over time, three periods showed a sudden drop in the number of refugees remaining in the group. These periods corresponded to the months following the attacks of the camps in Kivu (November 1996), along the railway from Ubundu to Kisangani (April 1997), and in Wenji (May 1997) ( Figure 2-7 ). However, since these projections included the refugees who died or disappeared, more accurate figures might be provided by considering the number of deaths only. It was possible, from the results of the interviews, to calculate the crude and under-five mortality rates by period of time. Again, three peaks of mortality were observed corresponding to the same periods ( Figure 2-8 ). The average daily crude and under-five mortality rate over the period were 15.5 and 18.2 per 10,000 per day, respectively.
TABLE 2-3 Distribution of the Events Occurring Among Rwandan Refugees During Their Flight from Kivu to Congo-Brazzaville, Ndjoundou, Congo-Brazzaville, July 1997
|
Events |
N |
Percentage |
95 Percent Confidence Interval |
|
Event Explaining the Absence: |
|||
|
Disappearance |
1857 |
59.5 |
57.8-61.2 |
|
Death: |
|||
|
Murder |
615 |
19.7 |
18.3-21.1 |
|
Illness |
24 |
0.8 |
0.5-1.1 |
|
Accident |
12 |
0.4 |
0.2-0.7 |
|
Spontaneous Return |
33 |
1.0 |
0.7-1.5 |
|
Repatriation |
34 |
1.1 |
0.8-1.5 |
|
Present: |
|||
|
Present in Ndjoundou |
530 |
17.0 |
15.7-18.3 |
|
Present in Another Camp |
16 |
0.5 |
0.3-0.8 |
|
Total |
3121 |
100.0 |
N/A |
TABLE 2-4 Proportion of the Refugee Population Killed or Disappeared by Place, Ndjoundou, Congo-Brazzaville, July 1997
|
Killed |
Disappeared |
||||||
|
Place |
Population |
N |
Percent |
95 Percent Confidence Interval |
N |
Percent |
95 Percent Confidence Interval |
|
Mugunga |
211 |
33 |
15.6 |
11.2–21.0 |
57 |
27.0 |
21.3–33.3 |
|
Sake |
447 |
55 |
12.3 |
9.5–15.6 |
136 |
30.4 |
26.3–34.8 |
|
Shanje |
1597 |
84 |
5.3 |
4.2–6.4 |
512 |
32.1 |
29.8–34.4 |
|
Walikale |
686 |
38 |
5.5 |
4.0–7.4 |
28 |
4.1 |
2.8–5.8 |
|
Tingi-Tingi |
1557 |
43 |
2.8 |
2.0–3.7 |
104 |
6.7 |
5.5–8.0 |
|
Ubundu |
1336 |
17 |
1.3 |
0.8–2.0 |
207 |
15.5 |
13.6–17.5 |
|
Obiro |
665 |
46 |
6.9 |
5.2–9.0 |
136 |
20.5 |
17.5–23.6 |
|
Ikela |
397 |
4 |
1.0 |
0.3–2.4 |
22 |
5.5 |
3.6–8.1 |
|
Boende |
224 |
32 |
14.3 |
10.2–9.3 |
25 |
11.2 |
7.5–15.8 |
|
Ingende |
209 |
0 |
0.0 |
N/A |
2 |
1.0 |
0.2–3.1 |
|
Wenji |
954 |
130 |
13.6 |
11.6–15.9 |
288 |
30.2 |
27.3–33.2 |
|
Unknown |
133 |
340 |
|||||
|
Total |
615 |
1857 |
|||||
DISCUSSION
Mortality rates are the most useful health indicators for assessing the seriousness of emergency situations. Two methods are recommended for measuring mortality in a refugee population (both were used for the Rwandan refugees in Zaire): the retrospective mortality surveys and the ongoing surveillance system. Either method gives estimates of the crude and under-five mortality rates that can then be compared to the expected crude mortality rate in developing countries (on average, 25 per 1,000 per year, or 0.6 per 10,000 per day). A situation is considered an emergency when the CMR exceeds 1 per 10,000 per day. Reference rates in the under-five age group are double that found in the general population; it is considered to be an emergency situation when the under-five mortality rate is above 2 per 10,000 per day.
The implementation of a surveillance system and the collection of population figures are priority actions that should be undertaken right from the beginning of an emergency situation. Some of our examples (Tingi Tingi, Ubundu, and the camps along the railway to Kisangani) demonstrated that this was feasible, even in the most difficult situations. The information can come from different sources, depending on the places: dead body collection, grave watchers, or hospital and therapeutic feeding center registers. Whatever the origin of the information, biases can affect both the population figures (frequent overestimation) and the number of deaths reported (over- or undernotification, delay in reporting, etc.). In emergency situations these biases are difficult to control, and, therefore, the objective of surveillance in this context can only be to monitor trends over time, and not to provide exact figures. Decisions made and information communicated must be based on these trends rather than on isolated results.
Retrospective mortality surveys should be conducted (and sometimes repeated) when no surveillance data are available, such as occurred in the camps of Kivu in August 1994, to document events which occurred during the migration, such as in Congo-Brazzaville in 1997. The latter is of particular interest because of the historical information it can provide. On the other hand, retrospective mortality surveys also have limitations and caution is required in the extrapolation of their results.
The mortality rate obtained from a retrospective survey is always an average over the recall period, and confidence intervals must always be added around the central value. If the recall period is long, the average rate might not represent what is actually happening at the time of the survey and this could lead to inappropriate decisions. Long recall period will also affect the precision of the data collected. Conversely, if recall period is short, there is a risk of measuring a very specific event which
might not be representative of the overall situation. Short recall period also allows fewer events (deaths) to be recorded, and thus reduces the precision of the estimate (or implies the need for a bigger sample size to get the same level of precision). In any case, mortality data collected from retrospective surveys should be used with caution for forecasting purposes, especially when figures are abnormally high. Peaks of mortality documented during communicable disease outbreaks or nutrition emergencies, for example, often reflect what is happening in the most vulnerable groups of the population. Once these groups have been affected, there is often a change in mortality pattern.
The sampling technique and the questionnaire are two other potential domains of weakness of retrospective mortality surveys. The sampling technique refers almost always to a two-stage cluster sampling method. In this method, only the first sampling unit is selected at random within the cluster, while the following units are selected on a proximity basis. The method has only been validated for vaccine coverage surveys and might not be suited for mortality surveys if the mortality patterns are correlated, in any way, with the geographical location of the houses within the cluster. This will increase the cluster effect, and therefore reduce the precision of the estimate, everything else being equal. Furthermore, the sampling unit in mortality surveys is the household, but inferences are made on individuals.
The questionnaires used during retrospective mortality surveys are much less elaborate than the ones used for verbal autopsies. Their validity has never been evaluated. They are usually built on the spot, and are often applied by inexperienced and rapidly trained personnel.
Finally, retrospective mortality surveys can be affected by a survival bias. This bias probably occurred during the survey conducted in Ndjoundou in Congo-Brazzaville in July 1997. In this case, and given the proportion of the initial group who died during the trip through Zaire, it is very likely that many families disappeared completely and were therefore not interviewed. This was partly taken into account by considering the extended African family in Kivu instead of the nuclear family. But we still might get a biased estimate of the true mortality rates, either by underestimation (i.e., survival bias) or by overestimation (i.e., multiple reporting of the deaths).
For all these reasons, the interpretation of retrospective mortality surveys must be very cautious. These surveys are conducted in difficult conditions and, most of the time, by few and inexperienced personnel. Recall and survival biases are both likely. The validity of the questionnaires and of the sampling techniques has never been evaluated. The extrapolation of the results to other camps and other situations (for instance to refugees with a different history of exodus) is very hazardous.
To our knowledge, the retrospective mortality survey conducted in Ndjoundou camp in Congo-Brazzaville was the first of this type in a refugee setting. Since then, the same method has been used to document the exodus of Kosovar refugees in Albania and Montenegro in 1999 (Brown et al., 2000; Physicians for Human Rights, 1999). The testimony and advocacy activities, favored and reinforced by the validity of the information collected during these surveys, will obviously not protect a posteriori the victims of injustice, but they can have an impact on the prevention of violence against vulnerable civil populations in the future. Retrospective surveys of the history of migration should be multiplied during complex emergencies. At the same time, their methodology should be assessed and refined.
REFERENCES
Brown, V. , W. Perea , G. Godain , E. Dachy , and M. Valenciano 2000 Kosovar refugees in Montenegro and Albania . Refuge 18(5) : 43-45 .
Goma Epidemiology Group 1995 Public health impact of Rwandan refugee crisis: What happened in Goma, Zaire, in July 1994? Lancet 345 : 339-344 .
Millwood, D., ed. 1996 The International Response to Conflict and Genocide: Lessons from the Rwanda Experience . Humanitarian Aid and Effects . Geneva : Steering Committee of the Joint Evaluation of Emergency Assistance to Rwanda .
Nabeth, P. 1997 Compte-rendu de mission à Tingi Tingi, Zaïre . Internal report, Epicentre, Paris, January 1997 .
Nabeth, P. , C. Ndayambaje , A. Croisier , and M. Pédari 1997a Histoire des réfugiés rwandais ayant fui les camps du Kivu, Zaïre, de septembre 1996 à juin 1997 . Résultats d'une enquête effectuée parmi les survivants du camp de Ndjoundou, au Congo. Internal report, Epicentre, Paris, September 1997 .
Nabeth, P. , B. Vasset , P. Guérin , B. Doppler , and M. Tectonidis 1997b Health situation of refugees in eastern Zaire . Lancet 349 : 1031-1032 .
Paquet, C. , and M. Van Soest 1994 Mortality and malnutrition among Rwandan refugees in Zaire . Lancet 344 : 823-824 .
Physicians for Human Rights 1999 War Crimes in Kosovo: A Population-Based Assessment of Human Rights Violations of Kosovar Albanians by Serb Forces . Boston : Physicians for Human Rights .


