
Page 11
1
Introduction to the Tri-Academy Project
Human population growth changed in character and form in the twentieth century. In the roughly 40 years after 1950, the world's population grew at an unprecedented rate. Not until 1830 did the population reach 1 billion, but only 100 years more were required for it to reach 2 billion. From 1960, when the world population stood at 3 billion, just 40 years, to 1999, were required for the total world population to reach 6 billion. Much of this recent population growth took place in the poorer regions of the world. Fertility and mortality rates began to decline in the Western industrialized regions in the nineteenth century (a process called the demographic transition), but only in the last decades of the twentieth century did some of the developing regions begin to realize significant declines in fertility. The population momentum resulting from a youthful age structure, however, ensures that the populations of the developing world will continue to grow for many years.
These unprecedented rates of population growth have sparked alarm about their impact on the global environment and future prospects for human societies. All human activities since antiquity have disturbed a “pristine” nature. Thus it is not surprising that the high rates of economic and industrial development that accompanied population growth in the twentieth century resulted in the depletion of natural resources and fouling of the land, air, biota, and water in many regions of the globe. The intense modern debate over the relationship between numbers of people and use of available land has resurrected both Malthus's hypothesis and its critics. Although he later revised his views, Thomas Malthus predicted, late in the eighteenth century, that the needs of a growing population
Page 12
would eventually exceed the capacity of a finite earth to support it. Others have suggested that limitless human ingenuity will overcome mere physical constraints. Thus far, scientific and technological advances in agriculture have enabled food production to more than keep pace with a burgeoning population—on a global level. However, at the regional and local levels, and at particular times in history, hundreds of millions of people have lacked sufficient food or food of adequate quality.
A critical aspect of these debates is the relation of increasing population to changes in land use. Humans need land first and foremost to produce food. In general, a rising demand for food leads to expansion of land under cultivation, intensification of agricultural practices, or both. The latter, in turn, often requires application of large quantities of fertilizer, herbicides, insecticides, and irrigation water, which can have damaging impacts on the environment. Beyond agriculture, other drivers of land use change include industrialization and urbanization, which may further degrade natural resources and the environment.
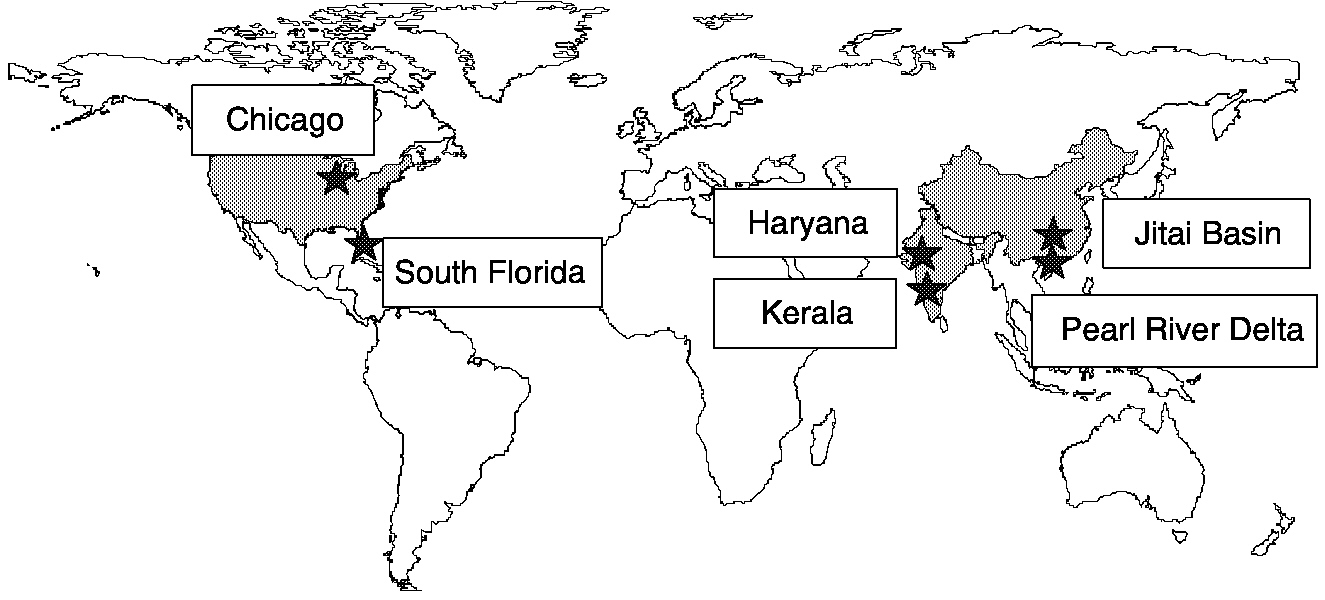
The objective of this Tri-Academy Project is to examine the interactions between population, land use, and consumption by studying six regions in the world's three largest countries ( Figure 1-1). The regions are: in India, Kerala, a state in southwest India, and Haryana, a state north of New Delhi; in China, the Pearl River Delta in the south and the Jitai Basin in Jiangxi Province just to the north; and in the United States, South Florida in the southeastern part of the country and the Chicago region in the American Midwest. Study teams in each region analyzed basic trends in population growth and land use change since World War II and sought to identify drivers of the observed changes. Afterward, members of the local study team prepared each case study chapter. The project team then as a
~ enlarge ~
FIGURE 1-1 Tri-Academy study regions.
Page 13
whole compared the trends and drivers across sites. Although initially it was assumed that population growth alone might be a significant driver of land use change in many of the regions, the results indicate that many other factors also played important roles in the transformations. These factors include government policies, changes in consumption patterns, and the effects of economic integration and globalization.
ORIGIN OF THE STUDY
In October 1993, representatives of 58 of the world's science academies gathered in New Delhi for a “Science Summit” on World Population. Over the course of four days of discussion, scientists from all continents prepared a joint statement intended for use at the United Nations Population Conference scheduled for Cairo in June 1994.1 The statement read in part:
Throughout history, and especially during the twentieth century, environmental degradation has primarily been a product of our efforts to secure improved standards of food, clothing, shelter, comfort, and recreation for growing numbers of people. The magnitude of the threat to the ecosystem is linked to human population size and resource use per person. Resource use, waste production, and environmental degradation are accelerated by population growth. They are further exacerbated by consumption habits, certain technological developments, and particular patterns of social organization and resource management.
The statement went on to say:
The relationships between human population, economic development, and the natural environment are complex. Examination of local and regional case studies reveals the influence and interaction of many variables. For example, environmental and economic impacts vary with population composition and distribution, and with rural–urban and international migrations. Furthermore, poverty and lack of economic opportunities stimulate faster population growth and increase incentives for environmental degradation by encouraging exploitation of marginal resources.
During the meeting, representatives of the science academies of India, China, and the United States agreed to participate in a unique, multinational collaboration (called here the Tri-Academy Project) that would utilize a case study approach to explore the interactions between population growth and changes in land use. Bringing together natural and social scientists from the three countries, the project would seek to cast light on
1See Population Summit of the World's Scientific Academies. 1999. Washington, D.C.: National Academy Press.
Page 14
the transformations in demographics, land use, and consumption. The John D. and Catherine T. MacArthur Foundation, the U.S. National Institutes of Health, and the U.S. National Research Council provided support for the undertaking.
RESEARCH OBJECTIVES
As noted, the research objectives of the Tri-Academy Project are to explore the relations among population growth, consumption patterns, and land use change in the six study regions and to compare the findings in a way that will illuminate the principal driving forces of the observed changes. A Tri-Academy panel made up of representatives of the academies of science of the three countries was appointed to design the project and oversee its progress. Each academy selected its own study sites, seeking to identify areas undergoing significant changes in population yet embracing a variety of land uses, including agricultural, urban, and natural.
This study was based on the premise that international comparisons of recorded social transformations may yield insight into principles that could lead to broader generalizations, or at least to recognition of common experience, generalizable or not. A perfect design would call for the selection of study sites carefully matched across a spectrum of attributes such as population, land cover, occupations, and geography. While the panel encouraged such design criteria, each country was responsible for selecting its own sites, under the significant constraint that the studies rely on ongoing work or existing material and not on the collection of new data. One result is that all sites have large populations and high population densities. A base period, roughly the last half-century, was adopted for the comparison of trends, but, where available, much earlier data were used in the analyses. Even though the case studies described here do include some anecdotal narrative, the panel has emphasized, to the extent possible, quantitative measures of trends. As the findings demonstrate, however, some explanations of changes in land use and population draw on qualitative as well as quantitative observations.
The inclusion of a chapter on gender issues in development in Kerala and Haryana represents the realization of a fortuitous opportunity. The panel was unable to pursue comparable studies in China and the United States.
The project participants entrusted with the task of creating a common study design for the six study regions faced several constraints. For example, the study had to be based on existing data sets, whose variables did not generally coincide for all sites over the period of study, and on the availability of skilled research teams within the country specializing in the study sites. The common variables selected for the project were sometimes a compromise that took into account the specific data available for
Page 15
each site and the different data forms, units, time intervals, and standards of each country. Nevertheless, the six studies provide an opportunity for comprehensive cross-site comparisons.
The objectives of the study are embodied in three questions that embrace the many specific issues addressed at each site and in the chapters of this report:
- 1. What is the nature of the significant population and land use transformations in the study regions?
- 2. To what extent has local population growth and consumption directly influenced the changes in land use?
- 3. From a comparison of the case studies, what can be learned about the general nature of the forces driving the transformations and about the influence of government policies on population growth and mobility, land use, and economic development?
The first of these questions requires analysis of land use and population data, especially those indices that best describe the changes over time. For population, the project team analyzes the record of population and population growth, migration, urbanization, worker demographics, age and gender distribution, and other social indices. To describe land use change, it looks at the distribution of land cover, soil classification and condition, water tables and quality, and cropping patterns.
To answer the second question, the project team compares the time relationships of all these variables, looking for patterns in the recorded changes in the distribution of land among the natural, agricultural, and urban (called “built-up” in this report) categories vis-à-vis changing population densities and distributions and consumption patterns.
In exploring the third question and examining other forces causing change, researchers take into account the roles of government policies and economic integration and globalization. This question, often explicitly excluded from demographic and land use studies, can be answered only by analyzing how population and land use changes have been influenced by government policies and heightened economic integration either directly or through unintended consequences. The answer may suggest directions for future research.
THE STUDY REGIONS
The populations, resources, land use, and economies of the study regions encompass a broad range. These characteristics are described in Table 1-1 and in this section.
Kerala, a subtropical state in southwest India, has a high life expectancy, a high level of education, and one of the lowest population growth rates in India (see Chapter 5). The major industry in Kerala is
Page 16
|
Study Region |
Population Size (annual growth rate) |
Geographical Context |
Area (km2) |
Agriculture |
Environmental Issues |
|
Kerala |
29.1 million (1.3%) |
Primarily rural area with midsize cities and villages |
39,000 |
Commercial, truck, and subsistence farming |
Deforestation, agricultural land loss, water use |
|
Haryana |
16.5 million (2.4%) |
Productive agrarian area with high density of farming villages and midsize market centers |
42,000 |
Market-based farming using Green Revolution techniques |
Falling water table, possible soil exhaustion, heavy chemical uses to maintain productivity, shrinking agricultural plots |
|
Jitai Basin |
2.5 million (0.4%) |
Primarily rural area with midsize cities and villages |
12,500 |
Subsistence and commercial farming |
Agricultural land loss, deforestation |
|
Pearl River Delta |
17 million (3.4%) |
Major metropolitan area with surrounding villages and rural areas |
17,400 |
Truck farming |
Major urban pollution issues, agricultural land loss, and water use |
|
South Florida |
5.4 million (2.6%) |
Mixed area with major urban concentrations, nature reserves, and commercial agriculture |
27,100 |
Commercial |
Threatened unique biosphere reserve, water resources |
|
Chicago CMSA |
7.9 million (0.2%) |
Major metropolitan area with surrounding suburbs and adjacent rural areas |
13,100 |
Commercial and truck farming |
Moderate urban pollution issues, farmland loss |
NOTE: CMSA = Consolidated Metropolitan Statistical Area.
Page 17
agriculture, and its average per capita income is low. The state economy benefits, however, from remittances from expatriate workers.2 Land use in Kerala is currently influenced by state government policies that encourage cash crop production and by migration from the cities to the highland areas within the state.
Haryana and its neighbor state Punjab to the north are the wheat-growing “breadbasket” of India (see Chapter 6). Haryana's population growth rate is among the highest in India, but thanks to the introduction of Green Revolution technologies, agricultural productivity has been able to keep pace. The agricultural land area has remained fairly constant during the state's high-growth period, even though Haryana continues to be a major supplier of food for the country. The state is made up of two quite different regions, an arid one in the west and a semiarid one to the east.
The Jitai Basin, a center of revolutionary political activity in the 1940s and 1950s, has been considered a less-developed region of China for most of this century (see Chapter 8). Beginning in the 1950s, this agricultural region was heavily affected by radical government policies, including the Great Leap Forward, which called for cutting down forests to provide fuel for local small-scale smelters; the “grain production first” system, which dedicated more farmland to grain production; the Cultural Revolution, a political movement designed to completely remold society and change the thinking of the Chinese people; and the “household responsibility” system, which temporarily shifted the responsibility for management of farmland and forests from public to individual households. The region is now a focus of Chinese environmental policies. Meanwhile, population has grown slowly, some natural areas are being restored, and the region remains a source of “floating” workers for the Pearl River Delta to the south.
The Pearl River Delta, long a commercial region open to the West, was at one time a center of food production for the South China region (see Chapter 9). It also was a major source of Chinese immigrants to the West and to Southeast Asia. In 1978 the Chinese government designated several special economic zones in the Delta, areas where foreigners are permitted to invest and local companies are free to export. The government also allowed agricultural land to be converted to urban uses, under a regime of government incentives. Since then, the region has experienced rapid urbanization and industrialization and has become a magnet for migrant and “floating” workers from many parts of China.
2Remittances are funds sent back to the home country, usually to family, by overseas workers. They are often a large fraction of the workers' salaries and can be an important source of income for the families and the region.
Page 18
In the United States, South Florida developed rapidly after 1900; throughout the twentieth century decadal growth rates exceeded 100 percent (see Chapter 10). The primary industry is agriculture, but since World War II tourism and, more recently, financial and trading activities have become key industries. The interaction between population and land use in South Florida is dominated by the influx of migrants from northern U.S. states and immigrants from the Caribbean and Central and South America. Government policies to protect the Everglades and to provide water control structures for agriculture have created a highly inhomogeneous population pattern.
Chicago, a small U.S. city of 5,000 in 1840, grew at a rate of 10.4 percent a year from 1840 to 1900, when it became known as the world's greatest rail center (see Chapter 11). Grassland, timber, and livestock provided successive bases for commercial development. The city's population peaked in 1950, but the metropolitan region continues to grow as the suburbs encroach on agricultural land. People initially migrated to the region to exploit the natural resource base, but with the growth of transportation, communication, and financial institutions, employment in the modern era has shifted from manufacturing to providing services to both the regional agricultural sector and the global economy.
All study sites are subdivisions of larger national political entities and are themselves divided into smaller subunits. In India, the study regions, the states of Haryana and Kerala, are composed of political districts. In China, the Jitai Basin in Jiangxi Province and portions of the Pearl River Delta in Guangdong Province are defined as geographical entities that followed land use development histories different from those of the rest of their respective provinces. Data for the larger provinces and the smaller counties and metropolitan districts are presented for comparison with those of the study regions. In the United States, the South Florida region is an aggregate of seven Florida counties, and the Chicago study region comprises six counties of the state of Illinois. The city of Chicago falls within Cook County and is not a subdivision in itself.
For the most part in this project, the study regions were treated as single entities, although data were compiled at the level of each administrative subdistrict within the regions. In some cases, analysis at the subregional level revealed interesting forces at work. In Kerala, for example, it was possible to study internal migration from one district to another, propelled by differences in government pricing policies for land and crops. In the Pearl River Delta, project team members learned how the local environmental laws influence relative population growth among districts. And in Haryana, they found that the arid and semiarid regions of the state were subject to different government policies. The forces at play at the district level help to illuminate the causes of the broader changes at the study region level.
Page 19
PROJECT STRUCTURE
Each case study was carried out by a local or national research team following protocols devised and accepted by all. The research teams met four times. The first meeting, held in Washington, D.C., in 1995, featured a preliminary discussion on criteria for the selection of study sites and suggestions of possible sites. At the second meeting, which took place at the University of Kerala in 1996, project participants established the study protocols and a list of common variables. A third meeting at Florida State University in Tallahassee in October 1997 was devoted to formulating guidelines for the use of geographic information systems (GIS) in the studies. The Tallahassee meeting was combined with a training course, offered by Florida State University, on applications of the GIS methodologies. At the fourth and last meeting, held in Beijing in June 1998, the outline of this study report took form.
The structure of the project reflects some of the comparative international studies related to global environmental change carried out in the 1990s (for example, Turner et al., 1990; Kasperson et al., 1995; Strzepek and Smith, 1995). In these investigations, a diverse group of researchers developed a common research process and produced a set of case studies that yielded interesting analogies rather than formal comparisons. The Tri-Academy study used a similar modus operandi. Because data on population and land use were collected within different geographical boundaries by different agencies in the three countries, establishing a comparable primary database for the six studies was a difficult undertaking. Generally, the study teams were expected to draw on existing published sources rather than undertake new surveys and measurements. Once a set of common variables was selected, data from all research groups were sent to the research group at Florida State University. There, these data were compiled in four categories—demographic, land use, environmental, and consumption—on both regional and subregional scales for the Tri-Academy common variable data set. In each case study, team members used both the common database and additional data from more specialized and local studies.
It was recognized from the beginning that there would be problems related to the definition of variables and the compatibility of data used. True comparative analyses are impossible without identically defined, relevant variables expressed in comparable units. But each country respects its own land classification scheme and holds to special definitions. In the absence of comparable and unchanging spatial units and definitions, the numerical size of a population within political boundaries of varying scales produces uncertain measures of migration or population density. Researchers also encountered the problem of verifying data sources. Inevitably, there were some inconsistencies between the common data set and the case studies, and in the comparative analyses these were resolved in favor of the case studies.
Page 20
Temporal scales of analysis differ among the study regions. The Tri-Academy Project was searching for patterns in the trajectories of land use dynamics. Thus the time periods of the six studies differ because the starting points needed to capture the major land use transformations differ by location. The Chicago study period is the longest, from 1840 to 1990. Other study periods are: Kerala, 1960–1990; Haryana, 1970–1990; the Jitai Basin, 1965–1994; the Pearl River Delta, 1950–1995; and South Florida, 1900–1990. For purposes of direct comparison, data primarily for the period 1970–1990, the period of greatest overlap in the Tri-Academy data set, are used.
Because the emphasis of the study is on transformations and the factors that influence them, comparisons from the different eras proved useful. In the chapters that follow, readers will find for several of the study regions graphs of similar shapes but with different time scales describing transformations with common elements. The driving forces revealed were not simple; they involved complex interactions of several factors. Moreover, it was not always possible to distinguish the dependent variable defining the transformation and the independent variable presumably driving it. This complexity is elucidated in the chapters that follow.
DESCRIPTIVE FRAMEWORK
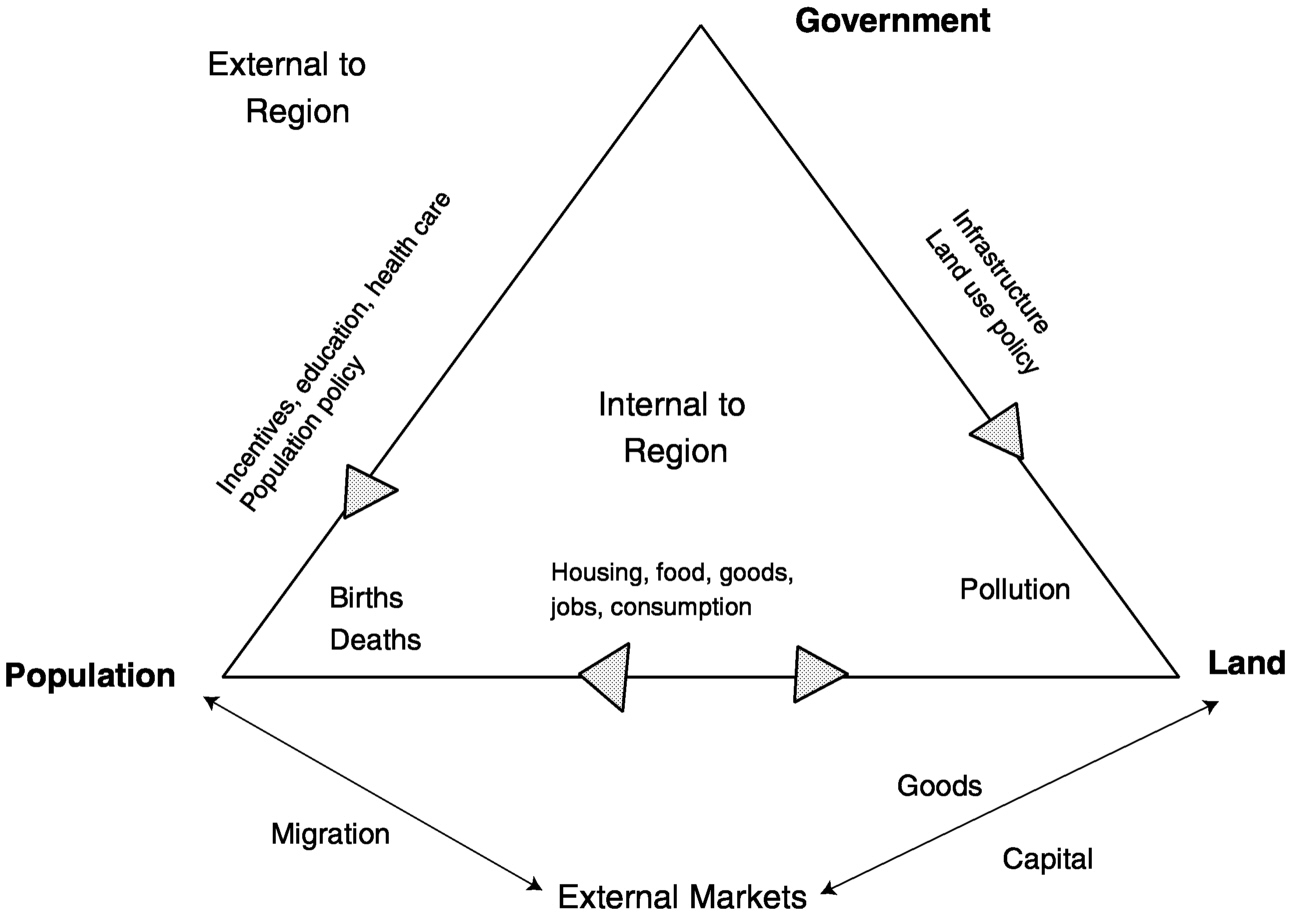
Although a variety of models describe the interaction of population, land use, and development (see Chapter 2 and Chapter 3), participants in this study found no single one adequate to characterize the transformations occurring in the study regions. Because differentiation between the internal and external forces driving change within each region appears to be significant, a purely descriptive figure was formulated to capture the relationships among the several important variables in the study. The triangle depicted in Figure 1-2 with apices labeled government, population, and land distinguishes between factors “internal” and “external” to a region. Activities emanating from within and from outside a region affect the relationships between population and land use. For example, population is changed by births and deaths within the region and by migration to and from outside the region. The products of the land serve the population within the region and export markets elsewhere. Capital and technology can come from either side.
The arrows along the base of the triangle point in both directions. Family planning and migration choices are influenced by consumption and income, for which the land is an important resource. In turn, population growth affects land use through people's needs for housing and space, the conversion of land to agriculture to produce foodstuffs and other goods, and the deterioration of environmental quality from industry and agriculture. The land also affects population growth: eroded and degraded lands
Page 21
do not support large populations, whereas sites with productive soils or pleasant environments attract migrants, as do sites where worker housing has been constructed in anticipation of new growth.
In Figure 1-2, government actions are shown primarily as applied forces with little direct feedback. Government policies—local, regional, and national—were found to be important in all study regions, but the national government dominates in nearly all the cases, presently and historically. In the United States, land regulation is primarily determined at the state and local levels. The various levels of government control population growth through education and health services and through direct regulation of births and migration, as in China, or incentives and infrastructure that promote or discourage migration, in all sites. Government has profound effects on land use and the environment through direct regulation, in China and South Florida, and through infrastructure, incentives, and pricing policies, in all sites. These factors are discussed extensively in the case studies.
Perhaps most interesting are the forces originating outside the triangle—that is, those external to the study regions. On the left is the reservoir of people. In-migrants increase a region's population—with major
~ enlarge ~
FIGURE 1-2 Relations among government, population, and land, and influences on population and land use emanating from within a region and from outside a region. Arrows show both the direction of influences and the loci of impacts.
Page 22
impacts in Haryana, Guangdong Province, and Florida—and out-migrants send home remittances, and in some cases investment capital and knowhow, to bolster income and support investments in the land—a big factor in Kerala and the Jitai Basin. External markets in goods, workers, technologies, and capital have great impacts on land use in all the study regions and provide an external link between consumption and land status that is, in many cases, stronger than the internal one. Each study region is linked to external markets that serve as a supplier of food and other imported products, purchase exported products of the region, and act as a source of the capital and human resources.
Chapter 2, Chapter 3 and Chapter 4 offer a comparative analysis of the six case studies. Chapter 2 on population compares the characteristics of population growth in the study areas with worldwide trends and relates them to current theoretical models. Chapter 3 describes the land use patterns in the study regions and relates the patterns to population change in the regions by land use type. The conjoined findings are presented in Chapter 4.
REFERENCES
Kasperson, J. X., R. E. Kasperson, and B. L. Turner II, eds. 1995 . Regions at Risk. Tokyo : United Nations Press .
, and . 1995 . As Climate Changes: International Impacts and Implications. Cambridge : Cambridge University Press .
Turner, B. L., II, W. C. Clark, R. W. Kates, J. F. Richards, J. R. Mathews, and W. B. Meyer, eds. 1990 . The Earth as Transformed by Human Action. Cambridge : Cambridge University Press .


