
1
Designing Surveys Acknowledging Nonresponse
Robert M.Groves and Mick P.Couper
THE NATURE OF NONRESPONSE ERROR IN SURVEY STATISTICS
Sample surveys used to describe low-income populations are effective only when several things go “right.” The target population must be defined well, having the geographical and temporal extents that fit the goals of the survey. The sampling frame, the materials used to identify the population, must include the full target population. The measurement instrument must be constructed in a way that communicates the intent of the research question to the respondents, ideally in their nomenclature and within their conceptual framework. The sample design must give known, nonzero chances of selection to each low-income family/person in the sampling frame. All sample persons must be contacted and measured, eliminating nonresponse error. Finally, the administration of the measurement instrument must be conducted in a manner that fulfills the design.
Rarely does everything go exactly right. Because surveys are endeavors that are (1) customized to each problem, and (2) constructed from thousands of detailed decisions, the odds of imperfections in survey statistics are indeed large. As survey methodology, the study of how alternative survey designs affect the quality of statistics, matures, it is increasingly obvious that errors are only partially avoidable in surveys of human populations. Instead of having the goal of eliminating errors, survey researchers must learn how to reduce them “within reason and budget” and then attempt to gain insight into their impacts on key statistics in the survey.
This paper is a review of a large set of classic and recent findings in the study of survey nonresponse, a growing concern about survey quality. It begins with a
review of what nonresponse means and how it affects the quality of survey statistics. It notes that nonresponse is relevant to simple descriptive statistics as well as measures of the relationship between two attributes (e.g., length of time receiving benefits and likelihood of later job retention). It then reviews briefly what survey statisticians can do to reduce the impact of nonresponse after the survey is complete, through various changes in the analysis approach of the data.
After this brief overview of the basic approaches to reducing the impacts of nonresponse on statistical conclusions from the data concludes, the paper turns to reducing the problem of nonresponse. It reviews current theoretical viewpoints on what causes nonresponse as well as survey design features that have been found to be effective in reducing nonresponse rates.
Nonresponse Rates and Their Relationship to Error Properties
Sample surveys often are designed to draw inferences about finite populations by measuring a subset of the population. The classical inferential capabilities of the survey rest on probability sampling from a frame covering all members of the population. A probability sample assigns known, nonzero chances of selection to every member of the population. Typically, large amounts of data from each member of the population are collected in the survey. From these variables, hundreds or thousands of different statistics might be computed, each of which is of interest to the researcher only if it describes well the corresponding population attribute. Some of these statistics describe the population from which the sample was drawn; others stem from using the data to test causal hypotheses about processes measured by the survey variables (e.g., how length of time receiving welfare payments affects salary levels of subsequent employment).
One example statistic is the sample mean as an estimator of the population mean. This is best described by using some statistical notation in order to be exact in our meaning. Let one question in the survey be called the question, “Y,” and the answer to that question for a sample member, say the ith member of the population, be designated by Yi. Then we can describe the population, mean by
(1)
where N is the number of units in the target population. The estimator of the population mean is often
(2)
where r is the number of respondents in the sample and wi is the reciprocal of the probability of selection of the ith respondent. (For readers accustomed to equal probability samples, as in a simple random sample, the wi is the same for all cases in the sample and the computation above is equivalent to ∑yi/n.)
One problem with the sample mean as calculated here is that is does not contain any information from the nonrespondents in the sample. However, all the desirable inferential properties of probability sample statistics apply to the statistics computed on the entire sample. Let’s assume that in addition to the r respondents to the survey, there are m (for “missing”) nonrespondents. Then the total sample size is n=r+m. In the computation mentioned we miss information on the m missing cases.
How does this affect our estimation of the population mean, Y¯? Let’s make first a simplifying assumption. Assume that everyone in the target population is either, permanently and forevermore, a respondent or a nonrespondent. Let the entire target population, thereby, be defined as N=R+M, where the capital letters denote numbers in the total population.
Assume that we are unaware at the time of sample selection about which stratum each person occupies. Then in drawing our sample of size n, we will likely select some respondents and some nonrespondents. They total n in all cases, but the actual number of respondents and nonrespondents in any one sample will vary. We know that in expectation that the fraction of sample cases that are respondents should be equal to the fraction of population cases that lie in the respondent stratum, but there will be sampling variability about that number. That is, E(r)=fR, where f is the sampling fraction used to draw the sample from the population. Similarly, E(m)=fM.
For each possible sample we could draw, given the sample design, we could express a difference between the full sample mean, n, and the respondent mean, in the following way:
(3)
which, with a little manipulation, becomes
(4)
RESPONDENT MEAN-TOTAL SAMPLE MEAN=(NONRESPONSE RATE)* (DIFFERENCE BETWEEN RESPONDENT AND NONRESPONDENT MEANS)
This shows that the deviation of the respondent mean from the full sample mean is a function of the nonresponse rate (m/n) and the difference between the respondent and nonrespondent means.
Under this simple expression, what is the expected value of the respondent mean over all samples that could be drawn given the same sample design? The answer to this question determines the nature of the bias in the respondent mean, where “bias” is taken to mean the difference between the expected value (over all possible samples given a specific design) of a statistic and the statistic computed on the target population. That is, in cases of equal probability samples of fixed size, the bias of the respondent mean is approximately
(5)
BIAS(RESPONDENT MEAN)=(NONRESPONSE RATE IN POPULATION)* (DIFFERENCE IN RESPONDENT AND NONRESPONDENT POPULATION MEANS)
where the capital letters denote the population equivalents to the sample values. This shows that the larger the stratum of nonrespondents, the higher the bias of the respondent mean, other things being equal. Similarly, the more distinctive the nonrespondents are from the respondents, the larger the bias of the respondent mean.
These two quantities, the nonresponse rate and the differences between respondents and nonrespondents on the variables of interest, are key issues to surveys of the welfare population.
Figures 1–1a to 1–1d through show four alternative frequency distributions for respondents and nonrespondents on a hypothetical variable, y, measured on all cases in some target population. The area under the curves is proportional to the size of the two groups, respondents and nonrespondents. These four figures correspond to the four rows in Table 1–1 that show response rates, means of respondents and nonrespondents, bias, and percentage bias for each of the four cases.
The first case reflects a high response rate survey and one in which the nonrespondents have a distribution of y values quite similar to that of the respon-
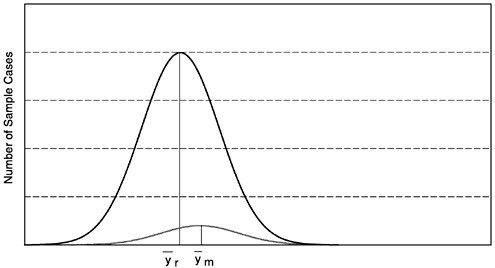
FIGURE 1–1a High response rate, nonrespondents similar to respondents.
SOURCE: Groves and Couper (1998).
NOTE: y=outcome variable of interest.
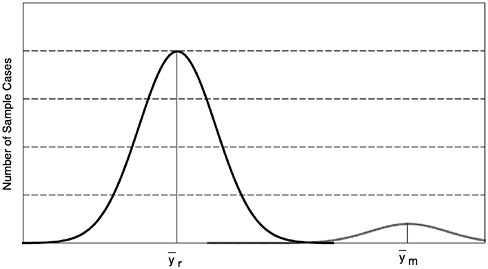
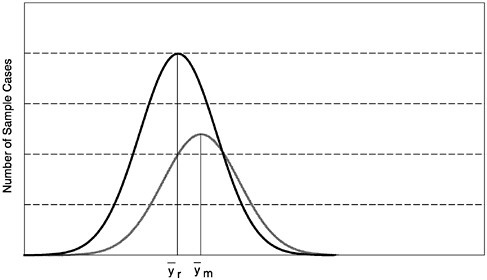
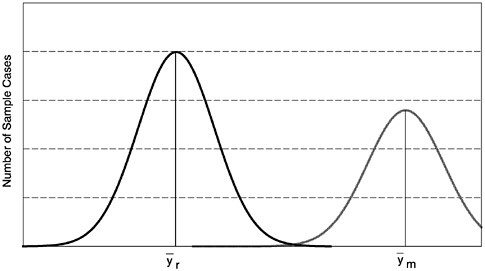
FIGURE 1–1d Low response rate, nonrespondents different from respondents
SOURCE: Groves and Couper (1998).
NOTE: y=outcome variable of interest.
dents. This is the lowest bias case; both factors in the nonresponse bias are small. For example, assume the response rate is 95 percent, the respondent mean for reported expenditures on clothing for a quarter is $201.00, and the mean for nonrespondents is $228.00. Then the nonresponse error is .05($201.00-$228.00) =-$1.35.
The second case, like the first, is a low nonresponse survey, but now the nonrespondents tend to have much higher y values than the respondents. This means that the difference term, (![]() ), is a large negative number, meaning the respondent mean underestimates the full population mean. However, the size of the bias is small because of the low nonresponse rate. Using the same example as above, with a nonrespondent mean now of $501.00, the bias is .05($201.00-$501.00)=-$15.00.
), is a large negative number, meaning the respondent mean underestimates the full population mean. However, the size of the bias is small because of the low nonresponse rate. Using the same example as above, with a nonrespondent mean now of $501.00, the bias is .05($201.00-$501.00)=-$15.00.
The third case shows a very high nonresponse rate (the area under the respondent distribution is about 50 percent greater than that under the nonrespondent—a nonresponse rate of 40 percent). However, as in the first graph, the values on y of the nonrespondents are similar to those of the respondents. Hence, the respondent mean again has low bias due to nonresponse. With the same example as mentioned earlier, the bias is .40($201.00-$228.00)=[-$10.80].
The fourth case is the most perverse, exhibiting a large group of nonrespondents who have much higher values in general on y than the respondents. In this case, both m/n is large (judging by the area under the nonrespondent curve) and (![]() ) is large in absolute terms. This is the case of large non-
) is large in absolute terms. This is the case of large non-
TABLE 1–1 Bias and Percentage Bias in Respondent Mean Relative to Total Sample Mean for Four Situations in Figures 1–1a–1 to 1d and Sample Size of Nonrespondents Needed to Detect the Nonresponse Bias
|
Response Rate |
Difference |
Response Rate Percentage |
Respondent Mean |
Nonrespondent Mean |
Total Sample Mean |
Bias |
Bias Percentage |
Required Sample Size of Nonrespondents |
|
High |
Small |
95 |
$201 |
$228 |
$202 |
$1.35 |
-0.7 |
20,408 |
|
High |
Large |
95 |
$201 |
$501 |
$216 |
$15.00 |
-6.9 |
210 |
|
Low |
Small |
60 |
$201 |
$228 |
$212 |
$10.80 |
-5.1 |
304 |
|
Low |
Large |
60 |
$201 |
$501 |
$321 |
$120.00 |
-37.4 |
7 |
response bias. Using the previous example, the bias is .40($201.00–$501.00)=−$120.00, a relative bias of 37 percent compared to the total sample mean!
These four very different situations also have implications for studies of nonrespondents. Let’s imagine we wish to mount a special study of nonrespondents in order to test whether the respondent mean is biased. The last column of Table 1–1 shows the sample size of nonrespondents required to obtain the same stability for a bias ratio estimate (assuming simple random sampling and the desire to estimate a binomial mean statistic with a population value of .50). The table shows that such a nonresponse study can be quite small (n=7) and still be useful to detect the presence of nonresponse bias in a low-response-rate survey with large differences between respondents and nonrespondents (the fourth row of the table). However, the required sample size to obtain the same precision for such a nonresponse bias test in the high-response-rate case is very large (n=20,408, in the first row). Unfortunately, prior to a study being fielded, it is not possible to have much information on the size of the likely nonresponse bias.
Nonresponse Error on Different Types of Statistics
The discussion in the previous section focused on the effect of nonresponse on estimates of the population mean, using the sample mean. This section briefly reviews effects of nonresponse on other popular statistics. We examine the case of an estimate of a population total, the difference of two subclass means, and a regression coefficient.
The Population Total
Estimating the total number of some entity is common in federal, state, and local government surveys. For example, most countries use surveys to estimate the total number of unemployed persons, the total number of new jobs created in a month, the total retail sales, and the total number of criminal victimizations. Using similar notation as previously, the population total is ∑Yi, which is estimated by a simple expansion estimator, ∑wiyi, or by a ratio expansion estimator, X(∑wiyi/∑wixi), where X is some auxiliary variable, correlated with Y, for which target population totals are known. For example, if y were a measure of the length of first employment spell of a welfare leaver, and x were a count of sample welfare leavers, X would be a count of the total number of welfare leavers.
For variables that have nonnegative values (like count variables), simple expansion estimators of totals based only on respondents always underestimate the total. This is because the full sample estimator is
(6)
FULL SAMPLE ESTIMATE OF POPULATION TOTAL=RESPONDENT-BASED ESTIMATE+NONRESPONDENT-BASED ESTIMATE
Hence, the bias in the respondent-based estimator is
(7)
It is easy to see, thereby, that the respondent-based total (for variables that have nonnegative values) always will underestimate the full sample total, and thus, in expectation, the full population total.
The Difference of Two Subclass Means
Many statistics of interest from sample surveys estimate the difference between the means of two subpopulations. For example, the Current Population Survey often estimates the difference in the unemployment rate for black and nonblack men. The National Health Interview Survey estimates the difference in the mean number of doctor visits in the past 12 months between males and females.
Using the expressions above, and using subscripts 1 and 2 for the two subclasses, we can describe the two respondent means as
(8)
(9)
These expressions show that each respondent subclass mean is subject to an error that is a function of a nonresponse rate for the subclass and a deviation between respondents and nonrespondents in the subclass. The reader should note that the nonresponse rates for individual subclasses could be higher or lower than the nonresponse rates for the total sample. For example, it is common that nonresponse rates in large urban areas are higher than nonresponse rates in rural areas. If these were the two subclasses, the two nonresponse rates would be quite different.
If we were interested in ![]() as a statistic of interest, the bias in the difference of the two means would be approximately
as a statistic of interest, the bias in the difference of the two means would be approximately
(10)
Many survey analysts are hopeful that the two terms in the bias expression cancel. That is, the bias in the two subclass means is equal. If one were dealing with two subclasses with equal nonresponse rates that hope is equivalent to a
hope that the difference terms are equal to one another. This hope is based on an assumption that nonrespondents will differ from respondents in the same way for both subclasses. That is, if nonrespondents tend to be unemployed versus respondents, on average, this will be true for all subclasses in the sample.
If the nonresponse rates were not equal for the two subclasses, then the assumptions of canceling biases is even more complex. For example, let’s continue to assume that the difference between respondent and nonrespondent means is the same for the two subclasses. That is, assume ![]() . Under this restrictive assumption, there can still be large nonresponse biases.
. Under this restrictive assumption, there can still be large nonresponse biases.
For example, Figure 1–2 examines differences of two subclass means where the statistics are proportions (e.g., the proportion currently employed). The figure treats the case in which the proportion employed among respondents in the first subclass (say, women on welfare a long time) is ![]() r1=0.5 and the proportion employed among respondents in the second subclass (say, women on welfare a short time) is
r1=0.5 and the proportion employed among respondents in the second subclass (say, women on welfare a short time) is ![]() r2=0.3. This is fixed for all cases in the figure. We examine the nonresponse bias for the entire set of differences between respondents and nonrespondents. That is, we examine situations where the differences between respondents and nonrespondents lie between -0.5 and 0.3. (This difference applies to both subclasses.) The first case of a difference of 0.3 would correspond to
r2=0.3. This is fixed for all cases in the figure. We examine the nonresponse bias for the entire set of differences between respondents and nonrespondents. That is, we examine situations where the differences between respondents and nonrespondents lie between -0.5 and 0.3. (This difference applies to both subclasses.) The first case of a difference of 0.3 would correspond to
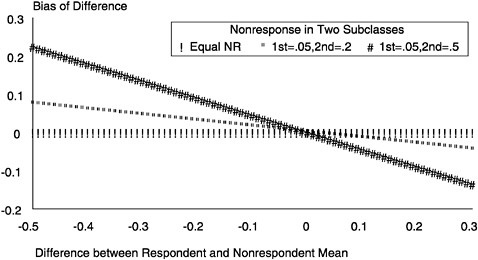
FIGURE 1–2 Illustration of nonresponse bias for difference between proportion currently employed (0.5 employed among respondents on welfare a short time versus 0.3 employed among respondents on welfare a long time), given comparable differences in each subclass between respondents and nonrespondents.
SOURCE: Groves and Couper (1998).
The figure shows that when the two nonresponse rates are equal to one another, there is no bias in the difference of the two subclass means. However, when the response rates of the two subclasses are different, large biases can result. Larger biases in the difference of subclass means arise with larger differences in nonresponse rates in the two subclasses (note the higher absolute value of the bias for any given [![]() r-
r-![]() m] value for the case with a .05 nonresponse rate in subclass [1 and a 0.5, in subclass 2] than for the other cases).
m] value for the case with a .05 nonresponse rate in subclass [1 and a 0.5, in subclass 2] than for the other cases).
A Regression Coefficient
Many survey data sets are used by analysts to estimate a wide variety of statistics measuring the relationship between two variables. Linear models testing causal assertions often are estimated on survey data. Imagine, for example, that the analysts were interested in the model
(11)
which using the respondent cases to the survey, would be estimated by
(12)
The ordinary least squares estimator of ßr1 is
(13)
Both the numerator and denominator of this expression are subject to potential nonresponse bias. For example, the bias in the covariance term in the numerator is approximately
(14)
where srxy is the respondent-based estimate of the covariance between x and y based on the sample (Srxy is the population equivalent) and Smxy is a similar quantity for nonrespondents.
This bias expression can be either positive or negative in value. The first term in the expression has a form similar to that of the bias of the respondent mean. It reflects a difference in covariances for the respondents (Srxy) and nonrespondents (Smxy). It is large in absolute value when the nonresponse rate is large. If the two variables are more strongly related in the respondent set than in the nonrespondent, the term has a positive value (that is the regression coefficient
tends to be overestimated). The second term has no analogue in the case of the sample mean; it is a function of cross-products of difference terms. It can be either positive or negative depending on these deviations.
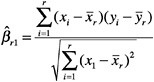
As Figure 1–3 illustrates, if the nonrespondent units have distinctive combinations of values on the x and y variables in the estimated equation, then the slope of the regression line can be misestimated. The figure illustrates the case when the pattern of nonrespondent cases (designated by “◯”) differ from that of respondent cases (designated by “■”). The result is the fitted line on respondents only has a larger slope than that for the full sample. In this case, normally the analyst would find more support for a hypothesized relationship than would be true for the full sample.
We can use equation (14) to illustrate notions of “ignorable” and “nonignorable” nonresponse. Even in the presence of nonresponse, the nonresponse bias of regression coefficients may be negligible if the model has a specification that reflects all the causes of nonresponse related to the dependent variable. Consider a survey in which respondents differ from nonrespondents in their employment status because there are systematic differences in the representation of different education and race groups among respondents and nonrespondents. Said differently, within education and race groups, the employment rates of respondents and nonrespondents are equivalent. In this case, ignoring this informa-
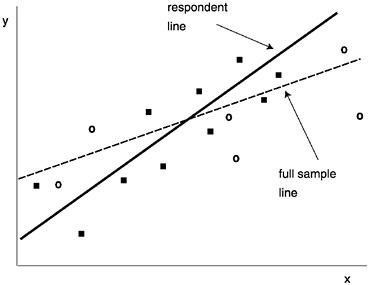
FIGURE 1–3 Illustration of the effect of unit nonresponse on estimated slope of regression line.
SOURCE: Groves and Couper (1998).
tion will produce a biased estimate of unemployment rates. Using an employment rate estimation scheme that accounts for differences in education and race group response rate can eliminate the bias. In equation (12), letting x be education and race can reduce the nonresponse bias in estimating a y, employment propensity.
Considering Survey Participation a Stochastic Phenomenon
The previous discussion made the assumption that each person (or household) in a target population either is a respondent or a nonrespondent for all possible surveys. That is, it assumes a fixed property for each sample unit regarding the survey request. They always will be a nonrespondent or they always will be a respondent, in all realizations of the survey design.
An alternative view of nonresponse asserts that every sample unit has a probability of being a respondent and a probability of being a nonrespondent. It takes the perspective that each sample survey is but one realization of a survey design. In this case, the survey design contains all the specifications of the research data collection. The design includes the definition of the sampling frame; the sample design; the questionnaire design; choice of mode; hiring, selection, and training regimen for interviewers; data collection period, protocol for contacting sample units; callback rules; refusal conversion rules; and so on. Conditional on all these fixed properties of the sample survey, sample units can make different decisions regarding their participation.
In this view, the notion of a nonresponse rate takes on new properties. Instead of the nonresponse rate merely being a manifestation of how many nonrespondents were sampled from the sampling frame, we must acknowledge that in each realization of a survey different individuals will be respondents and nonrespondents. In this perspective the nonresponse rate given earlier (m/n) is the result of a set of Bernoulli trials; each sample unit is subject to a “coin flip” to determine whether it is a respondent or nonrespondent on a particular trial. The coins of various sample units may be weighted differently; some will have higher probabilities of participation than others. However, all are involved in a stochastic process of determining their participation in a particular sample survey.
The implications of this perspective on the biases of respondent means, respondent totals, respondent differences of means, and respondent regression coefficients are minor. The more important implication is on the variance properties of unadjusted and adjusted estimates based on respondents.
Postsurvey Compensation for Nonresponse
Two principal techniques are used to account for unit nonresponse in the analysis of survey data: weighting and imputation. In computing final statistics, weighting attempts to increase the importance of data from respondents who are in classes with large nonresponse rates and decrease their importance when they
are members of classes with high response rates. Imputation creates data records for nonrespondents by examining patterns of attributes that appear to co-occur among respondents, and then estimating the attributes of the nonrespondents based on information common to respondents and nonrespondents.
All adjustments to the analysis of data in the presence of nonresponse can affect survey conclusions: both the value of a statistic and the precision of the statistic can be affected.
Weighting to Adjust Statistics for Nonresponse
Two kinds of weighting are common to survey estimation in the presence of nonresponse: population-based weighting (sometimes called poststratification) and sample-based weighting. Population weighting applies known population totals on attributes from the sampling frame to create a respondent pool that resembles the population on those attributes. For example, if the Temporary Assistance for Needy Families (TANF) leavers’ frame were used to draw a sample and auxiliary information were available on food stamp, general assistance, Supplemental Security Income (SSI), Medicaid, and foster care payment receipt, it would be possible to use those variables as adjustment factors. The ideal adjustment factors are those that display variation in response rates and variation on key survey statistics. To illustrate, Table 1–2 shows a survey estimating percentage of TANF leavers employed, in different categories of prior receipt status. In this hypothetical case, we are given the number of months unemployed of sample persons (both employed and unemployed). We can see that the mean number of months unemployed is 3.2 for respondents but 6.5 for nonrespondents. In this case we have available an attribute known on the entire population (the type of transfer payments received), and this permits an adjustment of the overall mean.
TABLE 1–2 Illustration of Proportion of TANF Leavers Currently Employed, by Type of Assistance Received, for Population, Sample, Respondents, and Nonrespondents
|
|
Sample |
Respondents |
Nonrespondents |
||||
|
Category |
Population N |
n |
Response Rate |
n |
Months Unemployed |
n |
Months Unemployed |
|
General assistance only |
5,000 |
50 |
.95 |
47 |
0.2 |
3 |
0.1 |
|
Gen. asst. and food stamps |
30,000 |
300 |
.90 |
270 |
0.5 |
30 |
0.4 |
|
Gen. asst. and SSI |
30,000 |
300 |
.90 |
270 |
3.2 |
30 |
3.1 |
|
Gen. asst. and other |
35,000 |
350 |
.50 |
175 |
8.1 |
175 |
8.2 |
|
Total |
100,000 |
1,000 |
.76 |
762 |
3.2 |
238 |
6.5 |
The adjusted mean merely assures that the sample statistic will be based on the population distribution of the sampling frame, on the adjustment variable. In this case, the adjusted respondent mean equals 0.05*0.2+0.3*0.5+0.3*3.2+0.35*8.1=3.955. (The true mean is 3.966.)
Why does this seem to work? The adjustment variable is both correlated to the response rate and correlated to the dependent variable. In other words, most of the problem of nonresponse arises because the respondent pool differs from the population on the distribution of type of transfer payment. Restoring that balance reduces the nonresponse error. This is not always so. If the adjustment variables were related to response rates but not to the survey variable, then adjustment would do nothing to change the value of the survey statistic.
What cannot be seen from the illustration is the effects on the precision of the statistic of the adjustment. When population weights are used, the effect is usually to increase the precision of the estimate, a side benefit (Cochran, 1977). For that reason, attempting to use sampling frames rich in auxiliary data is a wise design choice in general. Whenever there are possibilities of linking to the entire sampling frame information that is correlated with the likely survey outcomes, then these variables are available for population-based weighting. They can both reduce nonresponse bias and variance of estimates.
What can be done when there are no correlates of nonresponse or the outcome variables available on all sample frame elements? The next best treatment is to collect data on all sample elements, both respondent and nonrespondent, that would have similar relationships to nonresponse likelihood and survey outcomes. For example, it is sometimes too expensive to merge administrative data sets for all sample frame elements but still possible for the sample. In this case, a similar weighting scheme is constructed, but using information available only on the sample. Each respondent case is weighted by the reciprocal of the response rate of the group to which it belongs. This procedure clearly relies on the assumption that nonresepondents and respondents are distributed identically given group membership (i.e., that nonrespondents are missing at random). Sometimes this weighting is done in discrete classes, as with the example in Table 1–2; other times “response propensity” models that predict the likelihood that each respondent was actually measured, given a set of attributes known for respondents and nonrespondents are constructed (Ekholm and Laaksonen, 1991).
Whatever is done with sample-based weights, it is generally the case that the precision of weighted sample estimates is lower than that of estimates with no weights. A good approximate of the sampling variance (square of standard error) of the adjusted mean in a simple random sample is
(15)
where the wh is the proportion of sample cases in a weight group with rh respondents, yrh is the mean of the respondents in that group, and ys is the overall sample
mean based on all n cases. The first term is what the sampling variance would be for the mean if the sample had come from a sample stratified by the weight classes. The second term reflects the lack of control of the allocation of the sample across the weight classes; this is the term that creates the loss of precision (as well as the fact that the total sample size is reduced from n to ∑rh, where (∑rh/n) is the response rate.)
One good question is why weights based on the full population tend to improve the precision of estimates and why weights based on the sample reduce the precision. This rule of thumb is useful because, other things being equal, sample-based nonresponse weights are themselves based on a single sample of the population. Their values would vary over replications of the sample; hence, they tend not to add stability to the estimates but further compound the instability of estimates. Although this greater instability is unfortunate, most uses of such sample-based weights are justified by the decrease in the biasing effects of nonresponse. Thus, although the estimates may have higher variability over replications, they will tend to have averages closer to the population parameter.
Imputation to Improve Estimates in the Face of Missing Data
The second approach to improving survey estimation when nonresponse is present is imputation. Imputation uses information auxiliary to the survey to create values for individual missing items in sample data records. Imputation is generally preferred over weighting for item-missing data (e.g., missing information on current wages for a respondent) than for unit nonresponse (e.g., missing an entire interview). Weighting is more often used for unit nonresponse.
One technique for imputation in unit nonresponse is hot deck imputation, which uses data records from respondents in the survey as substitutes for those missing for nonrespondents (Ford, 1983). The technique chooses “donor” respondent records for nonrespondents who share the same classification on some set of attributes known on all cases (e.g., geography, structure type). Ideally, respondents and nonrespondents would have identical distributions on all survey variables within a class (similar logic as applies to weighting classes). In other words, nonrespondents are missing at random (MAR). The rule for choosing the donor, the size of the classes, and the degree of homogeneity within classes determine the bias and variance properties of the imputation.
More frequently imputation involves models, specifying the relationship between a set of predictors known on respondents and nonrespondents and the survey variables (Little and Rubin, 1987). These models are fit on those cases for which the survey variable values are known. The coefficients of the model are used to create expected values, given the model, for all nonrespondent cases. The expected values may be altered by the addition of an error term from a specified distribution; the imputation may be performed multiple times (Rubin, 1987) in order to provide estimates of the variance due to imputation.
Common Burdens of Adjustment Procedures
We can now see that all practical tools of adjustment for nonresponse require information auxiliary to the survey to be effective. This information must pertain both to respondents and nonrespondents to be useful. To offer the chance of reducing the bias of nonresponse, the variables available should be correlated both with the likelihood of being a nonrespondent and the survey statistic of interest itself. When the dependent variable itself is missing, strong models positing the relationship between the likelihood of nonresponse and the dependent variable are required. Often the assumptions of these models remain untestable with the survey data themselves.
Researchers can imagine more useful adjustment variables than are actually available. Hence, the quality of postsurvey adjustments are limited more often by lack of data than by lack of creativity on the part of the analysts.
DECOMPOSING THE SURVEY PARTICIPATION PHENOMENON
The phenomenon of survey participation is sequential and nested. First, the location of sample persons must be determined. Second, sample persons must be contacted. Third, they are given a request for survey information. Those not contacted make no decision regarding their participation that is known by the survey organization. Those contacted and given a survey request can cooperate, they can refuse, or they can provide information that communicates that they cannot physically or cognitively perform the respondent role. Because these are four separate processes, it is important to keep them as separate nonresponse phenomena: failure to locate, noncontact, refusals, and “other noninterview” is a common category-labeling scheme.
Locating Sample Persons
The first step in gaining contact with a sample person, when selected from a list of persons, is locating that person.1 If the sample person has not changed address or telephone number from the time the list was prepared, this is a trivial issue. The difficulty arises when persons or households change addresses. The propensity of locating units is driven by factors related to whether or not the unit moves and the quality of contact information provided at the time of initial data collection.
A number of survey design features may affect the likelihood of locating sample units. For example, the quality of the contact information decays as time
between the initial data collection (or creation of the list) and the followup survey increases. Similarly, tracking rules affect location propensity. For cost reasons, a survey organization may track people only within a limited geographic area, such as a county or within a country. The amount and quality of information collected by the survey organization specifically for tracking movers also is driven by cost considerations. The more reliable and valid data available for tracking purposes can reduce tracking effort, and make more resources available for those units that are proving to be particularly difficult to locate.
Household characteristics also affect the likelihood of moving, and thus the propensity to locate the household or household members. Geographic mobility is related to the household or individual life stage, as well as cohort effects. For example, younger people are typically much more mobile than older persons. The number of years that a household or individual has lived at a residence, the nature of household tenure (i.e., whether the household members own or rent the dwelling), and community attachments through family and friends also determine the likelihood of moving.
Household income is strongly related to residential mobility. Using data from the Current Population Survey, we find that 19.6 percent of those with household incomes under $10,000 had moved between March 1996 and March 1997, compared to 10 percent of those with incomes above $75,000. Similarly, 25.9 percent unemployed persons age 16 or older had moved in this period, compared to 16.8 percent of those employed, and 11.1 percent not in the labor force.
Life events also are known to be related to moving likelihood. A birth in a household, a death of a significant individual, marriage, job change, crime victimization, and other events are associated with increased likelihood of moving. Furthermore, these life events may increase the difficulty of locating individuals. For example, a name change in marriage or following divorce can make it more difficult to track and locate someone who has moved. This is particularly relevant for welfare leaver studies, as this population is likely to be undergoing these very types of changes.
An important factor that can reduce the likelihood of moving, or provide more data on units that do move, is the social aspect of community attachment or connectedness. Individuals who are engaged in the civic aspects of their community or participate socially are posited to be more stable and less likely to move. Furthermore, those linked into their current community life are likely to leave many traces to their new address, and likely to be politically, socially, and economically engaged in their new community. Their lives are more public and accessible through multiple databases such as telephone directories, credit records, voter registration, library registration, membership in churches or religious organizations, or children in schools. Again, we expect that sample units in welfare leaver studies are not particularly rich in these sources of tracking information.
To the extent that the survey variables of interest are related to mobility, lifestyle changes, social isolation, or willingness to be found, nonresponse through nonlocation can lead to bias. Because these studies are primarily about changes in individual lives, failure to obtain complete data on the more mobile or those subject to lifestyle changes will underrepresent individuals with these particular characteristics in such surveys. Furthermore, the effects of disproportionate representation in the sample due to mobility or lifestyle changes may not be simply additive. For example, we expect that those who do not have a telephone and those who refuse to provide a telephone number both would be difficult to locate in subsequent waves of a survey, but for different reasons.
The Process of Contacting Sample Persons
Theoretically the process of contacting a sample household, once located, is rather straightforward. As Figure 1–4 shows, the success at contacting a household should be a simple function of the times at which at least one member of the household is at home, the times at which interviewers call, and any impediments the interviewers encounter in gaining access to the housing unit. In face-to-face surveys the latter can include locked apartment buildings, gated housing complexes, no-trespassing enforcement, as well as intercoms or any devices that limit contact with the household. In telephone surveys, the impediments include “caller ID,” “call blocking,” or answering machines that filter or restrict direct contact with the household.
In most surveys the interviewer has no prior knowledge about the at-home behavior of a given sample household. In face-to-face surveys interviewers report that they often make an initial visit to a sample segment (i.e., a cluster of neighboring housing units sampled in the survey) during the day in order to gain initial intelligence about likely at-home behaviors. During this visit the interviewer looks for bicycles left outside (as evidence of children), signs of difficulty of
FIGURE 1–4 Influences on the likelihood of contact with a sample household.
SOURCE: Groves and Couper (1998).
accessing the unit (e.g., locked apartment buildings), small apartments in multiunit structures (likely to be single-person units), absence of automobiles, or other signs. Sometimes when neighbors of the sample household are available, interviewers seek their advice on a good time to call on the sample unit. This process is the practical method of gaining proxy information about what call times might successfully encounter the household members at home. In telephone surveys, no such intelligence gathering is possible. The only information about at-home practices of a sample household is obtained by calling the number. (This imbalance leads to the larger number of calls required to make first contact with a household in telephone surveys; see Groves and Kahn, 1979.)
Information from time-use surveys, which ask persons to report on their activities hour by hour, has shown common patterns of at-home behavior by weekday mornings and afternoons, weekday evenings, and weekends. Those in the employed labor force are commonly out of the house, with the lowest rates of occupancy between 10 a.m. and 4:30 p.m. (Hill, 1978). Interviewers make repeated calls on households they do not contact on the first call. Their choice of time for those callbacks can be viewed as repeated samples from a day-of-week, time-of-day frame. They base their timing of successive calls on information they obtain on prior unsuccessful visits and on some sense of consistency. For example, interviewers often are trained to make a callback on a unit not contacted at the last visit on Tuesday afternoon, by visiting during an evening or weekend.
Physical impediments are sometimes so strong that they literally prevent all contact with a sample unit. For example, some higher priced multiunit structures have doormen that are ordered to prevent entrance of all persons not previously screened by a resident. Such buildings may be fully nonrespondent to face-to-face surveys. Similarly, although there is evidence that the majority of owners of telephone answering machines use them to monitor calls to their unit when they are absent, some apparently use them to screen out calls when they are at home (see Tuckel and Feinberg, 1991; Tuckel and O’Neill, 1995), thus preventing telephone survey interviewers from contacting the household.
Other impediments to contacting households may offer merely temporary barriers, forcing the interviewer to make more than the usual number of calls before first contacting the households. For example, apartment buildings whose entrance is controlled by a resident manager may require negotiations with the manager before access to sample households is given.
Is there empirical evidence regarding the model in Figure 1–4? First, let’s look at the distribution of the number of calls required to make first contact with a sample household. Figure 1–5 shows the proportion of sample households contacted by calls to first contacts. This figure displays the result for several surveys at once, some telephone and some face to face. The pattern is relatively stable across the surveys, with the modal category being the first call-immediate contact with someone in the household. The proportion contacted on later calls is uniformly decreasing in subsequent calls. Rather uniformly, if the first call at-
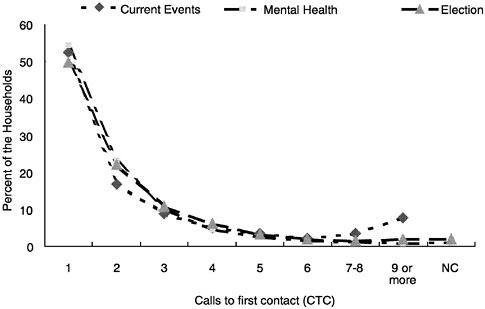
FIGURE 1–5 Percentage of eligible households contacted by calls to first contact.
tempt is unsuccessful, the likelihood of contact declines with each successive call. Does the character of sample households vary by calls to first contact? Figure 1–6 shows an increasing percentage of the households are single-person households as the number of calls to first contact increases. Single-person households tend to be more difficult to contact. Other analysis shows that the exception to this tendency is single-person households with elderly persons, which tend to be home more often than other households. Figure 1–7 shows a similar result for an access impediment in telephone surveys, the answering machine, which now is present in more than 50 percent of homes nationwide (Tuckel and O’Neil, 1995). The percentage of contacted households with answering machines increases with each succeeding category of number of calls to first contact. Households with answering machines slow down contact with household members, requiring more calls to first contact.
Other empirical results are similar to these could be presented. Households with access impediments slow down contact of interviewers with sample units. More calls are required to even deliver the survey request. Furthermore, households that are home less often require more calls; these include households where all adult members work out of the home during the day, urban versus rural households, and in telephone surveys, unlisted households.
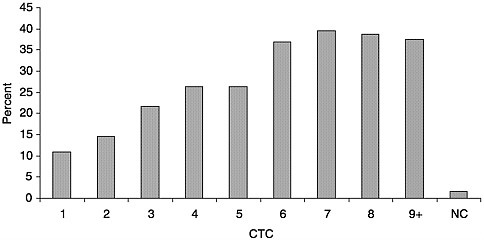
FIGURE 1–6 Percentage of contacted households with one person, by calls to first contact (National Survey of Health and Stress).
The Decision to Participate in a Survey
Once the interviewer contacts a sample household we believe that the influences on the householder’s decision to participate arise from relatively stable features of their environments and backgrounds, fixed features of the survey design, as well as quite transient, unstable features of the interaction between the interviewer and the householder. This conceptual scheme is portrayed in Figure 1–8,
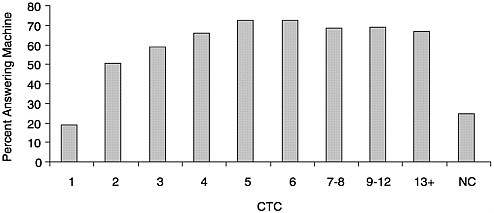
FIGURE 1–7 Percentage of contacted households with an answering machine by calls to first contact.
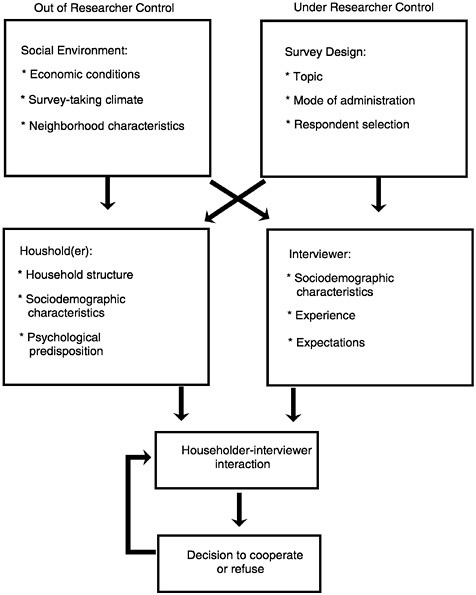
FIGURE 1–8 A conceptual framework for survey cooperation.
SOURCE: Groves and Couper (1998).
which lists influences of the social environment, householder, survey design features, interviewer attributes and behavior, and the contact-level interaction of interviewers and householders.
The influences on the left of the figure (social environment and sample household) are features of the population under study, out of control of the researcher. The influences on the right are the result of design choices by the
researcher, affecting the nature of the survey requests and the attributes of the actors (the interviewers) who deliver them. The bottom of the figure, describing the interaction between the interviewer and the householder, is the occasion when these influences come to bear. Which of the various influences are made most salient during that interaction determines the decision outcome of the householder.
Social Environmental Influences on Survey Participation
Because surveys are inherently social events, we would expect that societal and group-level influences might affect their participation rates. There is a set of global characteristics in any society that affect survey participation. These factors serve to determine the context within which the request for participation takes place, and constrain the actions of both householder and interviewer. For example, the degree of social responsibility felt by a sample person may be affected by factors such as the legitimacy of societal institutions, the degree of social cohesion, and so on. Such factors influence not only the expectations that both interviewer and respondent bring to the interaction, but also determine the particular persuasion strategies (on the part of the interviewer) and decision-making strategies (on the part of the respondent) that are used. More specific to the survey-taking climate are such factors as the number of surveys conducted in a society (the “oversurveying” effect) and the perceived legitimacy of surveys.
We would expect, therefore, to the extent that societies differ on these attributes to observe different levels of cooperation for similar surveys conducted in different countries. There is evidence for this (see De Heer and Israëls, 1992), but the evidence is clouded by different design features used across countries, especially intensity of effort to reduce nonresponse. These include different protocols for advance contact with sample households, for repeated callbacks on noncontacted cases, and for dealing with initial refusals.
There are also environmental influences on survey cooperation below the societal level. For example, urbanicity is one of the most universal correlates of cooperation across the world. Urban dwellers tend to have lower response rates than rural dwellers. This contrast has been commonly observed in part because the urbanicity variable is often available from the sampling frame. The nature of urbanicity effects on response rates has been found to be related to crime rates (House and Wolf, 1978), but also may be related to population density, the type of housing structures, and household composition in urban areas. The effect also may be a function of inherent features of urban life—the faster pace, the frequency of fleeting single-purpose contacts with strangers, and the looser ties of community in such areas.
Characteristics of the Sample Householder
The factors affecting nonresponse that are most widely discussed in the survey literature are sociodemographic characteristics of the householder or sample person. These include age, gender, marital status, education, and income. Response rates have been shown to vary with each of these, as well as other, characteristics.
Other factors associated with these also have been studied for their relationship to response rates. These include household structure and characteristics, such as the number and ages of the household members and the quality and upkeep of housing, and the experience of the respondent, such as exposure to situations similar to the interview interaction or a background that provided information or training relevant to the survey topic.
We do not believe these factors are causal to the participation decision. Instead, they tend to produce a set of psychological predispositions that affect the decision. Some of them are indicators of the likely salience of the topic to the respondent (e.g., socioeconomic indicators on income-related surveys); others are indicators of reactions to strangers (e.g., single-person households).
The sociodemographic factors and household characteristics all may influence the householder’s psychological predispositions. Feelings of efficacy, embarrassment, or helpfulness and moods of depression, elation, or anger all will be affected by these factors. All of these characteristics will then influence the cognitive process that will occur during the interaction with the interviewer.
Few householders appear to have strongly preformed decisions about survey requests. Rather, these decisions are made largely at the time of the request for participation. Much social and cognitive psychological research on decision making (e.g., Eagly and Chaiken, 1984; Petty and Caccioppo, 1986) has contrasted two types of processes. The first is deep, thorough consideration of the pertinent arguments and counterarguments of the costs and benefits of options. The second is shallower, quicker, more heuristic decision making based on peripheral aspects of the options. We have a very specific meaning of “heuristic” in this context—use of general rules of behavior (e.g., strange men at the telephone are to be avoided) to guide the survey decision rather than judgments based on the specific information provided about the survey.
We believe the survey request situation most often favors a heuristic approach because the potential respondent typically does not have a large personal interest in survey participation and, consequently, is not inclined to devote large amounts of time or cognitive energy to the decision of whether or not to participate. Furthermore, little of the information typically provided to the householder pertains to the details of the requested task. Instead, interviewers describe the purpose of the survey, the nature of the incentive, or the legitimacy of the sponsoring organization. All of these in some sense are peripheral to the respondent’s task of listening to the interviewer’s questions, seriously considering alternative answers, and honestly reporting one’s judgment.
Cialdini (1984) has identified several compliance principles that guide some heuristic decision making on requests and appear to be activated in surveys. These include reciprocation, authority, consistency, scarcity, social validation, and liking. We review these briefly there (see also Groves et al., 1992) and link them to other concepts used in the literature.
Reciprocation. This heuristic suggests that a householder should be more willing to comply with a request to the extent that compliance constitutes the repayment of a perceived gift, favor, or concession. Thus, one may choose to participate in a survey based on a perceived sense of obligation to the organization making the request, or to the broader society it represents. On a narrower level, more peripheral features of the request (e.g., incentives, interviewer compliments) may be sufficient to invoke the reciprocity heuristic.
Reciprocation, as a concept, is closely related to sociological notions of social exchange. Social exchange theories tend to focus on long-run relationships between individuals and groups, but contain the same influence of past favors given by another influencing similar actions by a focal person or group.
Authority. People are more likely to comply with a request if it comes from a properly constituted authority, someone who is sanctioned by the society to make such requests and to expect compliance. In the survey interview context, the immediate requester is typically not the authority figure but is seen as representing some sponsoring organization that can be judged to have varying degrees of authority status. Survey organizations with greater legitimacy (e.g., those representing federal government agencies) are more likely to trigger the authority heuristic in influencing the householders’ decision to participate.
Notions of social isolation, the perception by people that they are not part of the larger society or bound by its norms, may be useful here. Socially isolated groups include both those believing they have suffered historical inequities at the hands of major institutions or groups and those identifying quite strongly with a distinct subculture. These types of groups may be guided by the same norms of reciprocation or influences of authority during interactions involving institutions of the majority culture, but in such cases the effect on cooperation may be negative.
We have found concepts of reciprocation and authority very important to understanding the behavior of sample persons. In addition, however, four other compliance heuristics described by Cialdini (1984) are relevant to surveys: consistency, scarcity, social validation, and liking.
Consistency. The consistency heuristic suggests that, after committing oneself to a position, one should be more willing to comply with requests for behaviors that are consistent with that position. This is the likely explanation for the foot-in-the-
door effect in surveys (e.g., Freedman and Fraser, 1966), where compliance with a small initial request leads to greater willingness to accede to a larger request.
Scarcity. This heuristic notes that one should be more willing to comply with requests to secure opportunities that are scarce. To the extent that the survey request is perceived as a rare opportunity to participate in an interesting and/or important activity, the scarcity principle may lead to greater likelihood of acceptance of the request.
Social validation. Using this heuristic, one would be more willing to comply with a request to the degree that one believes similar others are likely to do so. If householders believe that most people like themselves agree to participate in surveys, they may be more inclined to do so themselves.
Liking. Put simply, one should be more willing to comply with the requests of liked others. A variety of factors (e.g., similarity of attitude, background, or dress; praise) have been shown to increase liking of strangers, and these cues may be used to guide the householder’s decision in evaluating the interviewer’s request.
Although we believe these heuristics often come to the fore when a householder is confronted with a request to participate in a survey, other factors more closely associated with a rational choice perspective also may influence their decision.
For example, a common finding in research on attitude change (see, for example, Petty and Caccioppo, 1986) is that when the topic of discussion is highly salient to laboratory subjects, they tend to give careful consideration to the arguments pro and con concerning the topic. Similarly, we think that saliency, relevance, and interest in the survey topic are relevant to the householder’s decision process. That is, when the survey topic is highly relevant to the well-being or for other reasons of interest to the householders, they might perform a more thorough analysis of the merits of cooperating with the survey request.
However, in contrast to the laboratory experiments in the attitude change literature, largely based on willing and motivated subjects, the survey setting probably limits cost-benefit examination of a survey request. Calls by interviewers to sample households generally are unscheduled events. The amount of discretionary time perceived to be possessed by the householders at the time of contact also will affect their tendency to engage in deliberate, careful consideration of the arguments to participate in the survey. Householders who see themselves as burdened by other obligations overwhelmingly may choose heuristic shortcuts to evaluate the survey request.
Attributes of the Survey Design
Much survey research practice is focused on reducing nonresponse by choosing features of the survey design that generate higher participation rates. These by and large are fixed attributes of the request for an interview that are applied to all cases. This section discusses those features in an indirect manner, by identifying and elaborating the concepts that underlie their effectiveness.
Many of the survey design features aimed at gaining cooperation use one or more of the compliance heuristics reviewed earlier. For example, the reciprocation heuristic probably underlies the large literature on the effects of incentives on survey participation rates. Consistent with the concept of reciprocation, there appear to be larger effects of incentives provided prior to the request for the survey, compared to those promised contingent on the completion of the interview (Berk et al., 1987; Singer et al., 1996).
The concept also underlies the common training guideline in some surveys for interviewers to emphasize the potential benefits of the survey to the individual respondent. For example, in the Consumer Expenditure Survey, used as part of the Consumer Price Index of the United States, interviewers often tell elderly householders that their government Social Security payments are affected by the survey.
One implication of the consistency principle for survey design is that an interviewer who can draw a connection between the merits of particular (or general) survey participation and the respondent’s committed beliefs, attitudes, and values (e.g., efficiency in government, advancement of knowledge) is likely to be more successful in gaining compliance.
Evoking authority is a common tool in advance mailings in household surveys and in the introductory script of interviewers. Advance letters often are crafted to use stationery that evokes legitimate authority for the information collection; the letters are signed, whenever possible, by persons with titles conveying power and prestige. Some social surveys (e.g., studies of community issues) seek the endorsement of associations or organizations that would aid the communication of legitimate authority to collect the data. Furthermore, interviewers often are trained to emphasize the sponsor of their survey when the sponsor generally is seen as having legitimate authority to collect the information (e.g., government or educational institutions), but rarely to do so when that is less likely (e.g., certain commercial organizations).
The scarcity principle may underlie the interviewer tactics of emphasizing the value to a respondent of “making your voice heard” or “having your opinion count” while noting that such an opportunity is rare (e.g., “We only contact one person in every 30,000”). This principle may also help explain the decline of survey participation in Western society that has coincided with the proliferation of surveys. People may no longer consider the chance to have their opinions counted as an especially rare, and therefore valuable, event. Consequently, at the
end of the interviewing period, some interviewers are known to say that “There are only a few days left. I’m not sure I’ll be able to interview you if we don’t do it now"—a clear attempt to make the scarcity principle apply.
Similarly, survey organizations and interviewers may attempt to invoke social validation by suggesting that “Most people enjoy being interviewed,” or “Most people choose to participate,” or by evincing surprise at the expression of reluctance by a householder.
The use of race or gender matching by survey organizations may be an attempt to invoke liking through similarity, as well as reducing the potential threat to the householder.
Other survey design features do not fit nicely into the compliance heuristics conceptualized by Cialdini. Indeed, these are much more closely aligned with rational choice, cost versus benefit tradeoff decisions. For example, there is some evidence that longer questionnaires require the interviewer to work harder to gain cooperation. In interviewer-assisted surveys some of the disadvantages can be overcome by interviewer action, but more work is required. Thus, other things being equal, choosing a short survey interview may yield easier attainment of high participation.
Related to burden as measured by time is burden produced by psychological threat or low saliency. Survey topics that ask respondents to reveal embarrassing facts about themselves or that cover topics that are avoided in day-to-day conversations between strangers may be perceived as quite burdensome. For example, surveys about sexual behaviors or income and assets tend to achieve lower cooperation rates, other things being equal, than surveys of health or employment. On the other hand, when the topic is salient to the householders, when they have prior interest in the topic, then the perceived burden of answering questions on the topic is lower. This probably underlies the finding of Couper (1997) that householders who express more interest in politics are interviewed more easily than those with no such interests.
Attributes of the Interviewer
Observable attributes of the interviewer affect participation because they are used as cues by the householder to judge the intent of the visit. For example, consider the sociodemographic characteristics of race, age, gender, and socioeconomic status. At the first contact with the interviewer, the householder is making judgments about the purposes of the visit. Is this a sales call? Is there any risk of physical danger in this encounter? Can I trust that this person is sincere? Assessments of alternative intentions of the caller are made by matching the pattern of visual and audio cues with evoked alternatives. All attributes of the interviewer that help the householder discriminate the different scripts will be used to make the decision about the intent of the call. Once the householder chooses an interpretation of the intent of the call—a “cognitive script” in Abelson’s (1981)
terms—then the householder can use the script to guide his or her reactions to the interviewer.
The second set of influences from the interviewer is a function of the householders’ experience. To select an approach to use, the interviewer must judge the fit of the respondent to other respondent types experienced in the past (either through descriptions in training or actual interaction with them). We believe that experienced interviewers tend to achieve higher levels of cooperation because they carry with them a larger number of combinations of behaviors proven to be effective for one or more types of householders. A corollary of this is that interviewers experiencing diverse subpopulations are even more resourceful and are valuable for refusal conversion work. We can also deduce that the initial months and years of interviewing offer the largest gains to interviewers by providing them with new persuasion tools.
The third set of attributes might be viewed as causally derivative of the first two, interviewer expectations regarding the likelihood of gaining cooperation of the householder. Research shows that interviewers who believe survey questions are sensitive tend to achieve higher missing-data rates on them (Singer and Kohnke-Aguirre, 1979). Interviewers report that their emotional state at the time of contact is crucial to their success: “I do not have much trouble talking people into cooperating. I love this work and I believe this helps ‘sell’ the survey. When I knock on a door, I feel I’m gonna get that interview!” We believe these expectations are a function of interviewer sociodemographic attributes (and their match to those of the householder), their personal reactions to the survey topic, and their experience as an interviewer.
Respondent-Interviewer Interaction
When interviewers encounter householders, the factors discussed come to bear on the decision to participate. The strategies the interviewer employs to persuade the sample person are determined not only by the interviewer’s own ability, expectations, and other variables, but also by features of the survey design and by characteristics of the immediate environment and broader society. Similarly, the responses that the sample person makes to the request are affected by a variety of factors, both internal and external to the respondent, and both intrinsic and extrinsic to the survey request.
We have posited that most decisions to participate in a survey are heuristically based. The evidence for this lies in the tendency for refusals to come quickly in the interaction; for interviewers to use short, generally nonoffensive descriptors in initial phases of the contact; and for respondents to only rarely seek more information about the survey. This occurs most clearly when participation (or lack thereof) has little personal consequence. With Brehm (1993) we believe that the verbal “reasons” for refusals—“I’m too busy,” “I’m not interested”—partially reflect these heuristics, mirroring current states of the householder but,
in contrast to Brehm, we believe they are not stable under alternative cues presented to the householder. We believe there are two constructs regarding interviewer behavior during the interaction with a householder that underlie which heuristics will dominate in the householder’s decision to participate. These are labeled “tailoring” and “maintaining interaction.”
Tailoring. Experienced interviewers often report that they adapt their approach to the sample unit. Interviewers engage in a continuous search for cues about the attributes of the sample household or the person who answers the door, focusing on those attributes that may be related to one of the basic psychological principles reviewed previously. For example, in poor areas, some interviewers choose to drive the family’s older car and to dress in a manner more consistent with the neighborhood, thereby attempting to engage the liking principle. In rich neighborhoods, interviewers may dress up. In both cases, the same compliance principle—similarity leads to liking—is engaged, but in different ways.
In some sense, expert interviewers have access to a large repertoire of cues, phrases, or descriptors corresponding to the survey request. Which statement they use to begin the conversation is the result of observations about the housing unit, the neighborhood, and immediate reactions upon first contact with the person who answers the door. The reaction of the householder to the first statement dictates the choice of the second statement to use. With this perspective, all features of the communication are relevant—not only the words used by the interviewer, but the inflection, volume, pacing (see Oksenberg et al., 1986), as well as physical movements of the interviewer.
From focus groups with interviewers, we found that some interviewers are aware of their “tailoring” behavior: “I give the introduction and listen to what they say. I then respond to them on an individual basis, according to their response. Almost all responses are a little different, and you need an ability to intuitively understand what they are saying.” Or “I use different techniques depending on the age of the respondent, my initial impression of him or her, the neighborhood, etc.” Or “From all past interviewing experience, I have found that sizing up a respondent immediately and being able to adjust just as quickly to the situation never fails to get their cooperation, in short being able to put yourself at their level be it intellectual or street wise is a must in this business…”.
Tailoring need not occur only within a single contact. Many times contacts are very brief and give the interviewer little opportunity to respond to cues obtained from the potential respondent. Tailoring may take place over a number of contacts with that household, with the interviewer using the knowledge he or she has gained in each successive visit to that household. Tailoring also may occur across sample households. The more an interviewer learns about what is effective and what is not with various types of potential respondents encountered, the more effectively requests for participation can be directed at similar others. This implies that interviewer tailoring evolves with experience. Not only have
experienced interviewers acquired a wider repertoire of persuasion techniques, but they are also better able to select the most appropriate approach for each situation.
Maintaining interaction. The introductory contact of the interviewer and householder is a small conversation. It begins with the self-identification of the interviewer, contains some descriptive matter about the survey request, and ends with the initiation of the questioning, a delay decision, or the denial of permission to continue. There are two radically different optimization targets in developing an introductory strategy—maximizing the number of acceptances per time unit (assuming an ongoing supply of contacts), and maximizing the probability of each sample unit accepting.
The first goal is common to some quota sample interviewing (and to sales approaches). There, the supply of sample cases is far beyond that needed for the desired number of interviews. The interviewer behavior should be focused on gaining speedy resolution of each case. An acceptance of the survey request is preferred to a denial, but a lengthy, multicontact preliminary to an acceptance can be as damaging to productivity as a denial. The system is driven by number of interviews per time unit.
The second goal, maximizing the probability of obtaining an interview from each sample unit, is the implicit aim of probability sample interviewing. The amount of time required to obtain cooperation on each case is of secondary concern. Given this, interviewers are free to apply the “tailoring” over several turns in the contact conversation. How to tailor the appeal to the householder is increasingly revealed as the conversation continues. Hence, the odds of success are increased as the conversation continues. Thus, the interviewer does not maximize the likelihood of obtaining a “yes” answer in any given contact, but minimizes the likelihood of a “no” answer over repeated turntaking in the contact.
We believe the techniques of tailoring and maintaining interaction are used in combination. Maintaining interaction is the means to achieve maximum benefits from tailoring, for the longer the conversation is in progress, the more cues the interviewer will be able to obtain from the householder. However, maintaining interaction is also a compliance-promoting technique in itself, invoking the commitment principle as well as more general norms of social interaction. That is, as the length of the interaction grows, it becomes more difficult for one actor to summarily dismiss the other.
Figure 1–9 is an illustration of these two interviewer strategies at work. We distinguish between the use of a general compliance-gaining strategy (e.g., utilizing the principle of authority) and a number of different (verbal and nonverbal) arguments or tactics within each strategy (e.g., displaying the ID badge prominently, emphasizing the sponsor of the survey). The successful application of tailoring depends on the ability of the interview to evaluate the reaction of the householder to his or her presence, and the effectiveness of the arguments pre-
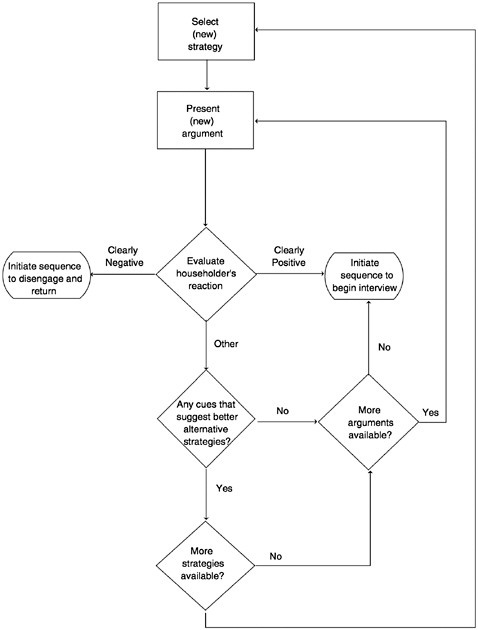
sented. Note that the interviewer’s initial goal is to maintain interaction (avoiding pushing for the interview) as long as the potential respondent’s reaction remains neutral or noncommittal. An interviewer will continue to present different arguments until the householder is clearly receptive to an interview request, or there are no more arguments to present. For inexperienced interviewers the latter may occur before the former, forcing the interviewer to (prematurely in some cases) initiate the interview request.
There is some support from training procedures that the “maintaining interaction” model operates as theorized. First, interviewers typically are warned against unintentionally leading the householder into a quick refusal. If the person appears rushed or preoccupied by some activity in the household (e.g., fighting among children), the interviewer should seek another time to contact the unit. A common complaint concerning inexperienced interviewers is that they create many “soft refusals” (i.e., cases easily converted by an experienced interviewer) by pressing the householder into a decision prematurely. Unfortunately, only rarely do interviewer recruits receive training in the multiturn repartee inherent in maximizing the odds of a “yes” over all contacts. Instead, they are trained in stock descriptors of the survey leading to the first question of the interview.
We note how similar the goals of a quota sample interviewer are to those of any salesperson, but how different are those of the probability sample interviewer. Given this, it is not surprising that many attempts to use sales techniques in probability sample surveys have not led to large gains in cooperation. The focus of the salesperson is on identifying and serving buyers. The “browser” must be ignored when a known buyer approaches. In contrast, the probability sample interviewer must seek cooperation from both the interested and uninterested.
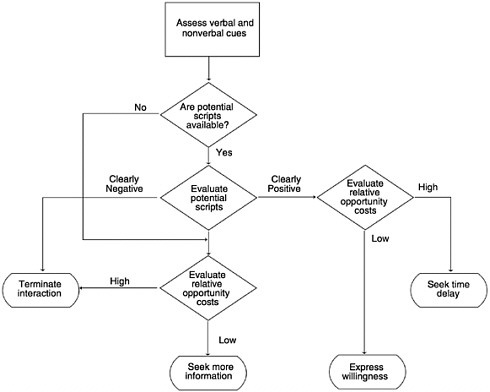
At the same time that the interviewer is exercising skills regarding tailoring and maintaining interaction, the householder is engaged in a very active process of determining whether there has been prior contact with the interviewer, what is the intent of the interviewer’s call, whether a quick negative decision is warranted, or whether continued attention to the interviewer’s speech is the right decision. Figure 1–10 describes this process.
The process has various decision points at which the householder can make positive or negative decisions regarding participation in the survey. These arise because the householder misinterprets the visit as involving some unpleasant nonsurvey request; that is, the householder chooses the wrong script. They arise if there are very high opportunity costs for the householder to continue the interaction with the interviewer. They arise if any of the heuristics point to the wisdom of a negative or positive decision.
DESIGNING SURVEYS ACKNOWLEDGING NONRESPONSE
The previous discussions review various theoretical perspectives on nonresponse. These theoretical perspectives have two implications for survey design:
(1) contact and interviewer protocols should be chosen to be consistent with the diverse influences, and (2) no single survey design will achieve 100-percent response rates and defenses to nonresponse error should be built into the chosen survey design.
The Value of Rich Sampling Frames
The list of the target population (or the materials used to construct a list) is a tool to assure that a probability sample will offer a useful description of the full population. When the designer acknowledges that nonresponse inevitably will occur in the survey, the frame takes on new value. When the designer has a choice of frames (e.g., a list frame from a social welfare agency containing data about the person’s prior income and employment experience, an area frame, a random digit dial frame), evaluation of the frame must include both coverage and nonresponse issues. Coverage, the extent to which the frame includes all target population elements and nothing else, is an important attribute.
Sampling frames that contain information beyond simple identifiers can help reduce nonresponse error. If the frames include data on prior addresses, then those with a history of moves might be identified as likely movers, with higher than expected locating effort. If frames contain data on use of agency services in the past, the data might be used to customize approaches to sample persons in an effort to address potential interests and concerns about survey participation (e.g., having interviewers explain the importance of the survey to measuring the wellbeing of former food stamp recipients). Sometimes data exists that are correlates of key survey variables (e.g., participation in types of programs [higher correlated with current statuses like work training programs]). Such data might be useful in assessing nonresponse errors and building weighting adjustment or imputation models.
Collecting Additional Information to Enhance Data Collection
Sometimes interviewers can observe that sample persons have certain attributes that are related to certain concerns about survey participation. Followup efforts to persuade the sample person to be interviewed can use this information creatively to improve response rates. This has included treating sample numbers generating answering machine responses as candidates for calling at different times of the day, attempting to avoid times when the machine is activated. It includes interviewer observation about any concerns regarding the legitimacy of the survey request, followed by special mailings or communications demonstrating the sponsorship and purpose of the survey. It includes, in face-to-face surveys, observations of housing units for entrance impediments (e.g., locked apartment buildings, locked gates, security guards), leading to more intensive calling patterns on those sample units versus others.
Collecting Information Valuable in Postsurvey Adjustment
Several studies (Purdon et al, 1999; Groves and Couper, 1998; Brehm, 1993) now demonstrate that the utterances of sample persons during their interactions with interviewers contain some information regarding motivations for their reaction to the survey request and the likelihood of eventual cooperation with the survey request. The evidence comes more from face-to-face surveys than from telephone surveys, although Couper and Groves (1995) find some support for links between the utterances and the final outcome in telephone surveys as well. These become useful predictors in response-propensity models sometimes used in postsurvey adjustment.
Another set of variables involves fixed attributes of the housing unit, best observed in face-to-face surveys. For example, the Consumer Expenditure Survey uses observations from the interviewer about whether the unit is owned or rented in postsurvey adjustments based on the belief that the consumption patterns are relatively homogeneous in the two groups. Similarly, observations of multiple-person households (through records on who answered the telephone) the presence of children, etc. are possible in some designs. These too can be useful in forming postsurvey adjustment weighting classes.
Two-Phase Sampling to Acquire Information About Nonrespondents
When survey data are used in legal or policy settings, the credibility of results is sometimes enhanced by mounting separate studies concerning nonresponse. There are two possible foci: experimental comparisons of different protocols and two-phase sample surveys of nonrespondents. An example of the first study is a mixed-mode design based on a list frame sample of prior recipients, one mode using telephone matching and telephone survey requests; and the other uses address locating and face-to-face interviews. For cost reasons the face-to-face mode might use a smaller sample size than the telephone mode. The telephone mode is likely to have lower response rates than the face-to-face mode. The sample sizes might be fixed to determine the magnitude of mode differences at some prior specified standard error. The total cost of the survey per unit measured lies between the telephone and face-to-face modes, but the additional information purchased with the mixed-mode design is protection against large-mode effects on key survey conclusions.
A two-phase sample design for nonresponse studies begins after the main survey has completed its work. The intent under perfect conditions is that a probability subsample of nonrespondents to the first phase of the survey can yield evidence regarding the likelihood of large nonresponse errors in the first-phase estimates. The “perfect” conditions yield 100 percent response rates on the second-phase cases, thus providing unbiased estimates of the characteristics of the nonrespondent pool. Although such designs have a long history (Deming, 1953;
Hansen and Hurwitz, 1958), they never inevitably achieve the perfect conditions in practice. They are used, however, when some information on the nonrespondents is judged to be of crucial importance. For example, a second-phase sample of nonrespondents was taken on the National Survey of American Families, using a radically reduced telephone interview, relaxed respondent rules, and an incentive offer. Among the nonrespondent cases to the first-phase effort (spanning many months and repeated refusal conversion efforts), 36 percent of screener nonrespondents and 58 percent of full interview nonrespondents complied with the second-phase request (Groves et al., 1999). Those responding were found not to have large socioeconomic status differences from the respondent group (what differences did exist suggested higher income households were more likely to be nonrespondents).
JUDGMENTS REGARDING DESIRABLE DESIGN FEATURES FOR SURVEYS OF THE U.S. LOW-INCOME POPULATION
As survey methodology matures, it is increasingly finding that the process of survey participation is subject to diverse causes across different subgroups. In short, what “works” for some groups does not for others. Furthermore, in free societies 100 percent compliance is not to be expected; survey designers should incorporate nonresponse concerns into every aspect of their designs.
What follows is a listing of the top 10 lessons from the survey methodology literature regarding nonresponse in studies of the low-income population. These are current judgments of the authors of this paper based on experience and study of the field.
1. No record system is totally accurate or complete.
Using a record system as a sampling frame generally asks more of the record than it was designed to provide. Surveys demand accurate, up-to-date, personal identifiers. They demand that the person sampled can be located.
2. Choose sample sizes that permit adequate locating, contacting, and recruitment efforts.
Sample surveys suffer from the tyranny of the measurable, with sampling errors dominating design decisions because they can be measured more easily than nonresponse errors. It is tempting to assume the absence of nonresponse error and to maximize sample size to achieve low reported sampling errors. It is important to note that the larger the sample size, the greater the proportion of total error likely to come from nonresponse bias, other things being equal. (Sampling errors can be driven down to a trivial amount, but nonresponse biases may remain the same.)
3. Assume nonresponse will occur; prepare for it.
In practice no sample survey avoids nonresponse completely. Assuming at the design stage that it will not occur leaves the researcher unprepared to deal with it at the estimation stage. Whenever possible use interviewers to collect information that can be used either to reduce nonresponse (e.g., utterances of the sample person suggesting reasons for nonresponse, useful later in tailoring refusal conversion protocol) or to adjust for nonresponse (e.g., observations about respondents and nonrespondents related to propensities to respond).
4. Consider relationships with the sponsoring agency as sources of nonresponse error.
Sample persons with prior experiences or relationships with the sponsoring agency for the survey make decisions based partially on how they evaluate those relationships. This may underlie the tendency for those persons dependent on programs to respond at higher levels. It also underlies the findings of those with relatively low trust in government to respond at lower rates to some government surveys. Mixed-mode designs and alternative sponsoring organizations may act to reduce these sources of differential nonresponse.
5. Do not script interviewers; use flexible interviewer behaviors.
The research literature is increasingly strong on the conclusion that effective interviewers need to be trained to deliver information relevant to a wide variety of concerns that different sample persons may have. Stock phrases and fixed approaches defeat the need to address these diverse concerns. Once interviewers can classify the sample person’s utterances into a class of concerns, identify a relevant piece of information to convey to the person, and deliver it in the native language of the sample person, cooperation rates can be higher.
6. Consider incentives, especially for the reluctant.
Incentives have been shown to have disproportionately large effects on those who have no other positive influence to respond. Although not completely clear from the literature, the value of a given incentive may be dependent on relative income/assets of the sample person. If greater effects pertain to low-income populations, then incentives might be more attractive to studies of that population.
7. Give separate attention to location, noncontact, refusal; each has different causes and impacts on error.
Sample persons not interviewed because of failure to locate are disproportionately movers. All the correlates of residential mobility (rental status, small households, relative youth, few extended family ties), if relevant to the survey measures, make nonlocation nonresponse a source of error. Noncontacts and refusals may have very different patterns of correlates. Treating nonresponse rates as an undifferentiated source of nonresponse error is thus naive. Separate tracking of these nonresponse rates is needed.
8. Mount special studies of nonrespondents.
The higher the nonresponse rate, the higher the risk of nonresponse error, other things being equal. With higher than desired nonresponse rates, the investigators have an obligation to assure themselves that major nonresponse errors are not present, damaging their ability to draw conclusions from the respondent-based statistics. Special studies of nonrespondents are appropriate in these cases, using auxiliary data from records, followback attempts at samples of respondents, and other strategies.
9. Perform sensitivity analyses on alternative postsurvey adjustments.
Postsurvey adjustments (weighting and imputation) entail explicit or implicit assumptions about the relationships between propensity to respond to the survey and survey variables. Insight is sometimes gained into the dependence on nonresponse adjustments of substantive conclusions by varying the assumptions, using different postsurvey adjustments, and comparing their impact on conclusions.
10. Involve the target population.
Using focus groups and other intensive qualitative investigations can offer insights into how the target population might receive the survey request. Such insights are rarely native to research investigators who are members of different subcultures.
REFERENCES
Abelson, R.P. 1981 Psychological status of the script concept. American Psychologist 36(7):715–729.
Berk, M.L., N.A.Mathiowetz, E.P.Ward, and A.A.White 1987 The effect of prepaid and promised incentives: Results of a controlled experiment. Journal of Official Statistics 3(4):449–457.
Brehm, J. 1993 The Phantom Respondents: Opinion Surveys and Political Representation. Ann Arbor: University of Michigan Press.
Cialdini, R.B. 1984 Influence: The New Psychology of Modern Persuasion. New York: Quill.
1988 Influence: Science and Practice. Glenview, IL: Scott, Foresman and Company.
Cochran, W.G. 1977 Sampling Techniques. Third Edition, New York: Wiley and Sons.
Couper, M.P. 1997 Survey introductions and data quality. Public Opinion Quarterly 61(2):317–338.
Couper, M.P., and R.M.Groves 1995 Introductions in Telephone Surveys and Nonresponse. Unpublished paper presented at the Workshop on Interaction in the Standardized Survey Interview, Amsterdam.
De Heer, W.F., and A.Z.Israëls 1992 Response Trends in Europe. Unpublished paper presented at the Joint Statistical Meetings of the American Statistical Association, Boston.
Deming, W.E. 1953 On a probability mechanism to attain an economic balance between the resultant error of response and the bias of nonresponse. Journal of the American Statistical Association 48(264):743–772.
Eagly, A.H., and S.Chaiken 1984 Cognitive theories of persuasion. Pp. 267–359 in Advances in Experimental Social Psychology Volume 17, L.Berkowitz, ed. San Diego: Academic Press.
Ekholm, A., and S.Laaksonen 1991 Weighting via response modeling in the Finnish household budget survey. Journal of Official Statistics 7(3):325–337.
Ford, Barry 1983 An overview of hot-deck procedures. Pp. 185–209 in Incomplete Data in Sample Surveys, W.Madow, I.Olkin, and D.Rubin, eds. New York: Academic Press.
Freedman, J.L., and S.C.Fraser 1966 Compliance without pressure: The foot-in-the-door technique. Journal of Personality and Social Psychology 4:195–202.
Groves, R.M., R.B.Cialdini, and M.P.Couper 1992 Understanding the decision to participate in a survey. Public Opinion Quarterly 56(4):475– 495.
Groves, R.M., and M.P.Couper 1998 Nonresponse in Household Interview Surveys. New York: Wiley and Sons.
Groves, R.M., and R.L.Kahn. 1979 Surveys by Telephone: A National Comparison with Personal Interviews. New York: Academic Press.
Groves, R.M., D.Wissoker, and E.Singer 1999 Early Nonresponse Studies of the 1997 National Survey of America’s Families. Washington, DC: Urban Institute.
Hansen, M.H., and V.M.Hurwitz 1958 The problem of nonresponse in sample surveys. Journal of the American Statistical Association (December) 517–529.
Hill, D.H. 1978 Home production and the residential electric load curve. Resources and Energy 1:339– 358.
House, J.S., and S.Wolf 1978 Effects of urban residence on interpersonal trust and helping behavior. Journal of Personality and Social Psychology 36(9), 1029–1043.
Keeter, S., C.Miller, A.Kohut, R.Groves, and S.Presser 2000 Consequences of reducing nonresponse in a national telephone survey. Public Opinion Quarterly, 64, 125–148.
Little, R., and D.B.Rubin 1987 Statistical Analysis with Missing Data. New York: Wiley and Sons.
Oksenberg, L., L.Coleman, and C.F.Cannell 1986 Interviewers’ voices and refusal rates in telephone surveys. Public Opinion Quarterly 50(1):97–111.
Petty, R.E., and J.T.Caccioppo 1986 Communication and Persuasion: Central and Peripheral Routes to Attitude Change. New York: Springer-Verlag.
Purdon, S., P.Campanelli, and P.Sturgis 1999 Interviewers’ calling strategies on face-to-face interview surveys. Journal of Official Statistics 15(2):199–216.
Rubin, D.B. 1987 Multiple Imputation for Nonresponse in Surveys. New York: Wiley and Sons.
Singer, E., and L.Kohnke-Aguirre 1979 Interviewer expectation effects: A replication and extension. Public Opinion Quarterly 43(2):245–260.
Singer, E., N.Gebler, T.Raghunathan, J.Van Hoewyk, and K.McGonagle 1996 The Effects of Incentives on Response Rates in Personal, Telephone, and Mixed-Mode Surveys: Results from a Meta Analysis. Unpublished paper presented at the Annual Conference of the American Association of Public Opinion Research, Salt Lake City.
Tuckel, P., and B.M.Feinberg 1991 The answering machine poses many questions for telephone survey researchers. Public Opinion Quarterly 55(2):200–217.
Tuckel, P., and H.O’Neil 1995 A profile of answering machine owners and screeners. Pp. 1157–1162. In Proceedings of the Section on Survey Research Methods. Alexandria, VA: American Statistical Association.


