
5
Adjusting for Missing Data in Low-Income Surveys
Leyla Mohadjer and G.Hussain Choudhry
Partly as a consequence of the recent significant changes in welfare programs and policies, many states are conducting or sponsoring surveys to investigate the effect of changes in welfare policy on the well-being of people living at or below the poverty level. Under ideal circumstances, every low-income person (or family) in the state would have a chance of selection for such a survey, would be located and agree to participate in the survey, and would provide correct answers to all questions asked. In practice, these circumstances are not realized in any population survey. This paper focuses on the problems of missing data in surveys arising from a failure to give all members of the target population a chance of selection for the survey and a failure to obtain the survey data from some of those sampled. The following sections indicate how missing data can lead to biased survey estimates and describe some widely used methods to reduce this effect.
Missing data in surveys can be divided usefully into three classes:
-
Noncoverage. Noncoverage occurs when persons (or families) in the target population of interest are not included in the sampling frame from which the sample is selected. In the case of a survey of a state’s low-income population, noncoverage could, for instance, occur if the list from which the sample was drawn was out of date, and hence failed to include those most recently enrolled.
The authors are grateful to Graham Kalton, Joseph Waksberg, Robert Moffitt, and the referees for their valuable comments and suggestions that led to improvements in this paper.
-
Unit nonresponse. Unit nonresponse occurs when a sampled unit (person or family) fails to participate in the survey. Unit nonresponse can occur, for example, because the sampled person cannot be located, refuses to participate, is too ill to participate, cannot participate because of language or hearing problems, or is away from the area for the period of the survey fieldwork.
-
Item nonresponse. Item nonresponse occurs when a sampled unit participates in the survey but fails to provide responses to one or more of the survey questions. This failure may occur because the respondent refuses to answer a question on the grounds that it is too sensitive or personal, or because he or she does not know the answer to the question. Item nonresponse also occurs when an interviewer fails to ask a question or record the answer and when recorded responses are deleted in editing a questionnaire because the response is inconsistent with the answers recorded for other questions.
There is a potential for bias whenever sampled persons who did not participate in the survey have different characteristics than those who did. For some important characteristics, the respondents may be substantially different from those with missing data. In fact, if such differences exist and no attempt is made to adjust for them in the analyses, estimates or inferences for the target population may be misleading. The potential for bias is particularly great when nonresponse rates are high. Thus, for example, if those recently enrolled are not included on the sampling frame for enrollees in a state’s welfare program, the survey clearly will produce biased estimates of the distribution of length of time on the program, and any other associated estimates. Similarly, in a survey of welfare leavers, it may be that those who participate in the survey have had appreciably different experiences than those who do not, and thus, estimates based on the respondents will be biased. Suppose that families with positive outcomes (those who successfully made the transition from welfare) are easier to locate and more willing to respond than families with negative outcomes. In fact, policy makers are concerned that this situation does exist and that nonresponding and nonlocatable families and those whose current status is no longer reflected in administrative data are worse off and at greater risk than families for whom data are available (U.S. General Accounting Office, 1999). This situation can result in estimates with large nonresponse bias.
The standard method of attempting to reduce the potentially biasing effect of noncoverage and of unit nonresponse is a “weighting adjustment.” Weighting adjustments for these two sources of missing data are described in this paper. Because some state surveys have experienced high nonresponse rates, nonresponse weighting adjustments are likely to be particularly important. The intent of this paper is to describe how they may be applied.
All methods for handling missing data aim to reduce their potential biasing effects, but these methods cannot be expected to eliminate the effects of missing data. The best protection against potential nonresponse bias is to plan and imple-
ment field procedures that maintain a high level of cooperation. A wide variety of tools and strategies are available to improve survey response rates. Some examples include an advance letter to sampled cases, effective callback or followup strategies, reductions in the length of the questionnaire or the interview, improved interviewer training, and payment of incentives. The literature includes an extensive discussion on methods for obtaining high response rates in surveys. Cantor and Cunningham (this volume), Weiss and Bailar (this volume), and Singer and Kulka (this volume) describe such methods for low-income surveys. However, even with the best strategies, some nonresponse occurs.
The standard method of attempting to reduce the potentially biasing effect of noncoverage and of unit nonresponse is a “weighting adjustment.” Weighting adjustments for these two sources of missing data are described in this paper. Because some state surveys have experienced high nonresponse rates, nonresponse weighting adjustments are likely to be particularly important.1 The intent of this paper is to describe how they may be applied.
The usual method for handling item nonresponse is some form of imputation, that is, assigning a value for the missing response based on the responses given to other questions in the survey and usually conducted within classes of sample persons with similar characteristics. If done well, imputation usually can reduce bias in survey estimates. It is nearly always preferable to impute missing items rather than treating them as randomly missing data at the analysis stage because confining analyses to nonmissing responses to questionnaire items may lead to biased estimates. But bias reduction depends on the suitability of the assumptions made in the imputation. When imputations are performed separately on different variables, the bias may be reduced for univariate statistics, but multivariate relationships among variables could become distorted. Also, researchers may treat the resulting data set as if it were complete, thus affecting the variances of the estimates. An extensive body of literature currently exists for compensating for item nonresponse in surveys. Readers are referred to Kalton and Kasprzyk (1986) and Brick and Kalton (1996).
This paper focuses on the standard weighting adjustment methods used to compensate for noncoverage and unit nonresponse in survey research. These methods are general-purpose strategies that automatically adjust all analyses of the survey data, at a low cost. Other available procedures are more complex and may produce somewhat better results when analysts have a specific model they plan to estimate. Because these procedures have only limited applicability in multipurpose surveys, they have not been included here. Refer to Little and Rubin (1987) for information about these methods.
Studies of low-income populations involve various methods of data gathering. We begin with a brief description of two alternative types of low-income studies. We then provide a brief discussion of noncoverage and unit nonresponse in low-income surveys. Sample weighting is then described, followed by a review of the most common general-purpose nonresponse adjustment procedures. Finally, we include a brief summary of the paper. The procedures are illustrated using examples that we carry throughout the paper.
LOW-INCOME POPULATION STUDIES
We begin this discussion about nonresponse adjustments with a review of two different types of studies often conducted by state welfare agencies. Studies of the low-income population (such as studies of the current welfare population or studies of those who have left welfare rolls) mainly rely on two types of data collection: one collects data directly from administrative records and the other collects data directly from a sample of eligible persons. Some studies use a combination of administrative data and data from survey respondents.
States’ welfare systems generally collect administrative data on the demographic characteristics of welfare recipients, the number of adults and children in the welfare case, and the receipt and value of welfare benefits. Many research studies use administrative records, and researchers frequently match the records to data from sources such as the Food Stamp Program and Medicaid. The state Unemployment Insurance files also are used to collect information about employment and earnings for families who have left welfare. Some studies rely on information available in administrative records, and thus do not require any contact with the subjects of the study.
Some states collect data through surveys. These are most often telephone interviews, although some states also conduct in-person interviews to ensure that families without telephones are included. Surveys usually collect information from respondents that is not available in administrative data.
Both types of studies of low-income populations usually suffer from some form of missing data. For example, in studies that include only administrative data collection, persons or families for whom no information is included in the administrative list (used as the sampling frame) have no chance of being included in the sample, and thus will not be represented in the results of the study. In addition, a number of sampled persons, or families, may not have the required data because they were not matched correctly or had no record in other administrative files used to collect outcome data (e.g., earnings data from Unemployment Insurance records). Similarly, surveys that collect data from sampled persons also are subject to underrepresentation due to sampling from incomplete or outdated lists, as well as missing information due to nonresponse. Later, we describe, in more detail, the sources of missing data in the two types of low-income studies.
As mentioned earlier, this paper describes the common procedures used to adjust for nonresponse and noncoverage. These procedures rely on the auxiliary data available for both respondents and nonrespondents. In general, the greater the amount of auxiliary data that can be used for adjustment, the better the adjustment is likely to be. To evaluate the availability and the amount of such data for low-income surveys, we contacted a number of states to inquire about the content and the quality of their administrative data. The main focus of this inquiry was the availability and quality of demographic, socioeconomic, and geographic variables. The results of this survey are provided in a later section. In general, we found that many states have high-quality data for demographic variables such as age, gender, race/ethnicity, and number of children. Welfare income and length of time on welfare seemed to be among the socioeconomic variables of high quality, and county name and zip code were the geographic variables with good-quality data for the states that responded to our survey. In a later section, we show how this information (or any other data source available to states) can be used to adjust for nonresponse in state surveys.
NONCOVERAGE AND NONRESPONSE IN SURVEYS
A fundamental objective in the design of any state survey is to adequately represent the targeted population; for the state surveys under consideration here, this usually consists of low-income persons. However, the target population is not completely represented by the sample when either some persons or families are not included in the sampling frame (e.g., the administrative records if used for sampling) or information cannot be obtained for some eligible sampled persons. The term “noncoverage” refers to situations where some units in the target population have no chance of selection into the sample. The following subsection provides more detail on reasons for survey noncoverage. The term “nonresponse” in surveys refers to failure to obtain data for those eligible units that were selected into the sample. The subsection after that provides a summary of various sources of nonresponse in sample surveys.
Survey Noncoverage
Most population surveys are subject to some noncoverage. Surveys of low-income populations are no exception. One source of noncoverage is the use of incomplete or outdated administrative files as sampling frames, resulting in the omission of a part of the population of interest. Similarly, noncoverage occurs when telephone interviewing is the only vehicle for data collection, because those without telephones have no chance of being selected and thus will not be covered in the survey.
In many survey applications, the omitted part of the population differs in many ways from the part that is included in the sampling frame. For example, if
the objective of the study is to obtain information about the postreform status of all low-income families, families eligible for Temporary Assistance for Needy Families (TANF) who did not become welfare recipients will not be included in the welfare records. These families are not covered in the administrative file used for sampling, and thus they will not be covered in the sample.
The following example2 illustrates the potential effect of the choice of sampling frame on survey noncoverage. Assume that a survey is designed to evaluate, in two states, the impact of the loss of Supplemental Security Income (SSI) benefits by individuals whose low-income status was caused by substance abuse. SSI benefit termination for this population was mandated by federal legislation (Public Law 104–121) in 1996. After SSI benefits were terminated, some of the past SSI recipients applied to Referral and Monitoring Agencies (RMA), funded by the Center for Substance Abuse Treatment (CSAT). Refer to Tonkin et al. (in press) for more details on the methodology for the CSAT study.
One of the first steps in designing a survey is to define the study population of interest. Assume that the target population consists of all individuals between the ages of 21 and 59 who were receiving SSI as a result of substance abuse and who had an active case on or before July 1, 1996. Although the population of interest is all individuals receiving benefits because of substance abuse, assume that the two states (State A and State B) used different frames for sample selection; State A used the RMA client rosters, which covered only 66 percent of the target population, and State B used the Social Security Administration client roster, which was a complete frame.
In the State A sample, individuals not included in the RMA lists of active cases (i.e., 34 percent of individuals) had no chance of being selected into the sample. This is a potential source of bias if the characteristics of interest (e.g., drug abuse) are different for individuals not covered by the RMA frame compared to those on the RMA frame. The potential for noncoverage bias increases as the frame coverage rate decreases.
Survey Nonresponse
Unit nonresponse in surveys occurs for various reasons, including the failure to locate sampled persons and the refusal of sampled persons to be interviewed. In some cases, collected data may be lost during data transmission stages. In welfare studies that collect outcome data from administrative files, nonresponse can occur because of inability to match the sampled case to the administrative file that includes the outcome data. Statistics derived from survey data may be biased if the missed persons are different, with respect to the variable of interest to the survey, from those who participated in the survey.
In the SSI benefit example, assume that the response rate was 67 percent for the State A sample and 92 percent for the State B sample. The lower response rate for State A is another source of potential bias. If those who did not participate differ in important ways from those who did, the bias due to nonresponse could be substantial.
The marginal population distributions of demographic variables—age, gender, and race—usually are available, and these can be used to examine the potential for noncoverage and nonresponse biases, as shown in the following text. Tables 5–1 and 5–2 provide the marginal distributions of the demographic vari-
TABLE 5–1 Hypothetical Population and Sample Distribution for State A
TABLE 5–2 Hypothetical Population and Sample Distribution for State B
ables age, gender, and race for the assumed target population (SSI only); the enrollment sample; (State A and State B selected samples), and the respondents for the two states.3
We observe that for State A, in spite of 34-percent noncoverage, the sample distribution is not distorted for the variable gender. However, blacks are underrepresented and the race category “others” is overrepresented in the State A sample. For State B, where a complete frame was available for sampling, the sample distributions are similar to the SSI population distributions for all three variables.
The State A sample had a moderately low response rate, resulting in a distortion in the distributions for respondents by gender and age. This obviously would bias the results if the outcome characteristics of males and females are different, or if the age distribution affects the outcome. The response rate for State B was high, and the sample distributions and the respondent distributions of all three demographic variables are very similar to the population distributions. This suggests a lower potential for substantial nonresponse and noncoverage bias.
The hypothetical samples for States A and B are examples of the impact of noncoverage and nonresponse in survey outcome. In the following subsection, we provide a general formula that attempts to quantify the bias associated with noncoverage and nonresponse.
Nonresponse Bias
The size of the nonresponse bias depends on the amount of nonresponse and the difference between the respondent and nonrespondent mean values of the study variables. For example, in an equal probability sample (a description of an unequal probability sample is provided in the section on base weights) of size n selected from a population of N families, let n1 stand for the number of respondents and let n2 stand for the nonrespondents where n2(=n-n1). Let y be the study variable (e.g., family income) with ![]() 1 as the respondent mean and
1 as the respondent mean and ![]() 2 as the mean for nonrespondents (where
2 as the mean for nonrespondents (where ![]() 2 is unknown). The sample mean
2 is unknown). The sample mean ![]() for the total sample can be expressed as (see, for example, Groves, 1989)
for the total sample can be expressed as (see, for example, Groves, 1989)
[1]
Because ![]() 2 is unknown, analysts use
2 is unknown, analysts use ![]() 1 to estimate
1 to estimate ![]() for the target population. When no nonresponse adjustments are made, the bias can be estimated as
for the target population. When no nonresponse adjustments are made, the bias can be estimated as
[2]
Therefore, the extent of bias is a function of both the nonresponse rate (n2/n) and the difference between the respondent and nonrespondent means (![]() 1–
1–![]() 2).
2).
For example, assume that a survey of 820 low-income families has been carried out and that the variable of interest is the average monthly family income. Table 5–3 provides examples of the amount of bias in the estimate of variable of interest (i.e., average monthly family income) for various levels of nonresponse and average incomes for respondents and nonrespondents.
The level of bias in Table 5–3 is a function of both the variable response rates and the difference in the mean income for respondents and nonrespondents.
Some part of differences in average income between respondents and nonrespondents is usually due to differences in their demographic composition (e.g., race, age, as in the States A and B examples) and the fact that income tends to vary among these demographic groups. The bias resulting from this distortion of the respondent sample can be reduced considerably by devising adjustment factors and applying them to the responding units data. Adjustment factors typically vary among demographic groups, and their purpose is to establish a data set whose sample representation has been adjusted to compensate for the missing nonrespondent data. (We used the term “demographic groups” because race, age,
TABLE 5–3 Level of Bias by Nonresponse Rate and Differences in Average Income of Respondents and Nonrespondents
gender, and other factors, are most frequently known for the population of interest. However, sometimes additional information such as income in a recent time period or employment status also is available for both respondents and nonrespondents. Adjustment factors can, of course, be developed for these variables as well as the demographic variables.) The underlying assumption for these adjustments is that respondents are similar to nonrespondents within the adjustment subgroups (or classes); that is, the data are missing at random (MAR)4 and nonresponse is ignorable within the nonresponse adjustment group (Little and Rubin, 1987). Because respondents are not fully representative of nonrespondents (the MAR assumption does not hold perfectly), some unknown bias remains, even after conducting weighting adjustments.
The adjustments for nonresponse described in this report are designed to eliminate the part of the bias arising from the distortion in the respondent sample, but they have little effect on other causes of bias, which are usually independent of the sample composition. (Among possible reasons are that many persons who cannot be located have obtained jobs outside the area and have moved and that nonrespondents are in some ways psychologically different from the general population and the differences affect their ability to find employment.) Unfortunately, the extent to which these causes affect the result of a particular survey are, in most cases, not known, and consequently there is the possibility of significant bias when high nonresponse rates exist. Although we strongly recommend the adjustment procedures, they should not be considered replacements for a vigorous effort to achieve the highest response rate possible. They are an adjunct to such an effort.
A later section provides a summary of the general-purpose nonresponse adjustment methods currently used in many social surveys. The nonresponse adjustment factors are incorporated into the survey weights. The next section reviews the properties of sampling weights in preparation for the discussion of nonresponse adjustment procedures.
WEIGHTING SURVEY DATA
Sample weighting is carried out to accomplish a number of objectives, including adjustments for nonresponse. The purpose of weighting the survey data is to permit analysts to produce estimates of statistics for the total target population. For example, state surveys usually involve the selection of a random sample of
low-income persons from an existing administrative data file. Sampling weights produced for such surveys can be considered as estimated measures of the number of persons in the target population that the particular sampled low-income individual represents. Weighting takes into account several features of the survey: the specific probabilities of selection of individuals in the sample (as described in the following subsection), as well as nonresponse and differences between the sample of low-income persons and the total low-income population. Differences between the sample and the population may arise because of sampling variability, differential noncoverage in the survey among population subgroups, and possibly other types of response errors, such as differential response rates or misclassification errors.
In summary, sample weighting in surveys is carried out to accomplish the following objectives:
-
To enable the production of tabulations that provide estimates of the number of persons (or families) in the population for the various categories tabulated;
-
To compensate for disproportionate sampling of various subgroups in the sample;
-
To reduce biases arising from the fact that nonrespondents may be different from those who participate;
-
To compensate, to the extent possible, for noncoverage in the sample due to inadequacies in the sampling frame or other reasons for noncoverage; and
-
To reduce variances in the estimation procedure by using auxiliary information that is known with a high degree of accuracy if the auxiliary variables are highly correlated with the study variables.
We start with a description of base weights because the adjustments are applied to these weights.
Base Weights
The base weight for a sample unit (e.g., a sampled low-income family) is defined as the reciprocal of the probability of including the unit in the sample. The base weight for the i-th unit in the sample is given by
[3]
where pi is the known probability of including unit i in the sample. If the sample units are selected with equal probability, the probability of selection is pi=n/N for all sample units, where n is the sample size and N is the number of units in the sampling frame. The base weight, therefore, is wi=N/n for all sampled units. In
this case, ![]() . In the family income survey (FIS) example given earlier, assume that a sample of n=820 families was selected with equal probabilities of selection from a population of N=41,000 families. Then the probability of selection for each unit in the sample is equal to n/N=820/41,000, and the base weight would be equal to N/n=50 for each sampled family. Thus, each family selected into the sample represents 50 families in the administrative file used for sampling.
. In the family income survey (FIS) example given earlier, assume that a sample of n=820 families was selected with equal probabilities of selection from a population of N=41,000 families. Then the probability of selection for each unit in the sample is equal to n/N=820/41,000, and the base weight would be equal to N/n=50 for each sampled family. Thus, each family selected into the sample represents 50 families in the administrative file used for sampling.
State surveys may be designed to provide an equal probability sample (similar to the previous example) or a disproportionate sample of low-income persons with respect to a selected set of characteristics (e.g., demographic characteristics). In an equal-probability sample, the distribution of the sample is expected to be similar to the administrative frame. For example, if the administrative frame in state S includes 10 percent Hispanics and 90 percent non-Hispanics, an equal probability sample is expected to include about 10 percent Hispanics and 90 percent non-Hispanics. However, if state S is interested in analyzing the well-being of the low-income Hispanic population, the survey is likely to include an oversampling of low-income Hispanic persons. The oversampling can be accomplished by stratifying the frame into two strata, Hispanics and non-Hispanics, and applying a larger sampling rate to Hispanics. In this case, the sample will contain a disproportionate representation of Hispanics. When disproportionate sampling is applied in stratified sampling, different weights (referred to as base weights) are used to compensate for the unequal representation in the sample. Otherwise, estimates will be biased. Returning to the FIS example, assume that Hispanic families are sampled at a rate of 1 in 30 and that non-Hispanics are sampled at a rate of 1 in 60. Then the base weight for the Hispanics is equal to 30, and the base weight for non-Hispanics is equal to 60. Thus, each sampled Hispanic family represents 30 Hispanic families in the population, and each non-Hispanic family in the sample represents 60 non-Hispanic families in the population. For more information on disproportionate sampling, refer to Kish (1992).
Although the base weights are theoretically unbiased weights that “inflate” the sample observations to population levels, in practice, most survey practitioners find it useful to modify the base weights. Nonresponse in the survey, for example, results in losses in the sample data that can be partially compensated for by adjusting the weights of the respondents. If the sampling frame is deficient because it is outdated or its coverage of certain population subgroups is inadequate, further adjustment of the weights may be desirable to compensate for these deficiencies. The following section provides brief descriptions of various weight adjustment procedures commonly used in large-scale surveys.
COMMON NONRESPONSE ADJUSTMENT METHODS IN SURVEYS
In spite of the best strategies for collecting data from sampled units, nonresponse nearly always occurs in population surveys, including those of low-income families. A “nonrespondent” is any sampled unit that is eligible for the study but for which data are not obtained for any reason. Failure to match the sample cases with the administrative files used to gather outcome data, refusal to participate in the survey, or situations such as “not-at-home after multiple calls,” “language problems,” and “knowledgeable person not available” are some of the reasons why an eligible sampled unit may not participate in a survey. On the other hand, sampled units that are ineligible for the survey are not considered nonrespondents, even though they do not provide survey data. As discussed later in this section, nonrespondents and ineligibles are treated differently in the nonresponse adjustment process.
When nonresponse is present, a weight adjustment can partially compensate for the loss of data. This weight adjustment increases the weights of the sampled cases for which data were collected. The first step in adjusting for nonresponse is the construction of weighting classes. As discussed in the following text, within each weighting class, the base weights are inflated by the inverse of the response rate so that the sum of the adjusted base weights for respondents is equal to the sum of the base weights for the total eligible sample selected in the weighting class. Returning to the FIS example, assume that 160 families were selected (with equal probability) within a weighting class and that 77 families responded to the survey. Because the weight for each family is equal to 50 (as shown earlier), the nonresponse-adjusted weight is about 104 (i.e., 50 multiplied by 160/77). Thus, after nonresponse adjustment each responding family in the sample represents about 104 families in the population within the weighting class.
The effectiveness of nonresponse adjustment procedures in reducing nonresponse bias is directly related to the ability to construct appropriate nonresponse adjustment classes. The following subsection provides a brief summary of two procedures commonly used to construct adjustment classes. The next subsection discusses sample-based adjustment procedures that are commonly used to compensate for nonresponse. Then we describe population-based adjustment procedures (poststratification and raking) that are widely used for noncoverage adjustment, or sometimes used to correct simultaneously for both nonresponse and noncoverage. Additional benefits of population-based adjustments include reduction in the sampling errors of the sample estimates as well as achieving consistency with the known population counts. In poststratification and raking, respondents are categorized according to one or more variables (e.g., age, gender, race, or income level) at a recent point in time, and the survey estimates are bench-marked to the known population totals. For a general review of weighting for
nonresponse, refer to Elliot (1991). Finally, we provide a discussion of the importance of balancing bias and variance when adjusting survey data.
Construction of Nonresponse Adjustment Classes
Implementing nonresponse adjustment procedures requires the specification of appropriate weighting classes or cells. Survey responses generally are correlated with certain characteristics of the sample units, and it would be desirable to form classes based on these characteristics. Often, little is known about the nonrespondents. Relevant information about each sampled unit sometimes can be obtained through data retrieval efforts to collect limited data about the nonrespondents or by interviewer observation (if applicable). The availability of this information would enhance the effectiveness of the nonresponse adjustment.
Data used to form classes for nonresponse adjustments must be available for both respondents and nonrespondents. In state low-income surveys, the administrative files used to select the sample are good sources of information for forming weighting classes. In a recent survey, we contacted a number of states to inquire about the availability and the quality of their administrative data, including the following variables:
-
Demographic
Age
Gender
Race/ethnicity
Marital status
Number of children
-
Socioeconomic
Education
Employment
Earned income
Welfare income
Housing subsidy
Length of time on welfare
-
Geographic
Urban/rural
Metropolitan/nonmetropolitan status
County code
Zip code
Thirteen states completed our questionnaire. All states reported having data on age, gender, race/ethnicity, number of children, and length of time on welfare. Most states also have data on earned income, welfare income, employment, county code, zip code, and marital status. About 50 to 60 percent of states re-
ported having data on education, housing subsidies, metropolitan/nonmetropolitan status, and urbanicity. The 13 states that responded to the questionnaire on auxiliary data also indicated their assessments of the quality of the administrative data that their state maintains. We observed that the quality of data on demographic variables was quite high, with less than 1 percent missing values. For the socioeconomic variables, the only two variables with high-quality data are “welfare income” and “length of time on welfare,” where length of time on welfare is measured for the most recent episode. Data on employment and earned income, if applicable, were obtained by matching with quarterly wage records. The only geographic variables of high quality are county and zip codes. We encourage state welfare program administrators to look for other potential data sources that could be used as auxiliary variables for nonresponse and/or noncoverage adjustments, such as wages and employment data sources. The above variables are usually good candidates for use in nonresponse adjustment. However, missing data on items used for nonresponse adjustment can present problems for postsurvey adjustments. If a substantial amount of data are missing for an item on the sampling frame, this variable is probably not appropriate for the purpose of nonresponse adjustments.
The variables used to form weighting classes should be effective in distinguishing between subgroups with different response rates. They are most useful when survey responses are roughly similar for respondents and nonrespondents within a class. If this implicit assumption holds, the estimates are effectively unbiased. In establishing the nonresponse adjustment classes, the following should be kept in mind:
-
The variables used in nonresponse adjustment should be available for both respondents and nonrespondents;
-
Response rates should be different among the nonresponse adjustment classes;
-
Survey responses are expected to be different among the classes; and
-
The adjustment classes should respect a balance between bias and variance (refer to the section entitled “Balancing Bias and Variance When Adjusting for Nonresponse” for a discussion of balancing bias and variance when creating adjusted sampling weights).
As mentioned earlier, knowledge of the likely behavior of persons in various demographic and socioeconomic classes can be used to construct weighting classes. A preliminary analysis of response rates in these classes can refine the classification further.
Returning to the FIS example provided earlier, assume that nonresponse evaluation research has identified the gender and race (white/nonwhite) of the head of family as the best predictors of nonresponse. Then, the sample is divided into four classes, as shown in Table 5–4. Note that mean income and the non-
TABLE 5–4 Nonresponse Adjustment Classes for the FIS* Example
response rate are both quite variable across the four classes. This suggests that the adjustments have the potential to reduce the nonresponse bias.
More sophisticated methods also are available. We discuss two commonly used procedures (referred to as modeling response propensity) for defining weighting classes using data on auxiliary variables. The first method involves classification or segmentation based on a categorical search algorithm. The second method is based on logistic regression modeling. Software is available to perform the computations required for both procedures.
The first class of methods divides a population into two or more distinct groups based on categories of the “best” predictor of a dependent variable. The dependent variable is a categorical variable with two categories: respondents and nonrespondents. The predictor variable with the highest significance level is used to split the sample into groups. It then splits each of these groups into smaller subgroups based on other predictor variables. This splitting process continues until no more statistically significant predictors can be found, or until some other stopping rule is met (e.g., there are too few observations for further splitting). The result is a tree-like structure that suggests which predictor variable may be important.5 It is a highly efficient statistical technique for segregation, or tree growing, with many different versions currently available, as described in Breiman et al., (1993).
The second approach models the response status of the sampled units using predictor variables that are known for both respondents and nonrespondents from
|
5 |
The above cell creation can be carried out using SPSS AnswerTree. For more information about SPSS AnswerTree, visit http://www.spss.com. |
the sampling frame. Most commonly, the prediction approach is based on a logistic or probit regression model effectively using auxiliary variables, such as demographic, socioeconomic, and geographic variables, to predict the probability of response. For more information on logistic response propensity modeling, refer to Little and Rubin (1987), Brick and Kalton (1996), and Iannacchione et al. (1991).
Sample-Based Adjustment Procedures
Sample-based nonresponse adjustments make use of information that is available for the sample, and thus do not require any external population counts. In effect, sample-based nonresponse adjustments distribute the base weights of the nonresponding units to the responding sampled units so that the sum of the adjusted weights over the responding units equals the sum of the base weights for the entire sample.
The basic form of the sample-based nonresponse adjustments is a ratio of sums of base weights where the sums extend over specified subsets of the sample defined by response status. The particular form of the adjustment depends on whether the eligibility status of the nonresponding units can be ascertained. First, we describe the nonresponse adjustment under the assumption that every sampled unit can be assigned to one of the following three response status groups:
|
Group 1: |
Respondents. This group consists of all eligible sample units that participated in the survey (i.e., provided usable survey data). |
|
Group 2: |
Nonrespondents. This group consists of all eligible sample units that did not provide usable survey data. |
|
Group 3: |
Ineligible or out of scope. This group consists of all sample units that were ineligible or out of scope for the survey. |
In this particular case, it is assumed that all of the nonrespondents (Group 2) in the sample have been determined to be eligible for the survey and that all of those in Group 3 have been determined to be ineligible for the survey. If eligibility is unknown for some of the selected cases, the usual approach is to distribute proportionally the weights of those with unknown eligibility to those for which eligibility was determined. In the FIS example, let’s assume that 850 families originally were selected from an administrative file. However, it was determined later that 30 families were ineligible because the administrative frame was outdated, for example. The total number of eligible families is 820, and 648 responded to the survey. In this case, Group 1=648, Group 2=172, and Group 3=30. The corresponding sample-based nonresponse adjustment factor A(nr) is defined to be the ratio of sums:
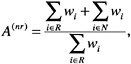
[4]
where wi is the base weight for the sampled unit i, R represents survey respondents (Group 1), and N represents nonrespondents (Group 2). The adjustment factor A(nr) is applied only to the base weights of the respondents (Group 1) in the sample; that is, the nonresponse-adjusted weight ![]() is computed as
is computed as
![]() =0, if unit i is nonrespondent (Group 2).
=0, if unit i is nonrespondent (Group 2).
![]() =wi, if unit i is out of scope (Group 3).
=wi, if unit i is out of scope (Group 3).
![]() =A(nr)wi, if unit i is an eligible respondent (Group 1).
=A(nr)wi, if unit i is an eligible respondent (Group 1).
In practice, the nonresponse adjustment, A(nr), is calculated within specified weighting or adjustment classes. The procedures for forming appropriate weighting classes for this purpose were discussed earlier.
Table 5–5 shows the nonresponse adjustment factors and adjusted weights for the FIS example. Because the base weights are equal to N/n (=50) for each sampled family (as shown in an earlier section on base weights), the nonresponse adjustment factors in column 4 are simply equal to the ratio of column 2 to column 3. The base weights would be adjusted by multiplying the base weights by the nonresponse adjustment factors i.e., column 1 multiplied by column 4.
TABLE 5–5 Nonresponse Adjustment Factors and the Adjusted Weights for the FIS* Example
|
Head of Family’s Gender and Race |
Base Weight (1) |
Sample Size (2) |
Respondents (3) |
Nonresponse Adjustment Factor (4) |
Adjusted Weight** (5) |
|
Male |
|
||||
|
White |
50 |
160 |
77 |
2.08 |
104 |
|
Nonwhite |
50 |
51 |
35 |
1.46 |
73 |
|
Female |
|
||||
|
White |
50 |
251 |
209 |
1.20 |
60 |
|
Nonwhite |
50 |
358 |
327 |
1.10 |
55 |
|
Total |
|
820 |
648 |
|
|
|
NOTES: *Family Income Survey **For presentation purposes, we have rounded up the adjustment factors (to two decimals) and the adjusted weights (to whole numbers). The calculations, however, carry all the decimals. |
|||||
That is, the adjusted weight for each of the respondents in the four cells created by gender and race is equal to the weight given in column (5).
Population-Based Adjustments
In applications where external control counts are available for weighting, the usual practice is to first calculate sample-based nonresponse-adjusted weights and then to further adjust these weights through population-based adjustments. Population-based adjustment tends to reduce the effects of noncoverage (e.g., incomplete frames) and improve the representation of the sample. Sometimes, it is convenient or necessary to bypass the intermediate step of calculating the sample-based nonresponse-adjusted weights. In this case, the base weights would be ratio adjusted directly to known control totals in a single step. For example, if the classes used for nonresponse adjustment also are used for population-based adjustments, the two-step procedure of first adjusting for nonresponse and then adjusting to known control totals is equivalent to the single population-based adjustment procedure discussed in this section. Separate nonresponse adjustments are necessary when the nonresponse weighting classes are different from those planned for the population-based adjustments. This is usually, although not always, the case because different sources of data are available for each adjustment. In the following sections, we briefly describe the two most commonly used population-based adjustment procedures.
The term “calibration” is used in the literature to cover a variety of techniques used in benchmarking the weights to known external totals. In this paper, we focus our attention on the two procedures most commonly used in general surveys: poststratification and raking.
Poststratification
Poststratification is a popular estimation procedure in which the weights of the respondents are adjusted further so that the sums of the adjusted weights are equal to known population totals for certain subgroups of the population. For example, take the case where the population totals of subgroups (referred to as poststrata) defined by age, gender, and race/ethnicity are known from the sampling frame (or other external sources), and they also can be estimated from the survey. Poststratification adjusts the survey weights so that the distribution by subgroups (when weighted by the poststratified weights) is the same as the population distribution from the survey frame or external sources.
Let Ng denote the population count in the poststratum denoted by g as obtained from the sampling frame or an external source, and let ![]() be the corresponding survey estimate obtained by using the nonresponse-adjusted weights. Then the ratio Ng/
be the corresponding survey estimate obtained by using the nonresponse-adjusted weights. Then the ratio Ng/![]() is the poststratification adjustment factor for subgroup g.
is the poststratification adjustment factor for subgroup g.
The main advantage of poststratification is that the procedure reduces the bias from some types of noncoverage and nonresponse. An additional advantage of poststratification is the improvement in the reliability of the survey estimates for variables that are highly correlated with the variables used for poststratification. Generally, the poststratified weights are the final survey weights, and these would be used to tabulate the survey results. Occasionally, an additional weighting factor, called a “trimming factor,” is used to protect against extremely high variances. A brief description of trimming procedures used in practice is provided in a later section. If a trimming factor is calculated for a survey data file, it should be incorporated into the final weight as another multiplication factor.
Earlier, we illustrated the nonresponse adjustment procedure by assuming that the number of families in the population was 41,000 and that there was no noncoverage. We continue the FIS example, assuming that the number of families in the population was actually 46,000 and that the sampling frame contained only 41,000 families because information necessary for locating respondents was missing for 5,000 families. However, some limited demographic and other socioeconomic information was available in the data files for all 46,000 families. Suppose further that the noncoverage rate varies within the four cells defined by the cross-classification of employment status (employed/not employed) and education (high school diploma/no high school diploma) of the head of the family. Poststratification adjustment can be applied to reduce the bias arising from noncoverage.
The poststratification adjustment factor for a poststratification cell is the ratio of the known family count within the poststratification cell to the corresponding estimate of the family count from the survey. The estimate of the family count within a poststratification cell is obtained by summing the nonresponse-adjusted weights of the families (as shown in Table 5–5) in the poststratification cell. Because the base weights were adjusted to account for the nonresponse (as given in Table 5–5), these adjusted weights would vary by poststratified adjustment classes. Therefore, Table 5–6 gives the count and the adjusted weight for the 16 cells defined by the cross-classification of nonresponse adjustment classes (4 classes) and poststrata (4 cells).
Column 2 is the nonresponse adjusted weight for each family in the gender/ race/employment/education class. The initial estimate of total number of families in each class (taking nonresponse into account) is the product of colums 1 and 2 and is given in column 3. The total of the nonresponse-adjusted weights (column 3) can be used to estimate the number of families by poststrata defined by employment status and education of the head of the family. Table 5–7 provides the estimates of the family count and the corresponding known family count from external sources by poststrata. The table also gives the poststratification adjust-
TABLE 5–6 Distribution of Nonresponse-Adjusted Weights by Gender, Race, Employment, and Education for the FIS* Example
|
Head of family |
Respondent Count (1) |
Nonresponse-Adjusted Weight** (2) |
Initial Estimated No. of Families (3) |
||
|
Gender and Race |
Employment |
Education |
|||
|
Male |
|||||
|
White |
Employed |
HS*** |
38 |
104 |
3,948 |
|
Nonwhite |
Employed |
HS |
15 |
73 |
1,093 |
|
White |
Employed |
No HS |
11 |
104 |
1,143 |
|
Nonwhite |
Employed |
No HS |
6 |
73 |
437 |
|
White |
Unemployed |
HS |
12 |
104 |
1,247 |
|
Nonwhite |
Unemployed |
HS |
5 |
73 |
364 |
|
White |
Unemployed |
No HS |
16 |
104 |
1,662 |
|
Nonwhite |
Unemployed |
No HS |
9 |
73 |
656 |
|
Female |
|||||
|
White |
Employed |
HS |
101 |
60 |
6,065 |
|
Nonwhite |
Employed |
HS |
158 |
55 |
8,649 |
|
White |
Employed |
No HS |
30 |
60 |
1,801 |
|
Nonwhite |
Employed |
No HS |
47 |
55 |
2,573 |
|
White |
Unemployed |
HS |
33 |
60 |
1,982 |
|
Nonwhite |
Unemployed |
HS |
51 |
55 |
2,792 |
|
White |
Unemployed |
No HS |
45 |
60 |
2,702 |
|
Nonwhite |
Unemployed |
No HS |
71 |
55 |
3,887 |
|
Total |
|
648 |
|
41,000 |
|
|
NOTES: *Family Income Study **For presentation purposes, adjusted weights are rounded to whole numbers. The calculations, however, carry all the decimals. ***HS=high school diploma. |
|||||
ment factors, defined as the ratio of the known family count and the survey estimate.
The final survey weights are defined as the product of the base weight and the adjustment factors for nonresponse and poststratification. Table 5–8 includes the final weights for the FIS example. The final weight in column 5 is equal to the product of the base weight in column 1 and the nonresponse adjustment in column 3 and the poststratification factor in column 4.
It is not always possible to use poststratification because it requires data on the cross-classification of categorical variables that are used to define poststrata. Either the cell-level population counts may not be available or the sample sizes
TABLE 5–7 Poststratification Adjustment Factors for the FIS* Example
|
Poststratum |
Initial Survey Estimate* |
Known Auxiliary Total |
Adjustment Factor** |
|
Employed |
|||
|
HS*** |
19,757 |
22,125 |
1.12 |
|
No HS |
5,955 |
6,313 |
1.06 |
|
Unemployed |
|||
|
HS |
6,385 |
6,966 |
1.09 |
|
No HS |
8,908 |
10,596 |
1.19 |
|
NOTES: *Family Income Study **For presentation purposes, we have rounded up the adjustment factors (to two decimals) and the adjusted weights (to whole numbers). The calculations, however, carry all the decimals. ***HS=high school diploma. |
|||
for some of the cells in the poststrata may not be adequate (for a discussion of adequate cell sample sizes, refer to the following section entitled “Balancing Bias and Variance When Adjusting for Nonresponse”). In such situations, survey practitioners frequently use a more complex poststratification method, referred to as a raking procedure, which adjusts the survey estimates to the known marginal totals of several categorical variables.
Raking Procedure
This methodology is referred to as raking ratio estimation because an iterative procedure is used to produce adjustment factors that provide consistency with known marginal population totals. Typically, raking is used in situations where the interior cell counts of a cross-tabulation are unknown or the sample sizes in some cells are too small for efficient estimation (refer to the following section for more information about sufficient cell sample size).
Raking ratio estimation is based on an iterative proportional fitting procedure developed by Deming and Stephan (1940). It involves simultaneous ratio adjustments of sample data to two or more marginal distributions of the population counts. With this approach, the weights are calculated such that the marginal distribution of the weighted totals conforms to the marginal distribution of the targeted population; some, or all, of the interior cells may differ.
The raking procedure is carried out in a sequence of adjustments. The base weights (or nonresponse-adjusted weights) are first adjusted to produce one marginal distribution, the adjusted weights are used to produce a second marginal distribution, and so on, up to the number of raking dimensions. One sequence of adjustments to the marginal distributions is known as a cycle or iteration. The sequence of adjustments is repeated until convergence is achieved, meaning that
TABLE 5–8 Final Poststratified Weights for the FIS* Example
|
Poststratum |
Base Weight (1) |
Respondents (2) |
Nonresponse Adjustment (3)** |
Poststrat. Adjustment (4)** |
Final Weight (5)** |
Final Estimate of No. of Families (6) |
||
|
Head of Family’s Gender and Race |
Employment |
Education |
||||||
|
Male |
||||||||
|
White |
Employed |
HS*** |
50 |
38 |
2.08 |
1.12 |
116 |
4,422 |
|
Nonwhite |
Employed |
HS |
50 |
15 |
1.46 |
1.12 |
82 |
1,224 |
|
White |
Employed |
No HS |
50 |
11 |
2.08 |
1.06 |
110 |
1,212 |
|
Nonwhite |
Employed |
No HS |
50 |
6 |
1.46 |
1.06 |
77 |
463 |
|
White |
Unemployed |
HS |
50 |
12 |
2.08 |
1.09 |
113 |
1,360 |
|
Nonwhite |
Unemployed |
HS |
50 |
5 |
1.46 |
1.09 |
80 |
397 |
|
White |
Unemployed |
No HS |
50 |
16 |
2.08 |
1.19 |
124 |
1,978 |
|
Nonwhite |
Unemployed |
No HS |
50 |
9 |
1.46 |
1.19 |
87 |
780 |
|
Female |
||||||||
|
White |
Employed |
HS |
50 |
101 |
1.20 |
.12 |
67 |
6,793 |
|
Nonwhite |
Employed |
HS |
50 |
158 |
1.10 |
.12 |
62 |
9,687 |
|
White |
Employed |
No HS |
50 |
30 |
1.20 |
.06 |
64 |
1,910 |
|
Nonwhite |
Employed |
No HS |
50 |
47 |
1.10 |
.06 |
58 |
2,728 |
|
White |
Unemployed |
HS |
50 |
33 |
1.20 |
.09 |
65 |
2,162 |
|
Nonwhite |
Unemployed |
HS |
50 |
51 |
1.10 |
.09 |
60 |
3,046 |
|
White |
Unemployed |
No HS |
50 |
45 |
1.20 |
.19 |
71 |
3,215 |
|
Nonwhite |
Unemployed |
No HS |
50 |
71 |
1.10 |
.19 |
65 |
4,624 |
|
Total |
|
648 |
|
46,000 |
||||
|
NOTES: *Family Income Survey **For presentation purposes, we have rounded up the adjustment factors (to two decimals) and the adjusted weights (to whole numbers). The calculations, however, carry all the decimals. *** HS=high school diploma. |
||||||||
the weights no longer change with each iteration. In practice, the raking procedure usually converges, but the number of iterations may be large when there are many marginal distributions involved in raking.
The final weights are produced automatically by the software that implements raking. The raking procedure only benchmarks the sample to known marginal distributions of the population; it should not be assumed that the resulting solution is “closer to truth” at the cross-classification cell level as well. The final solution from a raking procedure may not reflect the correlation structure among different variables. For a more complete discussion of raking, refer to Kalton and Kasprzyk (1986).
As noted earlier, raking is one of a range of related methods known as calibration methods. One specific calibration method is GREG (Generalized REGression). GREG is not as commonly used as poststratification and raking because of its rather complex application and some of its limitations. Refer to Särndal et al. (1992) and Valliant et al. (2000) for a description of GREG.6 For information about calibration techniques, refer to Deville and Särndal (1992) and Theberge (2000).
The weighting system is implemented by assigning weights to each person (or family) in the sample, inserting the weight into the computer record for each person, and incorporating the weights in the estimation process using software created for survey data analysis.
Balancing Bias and Variance When Adjusting for Nonresponse
The fundamental objective of the design of any survey sample is to produce a survey data set, that, for a given cost of data collection, will produce statistics that are nearly unbiased and sufficiently precise to satisfy the goals of the expected analyses of the data. In general, the goal is to keep the mean square error (MSE) of the primary statistics of interest as low as possible. The MSE of a survey estimate is
MSE=Variance+(Bias)2. [5]
The purpose of the weighting adjustments discussed in this paper is to reduce the bias associated with noncoverage and nonresponse in surveys. Thus, the application of weighting adjustments usually results in lower bias in the associated survey statistics, but at the same time adjustments may result in some increases in variances of the survey estimates.
The increases in variance result from the added variability in the sampling weights due to nonresponse and noncoverage adjustments. Thus, the analysts
who create the weighting adjustment factors need to pay careful attention to the variability in the sampling weights caused by these adjustments. The variability in weights will reduce the precision of the estimates. Thus, a tradeoff should be made between variance and bias to keep the MSE as low as possible. However, there is no exact rule for this tradeoff because the amount of bias is unknown.
In general, weighting class adjustments frequently result in increases in the variance of survey estimates when (1) many weighting classes are created with a few respondents in each class, and (2) some weighting classes have very large adjustment factors (possibly due to much higher nonresponse or noncoverage rates in these classes). To avoid such situations, survey statisticians commonly limit the number of weighting classes created during the adjustment process. In general, although exact rules do not exist for minimum sample sizes or adjustment factors for adjustment cells, statisticians usually avoid cells with fewer than 20 or 30 sample cases or adjustment factors larger than 1.5 to 2. Refer to Kalton and Kasprzyk (1986) for more information on this topic.
Occasionally, the procedures used to create the weights may result in a few cases with extremely large weights. Extreme weights can seriously inflate the variance of survey estimates. “Weight trimming” procedures are commonly used to reduce the impact of such large weights on the estimates produced from the sample.
Weight trimming refers to the process of adjusting a few extreme weights to reduce their impact on the weighted estimates (i.e., increase in the variances of the estimates). Trimming introduces a bias in the estimates; however, most statisticians believe that the resulting reduction in variance decreases the MSE. The inspection method, described in Potter (1988, 1990), is a common trimming method used in many surveys. This method involves the inspection of the distribution of weights in the sample. Based on this inspection, outlier weights are truncated at an acceptable level (the acceptable level is derived based on a tradeoff between bias and variance). The truncated weights then are redistributed so that the total weighted counts still match the weighted total before weight trimming.
Analysts should pay attention to the variability of the weights when working with survey data, even though all measures (such as limits on adjustment cell sizes, and weight trimming) may have been taken to keep the variability of weights in moderation. Analysts should keep in mind that large variable values in conjunction with large weights may result in extremely influential observations, that is, observations that dominate the analysis.
Analyzing Weighted Survey Data
Because estimates will be based on sample data, they will differ from figures that would have been obtained from complete enumeration of the universe. Results are subject to both sampling and nonsampling errors. Nonsampling errors include biases because of inaccurate reporting, measurement and processing er-
rors, as well as errors because of nonresponse and incomplete sampling frames. Inaccurate or incomplete responses can occur due to misunderstanding or the misinterpretation of questions. Errors can also occur when responses are coded, edited, and entered into the database. Generally, the nonsampling errors cannot be measured readily but a number of quality assurance techniques are employed to reduce the frequency of such errors.
For the computation of sampling errors, most standard techniques used in statistical packages (e.g., SAS, SPSS, and others) assume that observations are independent and drawn using simple random sampling (SRS) selection methods and that all sampled cases participated in the survey. The estimates of variances for complex survey designs computed using standard statistical software packages that assume simple random sampling and a 100-percent response rate are biased. Once a sample departs from SRS and in the presence of nonresponse (especially in cases where nonresponse is rather high), new computational procedures are required in order to take into account the impact of survey design and nonresponse on statistical estimation. Two common approaches available for estimation of variances for complex survey data are Taylor linearization and replication. Using these procedures, factors such as stratification and the use of differential sampling rates to oversample a targeted subpopulation, and adjustments for nonresponse, can be reflected appropriately in estimates of sampling error. Wolter (1985) is a useful reference on the theory underlying variance estimation using replication and Taylor linearization methods. For information about relevant survey analysis software, visit http://www.amstat.org/srms/links.html.
SUMMARY
The occurrence of missing data—whether for a unit or an item and whether due to nonresponse or noncoverage—creates the potential for bias. The potential for bias is particularly great in the presence of high nonresponse rates. In this paper, we provided brief descriptions of the methods most commonly used to adjust for unit nonresponse and noncoverage in general-purpose surveys. However, it is also very important to pay attention to nonresponse rates for each item in the questionnaire, and data analysts should consider using imputation procedures to compensate for missing items in the state surveys.
As discussed earlier, studies of the low-income population usually suffer from missing data. In studies that include only administrative data, noncoverage bias can result from using an incomplete administrative frame of eligible persons, and nonresponse occurs because of an inability to match the sample with the administrative file that includes the outcome data. Surveys are also subject to both underrepresentation due to nonresponse and frame noncoverage. Descriptions of nonresponse and frame noncoverage also are provided.
We also summarize the most commonly used procedures for nonresponse adjustments in multipurpose surveys. There are basically two types of adjustments, sample-based and population-based adjustments. The first group is based on procedures that use only sample information to reduce the nonresponse bias. The second approach uses external data to reduce the effects of both nonresponse and noncoverage. These adjustments are applied to respondents’ records after the sample has been divided into a number of subgroups, called nonresponse adjustment classes. Adjustment methods for unit nonresponse involve deriving adjustment factors to be incorporated into sampling weights. A brief description of sample weighting is given in a previous section. When data are collected as part of a survey and sample weights are created, special procedures are needed to analyze the survey data. The previous section provides a brief review of the current procedures used to analyze weighted survey data.
Nonresponse adjustment methods can serve to reduce nonresponse bias. However, the total elimination of such bias generally is not possible, because within any weighting class the respondents ordinarily will not be fully representative of the nonrespondents. The impact of nonresponse bias is usually small in surveys with low nonresponse rates when nonresponse-adjusted weights are used along with the survey data. Although sample weighting cannot take all differences between respondents and nonrespondents into account, the weighting cells that are usually used appear, in general, to reduce the effect of any potential differences between respondents and nonrespondents.
The potential for bias is particularly great in the presence of high nonresponse rates. Thus, analysts are advised to take survey nonresponse rates and effects on the reliability of data into account when analyzing and reporting survey data. Analysis based on data from surveys with low nonresponse rates can be reported with a much higher level of confidence than those coming from surveys with high nonresponse rates.
REFERENCES
Breiman, L., J.H.Friedman, R.A.Olshen, and C.J.Stone 1993 Classification and Regression Trees. New York: Chapman & Hall.
Brick, J.M., and G.Kalton 1996 Handling missing data in survey research. Statistical Methods in Medical Research 5:215– 238.
Deming, W.E., and F.F.Stephan 1940 On a least square adjustment of a sampled frequency table when the expected marginal totals are known. Annals of Mathematical Statistics 11:427–444.
Deville, J.C., and C.E.Särndal 1992 Calibration estimators in survey sampling. Journal of the American Statistical Association 74:911–915.
Elliot, D. 1991 Weighting for Non-Response: A Survey Researcher’s Guide. London, England: Office of Population Censuses and Surveys, Social Survey Division.
Estevao, V., M.Hidiroglou, and C.E.Särndal 1995 Methodological principles for a generalized estimation system at Statistics Canada. Journal of Official Statistics 11:181–204.
Groves, R.M. 1989 Survey Errors and Survey Costs. New York: Wiley.
Iannacchione, V.G., J.G.Milne, and R.E.Folsom 1991 Response probability weight adjustments using logistic regression. Pp. 637–642 in Proceedings of the Section on Survey Research Methods, American Statistical Association. Alexandria, VA: American Statistical Association.
Kalton, G., and D.Kasprzyk 1986 The treatment of missing survey data. Survey Methodology 12(1):1–16.
Kish, L. 1992 Weighting for unequal Pi. Journal of Official Statistics 8:183–200.
Little, R.J.A., and D.B.Rubin 1987 Statistical Analysis with Missing Data. New York: Wiley.
Potter, F. 1988 Survey of procedures to control extreme sampling weights. Pp. 453–458 in Proceedings of the Section on Survey Research Methods, American Statistical Association. Alexandria, VA: American Statistical Association.
1990 A study of procedures to identify and trim extreme sampling weights. Pp. 225–230 in Proceedings of the Section on Survey Research Methods, American Statistical Association. Alexandria, VA: American Statistical Association
Särndal, C.-E., B.Swensson, and J.Wretman 1992 Model-Assisted Survey Sampling. New York: Springer-Verlag.
Theberge, A. 2000 Calibration and restricted weights. Survey Methodology 26(1):99–107.
Tonkin, P., J.Swartz, and J.Baumohl in press The Methodology of CSAT’s Study of the Termination of Supplement Security Income Benefits for Drug Addicts and Alcoholics—Contemporary Drug Problems.
U.S. General Accounting Office 1999 Welfare Reform, Information on Former Recipients’ Status. (GAO/HFHS-99–48). Washington, DC: U.S. Government Printing Office.
Valliant, R., A.Dorfman, and R.Royall 2000 Finite Populations Sampling and Reference: A Prediction Approach. New York: Wiley.
Wolter, K. 1985 Introduction to Variance Estimation. New York: Springer-Verlag.


