
14
Experienced-Based Measures of Heterogeneity in the Welfare Caseload
Robert A.Moffitt
It has long been understood by welfare researchers that the welfare caseload is quite diverse. Many studies of the now-defunct Aid to Families with Dependent Children (AFDC) program demonstrated that some women on the welfare rolls were much worse off than women not on the rolls in terms of family background, educational attainment, labor market experience and skill, health problems, and many other indicators, and that different women might need different types of special assistance. This heterogeneity has assumed even greater importance in the welfare reform environment of the 1990s. The new reforms are, generally speaking, aimed at raising employment levels and promoting work, particularly off the welfare rolls. It is naturally to be expected that women with greater capabilities to respond to these policies will fare better than women with lesser capabilities.1 In addition, from the program operator’s viewpoint, heterogeneity is important because it implies that policies might be differentially targeted, or tailored, to different types of welfare recipients who have different needs and capabilities.
The author would like to thank Irwin Garfinkel, Karl Scholz, and the other members of the Panel for comments, and Eva Sierminska for research assistance.
Heterogeneity is also important in current discussions of so-called welfare leavers—women who have left the welfare rolls subsequent to welfare reform. The employment and other outcomes of welfare leavers are likely to differ according to their labor market skill and background. Women with greater labor market skills may be expected to fare better off the rolls than women with weaker labor market skills, for example. The existing studies on welfare leavers typically report only average outcomes for all leavers and hence do not attempt to detect differences arising from heterogeneity, but such heterogeneity is certain to be present.2 Heterogeneity among leavers is also important because it may lead to differences in average outcomes of leavers across states, for different states have different mixes of recipient types. Hence surveys of how leaver outcomes vary in different states may be reporting differences that arise from differences in the types of women on the rolls in different states rather than the effects of different state welfare policies. The types of women who are on welfare also vary over time as the caseload shrinks and expands, as well for cyclical reasons, and this will cause the average outcomes of leavers to vary over time as well, depending on what types of women exit the rolls at different points in the cycle. Thus, for example, leaver outcomes before and after 1996 may differ because of the business cycle rather than because of welfare reform.3
Heterogeneity in the caseload can be characterized in many ways. A straightforward approach is simply to examine the distributions of characteristics thought to be related to labor market skill, income-generating potential, and general coping capabilities. Examining the distribution of recipients by education, work experience, health status, drug use and illegal activity, and similar variables, are typical for such an exercise. Many studies have examined these differentials. Another approach is simply to examine the labor market outcomes of those who have left the rolls, but this is not appropriate if the object of the analysis is to develop measures of heterogeneity that might be correlated with, or possibly determine or predict, those labor market outcomes.
The approach taken in this chapter instead examines heterogeneity as measured by the recipient’s own welfare experience (hence “experienced-based” measures of heterogeneity). The most important aspect of that experience is the amount of time the recipient has received welfare benefits, which is also a measure of the individual’s degree of welfare “dependence.” The most common measure of this type is the “total-time-on” measure, which denotes the total amount of time within a fixed calendar time interval that the individual has
received welfare. Such total-time-on measures are, arguably, the best single measure of welfare dependence and have been assessed many times.4
However, the concept of total-time-on does not distinguish between short spells and long spells, or between larger and smaller numbers of spells within a given total. Most analyses of the dynamics of welfare participation treat the length of spells as the most important building block for an understanding of welfare participation, and treat the exit rate from a spell—which is an indirect indication of its length—as a key variable to be affected by welfare reform. The issue that this view raises is whether it is important or useful to know how a given total-time-on divides up into a number of spells and lengths of those spells. It might be hypothesized, for example, that women with long spells might be more disadvantaged than women with short spells, even though the latter has a higher rate of movement on and off the rolls and hence ends up with the same total length of time on welfare.
A related concept introduced by Ellwood and Bane (1994:40–41) consists of a three-fold classification of welfare recipients, dividing them into long-termers, short-termers, and cyclers. The first group is composed of recipients with long spells of receipt and hence heavy dependence on welfare; the second group is composed of recipients who have short spells and are on welfare infrequently, leading to relatively mild dependence; and the third group consists of women who frequently move on and off the rolls and may, in the end, accumulate enough total time on welfare that they should be classified as welfare dependent even though their spells are fairly short on average.5 This view, again, suggests that the types of women who have high turnover and short spells are different than those who have low turnover and long spells, even though they might have the same total-time-on.
The reason that one might expect differences among recipients with different turnover rates will be discussed in the text of this paper. Perhaps the simplest economic model is one that presumes that the rate of going off the rolls is positively related to the level of an individual’s labor market skill and experience. In this view, long-termers have the weakest labor market skills, short-termers have the strongest, and cyclers are somewhere in between, with stronger labor market skills than long-termers but not strong enough to stay off the rolls for long periods.
This chapter examines data on women on the welfare rolls and tests whether their labor market skills differ in these ways. Tests for whether total-time-on is
correlated with labor market skill are conducted, as well as whether the number of spells and their length is related to labor market skill on top of the total-time-on. The characteristics of long-termers, short-termers, and cyclers are examined to determine if their labor market skills are ordered in the ranking suggested by the simple theory just described, or not. Data from the National Longitudinal Survey over the 1979–96 period, covering monthly AFDC participation experiences, are used for the analysis.
STATISTICAL MODEL, MODELS OF TURNOVER, AND HETEROGENEITY DEFINITIONS
Statistical Model
The determinants of total-time-on, the number of spells, and the length of spells—as well as whether a recipient should be considered to be a short-termer, long-termer, or cycler—follows from the statistical features of her underlying time profile of participation. That time profile is generated mathematically by a discrete-time statistical process. The building blocks of any such process (in this case, moving on and off welfare) are a pair of hazard rates p[i\t,X(i),Z(i,t),H(i,t)] and q[i\t,X(i),Z(i,t),H(i,t)] for the probability that individual i moves onto the rolls at time t conditional on being off at t-1 and the probability that individual i moves off the rolls at time t conditional on being on at t-1, respectively. Here X(i) denotes time-invariant characteristics (such as family background at age 16 and race), Z(i,t) denotes the entire history of exogenous events that affect welfare transitions (such as business cycle and illnesses), and H(i,t) denotes the individual’s entire history of welfare recipiency up through t-1. The variable t is taken literally to denote age, with t=0 at some initial age like 16. The probability functions p and q are taken over all unobservables in all time periods, consisting of all random events and shocks in the period prior to t. Thus we conceptualize all individuals as starting off at the same age, with certain fixed initial background characteristics, and then proceeding period by period through their lifetimes, moving on and off the rolls according to their individual-specific transition rates p and q. This constitutes a complete model of the process.
We will be interested in this chapter not in these structural transition rates, but rather in the distributions of welfare participation outcomes—that is, the types of patterns of participation that occur—that result from them over a particular calendar interval. Nevertheless, that different women have different patterns over such an interval necessarily arises from differences in the underlying hazards, and those hazards are a function of the variables denoted. A mutually exclusive categorization of all possible sources of heterogeneity in welfare patterns across women is the following: (1) heterogeneity in background characteristics, X(i); (2) heterogeneity in the vector of current and past time-varying exogenous events that differ across individuals, Z(i,t); and (3) heterogeneity in
unobserved differences across individuals with the same X(i) and Z(i,t), both those which arise from different time-invariant unobserved characteristics (unobserved heterogeneity) as well as differences in current and past random shocks.6 Thus any measure y of welfare participation patterns over a given calendar period from, say, t0 and t1-such as total time on welfare, number of spells, average spell lengths—can be written as y(t0,t1)=f(X,Z,e), where X, Z, and e represent the three components just listed, over the interval from t0 to t1.7 Given the function f, we can ask what types of mean characteristics are observed for women who have a particular welfare participation pattern y. Mathematically, we can write this as E[X|y(t0,t1)], and analogously for Z.
We will focus our empirical study below on X rather than Z. That is, we will examine the fixed, time-invariant characteristics (such as race, education, and average earnings and wages) of women with different welfare participation patterns. We will not examine time-varying characteristics, despite the fact that they presumably are important in explaining period-specific reasons for transitioning on and off the welfare rolls.
Models of Turnover
Given our interest in understanding why women with different labor market potential come to have different participation profiles, it is helpful to consider some alternative, stylized models of welfare turnover to fix ideas and establish intuition. One simple economic model presumes that the main reason for movement on and off welfare is fluctuation in job opportunities, as proxied by the level of earnings one can obtain off welfare. Because different women have different levels of labor market skill, they will have different quasi-permanent, mean earnings levels. Hence the existence of earnings fluctuations around each individual mean will lead to more movements on and off the rolls for those with mean earnings close to the cutoff point for leaving or entering the rolls than for those with mean earnings farther away from that cutoff, assuming that the variance of the fluctuations is the same for all. This simple model would lead to the presumption that short-termers have the highest labor market skill, with mean earnings sufficiently high that only significant negative earnings declines result in participation; long-termers have the lowest labor market skill, with mean earnings sufficiently low that only significantly positive earnings increases lead to an exit
from welfare; and cyclers have labor market skill in between, with mean earnings closest to the margin so that many modest fluctuations in earnings lead to entry or exit from the welfare rolls. This is the framework mentioned in the Introduction.8
A variant on this model, popular in some of the economics literature, holds that more time on welfare reduces the mean level of skill because women historically have not worked while on welfare, for the most part, and their labor market skills deteriorate.9 The key issue for present purposes is whether it is time spent in the current spell, or in total over all past spells, that causes skills to deteriorate. If only total-time-on causes such deterioration, we should find that labor market skill—even though it is partly a result, not a cause, of welfare participation—should be negatively related to an individual’s amount of total-time-on but not to turnover or spell lengths, holding total-time-on fixed.
A different model is one in which different individuals experience different degrees of fluctuation in earnings (i.e., different variances). In this case, it is possible that individuals with the same quasi-permanent, mean earnings will have different turnover rates, spell lengths, and total-time-on depending on the variance of their earnings. High-variance individuals will have the greatest turnover rates, for example. In this extreme model, one may find no differences in labor market skill among those with different amounts of turnover, unlike the first model we described.
One may ask why different individuals would have different variances of earnings. One possibility is that some individuals search harder for jobs because they have a stronger desire to leave welfare, but because their permanent skill levels are not very high, they can never succeed in achieving more than a temporary period of employment off the rolls. Another possibility is that some recipients have more turbulent personal lives (possibly including domestic violence or substance abuse, for example), have worse physical or mental health conditions that are episodic in their severity, or have other types of experiences that create instability and hence an inability to sustain a fixed status either on or off welfare.
A third model is one in which individuals differ both in their mean earnings and in their degrees of earnings instability, and the two are either positively or negatively correlated. Although a positive correlation is possible, it seems equally
possible that they could be negatively correlated. That is, it is possible that those with the lowest labor market skills have the greatest degrees of instability as well.10 Perhaps those with the lowest labor market skills are from the most disadvantaged family and neighborhood backgrounds where instability is high. Indeed, high levels of instability could lead to lack of investment in education and poor labor market experience and skills later. The implications of a negative correlation for how labor market skill is related to turnover are unclear, for high earnings instability should lead to high welfare turnover but low labor market skill leads to the opposite. Therefore, it is ambiguous in this model whether those with high welfare turnover will be revealed, on average, to have higher or lower labor market skill than those with low turnover.
A fourth and final model is one in which noneconomic considerations play a larger role in welfare turnover, unlike the models so far that tie welfare participation decisions closely to earnings levels. Noneconomic events like marriage, divorce, childbearing, and changes in personal situation, all can affect welfare turnover rates. Turnover also can be directly affected by welfare administration, through a process known as “administrative churning,” which refers to frequent starts and stops in benefit payments because of temporary denials of eligibility, errors or delays in processing, or skipped payments for some other reason. Whatever the noneconomic cause of welfare turnover, the issue at hand is how each cause is related to labor market skill and mean earnings off welfare. This cannot be predicted in general, and hence leads to another source of possible ambiguity.
Heterogeneity Measures and Definitions
We will be interested in three summary statistics that describe an individual’s welfare participation experiences over a fixed calendar interval:
-
The total number of periods the individual is on welfare in the interval (T);
-
The total number of welfare “spells” experienced by the individual within the interval (N); and
-
The average length of these “spells” (L).
The first of these is the total-time-on measure mentioned previously. The second counts the number of separate welfare “spells” in the interval, where a welfare “spell” is defined as a sequence of consecutive periods on welfare. This is a measure of turnover, for it is closely related to the number of transitions on or off welfare that are experienced in the calendar interval. It should be noted that, here,
a spell can be in progress at the beginning of the calendar interval or in progress at the end and still be counted as a spell. The third measure is the average length of these spells. Given these definitions, T=N*L. Consequently, any two of these measures for any individual determines the third.11
In addition to measuring T, N, and L themselves, we also define three combinations of these variables that together define long-termers, short-termers, and cyclers, the classification scheme proposed by Bane and Ellwood. The definitions we use are:
|
Long-termers: |
N<a |
and |
L>b |
|
Short-termers: |
N<a |
and |
L<b |
|
Cyclers: |
N>a |
|
|
where “a” and “b” are some constants to be selected after an initial examination of the data, and which will be varied as part of a sensitivity analysis. Thus long-termers are defined as having relatively few spells but spells with long average lengths; short-termers are also defined as having relatively few spells but as having short average lengths; and cyclers are defined simply as those with a relatively high number of spells, regardless of their lengths (but, for a fixed interval length [t0,T1], a high number of spells must necessarily ultimately lead to shorter average lengths).
Note that these groups are defined solely on the basis of N and L, not T. The total-time-on surely will be high for long-termers and surely will be low for short-termers, given the definitions provided, but whether T will be high or low (by some definition of those terms) for cyclers is ambiguous. There is no clear definition of these groups in the literature, so it is unclear whether this approach to the definition is the same or different as that used by others. Certainly some appear to use the term “long-termer” to refer to women who have high T per se, regardless of whether they have such a high T because of a small number of long spells or a large number of short spells (thereby using the word “long” to refer to the magnitude of total-time-on, not the length of spells).12 In part this is just a
terminological matter, but defining “long-termer” in this way does have unsatisfactory aspects. It leaves as undefined women who have large numbers of spells but a modest level of T, for example, who do not fall into any category. Moreover, the literal interpretation of the verb “to cycle” implies a definition based purely on turnover rates and numbers of spells, not a total-time-on definition; hence it makes more sense in terms of language to let T be an outcome of a turnover definition of cycling, not as a definitional characteristic. One could stick with a T-defined classification scheme by parceling out cyclers to the long-termer and short-termer groups by saying that there are two types of cyclers—those with high T, whom we will call long-termers, and those with modest T, who will be called short-termers. But in this case, the latter group is lumped in with the more conventional short-termers with low turnover rates. The consequence would be that one would move from a definitional scheme that allows cyclers to be a heterogeneous group to one that allows long-termers and short-termers to each be heterogeneous, which would not appear to be a gain in terms of clarity. Alternatively, one could move to a classification scheme that has more than three groups, but then simplicity begins to be lost.
For all these reasons, we will use the three-fold classification based solely on N and L. However, we will examine the heterogeneity of the cycler group by examining their distributions of T and compare the different subgroups of cyclers so defined to short-termers and long-termers.
Past Work
There is surprisingly little evidence in the literature on the characteristics of individuals with different turnover rates and overall spell patterns, or on how groups of individuals defined by long-termer, short-termer, and cycler status differ by characteristics. The vast majority of studies of welfare dynamics present estimates of the determinants of exit from welfare spells or entry onto welfare or, sometimes, of rates of reentry onto welfare after an exit. These econometric models are not set up to distinguish the determinants of turnover per se from the determinants of total-time-on because they impose a restrictive relationship between the effects of the independent variables on turnover rates, total-time-on, and spell lengths. For example, it would not be possible in these models to find that some variable for labor market potential (e.g., mean potential earnings off welfare) could differ between short-termers and cyclers but not between cyclers and long-termers, to take one case. To distinguish these, a more sophisticated statistical specification would be required. Alternatively, and as a first step, it is more natural to simply examine the characteristics of individual recipients as ranked by their turnover rates, total-time-on, and spell lengths, or by their classification into short-termers, long-termers, or cyclers, as is done in this chapter.
A few recent studies have already attempted this, however. Stevens (2000: Table 4), in a study using administrative data from Maryland, found earn-
ings of AFDC long-termers and cyclers to be not very different for white women. But cyclers had higher earnings than long-termers among the population of black women. In a study using administrative data from Wisconsin, Ver Ploeg (this volume: Table 13–5) examined employment rates of individuals on Temporary Assistance for Needy Families (TANF) and found them to be higher for cyclers than for long-termers. Cancian et al. (1999) also provided evidence on how leaver outcomes in Wisconsin vary with the amount of previous time on welfare.13
DATA AND RESULTS ON SPELL DISTRIBUTIONS
The data set used for the exercise is the 1979 National Longitudinal Survey of Youth, which is a nationally representative set of individuals who were 14 to 21 in 1979 and who were interviewed annually up to 1994 and biannually since then. We utilize the survey through the 1996 interview, which gives us a maximum of 18 years of data.14 We select only women, given our interest in welfare participation. We focus on a 10-year period of each woman’s life, from ages 20 to 29. We could examine the entire 18 years, but such a time period is so long that women might not be easily characterized as long-termers, short-termers, or cyclers for the entire period; they easily could have been long-termers for the first 10 years and cyclers for the second 8 years, for example. The shorter, 10-year time period is less likely to capture multiple stages in the life cycle where welfare participation behavior is markedly different.15 The data give us monthly AFDC participation information (only receipt of AFDC benefits is examined, not other welfare programs), thereby providing us with 10*12=120 months of observations with which to construct our measures of welfare experience. We have 2,763 women in our sample, 514 of whom experienced at least one month of AFDC receipt from ages 20 to 29.16
Figure 14–1 shows the distribution of T in the sample for the 514 women with at least one month of receipt. About 81 percent of the population had no months of receipt—the exact numbers are given in Table 14-A1.17 The distribution of total months of receipt declines with the number of months on welfare, on average, as is typical of these types of distributions. About one fifth (19 percent) received AFDC for only 1 to 6 months in the 10-year period; but, on the other hand, 9 percent received benefits for 8 or more years. The mean and median number of months of benefit receipt are 39 and 28, respectively.
Figure 14–2 shows how these T distributions differ for those with different numbers of spells over the period.18 Not surprisingly, the distributions are shifted to the right for those with larger numbers of spells. The median T for those with one, two, or three spells are 12, 47, and 47, respectively.
Figures 14–3 and 14–4 show the distributions of N and L, respectively.19 Of those ever on AFDC over the 10 years, about 48 percent had only one spell of receipt. The distribution rapidly declines and, in fact, there are relatively few women who had large numbers of spells in these data: Slightly more than 8 percent had four or more spells and only 2 percent had five or more spells. A 10-year period is a long time and offers the possibility of many more spells than this. Thus, even at this relatively young age, the sample shows relatively little turnover.20
Figure 14–4 shows that most recipients have relatively short spells: One-quarter had average spells on AFDC of shorter than 6 months, and 57 percent had average spells of 18 months or shorter. However, this distribution has a long right-hand tail, and a significant number of women have long average spell lengths. Nearly another 20 percent of the sample, for example, had average spells of 3 or more years in length (37 months and over). This skewness is reflected in the marked difference in the mean and median spell length (24 versus 15). Table 14-A3 shows how these average spell lengths differ by the number of spells in the period. Interestingly, those with larger numbers of spells tend to have larger numbers of medium spell lengths, but smaller numbers of both long and short spells. That those with many spells are less likely to have long spells is expected, but that they also have fewer shorter spells (1–6 months) is not. This suggests that those with greater number of spells—cyclers—may have greater welfare dependency than what might have been thought otherwise, a suggestion that will come up again in subsequent tables.
|
17 |
The Appendix to this chapter is comprised of four tables with auxiliary data that will be referred to throughout the chapter. |
|
18 |
Exact figures are given in Table 14-A1. |
|
19 |
Exact figures are given in Tables 14-A2 and 14-A3. As noted in the last section, left-censored and right-censored spells are included as “spells” in these tabulations. However, only 3.4 percent of the sample was on AFDC in the first month of age 20 and only 2.6 percent were on in the last month of age 29. |
|
20 |
Administrative data may show more turnover because of administrative churning. |
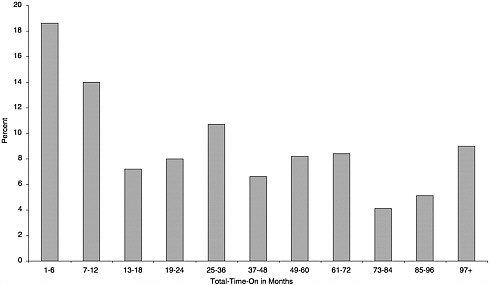
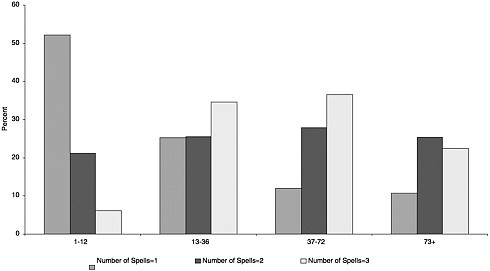
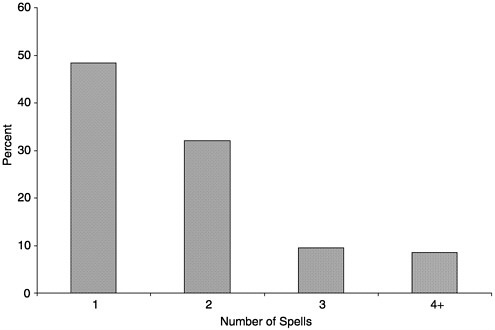
FIGURE 14–3 Distribution of number of spells (N).
Table 14–1 shows the characteristics of those women never on AFDC and those ever on in the 10-year period. We focus, in this table and all subsequent tables, on only a few fixed, unchanging background characteristics of individuals. These include education and race, but also employment status (whether worked at all during a year), annual earnings, weekly wages, and hourly wage rates, all measured only over periods off AFDC. The earnings and wages are measured only over periods off AFDC because they are intended to represent earning capability; including the AFDC periods would bias the measures in this sense, for earnings and wages are always lower on welfare than off.21 In traditional economic analyses, an individual’s potential hourly wage and weekly wage are usually considered to be the best indicators of labor market skill. Table 14–1 shows, as expected, that those ever on welfare have lower levels of education, are more likely black or Hispanic, and have lower mean earnings and wages than those never on welfare. Mean earnings and wages are, in addition, extremely low
|
21 |
Because earnings and wages are measured only annually, the measures are all computed only over those years when the woman was not on AFDC at all (because otherwise, some of the earnings and wages might have been earned while on AFDC). For each woman, her mean employment (whether worked at all in the year), annual earnings, weekly wages, and hourly earnings are computed for each year she is off AFDC, then averaged to obtain a mean for her non-AFDC periods. The figures in Table 14–1 represent the means of these figures, taken over all women in the sample. |
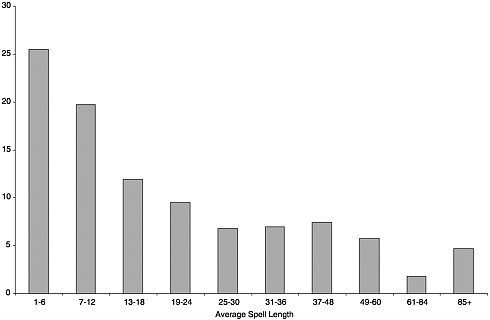
TABLE 14–1 Characteristics of Population, by Welfare Recipiency Status
in absolute terms for those women who have been on welfare in other periods. On the other hand, annual employment rates are moderately high (66 percent), on average—women work about two-thirds of the time that they are off AFDC.
Table 14–2 shows how these characteristics vary with T, N, and L. The variation in the characteristics with all three variables goes in the expected direction: Those with greater dependence, more spells, and longer average spell lengths tend to have lower levels of education, are more likely black (but not Hispanic), and have lower employment rates, earnings, and wages. A key additional question is whether there is any variation in characteristics by N and L, holding T fixed. We will consider this question using regression analysis.
LONG-TERMERS, SHORT-TERMERS, AND CYCLERS
Table 14–3 shows information from a classification of the population into the three groups discussed earlier—long-termers, short-termers, and cyclers. In all cases cyclers are defined as those with three or more spells. Any other cutoff would include either a much larger fraction of the sample in the cycler category or a much smaller fraction (see Figure 14–2 and Table 14-A2). Long-termers and short-termers are those with one or two spells, and with average spell lengths of half a year, a year, or a year and a half in length, depending on the definition.22
TABLE 14–2 Characteristics of Population, by Time on Welfare and Spell Characteristics
TABLE 14–3 Long-termer, Short-termer, and Cycler Distributions by Alternative Definitions (percent distribution)
|
|
Definition 1a |
Definition 2b |
Definition 3c |
|
Long-termer |
57.6 |
43.8 |
36.8 |
|
Short-termer |
23.0 |
36.8 |
43.8 |
|
Cycler |
19.5 |
19.5 |
19.5 |
|
Total |
100.0 |
100.0 |
100.0 |
|
NOTE: Numbers are rounded off, therefore totals will not add up to 100. aDefinition 1: a=2 spells, b=6 months. bDefinition 2: a=2 spells, b=12 months. cDefinition 3: a=2 spells, b=18 months. |
|||
These classifications result in approximately one-fifth of the ever-on population assigned as cyclers, and more than one-third assigned to long-term status (from one-third to as high as 57 percent). Short-termers end up with a representation slightly above or slightly below one-third. Thus the division is not quite equal across the three groups, but deviates from an equal division only through a somewhat greater-than-one-third long-termer group and smaller-than-one-third cycler group. The percent of the population classified as long-termers may seem high, even for the 1.5-year spell definition, where more than one-third of ever-on recipients are so classified.23 However, it should be noted that there have been no previous calculations of these distributions in the literature, and hence it is difficult to find comparisons in past work.24 Still, a smaller fraction of long-termers clearly could be obtained by requiring longer average spell lengths than 1.5 years, but at the cost of including as short-termers those with such long average spell lengths; and a 1.5-year spell does not seem to fit the notion of a short-termer. These issues illustrate the problems with constraining the classification to only three categories, and there is clearly some arbitrariness involved in where to draw the various lines.
Figure 14–5 shows the distribution of T for each of the three groups, using Definition 2.25 Short-termers are concentrated among the lowest values of total-time-on, as expected. However, the distributions for long-termers and cyclers are more mixed. Although long-termers are more commonly observed to have very
|
23 |
This implies that an even larger percentage of the point-in-time caseload would be long-termers. |
|
24 |
See Stevens (2000) and Ver Ploeg (this volume: Chapter 3) for exceptions. Using Maryland administrative data, Stevens estimated a smaller fraction of cyclers (about 20 percent) and a larger fraction of short-termers (50 percent), but about the same fraction of long-termers (30 percent). Using Wisconsin data, Ver Ploeg finds that cyclers constitute 14 percent of the caseload, while long-termers constitute 55 percent and short-termers constitute 31 percent. |
|
25 |
Exact figures are given in Table 14-A4 as are the figures for Definitions 1 and 3. |
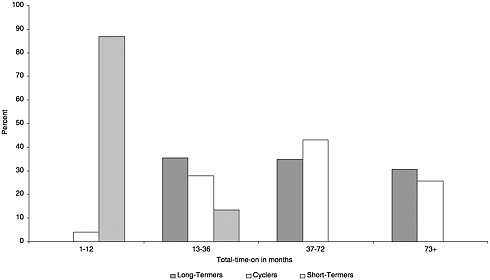
long total-time-on (e.g., 21 percent have more than 6 years of receipt in the 10-year period), cyclers are more likely to have total-time-on in the 3-to-5 year range. The differences are greater for Definition 3, that which defines long-termers as having longer average spells, where 37 percent have T greater than 6 years and 40 percent have T in the 3-to-5 year range (see Table 14-A4). However, despite these differences in the tails of the distribution, the median T is 56 months for cyclers and only 52 months for long-termers using Definition 2. The lower median T for long-termers reflects the fact that many long-termers by this type of definition have only a single spell that is below average in length and hence are on welfare for a shorter period in total than many cyclers, who, with three spells at minimum, commonly build up more total-time-on. However, for Definition 3, the median T for long-termers is 60 months, longer than that of cyclers. Still, the most appropriate conclusion from these calculations is that the typical experience of long-termers and cyclers in terms of total-time-on is not greatly different. Long-termers include more women with long total-time-on and more women with shorter total-time-on than cyclers, but on average they are not far different.26
Table 14–4 shows the characteristics of the three groups using Definition 2. As expected, short-termers are better off than long-termers and all cyclers in virtually every dimension. However, the table reveals that cyclers are also worse off than long-termers in nearly every labor market potential as well. Although the educational and racial distributions are approximately the same, and while employment rates off AFDC for long-termers are indeed somewhat lower than those for cyclers, cyclers have lower annual earnings, weekly earnings, and hourly wages than long-termers. This result is quite surprising in light of the conventional wisdom in the literature based on the model discussed earlier in the paper, which assumes that cyclers are somewhat better off than long-termers by virtue of having sufficiently greater earning power to leave the welfare rolls periodically to enter the labor market. A major conclusion of this chapter is the rejection of that model.
Because the cycler definition used here does not require T to be large (although, as noted, median T is about the same for cyclers and long-termers), the last two columns of Table 14–4 show the characteristics of cyclers with low T and high T.27 Even the “better off” women among the cyclers—those with lower values of T—are substantially worse off than long-termers in earnings and wages. Hourly wages of these cyclers are $4.81 compared to $5.66 for long-termers, with similarly sized differences for unconditional earnings, conditional earnings, and
|
26 |
See Table 14-A4. Cyclers have much shorter mean and median spell lengths than long-termers, as expected. |
|
27 |
The T cutoff was chosen to divide the cycler sample in half, that is, the approximate median T was used. |
TABLE 14–4 Characteristics of Long-termers, Short-termers, and Cyclers
|
|
Cyclersa |
||||
|
|
Long-termers |
Short-termers |
All |
Low T |
High T |
|
Education |
|||||
|
1979 |
9.6 |
9.9 |
9.8 |
10.1 |
9.5 |
|
1996 |
11.6 |
12.1 |
11.8 |
11.9 |
11.7 |
|
Race |
|||||
|
Non-Hispanic white |
0.51 |
0.70 |
0.54 |
0.65 |
0.44 |
|
Non-Hispanic black |
0.36 |
0.22 |
0.34 |
0.23 |
0.44 |
|
Hispanic |
0.12 |
0.08 |
0.12 |
0.13 |
0.12 |
|
Employment rate off AFDC |
0.59 |
0.75 |
0.65 |
0.70 |
0.60 |
|
Average annual earnings off AFDC (including zeroes) |
$4,976 |
$6,715 |
$3,649 |
$4,393 |
$2,539 |
|
Average annual earnings off AFDC (excluding zeroes) |
$5,574 |
$7,055 |
$4,427 |
$4,802 |
$3,522 |
|
Average weekly earnings (excluding zeroes) |
$192 |
$20 |
$157 |
$174 |
$125 |
|
Average hourly wage (workers only) |
$5.66 |
$5,80 |
$4.34 |
$4.81 |
$3.45 |
|
NOTES: Monetary figures are in real 1992 dollars. Definition 2 used. aLow T=55 months total-time-on or less; High T=56 months total-time-on or more. |
|||||
weekly wages. In addition, the “worse off” cyclers are even worse off compared to long-termers than was true on average, necessarily. These results do not provide any evidence that there is a significantly better off subgroup of cyclers that is distorting their average representation. Instead, it appears that cyclers, like long-termers or perhaps even more than long-termers, are generally a very disadvantaged group as a whole.
Using Definition 3 instead of Definition 2, which applies a more stringent definition of long-termer, results in worsened characteristics of long-termers and hence a smaller gap between that group and cyclers. For example, mean wages of long-termers under Definition 3 are $5.31 and weekly earnings are $182. An even more stringent definition that included only long-termers with extremely long spells would no doubt result in worsened outcomes. Nevertheless, the same is true of cyclers, as already illustrated in the last column of Table 14–4. Moreover, even though the minimum spell length for long-termers used in Definitions 1, 2, and 3 is not large, the median and mean spell lengths are still in the range of 2- to-4 years (see Table 14-A4); so long-termers by these definitions typically indeed have very long spells. For all these reasons, it does not appear that any reasonable
definition is likely to change the direction of differences in characteristics between long-termers and cyclers that has been found here.28
REGRESSION RESULTS
The final question of the chapter is whether characteristics of AFDC recipients vary significantly by N or L, holding T fixed—that is, those with high or low turnover differ in their characteristics if they have the same total-time-on—and whether the differences we have noted between short-termers, long-termers, and cyclers are statistically significant.
Table 14–5 shows the results. Each of the four key labor market characteristics—the employment rate, annual earnings, weekly wages, and the hourly wage, all measured only over periods off AFDC—is regressed, in the first case, on T and N, or on T and L (all three are not included in the same equation because they are definitionally related to each other) and, in the second case, on dummies for long-term and short-term status, with the cycler group omitted. The regressions involving T, N, and L show that T is a strong and statistically significant determinant of labor market characteristics, in the expected direction (higher T is associated with lower employment rates, earnings, and wages). However, the coefficients on N and L are mixed in their significance and their sign. Greater N and lower L are significantly correlated with higher employment rates off AFDC but lower wage rates. They are insignificantly related to earnings, which is the product of employment and wage rates, no doubt because the two operate in opposite directions and cancel out. The more appropriate indicators of earnings potential are the wage rate effects, and here the results change the impression taken from Table 14–2 that those with longer spells have lower wage rates; controlling for total-time-on, they have higher wage rates, an unexpected finding.
The regressions containing long-termer and short-termer dummies show that short-termers are always significantly better off than either long-termers or cyclers, as expected, but that long-termers and cyclers are not always statistically different and not always in the same direction. Again, long-termers appear to have slightly lower employment rates than cyclers (about 6 percentage points), insignificantly different earnings, but higher weekly and hourly wage rates. In fact, these results directly reflect the means shown in Table 14–4, but the regressions indicate statistical significance levels.
These findings show that the value of an individual’s total-time-on, and whether she is or not a short-termer, are the most consistent predictors of labor market potential. The degree of turnover and whether a woman is a cycler or a long-termer are less consistently correlated with labor market performance.
TABLE 14–5 Regressions of Labor Market Characteristics on Welfare Participation Indicators
|
|
Employment Ratea |
Annual Earnings (including zeroes) |
Weekly Wages |
Hourly Wages |
||||||||
|
T |
-.348* (.056) |
-.173* (.083) |
— |
-48.0* (8.4) |
-53.1* (12.6) |
— |
-.578* (.221) |
-1.35* (.32) |
— |
-.012* (.006) |
-.038* (.009) |
— |
|
N |
2.94* (1.45) |
— |
— |
-169.7 (219.5) |
— |
— |
-11.9 (5.14) |
— |
— |
-.347* (.141) |
— |
— |
|
L |
— |
-.247* (.119) |
— |
— |
5.2 (18.0) |
— |
— |
1.13* (.47) |
— |
— |
.039* (.013) |
— |
|
LT |
— |
— |
-6.16 (4.37) |
— |
— |
768.3 (656.6) |
— |
— |
35.6* (15.5) |
— |
— |
1.24* (.43) |
|
ST |
— |
— |
9.36* (4.41) |
— |
— |
3061.* (662) |
— |
— |
51.8* (15.2) |
— |
— |
1.38* (.41) |
|
NOTES: All labor market characteristics measured over periods not on AFDC. n=514. Standard errors in parentheses. *: significant at the 10-percent level. T=total-time-on; N=number of spells; L=average spell length; LT=dummy for long-termer, Definition 2; ST=dummy for short-termer, Definition 2. aAll coefficients multiplied by 100. |
||||||||||||
Moreover, when they are, they indicate that cyclers are worse off than long-termers in terms of earnings potential, and no better off than long-termers in terms of overall earnings.
SUMMARY AND CONCLUSIONS
This chapter has explored measures of heterogeneity of the AFDC caseload in the 1980s and early 1990s based on patterns of AFDC participation and has investigated which of those measures are predictive of labor market potential and a few other sociodemographic characteristics. The analysis shows that the single most consistent predictor of those characteristics is the total amount of time a woman has been on welfare. However, whether that time arises from a larger number of shorter spells, or a smaller number of longer spells, is less consistently important; that is, neither turnover per se nor the length of individual spells of welfare receipt is always related to labor market characteristics holding constant the total time the individual has been on welfare. Relatedly, the analysis shows that classifying recipients into two groups is a useful predictor of labor market potential: short-termers who participate in welfare only occasionally and for short periods, and all others. However, among the latter group, whether an individual is a cycler who moves on and off the rolls frequently or a long-termer who has long, uninterrupted periods of welfare receipt, is not a consistent predictor of labor market potential. Further, when it is, it appears that cyclers have lower potential than long-termers.
The finding that mobility per se matters less than expected, and that recipients with high turnover and those with low turnover (but with the same total-time-on) either look the same or differ in unexpected ways, runs contrary to the conventional model in which mobility is taken as a sign of higher-than-average labor market skill and hence earnings potential. It suggests that there must be some other reason for high rates of mobility, perhaps related to more intrinsic, possibly noneconomic, sources of instability in individuals’ lives, or in administrative practices that cause churning, or related to some other factor. More investigation into this question would be a fruitful area of future research.
For welfare reform studies, the implication of the analysis is that heterogeneity is important but that its most important measure is the total time a recipient has been on welfare. This suggests that studies which estimate the impact of welfare reform should do so separately for groups with different amounts of total-time-on, and should break out short-term recipients from others. Leaver studies are one type of welfare reform research that could benefit from a separation of leaver outcomes by such characteristics.
REFERENCES
Acs, G., and P.Loprest 2001 Initial Synthesis Report of the Findings from ASPE’s “Leavers” Grants. Washington, DC: Urban Institute.
Brauner, S., and P.Loprest 1999 Where Are They Now? What States’ Studies of Welfare Leavers Tell Us. Working Paper A-32. Washington, DC: Urban Institute.
Cancian, M., R.Haveman, T.Kaplan, and B.Wolfe 1999 Post-Exit Earnings and Benefit Receipt Among Those Who Left AFDC in Wisconsin. Special Report #75. Madison: Institute for Research on Poverty, University of Wisconsin.
Cancian, M., R.Haveman, D.Meyer, and B.Wolfe 2000 Before and After TANF: The Economic Well-Being of Women Leaving Welfare. Special Report #77. Madison: Institute for Research on Poverty, University of Wisconsin.
Danziger, S. 2000 Approaching the Limit: Early Lessons from Welfare Reform. Unpublished paper presented at the conference on Rural Dimensions of Welfare Reform, Joint Center on Poverty Research, Washington, DC, May 4–5.
Ellwood, D. 1986 Targeting the “Would-Be” Long-Term Recipient: Who Should Be Served? Princeton, NJ: Mathematica Policy Research.
Ellwood, D., and M.J.Bane 1994 Understanding welfare dynamics. In Welfare Realities: From Rhetoric to Reform, M.J. Bane and D.Ellwood, eds. Cambridge, MA: Harvard University Press.
Gottschalk, P., and R.Moffitt 1994a Welfare dependence: Concepts, measures, and trends. American Economic Review 84:38– 42.
1994b The growth of earnings instability in the U.S. labor market. Brookings Papers on Economic Activity 2:217–254.
Loprest, P., and S.Zedlewski 1999 Current and Former Welfare Recipients: How Do They Differ? DP 99–17. Washington, DC: Urban Institute.
Moffitt, R., and J.Roff 2000 The Diversity of Welfare Leavers. Baltimore: Johns Hopkins University.
Moffitt, R., and D.Stevens 2001 Changing Caseloads: Macro and Micro Composition. Economic Policy Review 7:37–51.
Oellerich, D. 2001 Welfare Reform: Program Entrants and Recipients. Unpublished paper. Washington, DC: U.S. Department of Health and Human Services.
Stevens, D. 2000 Welfare, Employment and Earnings: Memorandum prepared for the Panel on Data and Methods for Measuring the Effects of Changes in Social Programs, Committee on National Statistics. University of Baltimore, MD.
U.S. Department of Health and Human Services 2000 Indicators of Welfare Dependence: Annual Report to Congress. Washington, DC: U.S. Department of Health and Human Services.
Zedlewski, S., and D.Alderson 2001 Do Families on Welfare in the Post-TANF Era Differ from Their Pre-TANF Counterparts? WP 01–03. Washington, DC: Urban Institute.
APPENDIX 14-A
AUXILIARY TABLES
TABLE 14-A1 Distribution of Total-Time-On in Months (T) (percent distribution)
TABLE 14-A2 Distribution of Number of Spells (N) (percent distribution)
|
|
All |
Ever On |
|
0 |
81.4 |
– |
|
1 |
9.0 |
48.4 |
|
2 |
6.0 |
32.0 |
|
3 |
1.8 |
9.5 |
|
4 |
1.2 |
6.4 |
|
5 |
0.4 |
2.1 |
|
6 |
0.1 |
0.1 |
|
7 |
0.1 |
0.0 |
|
8+ |
0.3 |
0.0 |
|
Mean |
0.4 |
1.9 |
|
Median |
0 |
2.0 |
TABLE 14-A3 Distribution of Average Spell Lengths, in Months (L) (percent distribution)
|
|
No. of Spells |
|||
|
|
All Ever On |
1 |
2 |
3 |
|
1–6 |
25.5 |
32.1 |
21.2 |
12.2 |
|
7–12 |
19.7 |
19.7 |
13.9 |
28.6 |
|
13–18 |
11.9 |
7.2 |
11.5 |
16.3 |
|
19–24 |
9.5 |
9.2 |
5.5 |
20.4 |
|
25–30 |
6.8 |
2.4 |
11.5 |
14.3 |
|
31–36 |
7.0 |
2.4 |
10.9 |
5.6 |
|
37–48 |
7.4 |
5.6 |
13.3 |
5.3 |
|
49–60 |
5.8 |
4.0 |
12.1 |
0 |
|
61–84 |
1.8 |
3.6 |
0 |
0 |
|
85+ |
4.7 |
9.6 |
0 |
0 |
|
Mean |
23.8 |
27.2 |
24.1 |
16.8 |
|
Median |
14.9 |
12.0 |
23.5 |
15.7 |
TABLE 14-A4 Distribution of Total-Time-On and Spell Lengths Among Long-termers, Short-termers, and Cyclers
|
|
Definition 1 |
Definition 2 |
Definition 3 |
|
|||
|
Long-termer |
Short-termer |
Long-termer |
Short-termer |
Long-termer |
Short-termer |
Cycler |
|
|
Total-Time-On: |
|
||||||
|
1–6 |
– |
80.5 |
– |
50.3 |
– |
42.2 |
1.0 |
|
7–12 |
16.6 |
17.0 |
– |
36.5 |
– |
36.7 |
3.0 |
|
13–18 |
9.8 |
2.5 |
8.0 |
7.4 |
– |
14.2 |
5.0 |
|
19–24 |
10.8 |
– |
10.2 |
4.8 |
12.1 |
4.0 |
9.0 |
|
25–36 |
13.9 |
– |
17.3 |
1.1 |
11.6 |
8.0 |
14.0 |
|
37–48 |
7.8 |
– |
10.2 |
– |
11.6 |
– |
11.0 |
|
49–60 |
9.0 |
– |
12.9 |
– |
15.3 |
– |
13.0 |
|
61–72 |
8.1 |
– |
11.7 |
– |
12.7 |
– |
19.0 |
|
73–84 |
3.7 |
– |
4.9 |
– |
5.8 |
– |
10.7 |
|
85–96 |
6.4 |
– |
8.4 |
– |
10.1 |
– |
7.0 |
|
97+ |
13.1 |
– |
17.3 |
– |
20.6 |
– |
8.0 |
|
Mean |
47.9 |
4.8 |
58.8 |
8.0 |
65.5 |
10.5 |
54.5 |
|
Median |
34.2 |
4.0 |
52.0 |
6.0 |
60.0 |
8.0 |
56.5 |
|
Spell Length: |
|
||||||
|
Mean |
34.9 |
3.5 |
42.7 |
6.1 |
47.9 |
7.6 |
14.9 |
|
Median |
26.5 |
3.5 |
35.0 |
5.5 |
38.0 |
6.0 |
13.5 |


