
APPENDIX C
ANALYSIS OF THE CMAQ DATABASE
Harry S. Cohen, Ellicott City, Maryland
The Federal Highway Administration (FHWA) maintains a database on all projects funded under the Congestion Mitigation and Air Quality (CMAQ) program. The database provides information on type of project, location, funding level, and estimated emission reductions. Currently, the database covers the first 8 years of the CMAQ program (FY 1992–1999).
The following are provided in this appendix:
-
A description of the database,
-
A summary of what the data show about the types of projects funded and emission reductions,
-
An assessment of the usefulness of the database for this study, and
-
Recommendations for improvements to the database.
The FHWA CMAQ database for each fiscal year provides the following information on individual projects in each state:
-
A brief text description of the project;
-
Project type;
-
Amount obligated for the project in the fiscal year; and
-
Estimated emission reductions in kilograms per day for volatile organic compounds (VOCs), nitrogen oxides (NOx), carbon monoxide (CO), and particulates (PM10).
Text descriptions, project type, and amount obligated are provided for all projects in the database. As discussed in more detail below, estimates of emission reductions are provided for many, but not all, projects.
The text descriptions in the database usually provide an indication of where in the state the project was located and the type of
work involved. The locations may be specified in terms of a route designation, city, or county. Examples of these descriptions, selected at random from the database, are provided in the accompanying text box.
|
Examples of Project Descriptions from the CMAQ Database Employee commute options—Bridgeport Land use ordinance demo Hawthorn Bridge—sidewalk improvement (CONSTR) Construction funding for park-and-ride lot at MD108/MD32 Hillsborough County video surveillance system Additional design cost for grade-separated interchange Roadway/geometric/signal improvements City of Wilmington signals US-17N in Myrtle Beach, closed-loop signal system Purchase of 40 large passenger buses SORTA FY 1995 Clean Air Fare Subsidy |
With regard to project type classifications, the program guidance document (FHWA 1992, 12–13)1 asks states to classify CMAQ projects as follows:
-
Transit: construction, equipment, or operating expenses for new and improved services and parking for transit services.
-
Other shared-ride: vanpool and carpool programs, parking for shared-ride services.
-
Highway/road (traffic flow):2 traffic management and control services, signalization projects, intersection improvements, and construction or dedication of high-occupancy vehicle (HOV) lanes.
-
Demand management: employer trip reduction programs, transportation management plans, flexible work schedule programs, vehicle restriction programs.
-
Pedestrian/bike: trails, storage facilities, promotional activities.
-
Inspection and maintenance and other transportation control measures (not covered by the above categories).
The CMAQ project categories listed above are broad. For example, “traffic flow” includes both the construction of HOV lanes and the retiming of traffic signals. Similarly, “transit” includes both the purchase of alternative-fuel buses and the addition of parking spaces at a transit station.
States that have no nonattainment or maintenance areas are allowed to use their CMAQ funds for any project eligible for federal funding under the Surface Transportation Program (STP) or CMAQ. Also, other states receiving the minimum apportionment may use a portion of their CMAQ funds for any project eligible for federal funding under the Surface Transportation or CMAQ programs under certain circumstances.3 In the CMAQ database, these projects are designated as “STP/CMAQ.”
States are required to provide the amount of CMAQ funds obligated for each project (or project category where groups of projects are analyzed together) for the year, disaggregated by the categories of projects listed above. However, it appears that obligations in the CMAQ database are not reconciled with the CMAQ program obligations from the Federal Management Information System (FMIS). For example, according to FMIS, total obligations for CMAQ in FY 1997 were $807 million. Total FY 1997 obligations for all projects in the CMAQ database were $773 million. While the difference is small
(less than 5 percent in FY 1997), it would nonetheless be desirable to avoid publishing two different estimates of CMAQ obligations for a fiscal year.
The committee investigated the desirability of using the FMIS database to obtain information about CMAQ projects, particularly programmatic detail. Limitations of that database, however, precluded this option.4
CLASSIFICATION OF PROJECTS
The project classification scheme used in the CMAQ database was expanded to examine the composition of the CMAQ program in more detail and to link program expenditures with specific types of projects for which data on cost-effectiveness are available in the literature. The categories and subcategories are as follows:
-
Transit
-
Alternative-fuel vehicles
-
Conventional fuel transit vehicles
-
Park-and-ride facilities
-
Station and bus stop improvements
-
Transit service expansion
-
Other transit improvements
-
-
Traffic flow
-
Congestion and incident management
-
HOV lanes
-
Traffic signal improvements
-
Traveler information
-
Turn lanes and other intersection improvements
-
Other traffic flow improvements
-
-
Shared ride
-
Park-and-ride facilities
-
Other shared ride
-
-
Pedestrian/bicycle (no subcategories)
-
Demand management
-
Employee trip reduction
-
Other demand management
-
-
STP/CMAQ (no subcategories)
-
Other (and unclassifiable)
-
Alternative-fuel vehicles
-
Paving and sweeping to reduce PM
-
Rail freight
-
Vehicle inspection and maintenance
-
All other improvements
-
The project descriptions in the CMAQ database were used to assign projects to the above subcategories. Also, in cases where projects appear to have been misclassified, they were switched from one major category to another.5
In many cases, it was difficult to determine appropriate subcategories on the basis of project descriptions. For example, many of the project descriptions under “transit” were just the name of a transit agency or line. These were classified as “other transit improvements.” Similarly, many of the project descriptions under “traffic flow” were just the name of an intersection or highway. These were classified as “turn lanes and other intersection improvements,” even though it was possible that only traffic signal improvements were made at these intersections.
COMPOSITION OF THE CMAQ PROGRAM
Using the categories and subcategories listed above, Figure C-1 and Table C-1 show the composition of the CMAQ program for the 8-year period from FY 1992 to FY 1999.
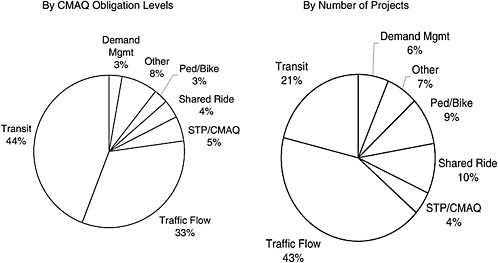
TABLE C-1 CMAQ Obligations by Type of Project (FY 1992–1999)
|
Project Category and Subcategory |
FY 1992–1999 Obligations |
|
|
Millions of Dollars |
Percent |
|
|
Transit |
|
|
|
Alternative-fuel vehicles |
193 |
3.1 |
|
Conventional-fuel transit vehicles |
800 |
12.7 |
|
Park-and-ride facilities |
91 |
1.5 |
|
Station and bus stop improvements |
302 |
4.8 |
|
Transit service expansions |
456 |
7.2 |
|
Other transit improvements |
937 |
14.9 |
|
Subtotal |
2,780 |
44.1 |
|
Traffic flow |
|
|
|
Congestion and incident management |
508 |
8.1 |
|
HOV lanes |
291 |
4.6 |
|
Traffic signal improvements |
536 |
8.5 |
|
Traveler information |
84 |
1.3 |
|
Turn lanes and other intersection improvements |
295 |
4.7 |
|
Other traffic flow improvements |
371 |
5.9 |
|
Subtotal |
2,086 |
33.1 |
|
Shared ride |
|
|
|
Park-and-ride facilities |
85 |
1.4 |
|
Other shared ride |
152 |
2.4 |
|
Subtotal |
238 |
3.8 |
|
Pedestrian and bicycle |
199 |
3.2 |
|
Demand management |
|
|
|
Employee trip reduction |
51 |
0.8 |
|
Other demand management |
133 |
2.1 |
|
Subtotal |
184 |
2.9 |
|
STP/CMAQ |
338 |
5.4 |
|
Other (and unclassifiable) |
|
|
|
Alternative-fuel vehicles |
40 |
0.6 |
|
Paving and sweeping to reduce PM |
55 |
0.9 |
|
Rail freight |
23 |
0.4 |
|
Vehicle inspection and maintenance |
264 |
4.2 |
|
All other improvements |
94 |
1.5 |
|
Subtotal |
476 |
7.6 |
|
Grand total |
6,300 |
100.0 |
Together, transit and traffic flow improvement projects accounted for slightly more than three-fourths (77 percent) of CMAQ obligations during the first 8 years of the program. These types of projects provide benefits in addition to emission reductions, such as time savings to highway and transit users. Types of projects for which most of the benefits are emission reductions or energy savings—alternative-fuel vehicles, paving and sweeping to reduce PM, and vehicle inspection and maintenance—account for only about 8 percent of CMAQ obligations.
Figure C-1 also shows the number of projects funded between FY 1992 and FY 1999 by project type. Slightly more than two-fifths (43 percent) of the projects were traffic flow improvements, but only one-fifth (21 percent) of the projects were transit related, compared with 44 percent when project value is the analysis criterion. The differences arise because the amount of obligations per project is not the same for each category. For example, in comparison with other CMAQ project categories, transit projects have relatively higher dollar obligations per project. Hence, transit represents a larger share of the CMAQ program when the program is analyzed by value of projects than when analyzed by numbers of projects.
Trends over Time
Table C-2 shows the composition of the CMAQ program by type of project for each fiscal year. This information is provided in graphical form in Figures C-2 through C-8. As suggested by the following observations, the composition of the CMAQ program has been changing over time.
Transit Projects (Figure C-2)
CMAQ obligations for all transit projects range from 34 percent in FY 1997 and FY 1998 to more than 50 percent in FY 1995 and FY 1999. These variations are due to the effects of a few large projects. In FY 1995, $76 million was obligated for the construction of a busway from downtown Pittsburgh to the airport and another $76 million for the purchase of rail cars for the Southeastern Pennsylvania Transportation Authority’s Market-Frankfort line. In FY 1999, $124 mil-
TABLE C-2 CMAQ Obligations by Type of Project for Each Fiscal Year
|
Project Category and Subcategory |
Percentage for Fiscal Year |
Total |
|||||||
|
FY 1992 |
FY 1993 |
FY 1994 |
FY 1995 |
FY 1996 |
FY 1997 |
FY 1998 |
FY 1999 |
||
|
Transit |
|
|
|
|
|
|
|
|
|
|
Alternative-fuel vehicles |
0.3 |
6.9 |
2.9 |
3.5 |
2.6 |
4.3 |
1.5 |
1.9 |
3.1 |
|
Conventional-fuel transit vehicles |
17.8 |
11.1 |
17.1 |
15.5 |
9.5 |
9.3 |
8.7 |
14.2 |
12.7 |
|
Park-and-ride facilities |
1.4 |
2.5 |
1.5 |
1.2 |
1.3 |
0.8 |
0.7 |
2.1 |
1.5 |
|
Station and bus stop improvements |
9.4 |
3.6 |
2.3 |
4.6 |
5.4 |
4.5 |
5.2 |
5.5 |
4.8 |
|
Transit service expansions |
0.0 |
6.4 |
4.3 |
13.3 |
6.8 |
2.2 |
1.8 |
13.5 |
7.2 |
|
Other transit improvements |
20.9 |
18.1 |
12.6 |
13.1 |
14.2 |
13.1 |
15.9 |
15.4 |
14.9 |
|
Subtotal |
49.8 |
48.6 |
40.6 |
51.2 |
39.8 |
34.1 |
33.8 |
52.6 |
44.1 |
|
Traffic flow |
|
|
|
|
|
|
|
|
|
|
Congestion and incident management |
1.9 |
5.3 |
10.8 |
9.9 |
7.7 |
8.0 |
4.6 |
10.5 |
8.1 |
|
HOV lanes |
23.5 |
0.8 |
0.8 |
2.4 |
8.7 |
7.8 |
1.8 |
1.8 |
4.6 |
|
Traffic signal improvements |
5.7 |
7.4 |
9.6 |
8.5 |
12.0 |
10.7 |
8.8 |
4.7 |
8.5 |
|
Traveler information |
0.8 |
6.4 |
1.8 |
0.7 |
0.2 |
0.6 |
1.1 |
0.4 |
1.3 |
|
Turn lanes and other intersection improvements |
4.0 |
2.9 |
2.6 |
3.2 |
7.0 |
11.4 |
3.6 |
2.8 |
4.7 |
|
Other traffic flow improvements |
0.1 |
4.5 |
9.8 |
4.6 |
2.6 |
4.8 |
15.0 |
4.9 |
5.9 |
|
Subtotal |
36.0 |
27.2 |
35.3 |
29.4 |
38.2 |
43.3 |
35.0 |
25.2 |
33.1 |
|
Shared ride |
|
|
|
|
|
|
|
|
|
|
Park-and-ride facilities |
0.8 |
1.6 |
1.1 |
3.0 |
1.2 |
1.3 |
1.0 |
0.5 |
1.4 |
|
Other shared ride |
2.1 |
4.0 |
3.1 |
2.0 |
1.6 |
1.7 |
2.7 |
2.5 |
2.4 |
|
Subtotal |
2.9 |
5.6 |
4.2 |
5.0 |
2.8 |
3.1 |
3.7 |
2.9 |
3.8 |
|
Pedestrian and bicycle |
3.0 |
3.0 |
2.2 |
1.5 |
4.0 |
4.9 |
4.4 |
2.7 |
3.2 |
|
Demand management |
|
|
|
|
|
|
|
|
|
|
Employee trip reduction |
0.0 |
0.2 |
1.1 |
0.8 |
1.8 |
0.2 |
1.2 |
0.6 |
0.8 |
|
Other demand management |
1.2 |
1.7 |
3.1 |
1.9 |
2.5 |
2.3 |
2.4 |
1.5 |
2.1 |
|
Subtotal |
1.2 |
2.0 |
4.3 |
2.7 |
4.2 |
2.4 |
3.5 |
2.1 |
2.9 |
|
STP/CMAQ |
6.6 |
6.8 |
6.3 |
3.5 |
5.2 |
6.1 |
7.9 |
3.3 |
5.4 |
|
Other (and unclassifiable) |
|
|
|
|
|
|
|
|
|
|
Alternative-fuel vehicles |
0.0 |
0.5 |
0.8 |
1.5 |
0.0 |
1.3 |
0.6 |
0.0 |
0.6 |
|
Paving and sweeping to reduce PM |
0.3 |
0.7 |
2.5 |
0.8 |
0.1 |
0.4 |
1.1 |
0.9 |
0.9 |
|
Rail freight |
0.0 |
0.5 |
0.2 |
0.9 |
0.0 |
0.8 |
0.3 |
0.1 |
0.4 |
|
Vehicle inspection and maintenance |
0.1 |
0.1 |
2.5 |
2.6 |
2.8 |
2.3 |
8.9 |
9.9 |
4.2 |
|
All other improvements |
0.1 |
4.9 |
1.1 |
0.9 |
2.9 |
1.2 |
0.8 |
0.2 |
1.5 |
|
Subtotal |
0.5 |
6.8 |
7.1 |
6.7 |
5.9 |
6.0 |
11.7 |
11.1 |
7.6 |
|
Grand total |
100.0 |
100.0 |
100.0 |
100.0 |
100.0 |
100.0 |
100.0 |
100.0 |
100.0 |
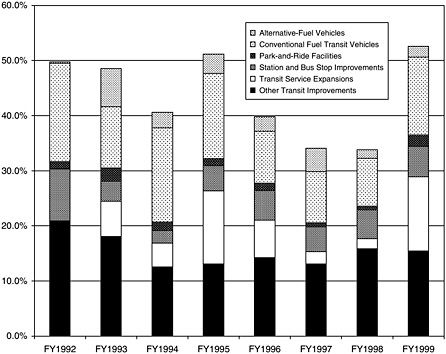
lion was obligated for the Red Line in Los Angeles and $46 million for advanced automatic train control from Daly City to downtown Oakland.
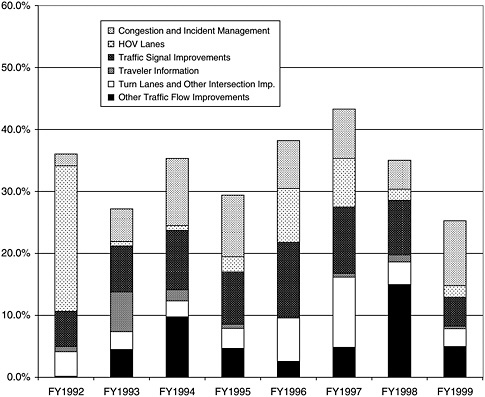
Traffic Flow Projects (Figure C-3)
-
CMAQ obligations for all traffic flow projects exhibit no clear trend. They range from 25 percent of total CMAQ obligations in FY 1999 to 43 percent in FY 1997.
-
HOV lanes accounted for nearly 24 percent of all CMAQ obligations in FY 1992, when $74 million was obligated to California for this purpose. Over the next 7 years, HOV lanes accounted for less than 10 percent of all CMAQ obligations. In FY 1998 and FY 1999, they accounted for only about 2 percent of all CMAQ obligations.
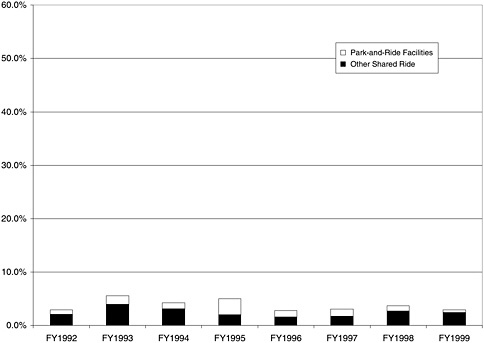
Shared Ride Projects (Figure C-4)
Obligations for shared ride projects have ranged between about 3 and 6 percent of all CMAQ obligations from FY 1992 to FY 1999. During the last 4 years, obligations were near the low end of the range.
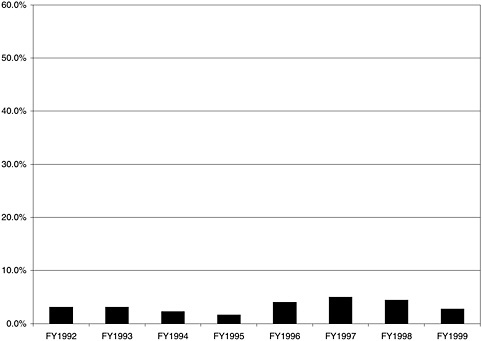
Pedestrian and Bicycle Projects (Figure C-5)
CMAQ obligations for pedestrian and bicycle projects range from 1.5 percent (in FY 1995) to 5 percent (in FY 1997), with no clear trend over time.
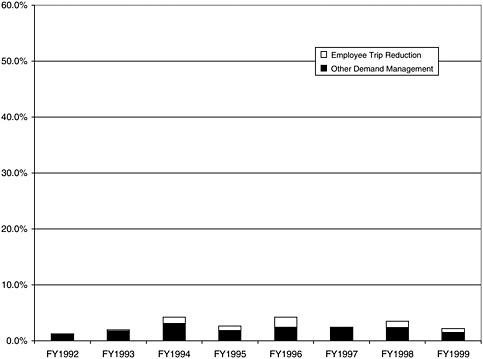
Demand Management Projects (Figure C-6)
Demand management projects have accounted for between 2 and 4 percent of total CMAQ obligations since FY 1993.
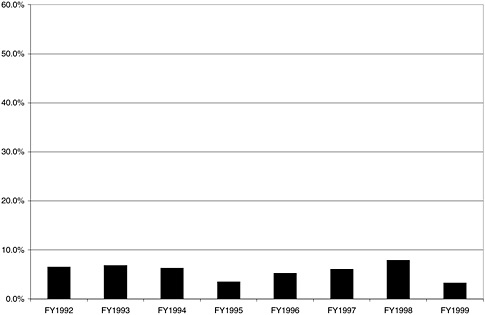
STP/CMAQ Projects (Figure C-7)
STP/CMAQ projects have accounted for between 3 and 8 percent of total CMAQ obligations, with no clear trend over time.
Other Projects (Figure C-8)
Obligations for vehicle inspection and maintenance projects have been increasing over time. In FY 1992 and FY 1993, these projects accounted for just 0.1 percent of all CMAQ obligations. In the next 4 years, they accounted for 2 to 3 percent of total CMAQ obligations.
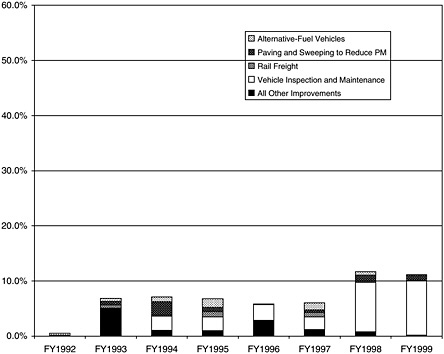
In FY 1998 and FY 1999, they jumped to almost 10 percent of total CMAQ obligations.
Trends by DOT Region6
Table C-3 and Figures C-10 to C-16 show the composition of the CMAQ program for each of the 10 U.S. Department of Transportation regions. These data indicate that there are large differences across regions in how CMAQ funds are spent.
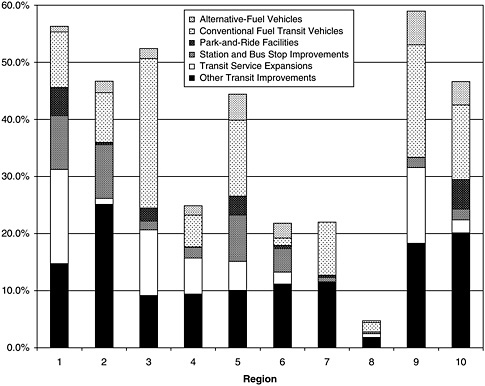
Transit Projects (Figure C-10)
-
Transit projects account for more than 44 percent of all CMAQ obligations in Regions 1, 2, 3, 5, 9, and 10. In the other four regions, transit projects account for less than 25 percent of all CMAQ obligations.
-
Projects involving conventional fuel transit vehicles range from less than 2 percent of total CMAQ obligations in Regions 6 and 8 to 26 percent of total CMAQ obligations in Region 3.
-
Transit park-and-ride projects range from less than 0.1 percent of total CMAQ obligations in Regions 4, 8, and 9 to 5 percent in Regions 1 and 10.
-
Transit station and bus stop improvements range from less than 1 percent of all CMAQ obligations in Regions 7 and 8 to 9 percent in Regions 1 and 2.
-
Transit service expansions range from less than 3 percent of total CMAQ obligations in Regions 2, 6, 7, 8, and 10 to 16 percent in Region 1.
Traffic Flow Projects (Figure C-11)
-
Traffic flow projects range from about 10 percent of total CMAQ obligations in Region 10 and 19 percent in Region 1 to 52 percent in Region 4 and 57 percent in Region 6.
|
6 |
Figure C-9 is a map showing the states in each of the 10 U.S. Department of Transportation regions. |
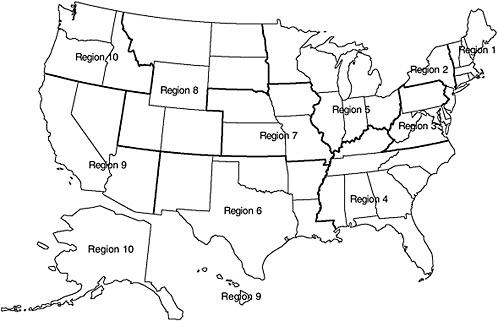
TABLE C-3 CMAQ Obligations by Type of Project for Each Region (FY 1992–1999)
|
Project Category and Subcategory |
Percentage for Region |
Total |
|||||||||
|
1 |
2 |
3 |
4 |
5 |
6 |
7 |
8 |
9 |
10 |
||
|
Transit |
|
|
|
|
|
|
|
|
|
|
|
|
Alternative-fuel vehicles |
1.0 |
2.0 |
1.7 |
1.6 |
4.6 |
2.6 |
0.0 |
0.3 |
5.9 |
4.1 |
3.1 |
|
Conventional-fuel transit vehicles |
9.7 |
8.7 |
26.2 |
5.6 |
13.3 |
1.3 |
9.3 |
1.6 |
19.7 |
13.1 |
12.7 |
|
Park-and-ride facilities |
4.9 |
0.4 |
2.3 |
0.0 |
3.4 |
0.5 |
0.4 |
0.0 |
0.0 |
5.2 |
1.5 |
|
Station and bus stop improvements |
9.5 |
9.4 |
1.6 |
1.9 |
8.1 |
4.1 |
0.8 |
0.4 |
1.8 |
1.9 |
4.8 |
|
Transit service expansions |
16.5 |
1.1 |
11.4 |
6.3 |
5.1 |
2.1 |
0.0 |
0.6 |
13.3 |
2.3 |
7.2 |
|
Other transit improvements |
14.7 |
25.1 |
9.2 |
9.4 |
10.0 |
11.2 |
11.6 |
1.8 |
18.3 |
20.1 |
14.9 |
|
Subtotal |
56.3 |
46.7 |
52.4 |
24.8 |
44.4 |
21.8 |
22.0 |
4.7 |
59.0 |
46.6 |
44.1 |
|
Traffic flow |
|
|
|
|
|
|
|
|
|
|
|
|
Congestion and incident management |
3.1 |
5.9 |
4.8 |
13.7 |
7.9 |
22.8 |
9.0 |
4.6 |
6.4 |
0.8 |
8.1 |
|
HOV lanes |
3.0 |
0.5 |
0.5 |
1.4 |
0.4 |
3.9 |
0.0 |
3.6 |
16.4 |
1.2 |
4.6 |
|
Traffic signal improvements |
7.2 |
5.3 |
8.3 |
14.5 |
12.4 |
8.3 |
7.0 |
13.4 |
6.8 |
4.1 |
8.5 |
|
Traveler information |
0.4 |
3.7 |
0.6 |
3.4 |
0.3 |
2.0 |
0.0 |
0.0 |
0.2 |
0.0 |
1.3 |
|
Turn lanes and other intersection improvements |
3.5 |
5.3 |
4.4 |
12.5 |
4.5 |
8.0 |
7.4 |
3.5 |
0.8 |
0.4 |
4.7 |
|
Other traffic flow improvements |
1.8 |
4.3 |
13.4 |
6.8 |
8.3 |
12.0 |
3.6 |
1.1 |
1.7 |
3.2 |
5.9 |
|
Subtotal |
19.0 |
25.1 |
32.0 |
52.5 |
33.8 |
57.1 |
27.0 |
26.1 |
32.4 |
9.7 |
33.1 |
|
Shared ride |
|
|
|
|
|
|
|
|
|
|
|
|
Park-and-ride facilities |
2.0 |
0.9 |
5.4 |
0.2 |
0.6 |
1.8 |
0.5 |
2.0 |
0.3 |
1.2 |
1.4 |
|
Other shared ride |
4.4 |
1.5 |
1.8 |
3.7 |
1.9 |
2.1 |
1.7 |
6.2 |
2.1 |
2.4 |
2.4 |
|
Subtotal |
6.4 |
2.4 |
7.1 |
3.9 |
2.5 |
3.9 |
2.2 |
8.3 |
2.4 |
3.6 |
3.8 |
|
Pedestrian and bicycle |
1.7 |
4.6 |
0.6 |
2.7 |
3.3 |
2.1 |
0.1 |
4.6 |
2.3 |
18.7 |
3.2 |
|
Demand management |
|||||||||||
|
Employee trip reduction |
4.3 |
0.9 |
0.6 |
0.1 |
0.1 |
0.6 |
0.2 |
0.1 |
0.6 |
0.5 |
0.8 |
|
Other demand management |
2.4 |
4.3 |
0.9 |
3.8 |
1.6 |
1.4 |
1.0 |
1.3 |
0.7 |
4.3 |
2.1 |
|
Subtotal |
6.7 |
5.2 |
1.6 |
3.9 |
1.7 |
2.0 |
1.2 |
1.5 |
1.3 |
4.8 |
2.9 |
|
STP/CMAQ |
2.6 |
2.5 |
2.7 |
8.6 |
0.0 |
10.2 |
29.5 |
48.2 |
0.9 |
2.5 |
5.4 |
|
Other (and unclassifiable) |
|||||||||||
|
Alternative-fuel vehicles |
1.1 |
1.1 |
0.5 |
0.4 |
0.2 |
2.1 |
0.0 |
0.0 |
0.1 |
0.3 |
0.6 |
|
Paving and sweeping to reduce PM |
0.0 |
0.0 |
0.0 |
0.0 |
0.0 |
0.2 |
10.3 |
4.5 |
0.6 |
8.8 |
0.9 |
|
Rail freight |
1.2 |
1.5 |
0.0 |
0.0 |
0.1 |
0.0 |
0.0 |
0.0 |
0.0 |
0.0 |
0.4 |
|
Vehicle inspection and maintenance |
3.2 |
10.4 |
1.4 |
1.6 |
11.8 |
0.1 |
0.6 |
0.6 |
0.0 |
2.0 |
4.2 |
|
All other improvements |
1.8 |
0.6 |
1.8 |
1.6 |
2.2 |
0.4 |
7.1 |
1.5 |
0.9 |
2.9 |
1.5 |
|
Subtotal |
7.3 |
13.6 |
3.7 |
3.6 |
14.3 |
2.9 |
18.0 |
6.6 |
1.7 |
14.1 |
7.6 |
|
Grand total |
100.0 |
100.0 |
100.0 |
100.0 |
100.0 |
100.0 |
100.0 |
100.0 |
100.0 |
100.0 |
100.0 |
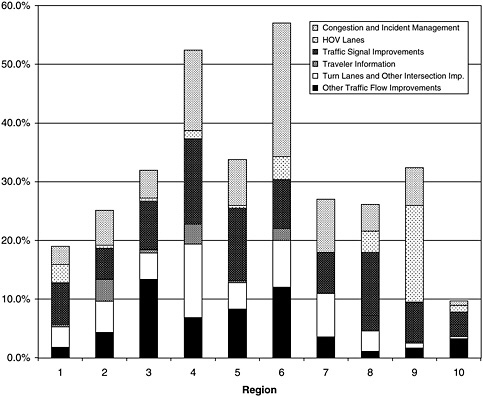
-
Turn lanes and other intersection improvements range from less than 0.5 percent of total CMAQ obligations in Region 10 to 12 percent in Region 4.
-
Traffic signal improvement projects range from 4 percent of total CMAQ obligations in Region 10 to 12 to 15 percent in Regions 4, 5, and 8.
-
Region 6 spends 23 percent of total CMAQ obligations on congestion and incident management projects. In most other regions, these projects account for less than 10 percent of total CMAQ obligations.
-
HOV lanes account for 16 percent of total CMAQ obligations in Region 9. In other regions, these projects account for less than 5 percent of total CMAQ obligations.
Shared Ride Projects (Figure C-12)
Regions 1, 3, and 8 spend 6 to 8 percent of total CMAQ obligations on shared ride projects. Other regions spend 2 to 4 percent of total CMAQ funds on these projects.
Pedestrian and Bicycle (Figure C-13)
Regions 3 and 7 spend less than 1 percent of total CMAQ obligations on pedestrian and bicycle projects. Region 10 spends 19 percent of total CMAQ obligations on these projects.
Demand Management (Figure C-14)
Demand management projects range from about 1 percent of total CMAQ obligations in Regions 7 and 9 to 7 percent in Region 1.
STP/CMAQ Projects (Figure C-15)
Regions 7 and 8 spend 30 and 48 percent, respectively, of CMAQ obligations on STP/CMAQ projects. In most other regions, these projects account for less than 3 percent of CMAQ obligations.
Other Projects (Figure C-16)
-
CMAQ obligations for paving and sweeping projects (to control PM10) are 10 percent in Region 7, 5 percent in Region 8, and 9 percent in Region 10. In all other regions, expenditures on these projects are less than 1 percent of CMAQ total obligations.
-
Regions 6, 7, 8, and 9 spend less than 1 percent of total CMAQ obligations on vehicle inspection and maintenance projects. Region 2 spends 10 percent of total CMAQ obligations on these projects.
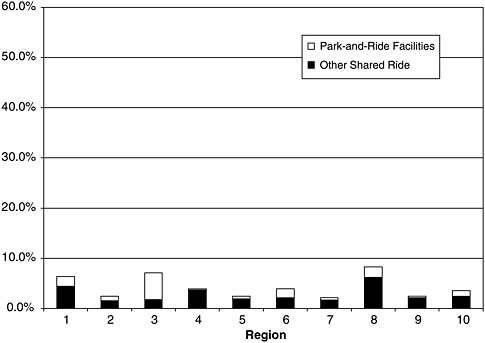
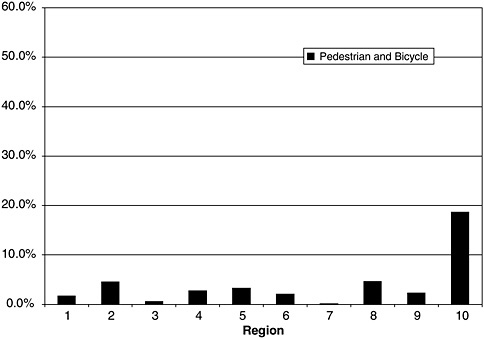
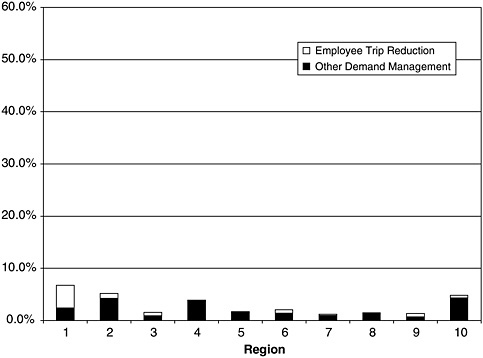
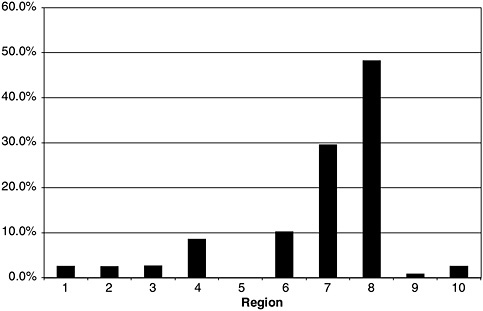
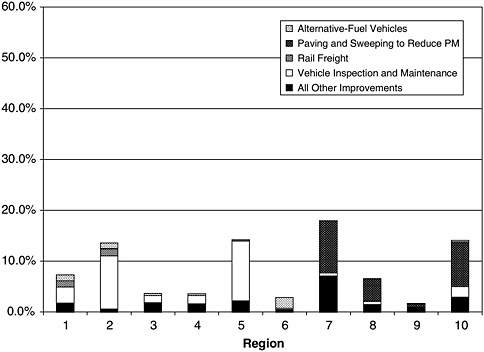
FIGURE C-16 Other projects as percent of all CMAQ obligations, by region.
EMISSION REDUCTIONS AND COST-EFFECTIVENESS OF CMAQ PROJECTS
The CMAQ program guidance document (FHWA 1992, 13) also requires states to provide estimates of emission reductions in kilograms per day for VOCs, NOx, CO, and PM10. Table C-4 shows the number of FY 1992–1999 projects with estimates of emission reductions for each project type. Excluding STP/CMAQ projects, which are in states that receive the minimum apportionment, emission estimates for at least one of the four pollutants are provided for almost 70 percent of all projects. Table C-5 shows percentages of FY 1992–1999 projects with estimates for each of the four pollutants. Almost 60 percent of the projects in the database have estimates of
emission reductions for VOCs; however, only 5 percent have estimates for PM10.
Table C-6 shows percentages of projects with estimates for each of the four pollutants by fiscal year. In FY 1992, fewer than 20 percent of projects had estimates for VOCs. In the next year, this percentage jumped to almost 60 percent, and it remained at about this level for the next 5 years. Similar though somewhat more erratic patterns are seen for estimates of the other pollutants.
The units for reporting emission reductions in the CMAQ database—kilograms per day—present a problem in evaluating the cost-effectiveness of CMAQ projects. The cost-effectiveness of air quality improvement strategies is usually expressed in terms of cost per ton (or some other unit of weight) reduction in emissions. In fact, in the legislation calling for this study, Congress asked the committee to “assess the effectiveness, including the quantitative and nonquantitative benefits, of projects funded under the [CMAQ] program and include, in the assessment, an estimate of the cost per ton of pollution reduction.” Since project life (the period over which the emission reductions are expected to occur) is not given in the database, it is not possible to determine cost per ton reduced for the projects in the CMAQ database. To eliminate this problem in the future, it would be useful to ask states either to (a) report total emission reductions for a project rather than emission reductions per day, or (b) add information on project life to the database, so that total emission reductions can be calculated as the product of project life (in days) and emission reductions per day.7
Some problems were found in the treatment of those projects for which obligations in a given fiscal year did not cover the total cost of the project. For some of these projects, the estimated emission reductions were for the entire project, even though the obligations for that project in a given fiscal year accounted for only a small part
TABLE C-4 Projects with Any Estimates of Emission Reductions (FY 1992–1999)
|
Type of Project |
Quantitative Estimates of Emission Reductions for One or More Pollutants |
||
|
Yes |
No |
Total Projects |
|
|
Transit |
1,119 |
490 |
1,609 |
|
Traffic flow |
2,207 |
999 |
3,206 |
|
Shared ride |
550 |
190 |
740 |
|
Pedestrian/bicycle |
469 |
231 |
700 |
|
Demand management |
319 |
165 |
484 |
|
STP/CMAQ |
– |
336 |
336 |
|
Other |
265 |
234 |
499 |
|
Grand total |
4,929 |
2,645 |
7,574 |
|
Percentage |
65 |
35 |
100 |
|
Total without STP/CMAQ |
4,929 |
2,309 |
7,238 |
|
Percentage |
68 |
32 |
100 |
TABLE C-5 Projects with Estimates for Each Pollutant by Project Type (FY 1992–1999)
|
Type of Project |
Total Projects |
Percent of Projects with Quantitative Estimates of |
|||
|
VOCs |
CO |
NOx |
PM10 |
||
|
Transit |
1,609 |
62.5 |
38.2 |
51.5 |
7.5 |
|
Traffic flow |
3,206 |
65.6 |
35.7 |
40.0 |
1.1 |
|
Shared ride |
740 |
66.2 |
38.6 |
52.7 |
6.1 |
|
Pedestrian/bicycle |
700 |
56.7 |
40.3 |
46.0 |
7.7 |
|
Demand management |
484 |
63.0 |
35.7 |
52.1 |
5.8 |
|
STP/CMAQ |
336 |
0.0 |
0.0 |
0.0 |
0.0 |
|
Other |
499 |
34.5 |
19.4 |
26.1 |
18.2 |
|
Grand total |
7,574 |
59.0 |
34.3 |
42.3 |
4.9 |
TABLE C-6 Projects with Estimates for Each Pollutant by Fiscal Year
|
Fiscal Year |
Total Projects |
Percent of Projects with Quantitative Estimates of |
|||
|
VOCs |
CO |
NOx |
PM10 |
||
|
1992 |
182 |
19.2 |
18.7 |
14.8 |
3.3 |
|
1993 |
778 |
59.3 |
33.3 |
27.8 |
5.9 |
|
1994 |
980 |
63.3 |
36.5 |
42.7 |
4.4 |
|
1995 |
1,072 |
61.8 |
41.1 |
44.9 |
5.0 |
|
1996 |
1,258 |
56.7 |
29.7 |
35.1 |
4.0 |
|
1997 |
1,178 |
63.2 |
37.0 |
50.4 |
5.6 |
|
1998 |
1,052 |
58.2 |
33.6 |
45.3 |
5.5 |
|
1999 |
1,074 |
58.1 |
31.8 |
51.3 |
4.7 |
|
All Years |
7,574 |
59.0 |
34.3 |
42.3 |
4.9 |
of the cost of the project.8 This problem can lead to an underestimate of cost per ton of pollution reduced. To eliminate this problem in the future, it would be useful if the total cost of a project were included in the database (including costs in all years whether covered by CMAQ or other funding sources), along with CMAQ obligations for the project in the fiscal year.
The analysis requirements in the CMAQ program guidance for projecting emission reductions are very flexible. States are not required to use a specific methodology in estimating emission reductions. Further, states are not required to provide documentation of key input factors (e.g., reductions of vehicle miles or changes in emission rates) used in developing estimates of emission reductions. As a result, users of the CMAQ database have difficulty evaluating the basis for estimates of emission reductions. Also, the lack of a standard methodology decreases the level of confidence for comparisons of emission reductions and cost-effectiveness across project types and states.
SUMMARY AND AUTHOR’S RECOMMENDATIONS
The following are the key findings from the review of the composition of the CMAQ program:
-
Slightly more than 75 percent of obligations during the first 8 years of the CMAQ program have been for traffic flow and transit improvement projects. These types of projects provide benefits beyond emission reductions, such as time savings to highway and transit users. Types of projects for which most of the benefits are emission reductions or energy savings—alternative-fuel vehicles, paving and sweeping to reduce PM, and vehicle inspection and maintenance—account for only about 8 percent of CMAQ obligations.
-
There are large year-to-year changes in the distribution of CMAQ obligations among different types of projects. The patterns of these changes do not indicate any clear trends. However, it appears that obligations for HOV projects are decreasing while obligations for vehicle inspection and maintenance projects are increasing.
-
There are large differences across regions in the composition of the CMAQ program. For example, transit project obligations range from about 5 to nearly 60 percent of total CMAQ obligations, depending on the region. Traffic flow projects range from about 10 to nearly 60 percent of total CMAQ obligations, also depending on the region.
Three problems limit the usefulness of the database in estimating the cost-effectiveness of CMAQ projects in providing emission reductions:
-
Emission reductions are stated in kilograms per day, and project lives are not given. Accordingly, it is not possible to determine the total amount of emission reductions attributable to a project.
-
For some projects in the database, it appears that emission reductions are reported for the entire project, whereas obligations in a given fiscal year account for only a part of the cost of the project. This problem can lead to an underestimate of the cost per ton of achieving emission reductions.
-
Little is known about the data, methods, and assumptions used in estimating emission reductions. As a result, it is difficult to
-
compare the cost-effectiveness of different types of CMAQ projects in different states.
To address these problems, it is the author’s recommendation that FHWA ask states to
-
Add information on project life to the database, so that total emission reductions can be calculated for project cost-effectiveness analyses; and
-
Report total cost for a project (including costs in all years whether covered by CMAQ or other funding sources), along with CMAQ obligations for the project in the fiscal year.
FHWA also should consider ways of addressing problems due to inconsistent data, methods, and assumptions in estimating emission reductions, without imposing unreasonable reporting burdens on states.
REFERENCES
Abbreviation
FHWA Federal Highway Administration
FHWA. 1992. Further Guidance on the Congestion Mitigation and Air Quality Improvement Program (CMAQ Program). U.S. Department of Transportation, Oct. 16.
FHWA. 1999. The Congestion Mitigation and Air Quality Improvement (CMAQ) Program Under the Transportation Equity Act for the 21st Century (TEA-21): Program Guidance. U.S. Department of Transportation, April.


