


Below is the uncorrected machine-read text of this chapter, intended to provide our own search engines and external engines with highly rich, chapter-representative searchable text of each book. Because it is UNCORRECTED material, please consider the following text as a useful but insufficient proxy for the authoritative book pages.
5 Energy SUMMARY Energy is required to sustain the bodyâs various functions, includ- ing respiration, circulation, physical work, and maintenance of core body temperature. The energy in foods is released in the body by oxidation, yielding the chemical energy needed to sustain metabolism, nerve transmission, respiration, circulation, and physical work. The heat produced during these processes is used to maintain body temperature. Energy balance in an individual depends on his or her dietary energy intake and energy expenditure. Imbalances between intake and expenditure result in gains or losses of body components, mainly in the form of fat, and these determine changes in body weight. The Estimated Energy Requirement (EER) is defined as the average dietary energy intake that is predicted to maintain energy balance in a healthy, adult of a defined age, gender, weight, height, and level of physical activity consistent with good health. To calculate the EER, prediction equations for normal weight individuals were developed from data on total daily energy expenditure measured by the doubly labeled water technique. In children and pregnant or lactating women, the EER includes the needs associated with the deposition of tissues or the secretion of milk at rates consistent with good health. While the expected between-individual variabil- ity is calculated for the EER, there is no Recommended Dietary Allowance (RDA) for energy because energy intakes above the EER would be expected to result in weight gain. Similarly, the Tolerable Upper Intake Level (UL) concept does not apply to 107
108 DIETARY REFERENCE INTAKES energy, because any intake above an individualâs energy require- ment would lead to undesirable (and potentially hazardous) weight gain. BACKGROUND INFORMATION Humans and other mammals constantly need to expend energy to perform physical work; to maintain body temperature and concentration gradients; and to transport, synthesize, degrade, and replace small and large molecules that make up body tissue. This energy is generated by the oxidation of various organic substances, primarily carbohydrates, fats, and amino acids. In 1780, Lavoisier and LaPlace measured the heat produc- tion of mammals by calorimetry (Kleiber, 1975). They demonstrated that it was equal to the heat released when organic substances were burned, and that the same quantities of oxygen were consumed by animal metabo- lism as were used during the combustion of the same organic substrates (Holmes, 1985). Indeed, it has been verified by numerous experiments on animals and humans since then that the energy produced by oxidation of carbohydrates and fats in the body is the same as the heat of combustion of these substances (Kleiber, 1975). The crucial difference is that in organ- isms oxidation proceeds through many steps, allowing capture of some of the energy in an intermediate chemical formâthe high energy pyrophos- phate bond of adenosine triphosphate (ATP). Hydrolysis of these high- energy bonds can then be coupled to various chemical reactions, thereby driving them to completion, even if by themselves they would not proceed (Lipmann, 1941). Typically, the rates of energy expenditure in adults at rest are slightly less than 1 kcal/min in women (i.e., 0.8 to 1.0 kcal/min or 1,150 to 1,440 kcal/d), and slightly more than 1 kcal/min in men (i.e., 1.1 to 1.3 kcal/min or 1,580 to 1,870 kcal/d) (Owen et al., 1986, 1987). One kcal/min corresponds approximately to the heat released by a burning candle or by a 75-watt light bulb (i.e., 1 kcal/min corresponds to 70 J/sec or 70 W). Energy Yields from Substrates Carbohydrate, fat, protein, and alcohol provide all of the energy sup- plied by foods and are generally referred to as macronutrients (in contrast to vitamins and elements, usually referred to as micronutrients). The amount of energy released by the oxidation of carbohydrate, fat, protein, and alcohol (also known as Heat of Combustion, or âH) is shown in Table 5-1. When alcohol (ethanol or ethyl alcohol) is consumed, it promptly appears in the circulation and is oxidized at a rate determined largely by its concentration and by the activity of liver alcohol dehydrogenase. Oxi-
109 E NERGY TABLE 5-1 Heat of Combustion of Various Macronutrients Heat of Combustiona Atwater Factord kcalb/L O 2 RQc (CO2/O2) Macronutrient (kcal/g) (kcal/g) Starch 4.18 5.05 1.0 4.0 Sucrose 3.94 5.01 1.0 4.0 Glucose 3.72 4.98 1.0 4.0 Fat 9.44 4.69 0.71 9.0 Protein by 5.6 combustiona Protein through 4.70 4.66 0.835 4.0 metabolisma Alcohole 7.09 4.86 0.67 â a The energy derived by protein oxidation in living organisms is less than the heat of combustion of protein, because the nitrogen-containing end product of metabolism in mammals is urea (or uric acid in birds and reptiles), whereas nitrogen is converted into nitrous oxide when protein is combusted. The heat liberated by biological oxidation of proteins was long thought to be 4.3 kcal/g (Merrill and Watt, 1973), but a more recent demonstration showed that the actual value is 4.7 kcal/g (Livesey and Elia, 1988). b One calorie is the amount of energy needed to increase the temperature of 1 g of water from 14.5Ë to 15.5ËC. In the context of foods and nutrition, âlarge calorieâ (i.e., Calories, with a capital C), which is more properly referred to as âkilocalorieâ (kcal), has been traditionally used. In the International System of Units, the basic energy unit is the Joule (J). One J = 0.239 calories, so that 1 kcal = to 4.186 kJ. A daily energy expenditure of 2,400 kcal corresponds to the expenditure of 10,000 kJ, or 10 MJ (Mega Joules)/d. c RQ = respiratory quotient, which is defined as the ratio of CO produced divided by O 2 2 consumed (in terms of mols, or in terms of volumes of CO2 and O2). d Atwater, a pioneer in the study and characterization of nutrients and metabolism, proposed to use the values of 4, 9, and 4 kcal/g of carbohydrate, fat, and protein, respectively (Merrill and Watt, 1973). This equivalent is now uniformly used in nutrient labeling and diet formulation. Nutrition Labeling of Food. 21 C.F.R. §101.9 (1991). e Alcohol (ethanol) content of beverages is usually described in terms of percent by volume. The heat of combustion of alcohol is 5.6 kcal/mL. (One mL of alcohol weighs 0.789 g.) dation of alcohol elicits a prompt reduction in the oxidation of other substrates used for ATP regeneration, demonstrating that ethanol oxida- tion proceeds in large part via conversion to acetate and oxidative phos- phorylation. The phenomenon has been precisely measured by indirect calorimetry in human subjects, in whom ethanol consumption was found to primarily reduce fat oxidation (Suter et al., 1992). About 80 percent of the energy liberated by ethanol oxidation is used to drive ATP regenera- tion, so that the thermic effect of ethanol comes to about 20 percent (Siler et al., 1999). The thermic effect of food is the increase in energy expendi-
110 DIETARY REFERENCE INTAKES ture as measured by heat produced upon ingestion of that food. The thermic effect of alcohol is about twice the thermic effect of carbohydrate, but less than the thermic effect of protein (see later section, âThermic Effect of Foodâ). Reported food intake in individuals consuming alcohol is often similar to that of individuals who do not consume alcohol (de Castro and Orozco, 1990). As a result, it has sometimes been questioned whether alcohol con- tributes substantially to energy production. However, the biochemical and physiological evidence about the contribution made by ethanol to oxidative phosphorylation is so unambiguous that the apparent discrepancies between energy intake data and body weights must be attributed to inaccuracies in reported food intakes. In fact, in individuals consuming a healthy diet, the additional energy provided by alcoholic beverages can be a risk factor for weight gain (Suter et al., 1997), as opposed to alcoholics in whom the pharmacological impact of excessive amounts of ethanol tends to inhibit normal eating and may cause emaciation. Energy Requirements Versus Nutrient Requirements Recommendations for nutrient intakes are generally set to provide an ample supply of the various nutrients needed (i.e., enough to meet or exceed the requirements of almost all healthy individuals in a given life stage and gender group). For most nutrients, recommended intakes are thus set to correspond to the median amounts sufficient to meet a specific criterion of adequacy plus two standard deviations to meet the needs of nearly all healthy individuals (see Chapter 1). However, this is not the case with energy because excess energy cannot be eliminated, and is eventually deposited in the form of body fat. This reserve provides a means to main- tain metabolism during periods of limited food intake, but it can also result in obesity. The first alternate criterion that may be considered as the basis for a recommendation for energy is that energy intake should be commensu- rate with energy expenditure, so as to achieve energy balance. Although frequently applied in the past, this is not appropriate as a sole criterion, as described by the FAO/WHO/UNU publication, Energy and Protein Require- ments (1985): The energy requirement of an individual is a level of energy intake from food that will balance energy expenditure when the indi- vidual has a body size and composition, and level of physical activity, consistent with long-term good health; and that would allow for the maintenance of economically necessary and socially desirable physical activity. In children and pregnant or lactating women the energy requirement includes the energy needs associated with
111 E NERGY the deposition of tissues or the secretion of milk at rates consis- tent with good health (p. 12). This definition indicates that desirable energy intakes for obese indi- viduals are less than their current energy expenditure, as weight loss and establishment of a steady state at a lower body weight is desirable for them. In underweight individuals, on the other hand, desirable energy intakes are greater than their current energy expenditure to permit weight gain and maintenance of a higher body weight. Thus, it seems logical to base estimated values for energy intake on the amounts of energy that need to be consumed to maintain energy balance in adult men and women who are maintaining desirable body weights, taking into account the incre- ments in energy expenditure elicited by their habitual level of activity. There is another fundamental difference between the requirements for energy and those for other nutrients. Body weight provides each indi- vidual with a readily monitored indicator of the adequacy or inadequacy of habitual energy intake, whereas a comparably obvious and individualized indicator of inadequate or excessive intake of other nutrients is not usually evident. Energy Balance Because of the effectiveness in regulating the distribution and use of metabolic fuels, man and animals can survive on foods providing widely varying proportions of carbohydrates, fats, and proteins. The ability to shift from carbohydrate to fat as the main source of energy, coupled with the presence of substantial reserves of body fat, makes it possible to accom- modate large variations in macronutrient intake, energy intake, and energy expenditure. The amount of fat stored in an adult of normal weight com- monly ranges from 6 to 20 kg. Since one gram of fat provides 9.4 kcal, body fat energy reserves thus range typically from approximately 50,000 to 200,000 kcal, providing a large buffer capacity as well as the ability to provide energy to survive for extended periods (i.e., several months) of severe food deprivation. Large daily deviations from energy balance are thus readily tolerated, and accommodated primarily by gains or losses of body fat (Abbott et al., 1988; Stubbs et al., 1995). Coefficients of variation for intra-individual variability in daily energy intake average ± 23 percent (Bingham et al., 1994); variations in physical activity are not closely syn- chronized with adjustments in food intake (Edholm et al., 1970). Thus, substantial positive as well as negative energy balances of several hundred kcal/d occur as a matter of course under free-living conditions among normal and overweight subjects. Yet over the long term, energy balance is maintained with remarkable accuracy. Indeed, during long periods in the
112 DIETARY REFERENCE INTAKES life of most individuals, gains or losses of adipose tissue are less than 1 to 2 kg over a year (McCargar et al., 1993), implying that the cumulative error in adjusting energy intake to expenditure amounts to less than 2 percent of energy expenditure. Components of Energy Expenditure Basal and Resting Metabolism The basal metabolic rate (BMR) describes the rate of energy expendi- ture that occurs in the postabsorptive state, defined as the particular con- dition that prevails after an overnight fast, the subject having not consumed food for 12 to 14 hours and resting comfortably, supine, awake, and motion- less in a thermoneutral environment. This standardized metabolic state corresponds to the situation in which food and physical activity have minimal influence on metabolism. The BMR thus reflects the energy needed to sustain the metabolic activities of cells and tissues, plus the energy needed to maintain blood circulation, respiration, and gastrointestinal and renal processing (i.e., the basal cost of living). BMR thus includes the energy expenditure associated with remaining awake (the cost of arousal), reflect- ing the fact that the sleeping metabolic rate (SMR) during the morning is some 5 to 10 percent lower than BMR during the morning hours (Garby et al., 1987). BMR is commonly extrapolated to 24 hours to be more meaningful, and it is then referred to as basal energy expenditure (BEE), expressed as kcal/24 h. Resting metabolic rate (RMR), energy expenditure under rest- ing conditions, tends to be somewhat higher (10 to 20 percent) than under basal conditions due to increases in energy expenditure caused by recent food intake (i.e., by the âthermic effect of foodâ) or by the delayed effect of recently completed physical activity (see Chapter 12). Thus, it is impor- tant to distinguish between BMR and RMR and between BEE and resting energy expenditure (REE) (RMR extrapolated to 24 hours). Basal, resting, and sleeping energy expenditures are related to body size, being most closely correlated with the size of the fat-free mass (FFM), which is the weight of the body less the weight of its fat mass. The size of the FFM generally explains about 70 to 80 percent of the variance in RMR (Nelson et al., 1992; Ravussin et al., 1986). However, RMR is also affected by age, gender, nutritional state, inherited variations, and by differences in the endocrine state, notably (but rarely) by hypo- or hyperthyroidism. The relationships among RMR, body weight, and FFM are illustrated in Figures 5-1 and 5-2 (Owen, 1988), which show that differences in RMR relative to body weight among diverse individuals such as men, women, and athletes mostly disappear when RMR is considered relative to FFM.
113 E NERGY 3,000 RMR (k cal/24 h) 2,000 1,000 0 Weight (kg) FIGURE 5-1 Resting metabolic rates (RMR) are contrasted against the weights of 44 lean ( ) and obese (â) healthy women, 8 of whom were athletes (â), and 60 lean (â) and obese ( ) healthy men. Reprinted, with permission, from Owen (1988). Copyright 1988 by W.B. Saunders. 3,000 2,000 RMR (k cal/24 h) 1,000 0 FFM (kg) FIGURE 5-2 Resting metabolic rates (RMR) are contrasted against the fat-free masses (FFM) of 44 lean ( ) and obese (â) healthy women, 8 of whom were athletes (â), and 60 lean (â) and obese ( ) healthy men. Reprinted, with permis- sion, from Owen (1988). Copyright 1988 by W.B. Saunders.
114 DIETARY REFERENCE INTAKES BEE has been predicted from age, gender, and body size. Prediction equations were developed for each gender (WN Schofield, 1985) by pool- ing and analyzing reported measurements made in 7,393 individuals. A recent re-evaluation of all available data performed by Henry (2000) has led to a new set of predicting equations. Thermic Effect of Food It has long been known that food consumption elicits an increase in energy expenditure (Kleiber, 1975). Originally referred to as the Specific Dynamic Action (SDA) of food, this phenomenon is now more commonly referred to as the thermic effect of food (TEF). The intensity and duration of meal-induced TEF is determined primarily by the amount and composi- tion of the foods consumed, mainly due to the metabolic costs incurred in handling and storing ingested nutrients (Flatt, 1978). Activation of the sympathetic nervous system elicited by dietary carbohydrate and by sensory stimulation causes an additional, but modest, increase in energy expendi- ture (Acheson et al., 1983). The increments in energy expenditure during digestion above baseline rates, divided by the energy content of the food consumed, vary from 5 to 10 percent for carbohydrate, 0 to 5 percent for fat, and 20 to 30 percent for protein. The high TEF for protein reflects the relatively high metabolic cost involved in processing the amino acids yielded by absorption of dietary protein, for protein synthesis, or for the synthesis of urea and glucose (Flatt, 1978; Nair et al., 1983). Consumption of the usual mixture of nutrients is generally considered to elicit increases in energy expenditure equivalent to 10 percent of the foodâs energy con- tent (Kleiber, 1975). Since TEF occurs during a limited part of the day only, it can result in noticeable increases in REE if energy expenditure is measured during the hours following meals. Thermoregulation Birds and mammals, including humans, regulate their body tempera- ture within narrow limits. This process, termed thermoregulation, can elicit increases in energy expenditure that are greater when ambient tempera- tures are below the zone of thermoneutrality. The environmental tem- perature at which oxygen consumption and metabolic rate are lowest is described as the critical temperature or thermoneutral zone (Hill, 1964). Because most people adjust their clothing and environment to maintain comfort, and thus thermoneutrality, the additional energy cost of thermo- regulation rarely affects total energy expenditure to an appreciable extent. However, there does appear to be a small influence of ambient tempera- ture on energy expenditure as described in more detail below.
115 E NERGY Physical Activity The energy expended for physical activity varies greatly among indi- viduals as well as from day to day. In sedentary individuals, about two- thirds of total energy expenditure goes to sustain basal metabolism over 24 hours (the BEE), while one-third is used for physical activity. In very active individuals, 24-hour total energy expenditure can rise to twice as much as basal energy expenditure (Grund et al., 2001), while even higher total expenditures occur among heavy laborers and some athletes. The efficiency with which energy from food is converted into physical work is remarkably constant when measured under conditions where body weight and athletic skill are not a factor, such as on bicycle ergometers (Kleiber, 1975; Nickleberry and Brooks, 1996; Pahud et al., 1980). For weight-bearing physical activities, the cost is roughly proportional to body weight. In the life of most persons, walking represents the most significant form of physical activity, and many studies have been performed to deter- mine the energy expenditures induced by walking or running at various speeds (Margaria et al., 1963; Pandolf et al., 1977; Passmore and Durnin, 1955). Walking at a speed of 2 mph is considered to correspond to a mild degree of exertion, walking speeds of 3 to 4 mph correspond to moderate degrees of exertion, and a walking speed of 5 mph to vigorous exertion (Table 12-1, Fletcher et al., 2001). Over this range of speeds, the increment in energy expenditure amounts to some 60 kcal/mi walked for a 70-kg individual, or 50 kcal/mi walked for a 57-kg individual (see Chapter 12, Figure 12-4). The exertion caused by walking/jogging increases progres- sively at speeds of 4.5 mph and beyond, reaching 130 kcal/mi at 5 mph for a 70-kg individual. The increase in daily energy expenditure is somewhat greater, how- ever, because exercise induces an additional small increase in expenditure for some time after the exertion itself has been completed. This excess post-exercise oxygen consumption (EPOC) depends on exercise intensity and duration and has been estimated at some 15 percent of the increment in expenditure that occurs during exertions of the type described above (Bahr et al., 1987). This raises the cost of walking at 3 mph to 69 kcal/mi (60 kcal/mi à 1.15) for a 70-kg individual and to 58 kcal/mi (50 kcal/mi à 1.15) for a 57-kg individual. Taking into account the dissipation of 10 percent of the energy consumed on account of the thermic effect of food to cover the expenditure associated with walking, then walking 1 mile raises daily energy expenditure to 76 kcal/mi (69 kcal/mi à 1.1) in individuals weighing 70 kg, or 64 kcal/mi (58 kcal/mi à 1.1) for individuals weighing 57 kg. Since the cost of walking is proportional to body weight, it is convenient to consider that the overall cost of walking at moderate speeds is approximately 1.1 kcal/mi/kg body weight (75 kcal/mi/70 kg or 64 kcal/mi/57 kg). The effects of varia-
116 DIETARY REFERENCE INTAKES tions in body weights and the impact of various physical activities on energy expenditure are considered in more detail in Chapter 12. Physical Activity Level The level of physical activity is commonly described as the ratio of total to basal daily energy expenditure (TEE/BEE). This ratio is known as the Physical Activity Level (PAL), or the Physical Activity Index. Describ- ing physical activity habits in terms of PAL is not entirely satisfactory because the increments above basal needs in energy expenditure, brought about by most physical activities where body weight is supported against gravity (e.g., walking, but not cycling on a stationary cycle ergometer), are directly proportional to body weight, whereas BEE is more nearly propor- tional to body weight0.75. However, PAL is a convenient comparison and is used in this report to describe and account for physical activity habits. The effect of variations in activities on PAL is described in Chapter 12. Total Energy Expenditure Total Energy Expenditure (TEE) is the sum of BEE (which includes a small component associated with arousal, as compared to sleeping), TEF, physical activity, thermoregulation, and the energy expended in deposit- ing new tissues and in producing milk. With the emergence of informa- tion on TEE by the doubly labeled water (DLW) method (Schoeller, 1995), it has become possible to determine energy expenditure of infants, chil- dren, and adults under free-living conditions. TEE from doubly labeled water does not include the energy content of the tissue constituents laid down during normal growth and pregnancy or the milk produced during lactation, as it refers to energy expended during oxidation of energy- yielding nutrients to water and carbon dioxide. It should be noted that direct measurements of TEE represent a dis- tinct advantage over previous TEE evaluations, which had to rely on the factorial approach and on food intake data, which have limited accuracy due to the inability to reliably determine average physical activity cost and nutrient intakes. Estimated Energy Requirement Information on energy expenditure obtained by DLW studies con- ducted by a number of research units (see Appendix I) are used in this report to estimate energy requirements, taking into account estimates of the energy content of new body constituents during growth and preg-
117 E NERGY nancy and of the milk produced during lactation. Energy expenditure depends on age and varies primarily as a function of body size and physical activity, both of which vary greatly among individuals. Recommendations about energy intake vary accordingly, and are also subject to the criterion that an individual adultâs body weight should remain stable and within the healthy range. SELECTION OF INDICATORS FOR ESTIMATING THE REQUIREMENT FOR ENERGY Reported Energy Intake The reported energy intakes of weight-stable subjects (i.e., those in energy balance) could, in principle, be used to predict energy require- ments for weight maintenance. However, it is now widely recognized that reported energy intakes in dietary surveys underestimate usual energy intake (Black et al., 1993). The most compelling evidence about underreporting has come from measurements of total energy expenditure (TEE) by the doubly labeled water (DLW) method (Schoeller, 1995). The use of a measure or estimate of TEE to validate instruments that measure food intake is dependent on the principle of energy balance. That is, in weight-stable adults, energy intake must equal TEE. By comparing reported energy intake to TEE, the accuracy of food intake reporting can be assessed (Goldberg et al., 1991a). A large body of literature documents the underreporting of food intake, which can range from 10 to 45 percent depending on the age, gender, and body composition of individuals in the sample population (Johnson, 2000). Underreporting tends to increase as children grow older (Livingstone et al., 1992b), is worse among women than in men (Johnson et al., 1994), and is more pronounced among overweight and obese than among lean individuals (Bandini et al., 1990a; Lichtman et al., 1992; Prentice et al., 1986). Low socioeconomic status, characterized by low income, low educational attainment, and low literacy levels increase the tendency to underreport energy intakes (Briefel et al., 1997; Johnson et al., 1998; Price et al., 1997; Pryer et al., 1997). Ethnic differences affecting sensitivities and psychological perceptions relating to eating and body weight can also affect the accuracy of reported food intakes (Tomoyasu et al., 2000). Finally, individuals with infrequent symptoms of hunger under- report to a greater degree than those who experience frequent hunger (Bathalon et al., 2000). There is some evidence suggesting that underreporters often fail to report foods perceived to be bad or sinful, such as cakes/pies, savory
118 DIETARY REFERENCE INTAKES snacks, cheese, fried potatoes, meat mixtures, soft drinks, spreads, condi- ments, and generally foods known to be high in fat (Bingham and Day, 1997; Krebs-Smith et al., 2000). Reported intakes of added sugars are also significantly lower than that consumed, due in part to the frequent omis- sion of snack foods from 24-hour food recording (Poppitt et al., 1998). Finally, there is no objective evidence for the existence of âsmall eaters,â individuals who can survive long term on the low energy intakes that they report in dietary surveys (Black, 1999; Lichtman et al., 1992; Prentice et al., 1986). Clearly, it is no longer tenable to base energy requirements on self-reported food consumption data. Factorial Approach Previous Recommended Dietary Allowances for energy (NRC, 1989) used the factorial method to estimate TEE. This method calculates TEE using information on the amount of time devoted to different activities and the energy costs of each activity throughout a theoretical 24-hour period. The factorial method allowed theoretical estimation of TEE for a defined activity pattern (using measured average costs of standard activities and theoretical activity duration). Thus, mean expected energy require- ments for different levels of physical activity were defined. However, there are recognized problems with the factorial method and doubts about the validity of energy requirement predictions based on it (Roberts et al., 1991). The first problem is that there are a wide range of activities and physical efforts performed during normal life, and it is not feasible to measure the energy cost of each. Another concern with the factorial method is that the measurement of the energy costs of specific activities imposes constraints (due to mechanical impediments associated with performing an activity while wearing unfamiliar equipment) that may alter the measured energy costs of different activities. Although generali- zations are essential in trying to account for the energy costs of daily activi- ties, substantial errors may be introduced. In addition, energy expenditure during sleep, once considered to be equivalent to basal metabolic rate (BMR), is generally somewhat lower (â5 to â10 percent) than BMR (Garby et al., 1987). Also, and perhaps most importantly, the factorial method only takes into account activities that can be specifically accounted for (e.g., sleep- ing, walking, household work, occupational activity, and so on). However, 24-hour room calorimeter studies have shown that a significant amount of energy is expended in spontaneous physical activities, some of which are part of a sedentary lifestyle (Ravussin et al., 1986; Zurlo et al., 1992). In addition, some individuals manifest a substantial amount of fidgeting. Together these were reported to average about 350 kcal/d, ranging from
119 E NERGY 140 to 700 kcal/d (Ravussin et al., 1986). Thus, the factorial method is bound to underestimate usual energy needs (Durnin, 1990; Roberts et al., 1991). Most comparisons of the factorial approach with DLW determinations of TEE have shown significantly higher measured values for TEE than predicted by the factorial method (Haggarty et al., 1994; Jones et al., 1997; Roberts et al., 1991; Sawaya et al., 1995). In two direct comparisons of factorial energy requirement estimates with DLW, one confirmed that the factorial method underestimated energy needs (Leonard et al., 1997), while the other found no difference between the methods in an elderly population with a mean age of 70 years (Morio et al., 1997). Measurement of Energy Expenditure by Doubly Labeled Water The DLW method is a relatively new technique that measures TEE in free-living individuals. It was originally proposed and developed by Lifson for use in small animals (Lifson and McClintock, 1966; Lifson et al., 1955), but has been adapted for human studies and extensively used (Schoeller et al., 1986). Two stable isotopic forms of water (H218O and 2H2O) are administered, and their disappearance rates from a body fluid (i.e., urine or blood) are monitored for a period of time, optimally equivalent to 1 to 3 half lives for these isotopes (7 to 21 days in most human subjects). The disappearance rate of 2H2O relates to water flux, while that of H218O reflects water flux plus carbon dioxide (CO2) production rate, because of the rapid equilibration of the body water and bicarbonate pools by car- bonic anhydrase (Lifson et al., 1949). The difference between the two disappearance rates can therefore be used to calculate the CO2 produc- tion rate, and with knowledge of the composition of the diet, TEE can be calculated. To predict TEE from a measurement of CO2 production, it is neces- sary to have an estimate of the average respiratory quotient (RQ = ratio of CO2 produced to the O2 consumed) of the subject during the period of measurement. This is because the energy released per liter of CO2 varies with the RQ and hence with the substrate mix oxidized by the body (Elia, 1991). The ratio of the CO2 produced to the O2 consumed by the biologi- cal oxidation of a representative sample of the diet is commonly referred to as the food quotient, or FQ (Flatt, 1978). Short-term measurements of RQ by indirect calorimetry are not useful for the DLW technique because RQ varies markedly during the day, par- ticularly after meals. It is therefore more accurate to estimate the average RQ from information on the subjectsâ dietary intake. When energy balance prevails, the average RQ is equal to the FQ. If substantial gains or losses of body constituents are known to occur during the period of measurement,
120 DIETARY REFERENCE INTAKES appropriate adjustments can be made in estimating the average RQ. Although food reports are inaccurate for measuring total energy intake, FQ calculations from food records can be used because FQ has a relatively small effect on DLW measurements of TEE. Several validations of the DLW study have been conducted in which DLW-derived estimates of TEE were compared with measurements of TEE in whole-body calorimeters (Table 5-2). Although studies in whole-body calorimeters do not mimic normal life conditions, they do allow for an exact comparison of the DLW method with classic calorimetry, which is considered the most reliable measurement of energy expenditure. As shown in Table 5-2, there is a close agreement between means for the CO2 production rate determined by the two methods in all the validation studies. The precision of DLW measurements, as assessed by the variability of indi- vidual DLW measurements from the calorimetry assessments, ranged from â2.5 to 5.9 percent in the different studies. These validation studies show that the DLW method can provide an accurate assessment of the CO2 production rate and hence TEE in a wide range of human subjects. One particular advantage of the DLW method is that it provides an index of TEE over a period of several days. Because 1 to 3 half-lives of isotope disappearance are needed for changes in isotopic abundance to be measured accurately by mass spectrometry, optimal time periods for DLW measurements of TEE range from 1 to 3 weeks in most groups of individuals (Schoeller, 1983). Thus, in contrast to other techniques, DLW can provide TEE estimates over biologically meaningful periods of time that can reduce the impact of spontaneous daily variations in physical activity. Moreover, because DLW is noninvasive (requiring only that the subject drink the stable isotopes and provide at least three urine samples over the study period), measurements can be made in subjects leading their normal daily lives. A critical mass of DLW data has now accumulated on a wide range of age groups and body sizes, so that the estimated energy requirements provided in this report could be based on DLW measure- ments of TEE. The available DLW data (Appendix I) are not from randomly selected individuals, except in the recent study of Bratteby and coworkers (1997), and they do not constitute a sample representative of the population of the United States and Canada. However, the measurements were obtained in men, women, and children whose ages, body weights, heights, and physi- cal activities varied over wide ranges. At the present time, a few age groups are underrepresented and interpolations had to be performed in these cases. Thus, while the available DLW data do not yet provide an entirely satisfactory set of data, they nevertheless offer the best currently available information.
121 E NERGY A second potential criticism of using DLW-derived estimates of TEE as a basis for estimating energy requirements is that the approach assumes that TEE is relatively unaffected by fluctuations in energy balance. Although there is some capacity for TEE to increase or decrease spontane- ously when energy intakes increase or decrease, these changes are small and attenuate the effect of energy imbalances only modestly (Levine et al., 1999; Roberts et al., 1990). Indeed, overfeeding studies show that over- eating is inevitably accompanied by substantial weight gain, and that reduced energy intake induces weight loss (Saltzman and Roberts, 1995). Thus, although there may be some adaptive capacity to alter TEE in response to changes in dietary energy intake, the DLW-based evaluation of TEE at approximate weight maintenance provides an appropriate estimate of energy expenditure from which energy requirements for maintaining energy balance can be derived. Body Mass Index Adults A growing literature supports the use of the body mass index (BMI, defined as weight in kilograms divided by the square of height in meters) as a predictor of the impact of body weight on morbidity and mortality risks (Seidell et al., 1996; Troiano et al., 1996). As an index of healthy weight and as a predictor of morbidity and mortality risk, it has supplanted weight-for-height tables, which were derived primarily from white popula- tions and relied on questionable estimates of frame size (NHLBI/NIDDK, 1998). BMI, although only an indirect indicator of body composition, is now used to classify underweight and overweight individuals. While sophisticated techniques are available to precisely measure fat- free mass (FFM) and fat mass (FM) of individuals, these techniques are used mainly in research protocols. For most clinical and epidemiological applications, body size is judged on the basis of the BMI, which is easy to determine, accurate, and reproducible. The main disadvantages of relying on BMI are that (1) it does not reliably reflect body fat content, which is an independent predictor of health risk, and (2) very muscular individuals may be misclassified as overweight (Willett et al., 1999). The National Institutes of Health (NIH) clinical guidelines on the identification, evaluation, and treatment of normal, overweight and obese adults and the World Health Organization have defined BMI cutoffs for adults over 19 years of age, regardless of age or gender (NHLBI/NIDDK, 1998; WHO, 1998). Underweight is defined as a BMI of less than 18.5 kg/m2, overweight as a BMI from 25 up to 30 kg/m2, and obese as a BMI of 30 kg/m2 or higher. A healthy or desirable BMI is considered to be from 18.5 up to
122 DIETARY REFERENCE INTAKES TABLE 5-2 Comparison of Carbon Dioxide Production Rates Measured by the Doubly Labeled Water Method and Indirect Calorimetry in Humans Reference Subjects Time (d) n Adults, in energy balanced Coward et al., 1984 4 12 Klein et al., 1984 Adults, in energy balance 1 5 Schoeller and Webb, 1984 Adults, in energy balance 5 5 Roberts et al., 1986 Preterm infants, growing 4 5 Schoeller et al., 1986 Adults, in energy balance âLowâ dose 6 4 âHighâ dose 3 4 Jones et al., 1987 Infants, after surgery 9 5â6 Westerterp et al., 1988 Adults, in energy balance Sedentary 5 6 Active 4 3.5 Riumallo et al., 1989 Adults 6 7 Seale et al., 1990 Adults, in energy balance 4 13 Ravussin et al., 1991 Obese adults, in energy 12 7 balance Schulz et al., 1992 Adults, in energy balance 9 7 Seale and Rumpler, 1997 Adults, in energy balance 19 10 a Calculations for pool: I = 2-pool model using measured pool sizes as proposed by Coward et al. (1984) and detailed by Roberts et al. (1986), S = single-pool model as described by Lifson et al. (1955) and Lifson and McClintock (1966), F = 2-pool model with fixed ratio of 1.03 between pool sizes as described by Schoeller et al. (1986). b Calculations for fractionated water loss: 50 = assumed to be 50 percent of total water output, 25 = assumed to be 25 percent of total water output, M = measured or calcu-
123 E NERGY Calculations CO2 % Poola Fractionatedb Growthc T 1/ (d) Error 2 I 50 L 1.9 10.1 S 25 L 1.8 6.3â9.5 S 50 L 5.9 ± 7.6 2.5â3.6 I M E â1.4 ± 4.8 6.7â9.8 F P L 5.0 ± 9.5 8.6â9.9 F P L 1.7 ± 4.5 2.9â4.5 F P L â0.9 ± 6.2 5.7â9.0 F P L 1.4 ± 3.9 4.0â4.9 F P L â1.0 ± 7.0 F P L F P L â1.04 ± 0.63 I P L â2.5 ± 5.8 I P L F P L lated from data on water balance, P = assumed to be proportional to carbon dioxide output (Jones et al., 1987; Schoeller et al., 1986). c Growth correction: L = no change or linear change in pool sizes, E = exponential change in pool sizes. d Energy balance indicates that induction of positive or negative energy balance was not part of study protocol.
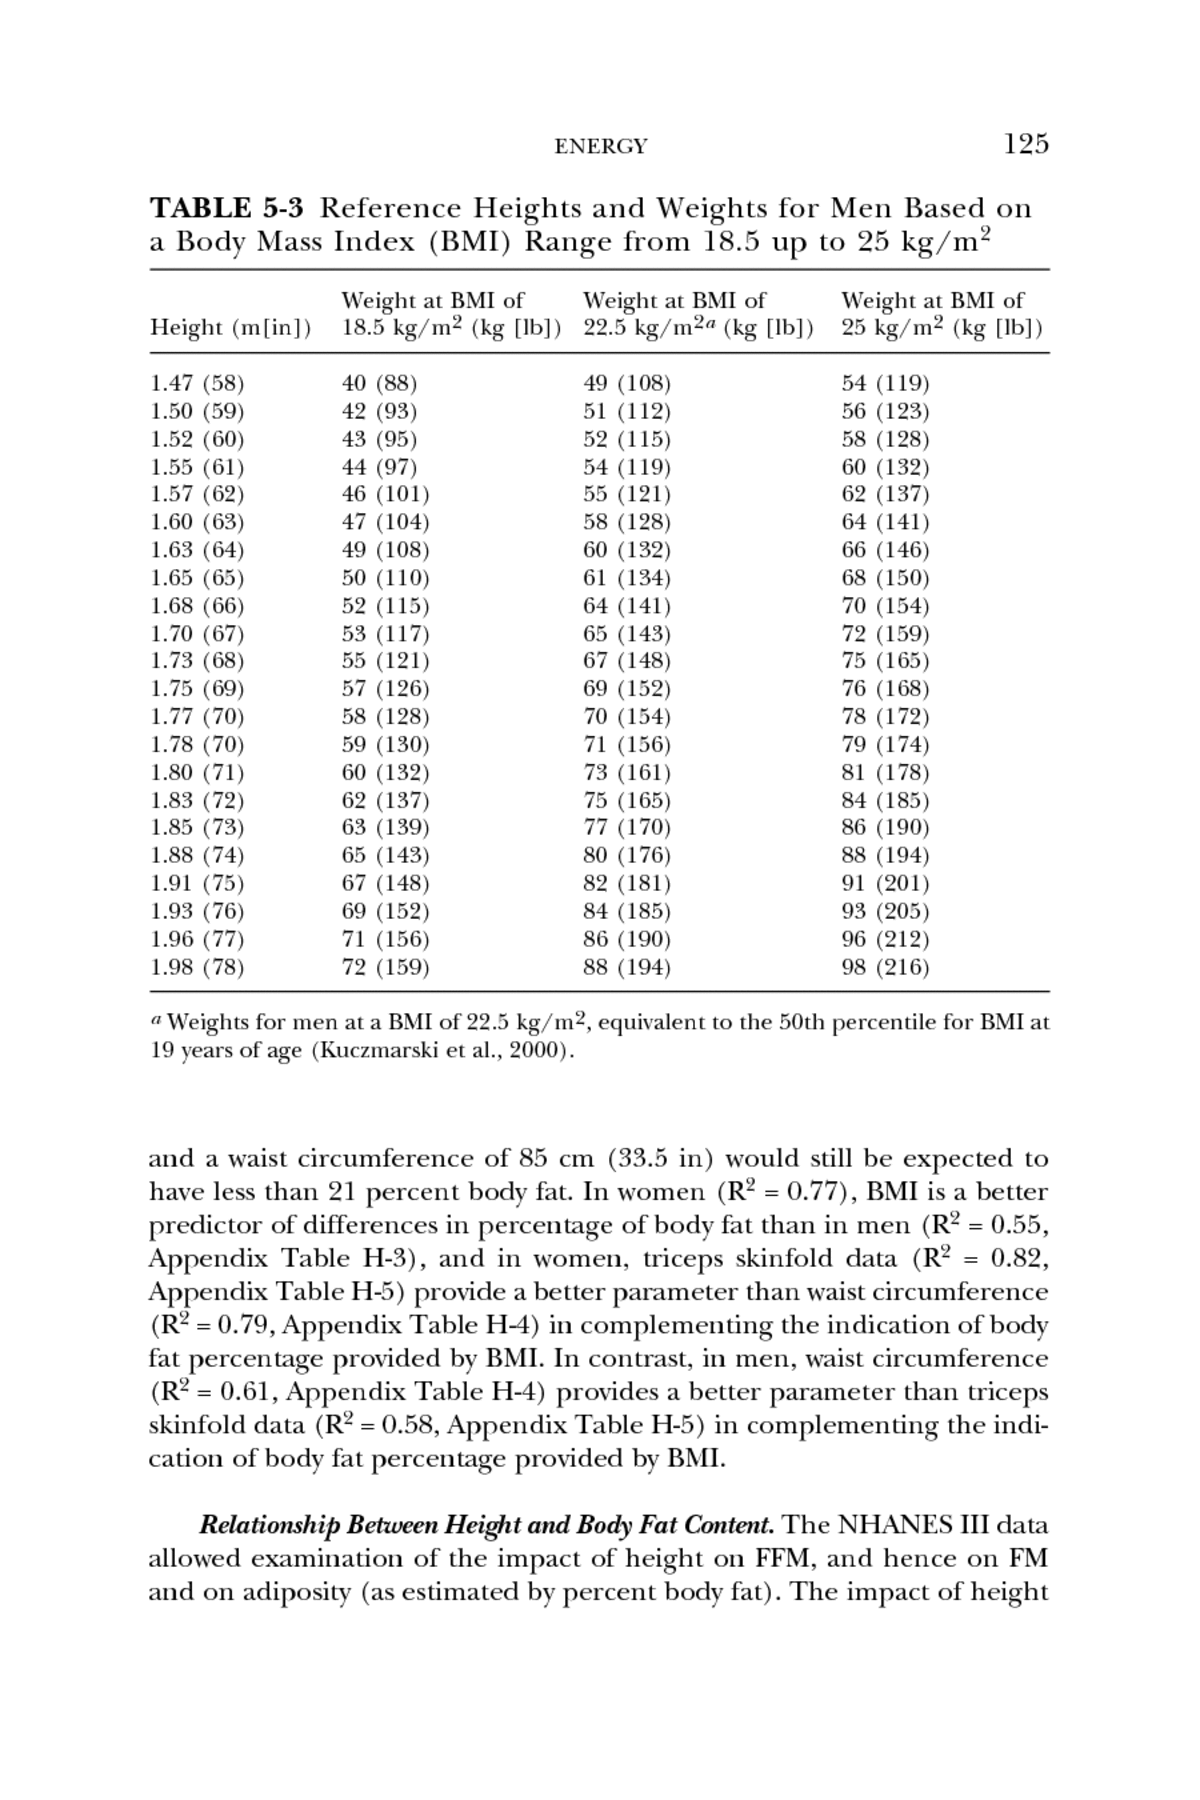
124 DIETARY REFERENCE INTAKES 25 kg/m2, a view adopted in this report. Although the healthy BMI range is the result of a consensus, there are reasons to suggest that slightly differ- ent mortality-based BMI ranges may be appropriate for different popula- tions (NHLBI/NIDDK, 1998). In establishing the 2000 Dietary Guidelines, the U.S. Departments of Agriculture and of Health and Human Services set the âhealthy weightâ upper limit at a BMI of 24.99 kg/m2 for adult men and women because mortality increases significantly beyond this point (USDA/HHS, 2000). Although the incidence of diabetes, hypertension, and coronary heart dis- ease begins to increase even below this cutoff, a BMI of 24.99 kg/m2 is considered a reasonable upper limit of healthy weight. The lower BMI limit of 18.5 kg/m2 is not as well substantiated. The point at which low BMI poses a health risk is poorly defined. The ability to identify persons with low BMIs who are at increased risk for morbidity and mortality is highly nonspecific. Reference Weights. Weights corresponding to BMIs from 18.5 up to 25 kg/m2 are tabulated for adult men and women with heights ranging from 1.47 to 1.98 m in Table 5-3 (men) and Table 5-4 (women). Reference weights used in this report correspond to a BMI of 22.5 kg/m2 for men and a BMI of 21.5 kg/m2 for women, which match the 50th percentile among 19-year-old individuals (Kuczmarski et al., 2000). Relationship Between BMI and Body Fat Content. The Third National Health and Nutrition Examination Survey (NHANES III) data that pro- vide the major anthropometric parameters, including waist circumference, skin-fold measurements, and bioimpedance data for some 15,000 women and men were examined to evaluate the body fat content typical for all BMI values (Appendix Table H-1) and among the 5,700 women and men whose BMIs were from 18.5 up to 25 kg/m2 (Appendix Table H-2). Bioimpedance data were used to calculate percent body fat using equa- tions developed by Sun and coworkers (2003). The regressions of percent body fat versus BMI (Appendix Table H-3) were used to define the percent body fat ranges given in Table 5-5. The multiple regressions of percent body fat versus BMI and waist circumfer- ence (Appendix Table H-4) and of percent body fat versus BMI and tri- ceps skinfold (Appendix Table H-5) were used to construct Figures 5-3 and 5-4. One of the most commonly cited problems encountered in using BMI as a criterion for assessing the presence of excess body fat is that muscular subjects may have a BMI greater than 25 kg/m2 without carrying excess body fat. In such cases, it is helpful to consider waist circumference in addition to BMI. As shown in Figure 5-3, a man with a BMI of 30 kg/m2
125 E NERGY TABLE 5-3 Reference Heights and Weights for Men Based on a Body Mass Index (BMI) Range from 18.5 up to 25 kg/m2 Weight at BMI of Weight at BMI of Weight at BMI of 18.5 kg/m2 (kg [lb]) 22.5 kg/m2a (kg [lb]) 25 kg/m2 (kg [lb]) Height (m[in]) 1.47 (58) 40 (88) 49 (108) 54 (119) 1.50 (59) 42 (93) 51 (112) 56 (123) 1.52 (60) 43 (95) 52 (115) 58 (128) 1.55 (61) 44 (97) 54 (119) 60 (132) 1.57 (62) 46 (101) 55 (121) 62 (137) 1.60 (63) 47 (104) 58 (128) 64 (141) 1.63 (64) 49 (108) 60 (132) 66 (146) 1.65 (65) 50 (110) 61 (134) 68 (150) 1.68 (66) 52 (115) 64 (141) 70 (154) 1.70 (67) 53 (117) 65 (143) 72 (159) 1.73 (68) 55 (121) 67 (148) 75 (165) 1.75 (69) 57 (126) 69 (152) 76 (168) 1.77 (70) 58 (128) 70 (154) 78 (172) 1.78 (70) 59 (130) 71 (156) 79 (174) 1.80 (71) 60 (132) 73 (161) 81 (178) 1.83 (72) 62 (137) 75 (165) 84 (185) 1.85 (73) 63 (139) 77 (170) 86 (190) 1.88 (74) 65 (143) 80 (176) 88 (194) 1.91 (75) 67 (148) 82 (181) 91 (201) 1.93 (76) 69 (152) 84 (185) 93 (205) 1.96 (77) 71 (156) 86 (190) 96 (212) 1.98 (78) 72 (159) 88 (194) 98 (216) a Weights for men at a BMI of 22.5 kg/m2, equivalent to the 50th percentile for BMI at 19 years of age (Kuczmarski et al., 2000). and a waist circumference of 85 cm (33.5 in) would still be expected to have less than 21 percent body fat. In women (R2 = 0.77), BMI is a better predictor of differences in percentage of body fat than in men (R2 = 0.55, Appendix Table H-3), and in women, triceps skinfold data (R2 = 0.82, Appendix Table H-5) provide a better parameter than waist circumference (R2 = 0.79, Appendix Table H-4) in complementing the indication of body fat percentage provided by BMI. In contrast, in men, waist circumference (R2 = 0.61, Appendix Table H-4) provides a better parameter than triceps skinfold data (R2 = 0.58, Appendix Table H-5) in complementing the indi- cation of body fat percentage provided by BMI. Relationship Between Height and Body Fat Content. The NHANES III data allowed examination of the impact of height on FFM, and hence on FM and on adiposity (as estimated by percent body fat). The impact of height
126 DIETARY REFERENCE INTAKES TABLE 5-4 Reference Heights and Weights for Women Based on a Body Mass Index (BMI) Range from 18.5 up to 25 kg/m2 Weight at BMI of Weight at BMI of Weight at BMI of 18.5 kg/m2 (kg [lb]) 21.5 kg/m2a (kg [lb]) 25 kg/m2 (kg [lb]) Height (m[in]) 1.47 (58) 40 (88) 46 (101) 54 (119) 1.50 (59) 42 (93) 48 (106) 56 (123) 1.52 (60) 43 (95) 50 (110) 58 (128) 1.55 (61) 44 (97) 52 (115) 60 (132) 1.57 (62) 46 (101) 53 (117) 62 (137) 1.60 (63) 47 (104) 55 (121) 64 (141) 1.63 (64) 49 (108) 57 (126) 66 (146) 1.65 (65) 50 (110) 59 (130) 68 (150) 1.68 (66) 52 (115) 61 (134) 70 (154) 1.70 (67) 53 (117) 62 (137) 72 (159) 1.73 (68) 55 (121) 64 (141) 75 (165) 1.75 (69) 57 (126) 66 (146) 76 (168) 1.77 (70) 58 (128) 67 (148) 78 (172) 1.78 (70) 59 (130) 68 (150) 79 (174) 1.80 (71) 60 (132) 70 (154) 81 (178) 1.83 (72) 62 (137) 72 (159) 84 (185) 1.85 (73) 63 (139) 74 (163) 86 (190) 1.88 (74) 65 (143) 76 (168) 88 (194) 1.91 (75) 67 (148) 78 (172) 91 (201) 1.93 (76) 69 (152) 80 (176) 93 (205) 1.96 (77) 71 (156) 82 (181) 96 (212) 1.98 (78) 72 (159) 84 (185) 98 (216) a Weights for women at a BMI of 21.5 kg/m2, equivalent to the 50th percentile for BMI at 19 years of age (Kuczmarski et al., 2000). TABLE 5-5 Body Weight Classification by Body Mass Index (BMI) and Body Fat Contenta Body Fat (%)b BMI Range (kg/m2) Classification Men Women From 18.5 up to 25 Normal 13â21 23â31 From 25 up to 30 Overweight 21â25 31â37 From 30 up to 35 Obese 25â31 37â42 35 or higher Clinically obese > 31 > 42 a Developed from regression of percent body fat versus BMI (kg/m2) (Appendix H) using equations by Sun et al. (2003). b Estimated from equations derived from bioimpedence data (Sun et al., 2003).
127 E NERGY MEN 45 40 35 % BF.WC116 % Body Fat % BF.WC102 30 % BF.WC85 % BF.WC75 25 % BF 20 15 10 18 20 22 24 26 28 30 32 34 36 Body Mass Index WOMEN 45 40 35 % BF.WC107 % BF.WC88 30 % Body Fat % BF.WC78 25 % BF.WC71 % BF 20 15 10 18 20 22 24 26 28 30 32 34 36 Body Mass Index FIGURE 5-3 Regressions of percent body fat (% BF) vs. body mass index (BMI) (heavy lines), and vs. BMI relationships (thin lines) for adult men and women with BMI of 18.5 kg/m2 and higher and with a specified waist circumference (WC) in men (WC = 116, 102, 85, or 75 cm) and women (WC = 107, 88, 78, or 71 cm).
128 DIETARY REFERENCE INTAKES 45 40 35 WOMEN 30 % Body Fat 25 20 MEN 15 10 15 20 25 30 35 Body Mass Index FIGURE 5-4 Regressions of percent body fat (% BF) versus body mass index (BMI) (heavy lines) and the % BF versus BMI relationships (thin lines) for adult men and women 19 years and older with BMI 18.5 kg/m2 and higher and with specified triceps skinfold (TSF) thickness in men (TSF = 19.6, 15.8, 11.9, and 6.9 mm) and women (TSF = 30.7, 26.4, 22.2, and 16.7 mm). The ⢠indicates the mean BMI and % BF for men and women with BMIs from 18.5 up to 25 kg/m2 and the indi- cates the mean BMI and % BF values for all men and women estimated in Appen- dix Table H-4. on FFM for various BMI values is shown in Figure 5-5. BEE and REE are correlated with FFM. Yet no correlation can be detected between height and percent body fat in men, whereas in women a negative correlation exists, but with a very small R2 value (0.0026) (Appendix Table H-6). Thus
129 E NERGY MEN 100 90 80 Fat -free Mass and Fat Mass 70 FFM (35) FFM (30) 60 FFM (25) 50 FFM (18.5) FM (35) 40 FM (30) FM (25) 30 FM (18.5) 20 10 0 1.4 1.5 1.6 1.7 1.8 1.9 2.0 Height (m) WOMEN 100 90 80 70 Fat -free Mass and Fat Mass FFM (35) FFM (30) 60 FFM (25) 50 FFM (18.5) FM (35) 40 FM (30) FM (25) 30 FM (18.5) 20 10 0 1.4 1.5 1.6 1.7 1.8 1.9 2.0 Height ( m) FIGURE 5-5 Regression of fat-free mass (FFM) and fat mass (FM) as a function of height in adult men and women with body mass indexes of 18.5, 25, 30, and 35 kg/ m2 (from Appendix H).
130 DIETARY REFERENCE INTAKES in women, as in men, differences in height have very little, if any, impact on adiposity. Children As children grow and develop, linear and ponderal growth do not occur at exactly commensurate rates; consequently, BMI is not constant throughout childhood. In U.S. children, BMI declines and reaches a mini- mum around 4 to 6 years, and then gradually increases through adolescence (Kuczmarski et al., 2000). Therefore, cutoff points to define underweight and overweight must be age- and gender-specific. The revised growth charts for the United States were derived from five national health examination surveys collected from 1963 to 1994 (Kuczmarski et al., 2000). Smoothed curves were developed for infants from birth to 36 months and for chil- dren 2 to 20 years, and BMI charts were developed for boys and girls greater than 2 years of age. Based on these data, the Centers for Disease Control and Prevention (CDC) defined underweight in children as a BMI of less than the 5th percentile. Children are considered to be at risk of overweight when their BMI is greater than the 85th percentile, and over- weight when their BMI is greater than the 95th percentile (Kuczmarski et al., 2000). Data from NHANES III on children 6 years of age and older were not used in the CDC analysis because of the recent rise in obesity among American youth. The most recent data from the NHANES III survey (1988â 1994) (Troiano et al., 1995) show that substantially more than 22 percent of children in the United States now fall into the at-risk-for-overweight category (from the 85th BMI percentile) and more than 10 percent are in the overweight category (from the 95th BMI percentile). Childhood over- weight is associated with several risk factors for later heart disease and other chronic diseases including hyperlipidemia, hyperinsulinemia, hyper- tension, and early arteriosclerosis (Must and Strauss, 1999). Generally, an abnormal anthropometric measure is statistically defined as a value below â2 standard deviations (SD) or Z-scores (less than the 2.3 percentile) or above +2 SD or Z-scores (greater than the 97.7 percentile) relative to the reference mean (WHO Working Group, 1986). Undernutri- tion is defined as below the 3rd percentile for weight-for-length. Similarly, overweight has been defined as above the 97th percentile for weight-for- length. For lengths between the 3rd and 97th percentiles, the median and range of weights defined by the 3rd and 97th weight-for-length percentiles for children 0 to 3 years of age are presented in Tables 5-6 (boys) and 5-7 (girls) (Kuczmarski et al., 2000).
131 E NERGY Reference heights and weights for boys and girls 3 to 18 years of age are given in Tables 5-8 (boys) and 5-9 (girls). Median and range of weights corresponding to the 5th and 85th BMI percentiles are designated for the 3rd and 97th height percentiles. FACTORS AFFECTING ENERGY EXPENDITURE AND REQUIREMENTS Body Composition and Body Size While body size and body weight exert marked effects on energy expenditure, it is still disputed whether differences in body composition quantitatively affect energy expenditure. In adult men and women with moderate levels of body fat (20 to 35 percent), it has been suggested that the relative proportions of fat-free mass (FFM) and of fat mass are unlikely to influence energy metabolism at rest or while physically active in ways other than through their impact on body weight (Durnin, 1996). It is unlikely that body composition to any important extent affects energy expenditure at rest or the energy costs of physical activities among adults with body mass indexes from 18.5 up to 25 kg/m2 (Heymsfield et al., 2002). In adults with higher percentages of body fat composition, mechanical hindrances can increase the energy expenditure associated with certain types of activity. Effects on Basal and Resting Metabolic Rate FFM includes the metabolically active compartments of the body, and the size of the FFM is the major parameter in determining the rate of energy expenditure under fasting basal metabolic rate (BMR) and resting metabolic rate (RMR) conditions. The contribution of FFM and FM to the variability in RMR was examined in a meta-analysis of seven published studies (Nelson et al., 1992). FFM was the single best predictor of RMR, accounting for 73 percent of the variability; FM accounted for only an additional 2 percent. Adjusted for FFM, RMR did not differ between gen- ders, but it did between lean and obese individuals. In another compila- tion of studies, the relationship of RMR to FFM was found to be nonlinear across a wide range of individuals, from infants to adults (Weinsier et al., 1992). RMR/kg of weight or RMR/kg of FFM falls as mass increases because the relative contributions made by the most metabolically active tissues (brain, liver, and heart) decline as body size increases. The decline in BMR with increasing age is to some extent also the consequence of changes in the relative size of organs and tissues (Henry, 2000).
132 DIETARY REFERENCE INTAKES TABLE 5-6 Reference Lengths and Weights for Boys 1 Through 35 Months of Age Based on Median Length and Median Weight for Age Length Range 3rdâ97th Age (mo) Median Length (cm [in]) Percentile (cm [in]) 1 54.7 (21.5) 50.2â59.6 (19.8â23.5) 2 58.1 (22.9) 53.8â63.1 (21.2â24.8) 3 60.8 (23.9) 56.6â65.9 (22.3â25.9) 4 63.1 (24.8) 58.8â68.3 (23.1â26.9) 5 65.2 (25.7) 60.8â70.4 (23.9â27.7) 6 67.0 (26.4) 62.5â72.3 (24.6â28.5) 7 68.7 (27.0) 64.1â74.1 (25.2â29.2) 8 70.2 (27.6) 65.6â75.7 (25.8â29.8) 9 71.6 (28.2) 66.9â77.2 (26.3â30.4) 10 73.0 (28.7) 68.1â78.7 (26.8â31.0) 11 74.3 (29.3) 69.3â80.0 (27.3â31.5) 12 75.5 (29.7) 70.4â81.3 (27.7â32.0) 15 78.9 (31.1) 73.4â84.9 (28.9â33.4) 18 81.9 (32.2) 76.1â88.1 (30.0â34.7) 21 84.7 (33.3) 78.5â91.1 (30.9â35.9) 24 87.2 (34.3) 80.7â93.8 (31.8â36.9) 27 89.6 (35.3) 82.9â96.5 (32.6â38.0) 30 91.8 (36.1) 85.0â99.0 (33.5â39.0) 33 93.8 (36.9) 87.0â101.3 (34.3â39.9) 35 95.1 (37.4) 88.2â102.7 (34.7â40.4) SOURCE: Kuczmarski et al. (2000). Effects on Total Energy Expenditure Factors affecting total energy expenditure (TEE) were examined in a meta-analysis of 13 adult studies (n = 162) (Carpenter et al., 1995). The relationships between weight and TEE were highly variable across studies (z = 0.68; r = 0.18â1.0). Differences in RMR accounted for less than 50 per- cent of the variance in TEE (z = 0.66; r = 0.42â0.89). Adjusted for RMR, TEE was not affected by FM and was lower in women than men. In a separate study, Roberts and Dallal (1998) reported a negative relationship between FM and TEE consistent with the general perception that low physi- cal activity and fat accumulation are correlated. Obesity Another question relevant to the effect of body composition on en- ergy requirements is whether obese individuals taken as a group have al- tered energy requirements, either prior to the development of obesity (in
133 E NERGY Weight Range 3rdâ97th Median Weight (kg [lb]) Percentile (kg [lb]) 4.4 (9.7) 3.2â5.6 (7.0â12.3) 5.3 (11.7) 4.0â6.6 (8.8â14.5) 6.0 (13.2) 4.7â7.6 (10.4â16.7) 6.7 (14.8) 5.3â8.4 (11.7â18.5) 7.3 (16.1) 5.8â9.2 (12.8â20.3) 7.9 (17.4) 6.3â9.8 (13.9â21.6) 8.4 (18.5) 6.8â10.5 (15.0â23.1) 8.9 (19.6) 7.2â11.0 (15.9â24.2) 9.3 (20.5) 7.5â11.5 (16.5â25.3) 9.7 (21.4) 7.8â12.0 (17.2â26.4) 10.0 (22.0) 8.1â12.4 (17.8â27.3) 10.3 (22.7) 8.4â12.7 (18.5â28.0) 11.1 (24.4) 9.1â13.7 (20.0â30.2) 11.7 (25.8) 9.6â14.4 (21.1â31.7) 12.2 (26.9) 10.0â15.0 (22.0â33.0) 12.7 (28.0) 10.4â15.6 (22.9â34.4) 13.1 (28.9) 10.7â16.1 (23.6â35.5) 13.5 (29.7) 11.1â16.7 (24.4â36.8) 13.9 (30.6) 11.4â17.3 (25.1â38.1) 14.2 (31.3) 11.6â17.7 (25.6â39.0) which case they could potentially contribute to weight gain) or following weight stabilization at a high level. The information relating to the former issue is conflicting, as cross-sectional studies consistently show that over- weight and obese individuals have higher absolute values for TEE than nonobese adults, as the effect of high RMR values associated with increased body size generally outweighs the influence of low energy expenditure of physical activity (EEPA) (Platte et al., 1995; Prentice et al., 1996a; Schoeller and Fjeld, 1991). In extremely obese adults, TEE can be as high as 4,500 kcal/d even when the physical activity level is low (where TEE is only 1.5 Ã BEE) (Prentice et al., 1996a). Cross-sectionally, Goran and coworkers (1995a) and Griffiths and Payne (1976) reported significantly lower resting energy expenditure in children born to one or both overweight parents when the children were not themselves overweight. However, others (Davies et al., 1995; Goran et al., 1994b; Treuth et al., 2000), but not all (Roberts et al., 1988), reported no mean difference in energy expenditure between children of lean and overweight parents. While the thermic effect of food (TEF) has not been
134 DIETARY REFERENCE INTAKES TABLE 5-7 Reference Lengths and Weights for Girls 1 Through 35 Months of Age Based on Median Length and Median Weight for Age Length Range 3rdâ97th Age (mo) Median Length (cm [in]) Percentile (cm [in]) 1 53.5 (21.1) 49.3â58.2 (19.4â22.9) 2 56.7 (22.3) 52.4â61.3 (20.6â24.1) 3 59.3 (23.3) 54.8â63.9 (21.6â25.2) 4 61.5 (24.2) 56.9â66.1 (22.4â26.0) 5 63.5 (25.0) 58.7â68.1 (23.1â26.8) 6 65.3 (25.7) 60.4â70.0 (23.8â27.6) 7 66.9 (26.3) 61.9â71.7 (24.4â28.2) 8 68.4 (26.9) 63.4â73.4 (25.0â28.9) 9 69.9 (27.5) 64.7â74.9 (25.5â29.5) 10 71.3 (28.1) 65.9â76.4 (25.9â30.1) 11 72.6 (28.6) 67.1â77.8 (26.4â30.6) 12 73.8 (29.1) 68.3â79.1 (26.9â31.1) 15 77.2 (30.4) 71.4â82.8 (28.1â32.6) 18 80.3 (31.6) 74.3â86.2 (29.3â33.9) 21 83.1 (32.7) 76.8â89.3 (30.2â35.2) 24 85.8 (33.8) 79.2â92.3 (31.2â36.3) 27 88.4 (34.8) 81.6â95.2 (32.1â37.5) 30 90.8 (35.7) 83.7â97.9 (33.0â38.5) 33 92.9 (36.6) 85.7â100.2 (33.7â39.4) 35 94.1 (37.0) 86.9â101.6 (34.2â40.0) SOURCE: Kuczmarski et al. (2000). widely studied in obese children, Tounian and colleagues (1993) reported no difference in TEF values among obese or overweight and normal-weight prepubertal children in contrast to the widespread finding of low TEF in obese adults (Segal et al., 1987, 1990a, 1990b, 1992). In longitudinal studies of preobese adults and children, low RMR in apparently susceptible populations (Pima Indians and those infants of over- weight mothers who themselves gained weight), 24-hour sedentary energy expenditure or TEE predicted excess weight gain over time in some studies (Ravussin et al., 1988; Roberts et al., 1988), but not in one other (Goran et al., 1998c). There are also some studies that investigated apparently susceptible children (i.e., born to overweight parents) in whom weight gain was normal (Davies et al., 1995; Stunkard et al., 1999). In those studies, there was no relationship between TEE and growth rate, further suggesting that TEE is within the normal range in individuals who are apparently suscep- tible to excess weight gain but maintain a normal weight. The combina-
135 E NERGY Weight Range 3rdâ97th Median Weight (kg [lb]) Percentile (kg [lb]) 4.2 (9.3) 3.1â5.2 (6.8â11.5) 4.9 (10.8) 3.7â6.1 (8.1â13.4) 5.5 (12.1) 4.3â6.9 (9.5â15.2) 6.1 (13.4) 4.8â7.6 (10.6â16.7) 6.7 (14.8) 5.3â8.3 (11.7â18.3) 7.2 (15.9) 5.7â8.9 (12.6â19.6) 7.7 (17.0) 6.2â9.5 (13.7â20.9) 8.1 (17.8) 6.5â10.0 (14.3â22.0) 8.5 (18.7) 6.9â10.4 (15.2â22.9) 8.9 (19.6) 7.2â10.9 (15.9â24.0) 9.2 (20.3) 7.5â11.3 (16.5â24.9) 9.5 (20.9) 7.8â11.7 (17.2â25.8) 10.3 (22.7) 8.5â12.7 (18.7â28.0) 11.0 (24.2) 9.1â13.5 (20.0â29.7) 11.6 (25.6) 9.6â14.3 (21.1â31.5) 12.1 (26.7) 10.0â15.0 (22.0â33.0) 12.5 (27.5) 10.3â15.5 (22.7â34.1) 13.0 (28.6) 10.7â16.4 (23.6â36.1) 13.4 (29.5) 11.0â17.1 (24.2â37.7) 13.7 (30.2) 11.2â17.6 (24.7â38.8) tion of these findings from different studies suggests that low energy expenditure is a risk factor for weight gain in a subgroup of individuals susceptible to excess weight gain, but not in all susceptible individuals and not in individuals with a normal level of risk. As such, these data are consis- tent with the general view that obesity is a multifactor problem. The question of whether obese individuals may have decreased energy requirements after weight loss, a factor that would help explain the com- mon phenomenon of weight regain following weight loss, has also been investigated. As reviewed by Saltzman and Roberts (1995), RMR is consis- tently depressed during active weight loss out of proportion to the loss of FFM, but controversy exists over whether RMR remains depressed after weight has stabilized at a lower level. Most of the cross-sectional studies comparing post-obese with never-obese individuals have reported no difference between groups, suggesting no long-term effect of weight loss or susceptibility to depressed RMR in individuals who have been obese (Larson et al., 1995; Saltzman and Roberts, 1995; Weinsier et al., 2000). In
136 DIETARY REFERENCE INTAKES TABLE 5-8 Reference Heights and Weights for Boys 3 Through 18 Years of Age Based on Median Height and Median Weight for Age Height Range 3rdâ97th Age (y) Median Height (m [in]) Percentile (m [in]) 3 0.95 (37.4) 0.88â1.03 (34.6â40.6) 4 1.02 (40.2) 0.94â1.10 (37.0â43.3) 5 1.09 (42.9) 1.00â1.18 (39.4â46.5) 6 1.15 (45.3) 1.06â1.25 (41.7â49.2) 7 1.22 (48.0) 1.12â1.32 (44.1â52.0) 8 1.28 (50.4) 1.17â1.39 (46.1â54.7) 9 1.34 (52.8) 1.22â1.45 (48.0â57.1) 10 1.39 (54.7) 1.26â1.51 (49.6â59.4) 11 1.44 (56.7) 1.31â1.57 (51.6â61.8) 12 1.49 (58.7) 1.35â1.63 (53.1â64.2) 13 1.56 (61.4) 1.41â1.71 (55.5â67.3) 14 1.64 (64.6) 1.48â1.79 (58.3â70.5) 15 1.70 (66.9) 1.54â1.84 (60.6â72.4) 16 1.74 (68.5) 1.59â1.87 (62.6â73.6) 17 1.75 (68.9) 1.61â1.89 (63.4â74.4) 18 1.76 (69.3) 1.62â1.89 (63.8â74.4) SOURCE: Kuczmarski et al. (2000). TABLE 5-9 Reference Heights and Weights for Girls 3 Through 18 Years of Age Based on Median Height and Median Weight for Age Height Range 3rdâ97th Age (y) Median Height (m [in]) Percentile (m [in]) 3 0.94 (37.0) 0.87â1.01 (34.3â39.8) 4 1.01 (39.8) 0.93â1.09 (36.6â42.9) 5 1.08 (42.5) 0.99â1.17 (39.0â46.1) 6 1.15 (45.3) 1.06â1.25 (41.7â49.2) 7 1.21 (47.6) 1.12â1.32 (44.1â52.0) 8 1.28 (50.4) 1.17â1.39 (46.1â54.7) 9 1.33 (52.4) 1.22â1.45 (48.0â57.1) 10 1.38 (54.3) 1.26â1.51 (49.6â59.4) 11 1.44 (56.7) 1.30â1.58 (51.2â62.2) 12 1.51 (59.4) 1.37â1.65 (53.9â65.0) 13 1.57 (61.8) 1.44â1.70 (56.7â66.9) 14 1.60 (63.0) 1.48â1.73 (58.3â68.1) 15 1.62 (63.8) 1.50â1.74 (59.1â68.5) 16 1.63 (64.2) 1.50â1.75 (59.1â68.9) 17 1.63 (64.2) 1.51â1.75 (59.4â68.9) 18 1.63 (64.2) 1.51â1.75 (59.4â68.9) SOURCE: Kuczmarski et al. (2000).
137 E NERGY Weight Range 3rdâ97th Median Weight (kg [lb]) Percentile (kg [lb]) 14.3 (31.5) 11.8â17.9 (26.0â39.4) 16.2 (35.7) 13.2â20.9 (29.1â46.0) 18.4 (40.5) 14.8â24.3 (32.6â53.5) 20.7 (45.6) 16.4â28.1 (36.1â61.9) 23.1 (50.9) 18.2â32.3 (37.9â67.2) 25.6 (56.4) 20.0â37.2 (44.1â81.9) 28.6 (63.0) 22.0â42.8 (48.5â94.3) 31.9 (70.3) 24.1â49.1 (53.1â108.1) 35.9 (79.1) 26.5â56.0 (58.4â123.3) 40.5 (89.2) 29.3â63.0 (64.5â138.8) 45.6 (100.4) 32.8â70.0 (72.2â154.2) 51.0 (112.3) 36.9â76.7 (81.3â168.9) 56.3 (124.0) 41.3â83.0 (91.0â182.8) 60.9 (134.1) 45.6â88.7 (100.4â195.4) 64.6 (142.3) 49.2â93.6 (108.4â206.2) 67.2 (148.0) 51.6â97.1 (113.7â213.9) Weight Range 3rdâ97th Median Weight (kg [lb]) Percentile (kg [lb]) 13.9 (30.6) 11.3â17.9 (24.9â39.4) 15.8 (34.8) 12.7â21.1 (28.0â46.5) 17.9 (39.4) 14.3â24.8 (31.5â54.6) 20.2 (44.5) 15.9â28.7 (35.0â63.2) 22.8 (50.2) 17.7â33.2 (39.0â73.1) 25.6 (56.4) 19.5â38.3 (43.0â84.4) 29.0 (63.9) 21.5â44.3 (47.4â97.6) 32.9 (72.5) 23.9â51.1 (52.6â112.6) 37.2 (81.9) 26.7â58.4 (58.8â128.6) 41.6 (91.6) 29.9â65.6 (65.9â144.5) 45.8 (100.9) 33.3â72.1 (73.3â158.8) 49.4 (108.8) 36.6â77.5 (80.6â170.7) 52.0 (114.5) 39.5â81.5 (87.0â179.5) 53.9 (118.7) 41.7â84.3 (91.9â185.7) 55.1 (121.4) 43.3â86.1 (95.4â189.6) 56.2 (123.8) 44.2â87.4 (97.4â192.5)
138 DIETARY REFERENCE INTAKES contrast, most longitudinal studies following individuals over the course of weight loss and subsequent weight stabilization have observed low RMR after adjusting for body composition change (Saltzman and Roberts, 1995). Notable exceptions to the latter conclusion are from studies of Amatruda and colleagues (1993) and Weinsier and colleagues (2000), which compared individuals longitudinally over the course of weight loss with a cross- sectional, never-obese control group. In these studies, there was no signifi- cant difference in TEE among the groups after adjusting for body compo- sition. The combination of these data from different types of studies does not permit any general conclusion at the current time, and further studies in this area are needed. Physical Activity The impact of physical activity on energy expenditure is discussed briefly here and in more detail in Chapter 12. EEPA is the most variable component of TEE (Schoeller, 2001). Given that the basal oxygen (O2) consumption rate of adults is approximately 250 mL/min, and that athletes such as elite marathon runners can sustain O2 consumption rates of 5,000 mL/min, the scale of metabolic responses to exercise varies over a 20-fold range. The increase in energy expenditure elicited while physical activities take place accounts for the largest part of the effect of physical activity on overall energy expenditure, which is the product of the cost of particular activities and their duration (see Table 12-1 for examples of the energy cost of typical activities). Recent studies have focused on using doubly labeled water to quantify the effects of physical activity on TEE. In cross-sectional studies, there is a substantial difference in physical activity level (PAL) between long-term exercising women and sedentary women. For example, Withers and co- workers (1998) observed a mean PAL value of 2.48 in long-term active women reporting a mean of 8.6 h/wk of aerobic exercise compared with a mean PAL value of 1.87 in nonexercisers. Intensive exercise programs such as those undertaken by subjects training to run a half-marathon and requiring 8 to 10 h/wk of strenuous exercise can also effect a substantial 15 to 50 percent increase in TEE in both adults and children (Eliakim et al., 1996; Goran et al., 1994a; Westerterp et al., 1992). However, more moderate exercise programs are reported to have a much smaller effect, with two studies (one in children and one in elderly individuals) reporting no significant increase in TEE (Goran and Poehlman, 1992; Treuth et al., 1998b). This lack of effect of a moderate increase in planned physical activity on TEE emphasizes the fact that intentional and spontaneous en- ergy expenditures are interrelated. In some circumstances an increase in
139 E NERGY one component may be balanced by a decrease in another, so that TEE remains relatively unaffected. Effect of Exercise on Postexercise Energy Expenditure In addition to the immediate energy cost of individual activities, physi- cal activity also affects energy expenditure in the post-exercise period. Excess postexercise O2 consumption depends on exercise intensity and duration as well as other factors, such as environmental temperatures, state of hydration, and degree of trauma, demonstrable sometimes up to 24 hours after exercise (Bahr et al., 1987; Benedict and Cathcart, 1913; Bielinski et al., 1985; Gaesser and Brooks, 1984). In one study, residual effects of exercise could be seen following 15 hours of exercise, but not after 30 hours (Herring et al., 1992). However, a significant decrease in RMR over 3 days following cessation of training in athletes has been observed (Tremblay et al., 1988). There may also be chronic changes in energy expenditure associated with regular physical activity as a result of changes in body composition and alterations in the metabolic rate of muscle tissue, neuroendocrine status, and changes in spontaneous physical activity associated with altered levels of fitness (van Baak, 1999; Webber and Macdonald, 2000). However, the magnitude and direction of change in energy expenditure associated with these factors remain controversial due to the variable effects of exer- cise on the coupling of oxidative phosphorylation in mitochondria, on ion shifts, on substrates, and on other factors (Gaesser and Brooks, 1984). Since FFM is the major predictor of BMR and RMR, increases in FFM due to increased physical activity would be expected to increase BMR or RMR. However, three studies reported no measurable increase in BMR or RMR with increased physical activity (Bingham et al., 1989; Tremblay et al., 1990; Treuth et al., 1998b). This may be explained by the fact that energy expenditure in resting muscle is relatively low, accounting for only 20 to 25 percent of RMR even though muscle constitutes some 75 percent of the body cell mass (Moore, 1963). Spontaneous Nonexercise Activity Spontaneous nonexercise activity has been reported to be quantita- tively important, accounting for 100 to 700 kcal/d, even in subjects resid- ing in a whole-body calorimeter chamber (Ravussin et al., 1986). Sitting without or with fidgeting raises energy expenditure by 4 or 54 percent respectively, compared to lying supine (Levine et al., 2000), whereas stand- ing motionless or while fidgeting raised energy expenditure by 13 or 94 percent, respectively. The impact of fidgeting was positively correlated with
140 DIETARY REFERENCE INTAKES body weight while standing, but not while sitting. (For comparison, walking at speeds of 2 or 3 mph increases energy expenditure by 150 or 230 per- cent, respectively.) It is not known to what extent spontaneous nonexercise activity is affected by intentional physical activity and by its intensity. Shah and coworkers (1988) reported a 5 percent mean increase in 24-hour TEE with a program of moderate exercise (walking) compared with a 3 percent increase with an equivalent amount of strenuous aerobic training. This suggests that the subjects had lower levels of spontaneous movement after strenuous exercise because they were more tired. In con- trast, Schulz and coworkers (1991) reported no difference in sedentary 24-hour TEE between aerobically fit and sedentary individuals, and Pacy and coworkers (1996) showed no differential effect of moderate versus strenuous activity on 24-hour TEE after accounting for the energy costs of the exercise itself. On the other hand, Van Etten and colleagues (1997) showed no significant increase in 24-hour TEE with a standardized exercise program beyond that immediately associated with the exercise program. Similarly, Blaak and coworkers (1992) reported no measurable change in spontaneous physical activity in obese boys enrolled in an exercise-training program. The combination of these different results indicates that the effects of planned physical activity on activity at other times are highly variable (ranging from overall positive to negative effects on overall energy expen- diture). This most likely depends on a number of factors, including the nature of the exercise (strenuous versus moderate), the initial fitness of the subjects, body composition, and gender. Gender There are substantial data on the effects of gender on energy expendi- ture throughout the lifespan. In adult premenopausal women, the majority of studies show that RMR, BMR, or sleeping metabolic rate (SMR) is slightly increased in the luteal phase of the menstrual cycle compared to the follicular phase (Bisdee et al., 1989; Hessemer and Bruck, 1985; Meijer et al., 1992; Melanson et al., 1996; Solomon et al., 1982), but two studies reported no increase in the luteal phase compared to the follicular phase (Howe et al., 1993; Piers et al., 1995a). However, Howe and colleagues (1993) reported that both sleeping metabolic rate and sedentary 24-hour TEE were significantly increased. Twenty-four hour sedentary TEE (mea- sured in a whole-body calorimeter) was increased in the luteal phase com- pared to the follicular phase in two studies (Ferraro et al., 1992; Howe et al., 1993), whereas Bisdee and colleagues (1989) found no significant change.
141 E NERGY Because of the weight of evidence indicating cyclical changes in BMR and perhaps also sedentary 24-hour TEE in premenopausal adult women, studies of 24-hour TEE have necessarily adjusted or averaged for stage of the menstrual cycle when comparing men and women. In such adjusted studies, two studies reported lower 24-hour sedentary TEE in women com- pared to men after adjusting for FFM and FM (Dionne et al., 1999; Ferraro et al., 1992), while one study reported no significant gender effect in adjusted data (Klausen et al., 1997). DLW data show a 16 percent lower TEE in women than men after controlling for FFM (Carpenter et al., 1998). This was partly accounted for by lower RMR and partly by other factors (presumably lower EEPA). Finally, menopause has also been associated with decreased RMR and EEPA and increased FM in women receiving no hormone replacement therapy (Poehlman et al., 1995). Thus, the question of whether the hormonal differences between pre- menopausal women and men are responsible for the observed differences in TEE, or whether they are a secondary consequence of differences in body composition remain uncertain. Although most of the above studies adjusted data for gender differences in FFM and FM, it was not possible to adjust for differences in the make-up of FFM (the contribution made by different tissues and organs). It is recognized that different body tissues have different metabolic rates, with brain and organ tissues having the highest values and muscle and adipose tissues having the lowest values (FAO/WHO/UNU, 1985). Therefore, it is possible that the lower RMR in women compared to men is due to a different balance of organ and brain tissue and skeletal muscle, rather than lower energy expenditure per unit of individual tissues. Further studies are needed to address this issue. Two of three studies investigating differences in prepubertal children reported that girls have lower values for REE than boys when adjusted for differences in body composition (Goran et al., 1994b, 1995b). The one study that reported no gender effect on REE in prepubertal children (Grund et al., 2000) used imprecise methods for assessing body composi- tion. A separate longitudinal study (Goran et al., 1998a) reported a fall-off in TEE prior to puberty in girls but not boys. Because commonly used BMR equations are based on body weight (Henry, 2000; WN Schofield, 1985), differences in BMR between genders are due both to the greater level of body fatness in women and to dif- ferences in the RMRâFFM relationship. These differences are ultimately reflected by lower numerical coefficients for height and weight in women compared with men in various equations to predict basal energy expendi- ture (BEE), or for weight and height when both variables are considered to predict BEE and TEE.
142 DIETARY REFERENCE INTAKES Growth In infants and children, the energy requirement includes the energy associated with the deposition of tissues at rates consistent with good health. Although the energy requirement for growth relative to mainte- nance is low, except for the first months of life, satisfactory growth is a sensitive indicator of whether energy needs are being met. The energy cost of growth as a percentage of total energy requirements decreases from around 35 percent at 1 month to 3 percent at 12 months of age, and remains low until the pubertal growth spurt, at which time it increases to about 4 percent (Butte, 2000). Growth is most impressive during infancy. Infants double their birth weight by 6 months of age, and triple it by 12 months (Butte et al., 2000a). At birth, the newborn is about 11 percent body fat. Progressive fat deposi- tion in the early months results in a peak in the percentage body weight that is fat at 3 to 6 months (about 31 percent) and body fatness sub- sequently declines to an average of 27 percent at 12 months (Butte et al., 2000a). During infancy and childhood, girls grow slightly slower than boys, and girls have slightly more body fat (Butte et al., 2000a). During adoles- cence the gender differences in body composition are accentuated (Ellis, 1997; Ellis et al., 1997; Forbes, 1987; Tanner, 1955). Adolescence in boys is characterized by rapid acquisition of FFM and a modest increase in FM in early puberty, followed by a decline. FFM accretion coincides with the rapid spurt in height, though height gain may also continue until 20 to 25 years of age. Adolescence in girls is characterized by a modest increase in FFM and a continual accumulation of FM. The pubertal increase in FFM ceases at about 18 years, following the decrease in the rate of height gain after menarche (Forbes, 1987; Tanner, 1955). Growth velocity is a sensitive indicator of energy status and use of growth velocity charts will detect growth faltering earlier than detected using attained growth charts. There is a wide range of variation in the growth rate of infants and children. Growth occurs in spurts, even in healthy children. Problems with measurement precision and high variabil- ity in individual growth rates over short time periods complicate the inter- pretation of growth velocity data. The timing of the adolescent growth spurt, which typically lasts 2 to 3 years, is also very variable, with the onset typically between 10 and 13 years of age in the majority of children (Forbes, 1987; Tanner, 1955). In general, weight velocity reflects acute episodes of dietary intake, whereas length velocity is affected by chronic factors.
143 E NERGY Older Age All three major components of energy expenditure decrease with aging: RMR, TEF, and EEPA. There is an average decline in BMR of 1 to 2 per- cent per decade in men who maintain constant weight (Keys et al., 1973). The suggested breakpoint for a more rapid decline apparently occurs around 40 years of age in men and 50 years of age in women (Poehlman, 1992, 1993). For women, this may be due to an accelerated loss of FFM during menopause (Svendsen et al., 1995). In addition to the loss of FFM being a cause of age-associated decline in RMR, several (Fukagawa et al., 1990; Klausen et al., 1997; Pannemans and Westerterp, 1995; Poehlman et al., 1991; Roberts et al., 1995; Vaughan et al., 1991; Visser et al., 1995), though not all (Tzankoff and Norris, 1977), studies suggest that RMR adjusted for the change in FFM is decreased by about 5 percent in older adults compared to younger adults. However, in individuals who gain significant amounts of weight as they get older, RMR may actually increase due to gains of FM and FFM. There is evidence suggesting that the RMR response to changes in energy balance may be attenuated in old versus young adults (Roberts and Dallal, 1998). The primary connection between RMR changes with age and FFM is also emphasized by research showing that endurance training (which increases FFM) increases RMR in elders (Poehlman and Danforth, 1991). Concerning TEF, some studies report a decrease with aging (Golay et al., 1982; Morgan and York, 1983; Schutz et al., 1984; Schwartz et al., 1990; Thorne and Wahren, 1990), while other studies report no change or a nonsignificant increase (Bloesch et al., 1988; Fukagawa et al., 1991; Melanson et al., 1998; Poehlman et al., 1991; Tuttle et al., 1953; Visser et al., 1995). Although this controversy cannot currently be resolved, a sug- gested explanation is that TEF does not decline with aging per se, but that some studies may have included subjects with factors that decrease TEF independent of aging, such as obesity and digestive problems that limit nutrient absorption (Melanson et al., 1998). PAL has been shown to decrease progressively with age and is lower in elderly adults compared to young adults (Roberts et al., 1992). Twenty- four-hour sedentary TEE measured in a whole-body calorimeter is also lower in elderly subjects compared with young adults (Vaughan et al., 1991). However, in whole body calorimeter protocols in which sedentary activity protocols were standardized, TEE did not differ between young and old adults (Pannemans et al., 1995). The apparent decline in EEPA is consistent with the reported decreased frequency of strenuous physical activities in elderly men (Roberts, 1996). In addition, the decrease in TEE with age closely parallels the increase in
144 DIETARY REFERENCE INTAKES FM (Roberts and Dallal, 1998). However, the extent to which the increase in FM with age is a consequence or a cause of the age-related decrease in EEPA is not known. In relation to this observation, it should be noted that some elderly individuals clearly are able to maintain very high levels of TEE; Withers and coworkers (1998) report PAL values of 2.48 among older women with routine exercise habits compared to 1.87 in nonexercising women. However, mean maximal oxygen consumption declines 0.70 to 1 percent/y after age 35 in both sedentary adults and active adults (Suominen et al., 1977). Further studies are needed to determine the extent to which EEPA can be maintained in older adults in the general population. Genetics Energy requirements vary substantially between individuals due to combinations of differences in body size and composition, differences in RMR independent of body composition, differences in TEF, and differ- ences in physical activity and in EEPA. All of these determinants of energy requirements are potentially influenced by genetic inheritance, with trans- missible and nontransmissible cultural factors contributing to variability as well. Currently there is insufficient research data to predict differences in energy requirements among specific genetic groups, but as data accumu- late this may become possible. The effects of genetic inheritance on body composition are well known, with most studies reporting that 25 to 50 percent of interindividual vari- ability in body composition can be attributed to genetic factors (Bouchard and Perusse, 1993). Because FFM and FM are major determinants of both RMR and TEE (Roberts and Dallal, 1998), these genetic influences on FFM and FM must be expected to influence energy requirements. In addition to genetic influences on energy requirements mediated by genetic influences on body composition, there also appear to be genetic influences on TEE independent of body composition. Bogardus and co- workers (1986) reported a significant familial (intra-family) influence on RMR independent of FFM, age, and gender. Although the origin of this familial association is not currently known, it may potentially be due to differences in the relative sizes of FFM components (e.g., muscle, brain, organs) because recent work has suggested that organ size determined by magnetic resonance imaging strongly predicts RMR (Illner et al., 2000). In addition, Bouchard and coworkers (1989) reported that about 40 percent or more of the variances in RMR, TEF, and the energy costs of low-to- moderate intensity exercise are explained by inherited characteristics. The same group also reported that there is a genetic component to the weight- gain response to 1,000 kcal/d of overfeeding (Bouchard et al., 1990).
145 E NERGY The question of which specific genes underlie genetic differences in TEE components is starting to be addressed, but few data are yet available. Valve and coworkers (1998) reported that polymorphisms within the UCP1 gene had no effect on BMR, but a combination of polymorphisms in the UCP1 and β3-adrenergic receptor genes were associated with a significant 79 kcal/d decrease in BEE. Klannemark and coworkers (1998) reported no association between polymorphisms in the UCP2 gene and BMR, while Astrup and coworkers (1999) reported significant associations of these polymorphisms with TEE determined in a whole-body calorimeter and adjusted for FFM. The study of Astrup and coworkers (1999) suggesting an association of specific gene polymorphisms with sedentary TEE is also consistent with the work of Heitmann and coworkers (1997) suggesting genetic influences on voluntary physical activity. Since EEPA is the major variable component of TEE, it is likely that genetic influences on EEPA may contribute sub- stantially to intra-individual variability in TEE. Further work in this area is needed. Ethnicity African Americans and Caucasians Most (Albu et al., 1997; Carpenter et al., 1998; Forman et al., 1998; Foster et al., 1997, 1999; Jakicic and Wing, 1998; Weyer et al., 1999a), but not all (Kushner et al., 1995; Nicklas et al., 1997), studies comparing RMR, BMR, or SMR between African-American and Caucasian adults have reported that RMR or SMR, adjusted for differences in body composition, are significantly lower in African Americans by about 10 percent. Foster and colleagues (1999) reported that the decrease in RMR with weight loss (adjusted for body composition change) is greater in African-American women than in Caucasian women, with weight loss of the African- American women in that study less than that of the Caucasian women. Similarly, the majority of studies reported lower RMR or BMR adjusted for body composition in African-American children than in Caucasian children (Kaplan et al., 1996; Morrison et al., 1996; Treuth et al., 2000; Wong et al., 1999; Yanovski et al., 1997); only one study found no differ- ence between groups (Sun et al., 1998). In addition, free-living EEPA, measured using the DLW method, appears to be lower in African-American compared to Caucasian individuals by about 10 to 20 percent (Carpenter et al., 1998; Kushner et al., 1995). These studies are consistent with the reports of lower levels of reported physical activity in African-American versus Caucasian adults (Washburn et al., 1992) and also lower maximal oxygen consumption (Vo2max)
146 DIETARY REFERENCE INTAKES (Hunter et al., 2000). However, 24-hour sedentary TEE measured by whole- body calorimetry was not significantly different between African-American and Caucasian groups (Weyer et al., 1999a). In children, EEPA adjusted for body composition was reported to be lower in African Americans than Caucasians (Wong et al., 1999). This finding is consistent with another study (Trowbridge et al., 1997) showing a 15 percent lower Vo2max in African-American compared with Caucasian children. However, another DLW study observed no significant difference in TEE or EEPA between African-American and Caucasian children (Sun et al., 1998). Further studies in this area are needed. The combination of data from these studies in adults and children indicate that BMR is usually lower in African Americans compared to Caucasians. Currently, insufficient data exist to create prediction equa- tions for BMRs in African-American adults that would be accurate for both males and females throughout the life stages. In this report, therefore, the general prediction equations are used for all races, recognizing their potential to overestimate BMR in some groups such as African Americans. Other Ethnic Groups In addition to African Americans and Caucasians, other ethnic groups have been investigated for potential differences in energy requirements. In Pima Indians, an ethnic group widely considered to have a form of genetic obesity, RMR or SMR is not different from RMR or SMR in Caucasians after adjustment for body composition (Fontvieille et al., 1992; Weyer et al., 1999b). Similarly, physical activity levels were not different between Pima Indian and Caucasian children (Salbe et al., 1997), although the same group observed that spontaneous physical activity is a familial trait (Zurlo et al., 1992). Mohawk Indian children were reported to have higher values for TEE than Caucasian children, due to high levels of EEPA (Goran et al., 1995b). Thus, there are currently insufficient data to define specific differences in energy requirements between different racial groups and more research is needed in this area. Environment Climate In the United States and Canada, indoor temperatures are typically controlled to remain within the 20°C to 25°C (68°F to 77°F) range during winter, and are frequently maintained to within a similar range in summer (EPA, 1991). In addition, most individuals intentionally create a relatively consistent temperature microenvironment for themselves by using more
147 E NERGY insulating clothing in cold weather and cooler clothes in hot weather. The question of whether normal variations in ambient temperature influence energy requirements is therefore complex. Potential effects of ambient temperature on energy requirements include the postprandial and postabsorptive metabolic rate (which would also include energy expenditure for shivering and nonshivering thermo- genesis), the amount and types of voluntary and required physical activity, and EEPA. Ambient temperature effects are probably only significant when there is prolonged exposure to substantial cold or heat. The energy cost of work was judged to be 5 percent greater in a cold environment as com- pared to a warm environment (Consolazio et al., 1963). There can also be an additional energy cost (2 to 5 percent) of both the increased weight of clothing worn and the hobbling effect of that clothing in cold weather compared with clothing worn in warm weather (Consolazio et al., 1963). In addition, temperatures low enough to induce shivering or increased muscular activity will increase energy needs because of the increase in mechanical work (Timmons et al., 1985). More recent work also suggests that the recognized increase in energy expenditure in markedly cold cli- mates may be greater in physically active individuals than in sedentary ones (Armstrong, 1998). High ambient temperatures may also increase energy requirements. There is an increase in the energy expenditure of standard tasks when ambient temperatures are very high (Consolazio et al., 1963). However, this increase in energy expenditure may be attenuated by continued expo- sure. Garby and colleagues (1990) reported that the extra energy expendi- ture for 2 hours of light activity at 34°C fell progressively a total of 3 to 8 percent with acclimatization over 8 days of the study compared with activity at 20°C to 24°C. Relative to high-normal ambient temperatures (26°C to 28°C), low- normal ambient temperatures (20°C to 22°C) were associated with increased sedentary TEE values in lean female subjects (Blaza and Garrow, 1983; Dauncey, 1981). More recent studies have reported a significant effect of variations in ambient temperature within the usual range on energy requirements. Lean and colleagues (1988) reported a 4 percent increase in the sleeping metabolic rate of women at an ambient tempera- ture of 22°C compared with 28°C. Warwick and Busby (1990) reported a 5 percent increase in sedentary TEE at 20°C in men and women wearing clothing of their own choice and performing a standardized pattern of physical activity compared with similar activity at 28°C. Buemann and co- workers (1992) reported a significant 2 percent increase in TEE at 16°C compared with 24°C (with no difference in response seen between post- obese and normal women). Men showed a significant increase in sedentary TEE at the lowest (20°C) and highest (30°C) temperatures studied com-
148 DIETARY REFERENCE INTAKES pared to temperatures in the middle range (23°C and 26°C) (Valencia et al., 1992). This study also confirmed earlier findings (Nielsen, 1987) that humidity did not significantly affect RMR. These data consistently suggest that low-normal temperatures (20°C to 22°C) and high-normal tempera- tures (28°C to 30°C) are associated with an increase in sedentary TEE of 2 to 5 percent compared to temperatures of 24°C to 27°C. This conclusion is also consistent with the report of Lanzola and colleagues (1990) that skin temperature closely predicts BMR in normal individuals. A summary of changes in BMR among individuals migrating between the tropic and temperate climates has demonstrated that changes in ambi- ent temperature do not produce a long-term change in metabolic rate (Hayter and Henry, 1993). Instead, the effect of ambient temperature appears to be confined to the period of time during which the ambient temperature is altered. Nevertheless, the energy expenditure response to cold temperatures may be enhanced with previous acclimatization by pro- longed exposure to a cool environment (Kashiwazaki et al., 1990). The question of whether there are gender differences in the apparent increase in sedentary TEE at low-normal ambient temperatures compared to high-normal temperatures remains uncertain. In a re-analysis of the data of Warwick and Busby (1990), Murgatroyd and coworkers (1990) reported that the increase in sedentary TEE was only statistically signifi- cant in women, raising the question of whether women may be more responsive to low-normal ambient temperatures than men. Since most of the recent data has been collected in women, further research in this area is needed. In addition to the effects of normal variations in ambient temperature on sedentary TEE, there may also be season-related influences on the amount of voluntary physical activity and EEPA, but these potential effects are less well defined. Burstein and coworkers (1996) reported a nonsignifi- cant increase in TEE in soldiers participating in an intense exercise regi- men in winter compared to summer. There was also no significant differ- ence in season-related values for physical activity in free-living adult Dutch women, but in contrast to the values reported above for soldiers, the values tended to be higher in summer than in winter (van Staveren et al., 1986). However, unlike these nonsignificant effects of season and temperature on TEE in adults, children were reported to have significantly greater TEE in the spring than in the fall (Bitar et al., 1999; Goran et al. 1998b). The combination of these results indicates that there is a modest 2 to 5 percent increase in sedentary TEE at low-normal ambient temperatures compared to high-normal ambient temperatures. However, it is not pos- sible to generalize these results to seasonal effects on TEE because of the potentially important and variable impact of seasonal changes in physical activity that are likely dependent on local temperature fluctuations and
149 E NERGY cultural factors. For this reason, no specific allowance is made for ambient temperature in the requirements for energy. It should also be noted that the TEE values used to predict the energy requirements of different groups were made throughout the year, and can be considered values averaged for the ambient temperatures of the different seasons. Altitude Hypoxia increases glucose utilization whether measurements are made on isolated muscle tissue (Cartee et al., 1991), tissues in situ (Zinker et al., 1995), or intact functioning individuals (Brooks et al., 1991, 1992). The hypobaric hypoxia of high altitude increases BMR and TEE but it is unclear at which heights the effect becomes prominent. A study on men at 4,300 m (14,100 ft) found an increase in BMR of about 200 to 500 kcal/d when energy intakes were maintained (Butterfield et al., 1992). However, in a subsequent study on women, the effect of altitude on raising BMR and TEE was less prominent (Mawson et al., 2000). Adaptation and Accommodation There are two key differences between nutritional adaptation and accommodation (Waterlow, 1999). First, while adaptation implies mainte- nance of essentially unchanged functional capacity in spite of some alter- ation in steady-state conditions, accommodation allows maintenance of adequate functional capacity under altered steady-state conditions. Second, whereas accommodation involves relatively short-term adjustments, such as the responses needed to maintain homeostasis, adaptation involves changes in body composition that occur over a more extended period of time. Adaptation The term adaptation describes the normal physiological responses of humans to different environmental conditions. A good example of adapta- tion is the increase in hemoglobin concentration that occurs when indi- viduals live at high altitudes (Leon-Velarde et al., 2000). Energy balance is regulated by a complex set of feedback mechanisms. Changes in energy intake or in energy expenditure trigger metabolic and behavioral responses aimed at restoring energy balance in adults. These responses involve the endocrine system, the central nervous system, and the body energy stores. When effective, these regulatory mechanisms result in the maintenance of a stable body weight (Jequier and Tappy, 1999). The estimation of energy requirements from energy expenditure implicitly assumes that the efficiency of energy utilization is more or less
150 DIETARY REFERENCE INTAKES uniform across all individuals. Otherwise, individuals with higher efficiency would require less energy for equal energy expenditure than persons with lower efficiency. The experimental data supports the notion that differ- ences in efficiency of energy utilization among healthy individuals living under similar conditions fluctuate within a narrow range (James et al., 1990; Waterlow et al., 1989). Body weight can be remarkably stable in many healthy adults, demon- strating the human potential for maintaining energy balance and stable body composition in spite of conditions that have promoted the recent secular trends in increasing body weights. Maintenance of stable body weight and composition are affected by genetic factors, energy intake, and diet composition, as well as by other environmental factors (Hill and Peters, 1998). Environmental conditions favoring high energy consump- tion and low physical activity can overwhelm these mechanisms and lead to positive energy balance, resulting in body fat accumulation and weight gain until another state of weight maintenance becomes established. Thus, weight gain and obesity can be seen as a form of adaptation that brings about a new steady state (Astrup et al., 1994). Adaptation has been defined as âa process by which a new or different steady state is reached in response to a change or difference in the intake of food and nutrientsâ (FAO/WHO/UNU, 1985). A more practical defini- tion, applied to the study of energy requirements, would be the ability to compensate for changes in energy (energy intake, expenditure, or bal- ance) without any discernible detriment to health. Although the concept applies both to increases and decreases in energy intake or energy expenditure, a focus of controversy has been its application to the definition of energy needs in poor areas of the world. In studies that specifically attempted to assess whether some adaptive mecha- nism may permit those populations to subsist with lower than predicted energy intakes, no reduction in weight-adjusted basal metabolic rates could be detected (Soares et al., 1991). Studies by numerous investigators (Minghelli et al., 1990; Ravussin et al., 1988; Weinsier et al., 1998; Weyer et al., 1999a, 1999b) tend to confirm the limited capacity of homeostasis to prevent or attenuate the impact of changes in energy intake on weight gain or weight loss without discernible impact on activity. Thus, a reduction in BEE or REE is generally associated with reduced body weight (Minghelli et al., 1990). Reports on the ethnic and gender differences in energy efficiency have yielded conflicting results, but the overall contributions such differences can make toward the main- tenance of energy balance appears to be small (Soares et al., 1998; Weyer et al., 1999a, 1999b). The TEF component of the energy balance equation accounts for only a small fraction of TEE and does not appear to vary adaptively in relationship to changes in energy balance. Thus, mainte-
151 E NERGY nance of energy balance is largely dependent on adjustments in food intake and physical activity. Some studies suggest a capacity for TEE to increase or decrease spon- taneously when energy intake increases or decreases (Levine et al., 1999; Roberts et al., 1990). However, most overfeeding studies show that over- eating is accompanied by substantial weight gain, and likewise reduced energy intake induces weight loss (Saltzman and Roberts, 1995). Thus, although there is some adaptive capacity of TEE to adjust to changes in dietary energy intake, the extent of this adjustment (other than what can be attributed to change in body size) is much too small to offset the impact observed by changes in energy intake. Body weight is a direct indicator of the relationship between food intake or availability and TEE. Accommodation The term accommodation was proposed to characterize an adaptive response that allows survival but results in some more or less serious conse- quences on health or physiological function. The most common example is a decrease in growth velocity in children. By reducing growth rate, chil- dren are able to save energy and may subsist for prolonged periods of time on marginal energy intakes, though at the cost of eventually becoming stunted. Another common example of accommodation is a reduction in physical activity. This can result in reduced productivity of physical work or in decreased leisure physical activity, which in children is important for behavioral and mental development (Twisk, 2001). APPROACH USED TO DETERMINE TOTAL ENERGY EXPENDITURE Based on the preceding review of possible approaches to estimating energy requirements, direct measurement of total energy expenditure (TEE) by the doubly labeled water (DLW) method represents a distinct advantage over previous TEE evaluations that had to rely on the factorial approach and/or on food intake data, both of which have limited reliability. Description of the Doubly Labeled Water Database Total energy expenditure data obtained by the DLW method were solicited for this report from investigators identified in the literature. Over 20 investigators responded and submitted individual TEE and ancillary data including age, gender, height, weight, basal energy expenditure (BEE) (observed or estimated), and descriptors for each individual in the data set (see Appendix I; also available at www.iom.edu/fnb). A normative
152 DIETARY REFERENCE INTAKES DLW database was created based on the inclusion/exclusion criteria described below. Since the DLW data were not obtained in randomly selected indi- viduals (except in the recent study of Bratteby and coworkers [1997]), they do not therefore constitute a representative sample of the popula- tions of the United States and Canada. However, the measurements were obtained from men, women, and children whose ages, body weight, height, and physical activities varied over wide ranges, so they provide an appro- priate base to estimate energy expenditures and requirements at different life stages in relation to gender, body weight, height, age, and for different activity estimations. A few age groups are underrepresented in the data set and interpolations had to be performed in these cases. Thus, while the available DLW data set used is not entirely satisfactory, it nevertheless offers the best currently available information. This data set, used to estimate the current energy recommendations, can be used to refine other existing communicated recommendations or guidelines developed by other orga- nizations and agencies. Inclusion/Exclusion Criteria Normative Database. To arrive at estimates of TEE, the normative DLW database, as summarized in Table 5-10, included infants and very young children (0 through 2 years of age) within the 3rd to 97th percentile for weight-for-height (Kuczmarski et al., 2000) (Appendix Table I-1), children (3 through 18 years of age) within the 5th to 85th percentile for body mass index (BMI) (Kuczmarski et al., 2000) (Appendix Table I-2), and adults (19 years of age and older) with BMI from 18.5 up to 25 kg/m2 (Appendix Table I-3). Subjects were required to be healthy, free-living, maintaining their body weight, and with measured heights and weights. Exclusion crite- ria included undernutrition, acute and chronic diseases, underfeeding and overfeeding protocols, and lifestyles involving uncommonly high levels of physical activity (e.g., elite athletes, astronauts, military trainees, and those with a physical activity level [PAL] greater than 2.5). A subset of DLW data was formulated for pregnant (Appendix Table I-4) and lactating (Appen- dix Table I-5) women meeting the inclusion/exclusion criteria prior to pregnancy. There are 407 adults in the normative database (Appendix Table I-3), 169 men and 238 women. Among the men whose ethnicity was reported, there are 33 Caucasians, 7 African Americans, and 2 Asians, and among the women there are 94 Caucasians, 13 African Americans, 3 Asians, and 3 Hispanics. The majority of the adult data come from studies that were
153 E NERGY conducted in the United States or the Netherlands, with the remainder from studies done in the United Kingdom, Australia, and Sweden. For the 100 adults for whom data were provided on occupation, the most com- monly reported types of occupations were offices workers, followed by teachers and students, scientists, medical workers, active occupations (e.g., aerobics instructor, police officer, physical therapist, dog trainer), home- makers, artists, and the unemployed. The database for normal-weight children (n = 525) (Appendix Table I-2) includes 167 boys (73 Caucasians, 13 African Americans, 4 Hispanics, and 62 American Indians) and 358 girls (197 Caucasians 58 African Ameri- cans, 20 Hispanics, 10 Asians, and 60 American Indians); ethnicity was not provided for 15 boys and 13 girls. All data on children were collected in the United States. Overweight and Obese Database. DLW databases of overweight and obese children and adults were also developed and are summarized in Table 5-11. Children (3 through 18 years of age) above the 85th percentile for BMI (Kuczmarski et al., 2000) (Appendix Table I-6) and adults (19 years of age and older) with BMIs from 25 kg/m2 and higher (Appendix Table I-7) were included in the database. Subjects were required to be free-living. Diet and exercise intervention studies were excluded. There were insuffi- cient data to address pregnancy and lactation in overweight and obese women. The database for overweight and obese adults contains information on 360 individualsâ165 men and 195 women (Appendix Table I-7). Among the men whose ethnicity was reported, there are 22 Caucasians and 21 African Americans; among the women there are 51 Caucasians, 34 African Americans, and 5 Hispanics. The majority of the data come from studies conducted in the United States and the Netherlands; the rest are from studies conducted in the United Kingdom, Sweden, and Australia. Occupations were not provided for 326 individuals. For those 34 indi- viduals for whom an occupation was given, the most common types were office workers, followed by medical personnel, homemakers, active occu- pations (e.g., firefighter, fitness instructors), teachers and students, researchers, and artists. The database for overweight and obese children (n = 319) (Appendix Table I-6) includes 127 boys (33 Caucasian, 20 African-American, 2 His- panic, and 71 American Indian) and 192 girls (63 Caucasian, 48 African- American, 6 Hispanic, 68 American Indian, and 1 Asian; ethnicity was not provided for 1 boy and 6 girls. All data were collected in the United States.
154 DIETARY REFERENCE INTAKES TABLE 5-10 Doubly Labeled Water Databases for All Individuals with a Body Mass Index (BMI) in the Range from 18.5 up to 25 kg/m2a Mean Mean Weight Height Age (y) (kg [lb]) (m [in]) n 0â0.5 116 6.9 (15) 0.64 (25) 0.6â1.0 72 9.0 (20) 0.72 (28) 1â2 132 11.0 (24) 0.82 (32) Males 3â8 129 20.4 (45) 1.15 (45) 9â13 28 35.8 (79) 1.44 (57) 14â18 10 58.8 (130) 1.70 (67) 19â30 48 71.0 (156) 1.80 (71) 31â50 59 71.4 (157) 1.78 (70) 51â70 24 70.0 (154) 1.74 (69) 71+ 38 68.9 (152) 1.74 (69) Females 3â8 227 22.9 (50) 1.20 (47) 9â13 89 36.4 (80) 1.44 (57) 14â18 42 54.1 (119) 1.63 (64) 19â30 82 59.3 (131) 1.66 (65) 31â50 61 58.6 (129) 1.64 (65) 51â70 71 59.1 (130) 1.63 (63) 71+ 24 54.8 (121) 1.58 (62) a Summary of data in Appendix Tables I-1 through I-5. b For adults (19 years of age and over), the observed BEE was used to calculate the mean BEE. BEE and physical activity level were not used for infants. For children, BEE Data Analysis and Assumptions Made for the Total Energy Expenditure Equations For the normative DLW database, prediction equations of TEE from age, gender, height, and weight were developed. The validity of these equa- tions to predict TEE rest on three general assumptions: that the database represents the phenomena of interest, that the model describes the physi- ological phenomena of the data, and that the fitted equations accurately describe the data. As in any realistic statistical modeling activity, the balance is between fitting the data and fitting the phenomena, while making opti- mal use of the available data. The available data were reviewed and analyzed and it is assumed that they are representative of the phenomena of interestâthe energy metabo-
155 E NERGY Mean Basal Mean Total Energy Energy Mean Body Expenditure Expenditure Mean Physical Mass Index (BEE) (TEE) Activity Level (kg/m2) (kcal/d)b (kcal/d) (TEE/BEE) 16.9 â 501 â 17.2 â 713 â 16.2 â 869 â 15.4 1,035 1,441 1.39 17.2 1,320 2,079 1.56 20.4 1,729 3,116 1.80 22.0 1,769 3,081 1.74 22.6 1,675 3,021 1.81 23.0 1,524 2,469 1.63 22.8 1,480 2,238 1.52 15.6 1,004 1,487 1.48 17.4 1,186 1,907 1.60 20.4 1,361 2,302 1.69 21.4 1,361 2,436 1.80 21.6 1,322 2,404 1.83 22.2 1,226 2,066 1.70 21.8 1,183 1,564 1.33 was predicted based on the following equations (see âTEE Equations for Normal-Weight Childrenâ): Boys: BEE (kcal/d) = 68 â 43.3 Ã age (y) + 712 Ã height (m) + 19.2 Ã weight (kg). Girls: BEE (kcal/d) = 189 â 17.6 Ã age (y) + 625 Ã height (m) + 7.9 Ã weight (kg). lism of healthy individuals over the normal range of age, height, weight, and energy expenditure. The analyses were restricted to include individuals within the specific ranges of body sizes and excluded individuals who were identified as being full-time in physical training. An additive model was chosen as the default, with the relative contri- butions of height and weight kept constant for each gender. Because of the difficulty of estimating physical activity in the field, a four-level ordinal variable was generated, estimated from PAL data and used in the model to modify the total height and weight contribution to TEE. Various transfor- mations of the data and the inclusion of multiplicative terms were explored, but none significantly improved how well the model described the data.
156 DIETARY REFERENCE INTAKES TABLE 5-11 Doubly Labeled Water Database for Overweight and Obese Males and Femalesa Mean Mean Weight Height Age (y) (kg [lb]) (m [in]) n Males 3â8 91 28.6 (63) 1.19 (46) 9â13 36 54.7 (120) 1.46 (57) 14â18 â â â 19â30 11 98.5 (217) 1.82 (72) 31â50 68 98.3 (217) 1.78 (70) 51â70 54 90.4 (199) 1.75 (69) 71+ 32 82.3 (181) 1.72 (68) Females 3â8 123 30.5 (67) 1.22 (48) 9â13 56 55.8 (123) 1.50 (59) 14â18 13 73.9 (163) 1.64 (65) 19â30 37 82.3 (181) 1.66 (65) 31â50 51 88.3 (194) 1.66 (65) 51â70 79 79.7 (176) 1.62 (64) 71+ 28 69.0 (152) 1.58 (62) a Summary of data in Appendix Tables I-6 and I-7. b For adults (ages 19 and over), the observed BEE was used to calculate the mean BEE. For children, BEE was predicted based on the following equations (see âEstimation of Energy Expenditure in Overweight Children Ages 3 through 18 Yearsâ): Finally, although the equations are essentially linear (within each PAL), a nonlinear regression procedure was used, with a least squares loss func- tion. During the exploratory phase, evaluations of alternative models were based on the magnitude of residual error and examination of residual plots. These residual plots showed that while errors are not constant over the whole range of the variables, there is no simple pattern. As noted above, various transformations of the dependent variable (TEE) were explored, and in light of these results it was decided that assuming a least squares loss function did not lead to serious bias in the fitted models, and that the effect on error estimates was not important given the large amount of unexplained variability in the data. Since nonlinear regression is an iterative approach, the influence of varying the starting point was investi- gated and was found not to be a problem. The standard errors of the coefficients were estimated asymptotically; for a sample of the fits esti- mates were determined by jackknife techniques; these were found not to change the conclusions.
157 E NERGY Mean Basal Mean Total Energy Energy Mean Body Expenditure Expenditure Mean Physical Mass Index (BEE) (TEE) Activity Level (kg/m2 ) (kcal/d)b (kcal/d) (TEE/BEE) 19.8 1,210 1,728 1.42 25.4 1,612 2,451 1.52 â â â â 29.6 1,970 3,599 1.85 30.8 1,955 3,598 1.85 29.6 1,722 2,946 1.72 27.8 1,667 2,510 1.52 20.3 1,149 1,669 1.45 24.7 1,443 2,346 1.63 27.6 1,596 2,798 1.75 29.8 1,524 2,677 1.77 31.9 1,629 2,895 1.79 30.4 1,380 2,176 1.59 27.6 1,258 1,763 1.40 Boys: BEE (kcal/d) = 419.9 â 33.5 à age (y) + 418.9 à height (m) + 16.7 à weight (kg). Girls: BEE (kcal/d) = 515.8 â 26.8 à age (y) + 347 à height (m) + 12.4 à weight (kg). Examination of the normative DLW database showed an initial increase of TEE with age until a plateau from age 20 to 45 in women, followed by a decline (Figure 5-6). Men peaked around 35 years of age, and then declined (Figure 5-6). Increased TEE is related to greater heights (Figure 5-7) and weights (Figure 5-8). For adults, TEE was independent of BMI when the analysis was adjusted for height. Analyses indicated that the best predictions for TEE were obtained by fitting all the data separately for adults (ages 19 years and older), children and adolescents (ages 3 through 18 years), and young children (ages 0 through 2 years). Gender-specific equations were found to be unnecessary in children less than 3 years of age. All data were entered into and analyzed with SPSS, version 10.0. Physical Activity Level Categories The PAL categories were defined as sedentary (PAL ⥠1.0 < 1.4), low active (PAL ⥠1.4 < 1.6), active (PAL ⥠1.6 < 1.9), and very active (PAL â¥
158 DIETARY REFERENCE INTAKES 6,000 Gender Male Female 5,000 Total Energy Expenditure (kcal) 4,000 3,000 2,000 1,000 0 0 20 40 60 80 100 Age (y) FIGURE 5-6 Total energy expenditure and age in all individuals (excluding infants and pregnant or lactating women) in the doubly labeled water database (Appendix I). 1.9 < 2.5) (Table 5-12). The mean PALs for the four categories are shown in Table 5-13. The energy expenditure in sedentary individuals is set to reflect their BEE, the thermic effect of food, and the physical activities that are required for independent living. A low-active lifestyle (PAL = 1.5) for an adult weighing 70 kg is set to include an exertion equivalent to walking 2.2 mi/d at a rate of 3 to 4 mph or the equivalent energy expenditure in other activities, in addition to the activities that are part of independent living (Table 5-12). The active lifestyle was set at a PAL of 1.6 to 1.89. The physical activities performed by active, mid-weight individuals with a PAL of 1.75 (midpoint in this PAL category) would on average to be equivalent to walking 7 mi/d at the rate of 3 to 4 mph, while walking ~17 mi/d would be equivalent to the sum of the activities above independent living carried out by a very active, mid-weight individual with a PAL of 2.2 (Table 5-12). The PAL range set for a âvery activeâ lifestyle is 1.9 to 2.49. As shown in
159 E NERGY 6,000 Gender Male Female 5,000 Total Energy Expenditure (kcal) 4,000 3,000 2,000 1,000 0 1.0 1.2 1.4 1.6 1.8 2.0 Height (m) FIGURE 5-7 Total energy expenditure and height in all individuals (excluding infants and pregnant and lactating women) in the doubly labeled water database (Appendix I). Table 5-12, these distances vary with the actual PAL value as well as with body weights. Tables are included in Chapter 12 that indicate how an individual can estimate his or her PAL on a daily (Table 12-2) or weekly (Table 12-3) basis. Regression of Total Energy Expenditure on Age, Height, Weight, and Physical Activity Level Category While stepwise multiple linear regressions were used to identify gender, age, height, and weight as the important variables for predicting TEE, physiological considerations determined that the form of the best predictive equation was nonlinear: TEE = A + B Ã age + PA Ã (D Ã weight + E Ã height)
160 DIETARY REFERENCE INTAKES Gender 6,000 Male Female 5,000 Total Energy Expenditure (kcal) 4,000 3,000 2,000 1,000 0 0 50 100 150 200 250 Weight (kg) FIGURE 5-8 Total energy expenditure and weight in all individuals (excluding infants and pregnant and lactating women in the doubly labeled water database (Appendix I). where TEE is in kcal/d, age is in years, weight is in kilograms, and height is in meters. In this equation, A is the constant term; B is the age coefficient; PA is the physical activity coefficient, which depends on whether the indi- vidual is estimated to be in the sedentary, low-active, active, or very active PAL categories; D is the weight coefficient; and E is the height coefficient. It should be noted that this approach is equivalent to fitting the individuals in each PAL category separately but keeping their equations parallel. In the above equation the relative importance of height and weight is constant for different activity levels but the magnitude of their combined contribution changes for different PAL levels. Because of the mathematical interdependencies between the physical activity coefficients and the height and weight coefficients, the physical activity coefficient for the sedentary PAL category is set to 1.0. The standard error of fit (the standard deviation of the residuals) represents how variable the measurements of the energy requirements of
161 E NERGY TABLE 5-12 Physical Activity Level (PAL) Categories and Walking Equivalence Walking Equivalence (mi/d at 3â4 mph)a Light-Weight Middle-Weight Heavy-Weight PAL PAL Individual Individual Individual Category Range PAL (44 kg) (70 kg) (120 kg) Sedentary 1.0-1.39 1.25 ~0 ~0 ~0 Low active 1.4-1.59 Mean 1.5 2.9 2.2 1.5 Active 1.6-1.89 Minimum 1.6 5.8 4.4 3.0 Mean 1.75 9.9 7.3 5.3 Very active 1.9-2.49 Minimum 1.9 14.0 10.3 17.5 Mean 2.2 22.5 16.7 12.3 Maximum 2.5 31.0 23.0 17.0 a In addition to energy spent for the generally unscheduled activities that are part of a normal daily life. SOURCE: Chapter 12. individuals with similar characteristics might be. In order to estimate the true between-individual variability, it was necessary to partition this observed variability into biological and experimental; in the light of limited data, and following the suggestion of the 1981 FAO/WHO/UNU Expert Con- sultation, it is assumed that the biological and the experimental variance are equal. Therefore, values for individual standard deviations are recom- mended as 70 percent of the observed standard error of fit (Table 5-14). The data were fitted to this equation using nonlinear regression and the Levenberg-Marquardt method for searching for convergence based on minimizing the sum of residuals squared. For each fit an R-squared was calculated as the ratio of the explained sum of squared error to the total sum of squared error, and asymptotic standard errors of the coefficients were calculated. TEE Equations for Normal-Weight Children Separate TEE predictive equations were developed for normal-weight boys and girls from age, height, weight, and PAL category using the same definitions as that for adults (see Table 5-12) using nonlinear regression techniques. In order to utilize all the TEE data, PAL categorization was determined using predicted rather than observed BEE, since only 71 per- cent (256/358) of the girls and 66 percent (111/167) of the boys had
162 DIETARY REFERENCE INTAKES TABLE 5-13 Sample Size, Mean Total Energy Expenditure (TEE), Body Mass Index (BMI), and Physical Activity Level (PAL) for each of the PAL Categories in Adults Included in the DLW Databasea BMI PAL (kg/m2) Gender Category n 18.5 to 25 Women Sedentary 35 Low active 45 Active 87 Very active 71 Total 238 Men Sedentary 22 Low active 36 Active 76 Very active 35 Total 169 25 and higher Women Sedentary 39 Low active 43 Active 78 Very active 35 Total 195 Men Sedentary 20 Low active 35 Active 58 Very active 52 Total 165 a From Appendix I. b Mean ± standard deviation. observed BEE (Appendix Table I-2). The following predictive equations for BEE were derived from the observed BEE provided in the DLW database. For boys: BEE (kcal/d) = 68 â (43.3 à age [y]) + 712 à height (m) + 19.2 à weight (kg) [standard error = 88; R2 = 0.89] For girls: BEE (kcal/d) = 189 â (17.6 à age [y]) + 625 à height (m) + 7.9 à weight (kg) [standard error = 95; R2 = 0.75]
163 E NERGY TEE BMI Measured Measured PAL (kg/m2)b (kcal/d)b Measured b 1,567 ± 261 22.1 ± 1.7 1.23 ± 0.11 2,036 ± 252 22.1 ± 1.8 1.52 ± 0.05 2,303 ± 288 21.8 ± 1.7 1.74 ± 0.09 2,588 ± 348 21.2 ± 1.6 2.09 ± 0.16 2,229 ± 447 21.7 ± 1.7 1.73 ± 0.31 1,992 ± 263 23.0 ± 1.5 1.29 ± 0.10 2,500 ± 381 22.4 ± 1.5 1.51 ± 0.05 2,892 ± 402 22.5 ± 1.5 1.74 ± 0.08 3,338 ± 419 22.4 ± 1.6 2.06 ± 0.01 2,784 ± 561 22.5 ± 1.5 1.70 ± 0.25 1,788 ± 373 30.3 ± 5.0 1.25 ± 0.10 2,205 ± 344 30.2 ± 4.3 1.52 ± 0.06 2,594 ± 452 31.0 ± 6.6 1.74 ± 0.08 2,888 ± 347 28.9 ± 3.3 2.04 ± 0.11 2,400 ± 545 30.3 ± 5.3 1.65 ± 0.27 2,378 ± 546 30.3 ± 6.3 1.27 ± 0.09 2,719 ± 544 29.7 ± 6.5 1.50 ± 0.06 3,142 ± 425 29.4 ± 4.1 1.73 ± 0.09 3,821 ± 608 29.9 ± 4.2 2.10 ± 0.14 3,174 ± 727 29.7 ± 5.0 1.74 ± 0.30 Prediction equations of TEE for normal-weight boys and girls ages 3 through 18 years were then developed using age, height, weight, and PAL category as predicted from the above BEE equations. Data were not used in the derivation of the TEE equations if the PAL value was less than 1.0 or greater than 2.5. Plots of the residuals (predicted versus observed TEE) for each PAL category did not differ from zero and showed no evidence of nonlinear patterns of bias. Standard deviation (SD) of the residuals ranged from 56 to 167, with the highest SD for the very active PAL category. The residuals were not correlated with weight, height, BMI, or age.
164 DIETARY REFERENCE INTAKES TABLE 5-14 Estimated Standard Deviation of Estimated Energy Requirements (kcal/d) Derived from Regression Equations for Individuals of a Specific Age, Height, Weight, and Physical Activity Level Categorya Age (y) Body Mass Index Males Females ⥠3â18 3rd < 85th percentile 58 68 ⥠3â18 85th percentile 69 75 ⥠3â18 3rd percentile 67 70 ⥠19 ⥠18.5 < 25 kg/m2 199 162 ⥠19 ⥠25 kg/m2 208 160 ⥠19 ⥠18.5 kg/m2 202 160 a Observed variance = biological variance + experimental variance, for the square root of biological variance = biological standard deviation, assuming biological variance = experimental variance. The coefficients and standard error for the prediction of TEE in boys and girls ages 3 through 18 years of age in the normative database are described in Appendix Table I-8. FINDINGS BY LIFE STAGE AND GENDER GROUP Infants and Children Ages 0 Through 2 Years Evidence Considered in Determining the Estimated Energy Requirement Energy Expenditure and Energy Deposition. The energy requirements of infants and young children should balance energy expenditure at a level of physical activity consistent with normal development and allow for depo- sition of tissues at a rate consistent with health. This approach requires knowledge of what constitutes developmentally appropriate levels of physi- cal activity, normal growth, and body composition. Although the energy requirement for growth relative to maintenance is small, except during the first months of life, satisfactory growth is a sensitive indicator of whether energy needs are being met. To determine the energy cost of growth, the energy content of the newly synthesized tissues must be esti- mated, preferably from the separate costs of protein and fat deposition. Basal Metabolism. The brain, liver, heart, and kidney account for most of the basal metabolism of infants. Holliday (1971) analyzed basal meta-
165 E NERGY bolic rate (BMR) in relation to body and organ weight, and noted that oxygen (O2) consumption increased at a rate greater than that of organ or body weight during the intrauterine and postnatal periods. There is also an increase in O2 consumption during the transition to extrauterine life. After birth, the O2 consumption of these vital organs increases in propor- tion to increases in organ weight. The contribution of the brain to BMR is exceptionally high in the newborn period (70 percent) and throughout the first years of life (60 to 65 percent). Basal metabolism of term infants has been investigated extensively. Karlberg (1952) and Benedict and Talbot (1921) reported BMR ranges from 43 to 60 kcal/kg/d. The high variability is attributable to biological differences in body composition and technical differences in experimental conditions and methods. (In most studies of infants, BMR is measured while they are either asleep or sedated, which may lead to an underestimate of BEE.) Nevertheless, it should be appreciated that energy expenditure per kg is approximately two times greater in infants than in adults (Denne and Kalhan, 1987). The basal metabolism of infants is dependent on gender, age, and feeding mode. Significant differences between breast-fed and formula-fed infants have been reported at 3 and 6 months (Butte, 1990; Butte et al., 2000b; Wells and Davies, 1995). BMR predicted from Schofield equations (WN Schofield, 1985) was equal to 0.88 measured BMR at 3â12 months (Butte et al., 2000b). Schofield compiled approximately 300 measurements from Benedict and Talbot (1914, 1921), Clagett and Hathaway (1941), Harris and Benedict (1919), and Karlberg (1952) to develop predictive models based on weight and length (C Schofield, 1985). Experimental conditions varied across studies in which indirect calorimetry was used to measure SMR or resting metabolic rate (RMR) rather than BMR. In the older studies, the influence of neonatal age, sedation, or experimental techniques in some of the older studies may explain the lower values pre- dicted by the Schofield equation compared to measured BMR. Thermic Effect of Feeding. Since infants normally are fed frequently and not subjected to prolonged fasting, the thermic effect of food (TEF) will exert a continual, albeit variable, influence on energy expenditure. The TEF in preterm infants (Reichman et al., 1982) and in infants recovering from malnutrition (Ashworth, 1969) has been shown to be proportional to the rate of weight gain. These observations support the view that some of the observed energy expenditure is due to the metabolic costs of tissue synthesis. Thermoregulation. In the first 24 hours after birth, thermoneu-trality is reported to be at 34°C to 36°C for the naked infant and falls to 30°C to
166 DIETARY REFERENCE INTAKES 32°C by 7 to 10 days of age (Sinclair, 1978). The amount of energy re- quired to maintain normal body temperature is greater at lower than at higher temperatures (Sinclair, 1978). Basal oxygen consumption rates in- crease from 4.8 ml O2/kg/min at 0 to 6 hours postpartum to 7.0 ml O2/ kg/min at 6 to 10 days of life and remain fairly constant thereafter through- out the first year of life (Widdowson, 1974). The neonate responds to mild cold exposure with an increase in nonshivering thermogenesis, which in- creases metabolic rate and may be mediated by increased sympathetic tone (Penn and Schmidt-Sommerfeld, 1989). Increased oxidation of fatty acids in brown adipose tissue located between the scapulae and around major vessels and organs of the mediastinum and abdomen is thought to make the most important contribution to nonshivering thermogenesis in infants (Penn and Schmidt-Sommerfeld, 1989). Shivering thermogenesis occurs at lower ambient temperatures when nonshivering thermogenesis is insuf- ficient to maintain body temperature. Physical Activity. Physical activity represents an increasingly larger com- ponent of the total energy expenditure (TEE) as the young child grows and develops. In a longitudinal study of 76 developmentally normal infants, PAL (TEE/BEE) increased significantly from 1.2 at 3 months of age to 1.4 at 24 months of age (Butte et al., 2000b). Total Energy Expenditure (TEE). While application of the doubly labeled water (DLW) method is subject to errors in infants and small chil- dren, the method has been validated in term and preterm infants (Jensen et al., 1992; Jones et al., 1987; Roberts et al., 1986; Westerterp et al., 1991). Mean discrepancies between the DLW method and respiration calorimetry were 0.3 ± 2.6 percent (Roberts et al., 1986), â0.9 ± 6.2 percent (Jones et al., 1987), â4.5 ± 6.0 percent (Westerterp et al., 1991), and â0.4 ± 11.5 per- cent (Jensen et al., 1992). TEE is influenced by age, gender, and feeding mode (Butte et al., 2000b). In a longitudinal study of children from 3 to 24 months of age, absolute TEE differed by age (older greater than younger), gender (boys greater than girls), and feeding mode (human milk-fed less than formula- fed infants). Adjusted for body weight, TEE still differed by age and feed- ing mode, but not by gender. Adjusted for fat-free mass (FFM) and fat mass (FM), TEE differed by feeding mode, but not by age or gender (Butte et al., 2000b). TEE has been shown to be lower in breast-fed than formula- fed infants in a number of other studies (Butte et al., 1990; Davies et al., 1990; Jiang et al., 1998). Growth. Body composition data may be used to compute the energy cost of growth. The energy content of the newly synthesized tissues is theo-
167 E NERGY retically more accurate when the separate costs of protein and fat deposi- tion are taken into account since the composition of weight gain varies with age. Much understanding of the energy cost of growth has been derived from preterm infants or children recovering from malnutrition (Butte et al., 1989; Roberts and Young, 1988). Typically, the energy cost of growth in these studies ranges from 2.4 to 6.0 kcal/g (10 to 25 kJ/g). In practicality, the energy cost of growth is an issue only during the first half of infancy when energy deposition contributes significantly to energy requirements. In this report, the energy content of tissue deposition was computed from rates of protein and fat deposition observed in a longitudinal study of infants from 0.5 to 24 months of age (Butte et al., 2000b). The energy content of tissue deposition (kcal/g) derived from the above study was applied to the 50th percentile of weight gain published by Guo and col- leagues (1991) as shown in Table 5-15 for infants and children 0 through 24 months of age. The estimated energy cost of tissue deposition averaged approximately 175 kcal/d for the age interval 0 to 3 months, 60 kcal/d for TABLE 5-15 Weight Gain and Energy Deposition of Boys and Girls 0 Through 2 Years of Age Energy Cost Protein Fat Mass of Tissue Weight Energy Age Interval Gain Gain Deposition Gain Deposition (g/d)a (g/d)a (g/d)b (mo) (kcal/g) (kcal/d) Boys 0â3 2.6 19.6 6.0 31 186 4â6 2.3 3.9 2.8 18 50 7â9 2.3 0.5 1.5 12 18 10â12 1.6 1.7 2.7 10 27 13â15 1.3 1.0 2.2 9 20 16â18 1.3 1.0 2.2 8 17 19â24 1.1 2.1 4.7 7 33 Girls 0â3 2.2 19.7 6.3 26 163 4â6 1.9 5.8 3.7 17 63 7â9 2.0 0.8 1.8 12 21 10â12 1.8 1.1 2.3 10 23 13â15 1.3 1.4 2.5 9 23 16â18 1.3 1.4 2.5 8 20 19â24 1.0 0.8 2.2 7 15 a Body composition (Butte et al., 2000a). b Increments in weight at the 50th percentile (Guo et al., 1991).
168 DIETARY REFERENCE INTAKES 4 to 6 months, 22 kcal/d for 7 to 12 months, and 20 kcal for 13 to 35 months. Estimated Energy Requirements (EER). Total energy requirements of infants and young children have thus been shown to vary by age, gender, and feeding mode. Total energy requirements increase as children grow and are higher in boys than girls. Weight or FFM and FM accounted for the differences in energy requirements between ages and genders. The effect of feeding mode on energy requirements was apparent throughout the first year, primarily due to the higher TEE in formula-fed than human milk-fed infants (Butte et al., 2000b). Energy requirements (kcal/kg/d) were 7, 8, 9, and 3 percent higher in formula-fed than human milk-fed infants at 3, 6, 9, 12 months, respectively. The differences in energy requirements between feeding groups appeared to diminish beyond the first year of life. Based upon analysis of the DLW data for infants and very young children (Appendix Table I-1), a single equation to predict total energy expenditure involving only weight was found to fit all of the individuals (n = 320 measurements) regardless of gender. Because the data included repeated measurements of individuals, dummy variables were used to link those individual data. While age, height, and weight were all indepen- dently correlated with TEE, weight was the best predictor. TEE values, adjusted for weight, were not correlated with age or height. Gender was not a statistically significant predictor of TEE, once body weight was ac- counted for. Because of the small sample size and limited range of esti- mated physical activity, the physical activity level (PAL) category was not included in the TEE equation. Examination of the residuals revealed no bias and including the squares of age, height, and weight added nothing to the prediction of TEE. Additionally, the inclusion of mean published data (Butte et al., 1990; Davies et al., 1989, 1991, 1997; de Bruin et al., 1998; Lucas et al., 1987; Stunkard et al., 1999; Wells et al., 1996), weighted for sample size, did not change the predictive equations. Because of the lack of gender differences, it was decided to use a single equation for individuals 0 through 2 years of age: TEE (kcal/d) = 89 (± 3 [standard error]) à weight of the child (kg) â 100 (± 56 [standard error]) EER Summary, Ages 0 Through 2 Years Since infants and very young children are growing, an allowance for energy deposition (estimated in Table 5-15) must be added to the TEE to
169 E NERGY derive the EER. This energy deposition allowance is the average of energy deposition for boys and girls of similar ages. The EER is equal to the sum of TEE from the equation above plus energy deposition. Specific EERs are given in Tables 5-16 (boys) and 5-17 (girls) and are summarized for each age group below. The estimated energy deposition is the average of boys and girls taken from Table 5-15. EER for Ages 0 Through 36 Months EER = TEE + energy deposition (89 Ã weight [kg] â 100) + 175 kcal 0â3 months (89 Ã weight [kg] â 100) + 56 kcal 4â6 months (89 Ã weight [kg] â 100) + 22 kcal 7â12 months 13â36 months (89 Ã weight [kg] â 100) + 20 kcal TABLE 5-16 Estimated Energy Requirement (EER) for Boys 0 Through 2 Years of Age Reference Total Energy Energy Expenditureb Depositionc Weight EER (kcal/d) (kg [lb])a Age (mo) (TEE) (kcal/d) (ED) (kcal/d) (TEE + ED) 1 4.4 (9.7) 292 180 472 2 5.3 (11.7) 372 195 567 3 6.0 (13.2) 434 138 572 4 6.7 (14.8) 496 52 548 5 7.3 (16.1) 550 46 596 6 7.9 (17.4) 603 42 645 7 8.4 (18.5) 648 20 668 8 8.9 (19.6) 692 18 710 9 9.3 (20.5) 728 18 746 10 9.7 (21.4) 763 30 793 11 10.0 (22.0) 790 27 817 12 10.3 (22.7) 817 27 844 15 11.1 (24.4) 888 20 908 18 11.7 (25.8) 941 20 961 21 12.2 (26.9) 986 20 1,006 24 12.7 (28.0) 1,030 20 1,050 27 13.1 (28.9) 1,066 20 1,086 30 13.5 (29.7) 1,101 20 1,121 33 13.9 (30.6) 1,137 20 1,157 35 14.2 (31.3) 1,164 20 1,184 a From Table 5-6. b Estimated from TEE = 89 Ã weight (kg) â 100 derived from DLW data (Appendix I). c From Table 5-15.
170 DIETARY REFERENCE INTAKES TABLE 5-17 Estimated Energy Requirement (EER) for Girls 0 Through 2 Years of Age Reference Total Energy Energy Expenditureb Depositionc Weight EER (kcal/d) (kg [lb])a Age (mo) (TEE) (kcal/d) (ED) (kcal/d) (TEE + ED) 1 4.2 (9.3) 274 164 438 2 4.9 (10.8) 336 164 500 3 5.5 (12.1) 389 132 521 4 6.1 (13.4) 443 65 508 5 6.7 (14.8) 496 57 553 6 7.2 (15.9) 541 52 593 7 7.7 (17.0) 585 23 608 8 8.1 (17.8) 621 22 643 9 8.5 (18.7) 656 22 678 10 8.9 (19.6) 692 25 717 11 9.2 (20.3) 719 23 742 12 9.5 (20.9) 745 23 768 15 10.3 (22.7) 817 20 837 18 11.0 (24.2) 879 20 899 21 11.6 (25.6) 932 20 952 24 12.1 (26.7) 977 20 997 27 12.5 (27.5) 1,013 20 1,033 30 13.0 (28.6) 1,057 20 1,077 33 13.4 (29.5) 1,093 20 1,113 35 13.7 (30.2) 1,119 20 1,139 a From Table 5-6. b Estimated from TEE = 89 Ã weight (kg) â 100 derived from DLW data (Appendix I). c From Table 5-15. EERs for energy calculated by these equations are slightly lower than those estimated by Prentice and colleagues (1988). Their estimates were 95, 85, 83, and 83 kcal/kg/d at 3, 6, 9, and 12 months, respectively. These estimates of total energy expenditures are approximately 80 percent of the 1985 FAO/WHO/UNU recommendations for energy intake of infants and toddlers (FAO/WHO/UNU, 1985), which were based upon observed energy intakes of infants compiled by Whitehead and colleagues (1981) from the literature predating 1940 and up to 1980. More recent intake data are 2 to 15 percent lower than those on which the 1985 FAO/WHO/UNU recommendations were based (Davies et al., 1997; Prentice et al., 1988). In addition, an extra 5 percent allowance was factored into the FAO/WHO/UNU recommendations to correct for a pre- sumed underestimation of energy intake (FAO/WHO/UNU, 1985).
171 E NERGY Human Milk Human milk is recognized as the optimal milk source for infants throughout at least the first year of life and is recommended as the sole nutritional milk source for infants through the first 4 to 6 months of life (IOM, 1991). Infants receiving human milk for this period would have an energy intake of some 500 kcal/d based on an average volume of milk intake of 0.78 L/d (Heinig et al., 1993; Neville et al., 1988) and an average caloric density of human milk of 650 kcal/L (Anderson et al., 1983; Butte and Calloway, 1981; Butte et al., 1984a; Dewey et al., 1984; Nommsen et al., 1991) (Table 5-18). The EERs derived in this report are thus more consistent with energy intakes of human milk-fed infants than the recom- mendations in the 1985 FAO/WHO/UNU report; it should be noted that the EERs based on the equations given do exceed the calculated 500 kcal/d from human milk for some infant boys and girls (Tables 5-16 and 5-17), which is in agreement with studies that have shown that infants fed human milk as a sole source of nutrients have lower TEE values than formula-fed infants. Children Ages 3 Through 8 Years Evidence Considered in Determining the Estimated Energy Requirement Basal Metabolism. BMR may be measured by indirect calorimetry or estimated from weight using the Schofield equations (WN Schofield, 1985). Validation of the Schofield equations has been undertaken by com- paring predicted values with measured values (Torun et al., 1996) in British 7- to 10-year-old children (Livingstone et al., 1992a) and Dutch 8- to 10-year-old children (Saris et al., 1989). Mean differences between the measured and calculated BMR ranged from 7.6 to 9.9 percent, suggesting that the Schoefield equations are adequate for use in this population. In this report, predictive equations for basal energy expenditure (BEE) (BMR extrapolated to 24 hours) were derived from observed BEE mea- sured in the children in the DLW database and are described in the earlier section âTEE Equations for Normal-Weight Children.â Thermic Effect of Food. The TEF was studied in prepubertal children for 3 hours after ingestion of a mixed meal in liquid form (Maffeis et al., 1993). In normal-weight children, the rise in energy expenditure was equivalent to 14 percent RMR or to 5.9 percent of the energy ingested. Physical Activity. Energy needs per unit body weight for maintenance and growth decrease in relation to the increased energy needed for physi-
172 DIETARY REFERENCE INTAKES TABLE 5-18 Human Milk Intake and Composition Energy Intake from Stage of Milk (As Reported in Study)a Study Country Lactation n Anderson et al., Canada 10 women 3â5 d Not reported 1981 8â11 d 15â18 d 26â29 d Anderson et al., United 9 women 3d Not reported 1983 States 7d 14 d Butte and United 23 1 mo Not reported Calloway, 1981 States Butte et al., United 37 infants 1 mo 520 ± 131 kcal/d 1984a, 1984b States 40 infants 2 mo 468 ± 115 kcal/d 37 infants 3 mo 458 ± 124 kcal/d 41 infants 4 mo 477 ± 111 kcal/d Dewey et al., United 12 women 7â20 mo 610 kcal/d at 7 mo 1984 States 735 kcal/d at 11â16 mo Ferris et al., United 12 women 2 wk Not reported 1998 States 6 wk 12 wk 16 wk Lammi-Keefe United 6 women 8 wk Not reported et al., 1990 States Nommsen et al., United 58 infants 3 mo Not reported 1991 States 45 infants 6 mo 28 infants 9 mo 21 infants 12 mo Heinig et al., United 38 F, 33 M 3 mo 535.37 ± 81.26 kcal/d 1993 States 30 F, 26 M 6 mo 518.64 ± 114.72 kcal/d 22 F, 24 M 9 mo 439.77 ± 143.40 kcal/d 21 F, 19 M 12 mo 303.54 ± 172.08 kcal/d a Mean ± SD, unless otherwise noted.
173 E NERGY Energy Content of Milka Maternal Intakea Comments 50 kcal/dL Not reported Full-term infants 60 kcal/dL Milk energy content was 60 kcal/dL approximated from 60 kcal/dL study figure 51 ± 9 kcal/dL Not reported Full-term pregnancies 63 ± 9 kcal/dL 67 ± 10 kcal/dL 66 ± 12 kcal/dL Not reported Navajo women 0.68 ± 0.08 kcal/g 2,334 ± 536 kcal/d Healthy term infants, 0.64 ± 0.08 kcal/g 2,125 ± 582 kcal/d exclusively breast-fed 0.62 ± 0.09 kcal/g 2,170 ± 629 kcal/d 0.64 ± 0.10 kcal/g 2,092 ± 498 kcal/d 65 kcal/dL Not reported Breast-feeding mothers 78.1 ± 12.5 kcal/dL 2,315 ± 658 kcal/d Full-term pregnancies, 75.3 ± 7.7 kcal/dL 2,439 ± 806 kcal/d healthy nonsmokers, 79.2 ± 9.3 kcal/dL 2,384 ± 845 kcal/d exclusively breast- 82.9 ± 12.2 kcal/dL 2,337 ± 724 kcal/d feeding Energy content measured by bomb calorimetry 66.5 kcal/dL ± 7.74 2,531 ± 442 kcal/d Exclusively breast- (range 51.9â81.2 feeding kcal/dL) Full-term pregnancies 69.7 ± 6.7 kcal/dL 2,340 kcal/d Healthy, exclusively 70.7 ± 9.2 kcal/dL (range: 1,477â breast-feeding mothers 70.9 ± 7.4 kcal/dL 3,201 kcal/d) 70.6 ± 11.0 kcal/dL 66.9 kcal/dL Not reported Healthy, full-term, 69.3 kcal/dL exclusively breast-fed 71.7 kcal/dL No additional solid foods 71.7 kcal/dL consumed before 4 mo of age
174 DIETARY REFERENCE INTAKES cal activity in healthy, active children. An index of physical activity, PAL, defined as the ratio of TEE:BEE, reflects differences in lifestyle, geographic habitat, and socioeconomic conditions. Torun and coworkers (1996) reviewed PALs estimated by DLW, heart rate monitoring, and time-motion/ activity diary techniques in children. Mean PALs were between 1.4 and 1.5 for children less than 5 years of age and between 1.5 and 1.8 for children 6 to 18 years of age living in urban settings in industrialized countries. Total Energy Expenditure. TEE has been measured by the DLW method in a number of studies of children. Black and coworkers (1996) compiled DLW studies on 2- to 6-year-old children from around the world. In their analysis of cross sectional data on 196 children they found the mean TEE per kg of body weight was significantly higher in boys (p < 0.05) than in girls, but not for BMR or PAL. Growth. The energy cost of growth for children (Table 5-19) was com- puted based on rates of weight gain of children enrolled in the FELS Longitudinal Study (Baumgartner et al., 1986) and estimated rates of pro- tein and fat deposition for children (Fomon et al., 1982). It is recognized that the energy content of newly synthesized tissues varies in childhood, particularly during the childhood adiposity rebound (Rolland-Cachera, 2001; Rolland-Cachera et al., 1984), but these variations are assumed to minimally impact total energy requirements of children, as only from 8 to 32 kcal/d are estimated to be required for tissue deposition. EER Summary, Ages 3 Through 8 Years Marked variability exists for boys and girls in the EER because of varia- tions in growth rate and physical activity (Zlotkin, 1996). To derive total energy requirements, the DLW data (Appendix Table I-2) were utilized to develop equations to predict TEE based on a childâs gender, age, height, weight and PAL category (Appendix Table I-8 gives the constants and standard errors of the predictive equations). The calculated TEE is increased by an average of 20 kcal/d for estimated energy deposition (Table 5-19) to get the EER. EER predictions for children with reference weights for ages 3 through 8 years are given below and values are summarized at yearly intervals for reference-weight children in Tables 5-20 (boys) and 5-21 (girls). EER for Boys 3 Through 8 years EER = TEE + energy deposition EER = 88.5 â (61.9 Ã age [y]) + PA Ã (26.7 Ã weight [kg] + 903 Ã height [m]) + 20 kcal
175 E NERGY TABLE 5-19 Weight Gain and Energy Deposition of Boys and Girls 3 Through 18 Years of Age Energy Energy Age at End of Weight Gain Weight Gain Deposition Deposition (kg/6 mo)a (g/d) a (kcal/g)b (kcal/d)b Interval (y) Boys 3.5 1.0 5 1.5 8.1 4.5 1.1 6 1.5 8.7 5.5 1.2 6 1.5 9.5 6.5 1.2 6 1.7 10.8 7.5 1.4 8 2.4 18.2 8.5 1.4 8 2.4 18.8 9.5 1.5 8 2.6 22.0 10.5 1.6 9 2.9 25.6 11.5 1.9 10 3.1 32.6 12.5 2.5 13 1.8 24.1 13.5 3.1 17 1.3 22.1 14.5 3.7 20 1.5 29.3 15.5 2.6 14 1.7 24.3 16.5 1.7 9 1.9 18.0 17.5 1.1 6 2.0 12.2 Girls 3.5 1.0 5 1.7 9.3 4.5 0.9 5 2.0 10.3 5.5 1.0 5 2.2 11.7 6.5 1.2 7 2.6 17.0 7.5 1.3 7 2.9 21.0 8.5 1.5 8 3.1 25.2 9.5 1.5 8 3.3 27.7 10.5 2.0 11 2.8 30.1 11.5 2.5 14 2.3 31.8 12.5 2.8 15 1.9 28.3 13.5 2.3 13 3.0 37.9 14.5 1.5 8 4.1 33.7 15.5 0.9 5 5.1 25.7 16.5 0.8 4 4.9 20.3 17.5 0.4 2 4.0 8.8 a Increments in weight at the 50th percentile (Baumgartner et al., 1986). b Rates of protein and fat deposition (Fomon et al., 1982; Haschke, 1989). Where PA is the physical activity coefficient: PA = 1.00 if PAL is estimated to be ⥠1.0 < 1.4 (sedentary) PA = 1.13 if PAL is estimated to be ⥠1.4 < 1.6 (low active) PA = 1.26 if PAL is estimated to be ⥠1.6 < 1.9 (active) PA = 1.42 if PAL is estimated to be ⥠1.9 < 2.5 (very active)
176 DIETARY REFERENCE INTAKES TABLE 5-20 Estimated Energy Requirement (EER) for Boys 3 Through 18 Years of Age Total Energy Expenditureb (TEE) (kcal/d) Reference Reference Low Very Weight Height Sedentary Active Active Active (kg [lb]) a Age (y) (m [in]) PAL PAL PAL PAL 3 14.3 (31.5) 0.95 (37.4) 1,142 1,304 1,465 1,663 4 16.2 (35.7) 1.02 (40.2) 1,195 1,370 1,546 1,763 5 18.4 (40.5) 1.09 (42.9) 1,255 1,446 1,638 1,874 6 20.7 (45.6) 1.15 (45.3) 1,308 1,515 1,722 1,977 7 23.1 (50.9) 1.22 (48.0) 1,373 1,597 1,820 2,095 8 25.6 (56.4) 1.28 (50.4) 1,433 1,672 1,911 2,205 9 28.6 (63.0) 1.34 (52.8) 1,505 1,762 2,018 2,334 10 31.9 (70.3) 1.39 (54.7) 1,576 1,850 2,124 2,461 11 35.9 (79.1) 1.44 (56.7) 1,666 1,960 2,254 2,615 12 40.5 (89.2) 1.49 (58.7) 1,773 2,088 2,403 2,792 13 45.6 (100.4) 1.56 (61.4) 1,910 2,251 2,593 3,013 14 51.0 (112.3) 1.64 (64.6) 2,065 2,434 2,804 3,258 15 56.3 (124.0) 1.70 (66.9) 2,198 2,593 2,988 3,474 16 60.9 (134.1) 1.74 (68.5) 2,295 2,711 3,127 3,638 17 64.6 (142.3) 1.75 (68.9) 2,341 2,771 3,201 3,729 18 67.2 (148.0) 1.76 (69.3) 2,358 2,798 3,238 3,779 a From Table 5-8. b Based on equations given in Appendix Table I-8. PAL = physical activity level. c EER = TEE + 20 kcal/d â estimate of energy deposition during childhood. EER for Girls 3 Through 8 Years EER = TEE + energy deposition EER = 135.3 â (30.8 à age [y]) + PA à (10.0 à weight [kg] + 934 à height [m]) + 20 kcal Where PA is the physical activity coefficient: PA = 1.00 if PAL is estimated to be ⥠1.0 < 1.4 (sedentary) PA = 1.16 if PAL is estimated to be ⥠1.4 < 1.6 (low active) PA = 1.31 if PAL is estimated to be ⥠1.6 < 1.9 (active) PA = 1.56 if PAL is estimated to be ⥠1.9 < 2.5 (very active)
177 E NERGY EERc (kcal/d) Low Very Sedentary Active Active Active PAL PAL PAL PAL 1,162 1,324 1,485 1,683 1,215 1,390 1,566 1,783 1,275 1,466 1,658 1,894 1,328 1,535 1,742 1,997 1,393 1,617 1,840 2,115 1,453 1,692 1,931 2,225 1,530 1,787 2,043 2,359 1,601 1,875 2,149 2,486 1,691 1,985 2,279 2,640 1,798 2,113 2,428 2,817 1,935 2,276 2,618 3,038 2,090 2,459 2,829 3,283 2,223 2,618 3,013 3,499 2,320 2,736 3,152 3,663 2,366 2,796 3,226 3,754 2,383 2,823 3,263 3,804 Children Ages 9 Through 18 Years Evidence Considered in Determining the Estimated Energy Requirement Energy requirements of adolescents are defined to maintain health, promote optimal growth and maturation, and support a desirable level of physical activity. Growth refers to increases in height and weight and changes in physique, body composition, and organ systems. Maturation refers to the rate and timing of progress toward the mature biological state. Developmental changes occur in the reproductive organs, and lead to the development of secondary gender characteristics and to changes in the cardiorespiratory and muscular systems leading to an increases in strength and endurance. As a result of these changes, energy requirements of adolescents increase. In adolescents, changes in occupational and recreational activities further alter energy requirements.
178 DIETARY REFERENCE INTAKES TABLE 5-21 Estimated Energy Requirement (EER) for Girls 3 Through 18 Years of Age Total Energy Expenditureb (TEE) (kcal/d) Reference Reference Low Very Weight Height Sedentary Active Active Active (kg [lb])a PALb Age (y) (m [in]) PAL PAL PAL 3 13.9 (30.6) 0.94 (37.0) 1,060 1,223 1,375 1,629 4 15.8 (34.8) 1.01 (39.8) 1,113 1,290 1,455 1,730 5 17.9 (39.4) 1.08 (42.5) 1,169 1,359 1,537 1,834 6 20.2 (44.5) 1.15 (45.3) 1,227 1,431 1,622 1,941 7 22.8 (50.2) 1.21 (47.6) 1,278 1,495 1,699 2,038 8 25.6 (56.4) 1.28 (50.4) 1,340 1,573 1,790 2,153 9 29.0 (63.9) 1.33 (52.4) 1,390 1,635 1,865 2,248 10 32.9 (72.5) 1.38 (54.3) 1,445 1,704 1,947 2,351 11 37.2 (81.9) 1.44 (56.7) 1,513 1,788 2,046 2,475 12 41.6 (91.6) 1.51 (59.4) 1,592 1,884 2,158 2,615 13 45.8 (100.9) 1.57 (61.8) 1,659 1,967 2,256 2,737 14 49.4 (108.8) 1.60 (63.0) 1,693 2,011 2,309 2,806 15 52.0 (114.5) 1.62 (63.8) 1,706 2,032 2,337 2,845 16 53.9 (118.7) 1.63 (64.2) 1,704 2,034 2,343 2,858 17 55.1 (121.4) 1.63 (64.2) 1,685 2,017 2,328 2,846 18 56.2 (123.8) 1.63 (64.2) 1,665 1,999 2,311 2,833 a From Table 5-9. b Based on equations given in Appendix Table I-8. PAL = physical activity level. c EER = TEE + 20 kcal/d â estimate of energy deposition during childhood. Basal Metabolism. The effect of age on basal metabolism is a function of changes in body composition through adolescence. FFM comprises the bulk of the active metabolic tissue, and energy expenditure is strongly correlated with FFM (Webb, 1981). Marked gender differences in intensity and duration of the adolescent growth spurt in FFM dictates higher energy and nutrient needs in boys than girls (Butte, 2000). The accuracy of the Schofield equations (WN Schofield, 1985) for the prediction of BEE has been evaluated by comparing predicted BEE values with measured BEE values from several studies of adolescents (Torun et al., 1996). Predicted BEE values were within â4.9, and â0.2 percent of measured values in American adolescents (Bandini et al., 1990b) and were within â4.8, â2.9, â7.2, and +16.8 percent of measured values in British adolescents (Livingstone et al., 1992a); however, the sample size was small in some of the age and gender categories. In a large-scale study of 5- to 16-year-old children, predicted BEE agreed within ± 8 percent of measured values (Firouzbakhsh et al., 1993),
179 E NERGY EERc (kcal/d) Low Very Sedentary Active Active Active PAL PAL PAL PAL 1,080 1,243 1,395 1,649 1,133 1,310 1,475 1,750 1,189 1,379 1,557 1,854 1,247 1,451 1,642 1,961 1,298 1,515 1,719 2,058 1,360 1,593 1,810 2,173 1,415 1,660 1,890 2,273 1,470 1,729 1,972 2,376 1,538 1,813 2,071 2,500 1,617 1,909 2,183 2,640 1,684 1,992 2,281 2,762 1,718 2,036 2,334 2,831 1,731 2,057 2,362 2,870 1,729 2,059 2,368 2,883 1,710 2,042 2,353 2,871 1,690 2,024 2,336 2,858 while in another study, the Schofield equations overestimated the BEE of African-American girls in the United States by 8 percent compared to measured values (Wong et al., 1999). The tendency for the equations to overestimate BEE of some adolescents will require further research to determine if universal equations or specific equations for different ethnic groups are warranted. In this report, predictive equations for BEE were derived from the observed BEE provided in the DLW database as described in the earlier section âTEE Equations for Normal-Weight Children.â Thermic Effect of Food. No publications describing TEF in this age group were available. Physical Activity. Physical activity reflects the energy expended in activities beyond basal processes for survival and for the attainment of physical, intellectual, and social well-being. Physical fitness entails muscular,
180 DIETARY REFERENCE INTAKES motor, and cardiorespiratory fitness. Dietary energy recommendations include recommendations for physical activity compatible with health, pre- vention of obesity, and appropriate social and psychological development. The assessment of habitual physical activity and its impact on the energy needs of adolescents is difficult because of the wide variability in lifestyles. PALs of 1.60 to 1.73 at 11 to 14 years of age and 1.50 to 1.65 at 15 to 18 years of age were designated as typical for adolescent boys and girls, respectively, in the 1985 FAO/WHO/UNU report. A detailed categoriza- tion of adolescent lifestyles was also provided that allowed for individual- ization of energy requirements (FAO/WHO/UNU, 1985). Physical activity in adolescents has been estimated by the DLW method, heart rate monitoring, and activityâtime allocation studies. Although heart rate monitors, calibrated against indirect calorimetry, can be used to predict TEE of individuals (Treuth et al., 1998a), the DLW method shows closer agreement when validated against calorimetry than heart rate monitoring or activityâtime allocation studies. Torun and co- workers (1996) extensively reviewed PALs as estimated by DLW, heart rate monitoring, and activityâtime allocation studies conducted in urban and rural areas of industrialized and developing countries. Mean PALs were between 1.45 and 2.05 for children 6 to 18 years of age engaged in light, moderate, or heavy levels of physical activity. Physical activity is generally viewed as having a favorable influence on the growth and physical fitness of youth, but longitudinal data addressing these relationships are limited. Regular physical activity has no apparent effect on statural growth and biological maturation (i.e., skeletal age, age at peak height velocity, and age at menarche) (Malina, 1994; Geithner et al. 1998; Beunen et al., 1992). Data suggesting later menarche in female athletes are associational and retrospective, and do not control for other factors that influence the age at menarche (e.g., genotype, physique, and dietary practices). Regular physical activity is often associated with decreased body fat in both genders and, sometimes, increased FFM, at least in males (Parizkova, 1974; Sunnegardh et al., 1986; Deheeger et al., 1997). It is also associated with greater skeletal mineralization, bone density, and bone mass (Bailey and McCulloch, 1990). However, excessive training associ- ated with, or causing, sustained weight loss and maintenance of excessively low body weights may contribute to bone loss and increased susceptibility to stress fractures (Dhuper et al., 1990; Warren et al., 1986). Information is scant on the relationship between childrenâs physical activity and fitness and present and future health status (Malina, 1994; Twisk, 2001). Most evidence is limited to cross-sectional comparisons of active and nonactive children. Active children tend to have lower skinfold thickness than inactive children (Raitakari et al., 1994; Moore et al., 1995). Short-term training does not seem to alter high blood pressure, low HDL
181 E NERGY cholesterol, and triacylglycerols in otherwise healthy children (Gilliam and Freedson, 1980; Hunt and White, 1980; Linder et al., 1983; Savage et al., 1986). Exercise training has been shown to slightly reduce the percentage body fat and improve lipoprotein profile in obese children (Gutin et al., 2002; Owens et al., 1999; Sasaki et al., 1987). The tracking of body fatness, blood pressure, and lipoprotein profile appears to be moderate from ado- lescence into adulthood (Clarke et al., 1978; Webber et al., 1983; Newman et al., 1986). Total Energy Expenditure. A number of investigators have measured the TEE of adolescents using the DLW method (Davies et al., 1991; Livingstone et al., 1992a; Wong, 1994). While absolute energy expenditure increases with age, energy expenditure per unit body weight decreases across adolescence, primarily due to the decrease in BEE. Growth. The energy cost of growth comprises the energy deposited in newly accrued tissues and the energy expended for tissue synthesis. It is recognized that the energy deposited in newly synthesized tissues varies in childhood, particularly around the adolescent growth spurt, but these variations minimally impact total energy requirements. Longitudinal data on the body composition of normally growing adolescents are not avail- able. However, Haschke (1989) estimated the typical body composition of male and female adolescents from literature values of total body water, potassium, and calcium. FFM increased dramatically from approximately 28 kg at 10.5 years of age to 61 kg at 18.5 years of age in boys of median height and weight, with peak deposition coinciding with peak rates of height gains. The FFM:height ratio was higher in boys than girls, while FM deposition was greater in girls, increasing from 8 kg at 10.5 years of age to 14 kg at 18.5 years of age. As a percentage of body weight, FM increased during this period from 23.5 to 25 percent in girls, and actually declined in boys from 16 to 13 percent by 18.5 years. In this report, the energy cost of growth was computed based on rates of weight gain of children enrolled in the FELS Longitudinal Study (Baumgartner et al., 1986) and rates of protein and fat deposition for children (Fomon et al., 1982) and adolescents (Haschke, 1989) (Table 5-19). The energy cost of tissue deposition was approximately 20 kcal/d, increasing to 30 kcal/d at peak growth velocity. EER Summary, Ages 9 Through 18 Years EERs for adolescents have been based on estimates of energy expendi- ture and requirements for growth based on tissue deposition. Energy requirements of adolescents must take into account habitual physical
182 DIETARY REFERENCE INTAKES activity level and lifestyle consistent with the maintenance of health, opti- mal growth and maturation, and social and economic demands. Marked variability exists in the energy requirements of adolescents due to varying rates of growth and physical activity levels (Zlotkin, 1996). In adolescents, growth is relatively slow except around the adolescent growth spurt, which varies considerably in timing and magnitude between individuals. Occupational and recreational activities also variably affect energy requirements. To derive the EER for children, the DLW data (Appendix Table I-2) were utilized to develop equations (Appendix Table I-8) to predict TEE based on a childâs gender, age, height, weight, and PAL category and added to 25 kcal/d as an estimate of energy deposition (Table 5-19). The TEE equations allow for four levels of activity as shown in Table 5-12. EERs for children with reference heights and weights (Tables 5-8 and 5-9) for ages 9 through 18 are given below and values are summarized in yearly intervals for children with reference weights in Tables 5-20 (boys) and 5-21 (girls). The equations below are the same as those used for children ages 3 to 8 years, but the additional amount added to cover energy deposition resulting from growth is somewhat larger (25 kcal/d compared with 20 kcal/d). EER for Boys 9 Through 18 Years EER = TEE + energy deposition EER = 88.5 â (61.9 à age [y]) + PA à (26.7 à weight [kg] + 903 à height [m]) + 25 kcal Where PA is the physical activity coefficient: PA = 1.00 if PAL is estimated to be ⥠1.0 < 1.4 (sedentary) PA = 1.13 if PAL is estimated to be ⥠1.4 < 1.6 (low active) PA = 1.26 if PAL is estimated to be ⥠1.6 < 1.9 (active) PA = 1.42 if PAL is estimated to be ⥠1.9 < 2.5 (very active) EER for Girls 9 Through 18 Years EER = TEE + energy deposition EER = 135.3 â (30.8 à age [y]) + PA à (10.0 à weight [kg] + 934 à height [m]) + 25 kcal Where PA is the physical activity coefficient: PA = 1.00 if PAL is estimated to be ⥠1.0 < 1.4 (sedentary) PA = 1.16 if PAL is estimated to be ⥠1.4 < 1.6 (low active) PA = 1.31 if PAL is estimated to be ⥠1.6 < 1.9 (active) PA = 1.56 if PAL is estimated to be ⥠1.9 < 2.5 (very active)
183 E NERGY Adults Ages 19 Years and Older Evidence Considered in Determining the Estimated Energy Requirement Weight and Height. In adults, BEE predictions are not generally or sig- nificantly improved by considering weight and height, as compared to weight alone (WN Schofield, 1985). In the present approach for evaluating TEE in adults with body weights in the desirable range, however, height becomes a significant factor because desirable body weights (i.e., those corresponding to BMIs in the range from 18.5 up to 25 kg/m2) depend on an individualâs height. The impact of height and weight on TEE are shown quantitatively in Figures 5-7 and 5-8. Age. Age comes out as a significant parameter in the multiple regres- sion analysis performed on the DLW database for subjects with BMIs from 18.5 up to 25 kg/m2 (Appendix Table I-3). The age-related decline in TEE was found to amount to approximately 10 and 7 kcal/y for adult men and women, respectively. Physical Activity. The physical activities carried out by free-living indi- viduals vary greatly in intensity as well as duration, and assessment of physical activity-induced increments in TEE in individuals is fraught with considerable uncertainties. For this reason, individuals in the DLW data- base are classified as sedentary, low active, active, or very active (Table 5-12). Currently available reliable data on PAL can be obtained only by the DLW technique. The 407 individuals studied in this manner have been included in the DLW database shown in Appendix Table I-3. Other techniques involving heart rate monitors and accelerometers have also been used to estimate TEE, but their accuracy depends on careful individual calibration of these instruments for each subject studied. In spite of concerns about obtaining accurate estimates, it is important to be able to evaluate PAL and TEE in individuals for whom such data are not available or for whom these approaches are not practical. One way to do this is to evaluate physical efforts by estimating how many miles an individual would have to walk in one day to induce a comparable level of exertion (in terms of kcal expended). For example, individuals who have 30 minutes of moderately intense activity (equivalent to walking 2 miles in 30 minutes or an equivalent amount of physical exertion in addition to the activities involved in maintaining a sedentary lifestyle) have a PAL of about 1.5 (see Table 12-2), and they are classified as âlow activeâ in this report. To raise a PAL from 1.5 to 1.75, in addition to activity equivalent to
184 DIETARY REFERENCE INTAKES walking 2 miles in 30 minutes, each day one would to need increase activ- ity to the equivalent of walking an additional 1 hour at 4.5 mph (an equiva- lent activity would be to bicycle for 1 hour at 10 to 12 mph, use a stair- treadmill for 1 hour, or run for 30 minutes at 6 mph while maintaining the habitual daily routine of other activities). The change in PAL induced by various types of physical activities can be estimated with the help of Table 12-1, which contains a list of the physical activities typically performed and the impact on PAL when they are performed for 10 minutes or 1 hour. Unlike food intake, which is generally underreported, physical activities tend to be overestimated, and activities of one kind may cause a reduction in activities of another. Thus, subjective determination of PAL has errors similar to using dietary intake to obtain EERs. Body Weight and PAL. PAL describes the ratio of TEE divided by BEE extrapolated to one day. Whereas the energy cost of weight-bearing physi- cal activities is approximately proportional to body weight, BEE is not pro- portional to body weight, as the contribution of FFM to basal metabolism is much greater than FM (resulting in a substantial intercept in the equa- tions relating BEE to body weight). The relationship between miles walked per day (or between other weight bearing activities) and PAL is thus not linear, and it will take fewer miles at a given walking speed to raise PAL in a heavy compared to a light-weight individual (see Table 5-12). EER Summary, Ages 19 Years and Older Separate TEE predictive equations for EER were developed for adult men and women from age, height, weight, and PAL category, which were determined using the observed BEE for individuals in the DLW database (Appendix Table I-3). Individual data were not used in the derivation of the TEE equations if the PAL value was less than 1.0 or greater than 2.5. Plots of the residuals showed no evidence of nonlinear patterns of bias (although there was a general increased magnitude of residuals with in- creasing values of each variable). The additional predictive value of BMI and the squares of age, height, and weight were explored for the linear predictions and none of these significantly reduced the standard error of the fit. The coefficients and standard error for the prediction of TEE of adults, ages 19 years and older, are described in Appendix Table I-9 and are summarized below. EERs for 30-year-old adult women and men of various heights with BMIs from 18.5 up to 25 kg/m2 are shown in Table 5-22.
185 E NERGY EER for Men Ages 19 Years and Older EER = 662 â (9.53 à age [y]) + PA à (15.91 à weight [kg] + 539.6 à height [m]) Where PA is the physical activity coefficient: PA = 1.00 if PAL is estimated to be ⥠1.0 < 1.4 (sedentary) PA = 1.11 if PAL is estimated to be ⥠1.4 < 1.6 (low active) PA = 1.25 if PAL is estimated to be ⥠1.6 < 1.9 (active) PA = 1.48 if PAL is estimated to be ⥠1.9 < 2.5 (very active) EER for Women Ages 19 Years and Older EER = 354 â (6.91 à age [y]) + PA à (9.36 à weight [kg] + 726 à height [m]) Where PA is the physical activity coefficient: PA = 1.00 if PAL is estimated to be ⥠1.0 < 1.4 (sedentary) PA = 1.12 if PAL is estimated to be ⥠1.4 < 1.6 (low active) PA = 1.27 if PAL is estimated to be ⥠1.6 < 1.9 (active) PA = 1.45 if PAL is estimated to be ⥠1.9 < 2.5 (very active) Pregnancy Evidence Considered to Determine the Estimated Energy Requirement Basal Metabolism. Basal metabolism increases during pregnancy due to the metabolic contribution of the uterus and fetus and increased work of the heart and lungs. The increase in basal metabolism is one of the major components of the increased energy requirements during pregnancy (Hytten, 1991a). Variation in energy expenditure between individuals is largely due to differences in FFM, which in pregnancy is comprised of low energy-requiring expanded blood volume, high energy-requiring fetal and uterine tissues, and moderate energy-requiring skeletal muscle mass (Hytten, 1991a). In late pregnancy, approximately one-half the increment in energy expenditure can be attributed to the fetus (Hytten, 1991a). The fetus uses about 8 ml O2/kg body weight/min or 56 kcal/kg body weight/d; for a 3-kg fetus, this would be equivalent to 168 kcal/d (Sparks et al., 1980). FM, a low energy-requiring tissue, contributes to the variation in energy expenditure, but to a much lesser extent than FFM, which has been found to be the strongest predictor of BEE (Butte et al., 1999). The basal metabolism of pregnant women has been estimated longitu- dinally in a number of studies using a Douglas bag, ventilated hood, or whole-body respiration calorimeter (Durnin et al., 1987; Forsum et al.,
186 DIETARY REFERENCE INTAKES TABLE 5-22 Estimated Energy Requirements (EER) for Men and Women 30 Years of Agea Weight for BMI Weight for BMI of 18.5 kg/m2 of 24.99 kg/m2 Height PALb (m [in]) (kg [lb]) (kg [lb]) 1.45 (57) Sedentary 38.9 (86) 52.5 (116) Low active Active Very active 1.50 (59) Sedentary 41.6 (92) 56.2 (124) Low active Active Very active 1.55 (61) Sedentary 44.4 (98) 60.0 (132) Low active Active Very active 1.60 (63) Sedentary 47.4 (104) 64.0 (141) Low active Active Very active 1.65 (65) Sedentary 50.4 (111) 68.0 (150) Low active Active Very active 1.70 (67) Sedentary 53.5 (118) 72.2 (159) Low active Active Very active 1.75 (69) Sedentary 56.7 (125) 76.5 (168) Low active Active Very active 1.80 (71) Sedentary 59.9 (132) 81.0 (178) Low active Active Very active 1.85 (73) Sedentary 63.3 (139) 85.5 (188) Low active Active Very active
187 E NERGY EER, Men (kcal/d)c EER, Women (kcal/d)d BMI of BMI of BMI of BMI of 18.5 kg/m2 24.99 kg/m2 18.5 kg/m2 24.99 kg/m2 1,777 1,994 1,563 1,691 1,931 2,172 1,733 1,877 2,128 2,399 1,946 2,108 2,450 2,771 2,201 2,386 1,848 2,080 1,625 1,762 2,010 2,268 1,803 1,956 2,216 2,506 2,025 2,198 2,554 2,898 2,291 2,489 1,919 2,168 1,688 1,834 2,089 2,365 1,873 2,036 2,305 2,616 2,104 2,290 2,661 3,028 2,382 2,593 1,993 2,257 1,752 1,907 2,171 2,464 1,944 2,118 2,397 2,728 2,185 2,383 2,769 3,160 2,474 2,699 2,068 2,349 1,816 1,981 2,254 2,566 2,016 2,202 2,490 2,842 2,267 2,477 2,880 3,296 2,567 2,807 2,144 2,442 1,881 2,057 2,339 2,670 2,090 2,286 2,586 2,959 2,350 2,573 2,993 3,434 2,662 2,916 2,222 2,538 1,948 2,134 2,425 2,776 2,164 2,372 2,683 3,078 2,434 2,670 3,108 3,576 2,758 3,028 2,301 2,636 2,015 2,211 2,513 2,884 2,239 2,459 2,782 3,200 2,519 2,769 3,225 3,720 2,855 3,140 2,382 2,735 2,082 2,290 2,602 2,995 2,315 2,548 2,883 3,325 2,605 2,869 3,344 3,867 2,954 3,255 continued
188 DIETARY REFERENCE INTAKES TABLE 5-22 Continued Weight for BMI Weight for BMI of 18.5 kg/m2 of 24.99 kg/m2 Height PALb (m [in]) (kg [lb]) (kg [lb]) 1.90 (75) Sedentary 66.8 (147) 90.2 (198) Low active Active Very active 1.95 (77) Sedentary 70.3 (155) 95.0 (209) Low active Active Very active a For each year below 30, add 7 kcal/d for women and 10 kcal/d for men. For each year above 30, subtract 7 kcal/d for women and 10 kcal/d for men. b PAL = physical activity level. c EER for men calculated as: EER = 662 â (9.53 Ã age [y]) + PA Ã (15.91 Ã weight [kg] + 539.6 Ã height [m]), where PA is the physical activity coefficient of 1.00 for sedentary 1988; Goldberg et al., 1993; van Raaij et al., 1990). Cumulative changes in BEE throughout pregnancy ranged from 29,636 to 50,300 kcal or 106 to 180 kcal/d (Table 5-23). Marked variation in the basal metabolic response to pregnancy was seen in 12 British women measured before and through- out pregnancy (Goldberg et al., 1993; Prentice et al., 1989). By 36 weeks of gestation, the increment in absolute BEE ranged from 8.6 to 35.4 percent, or â9.2 to 18.6 percent/kg FFM. Energy-sparing or energy-profligate responses to pregnancy were dependent on prepregnancy body fatness. In 12 Dutch women, the late-pregnancy increment in absolute TEE varied from 9.5 to 26 percent (de Groot et al., 1994). Mean increments in BEE over prepregnancy values were 48, 96, and 263 kcal/d, or 4, 7, and 19 percent in the first, second, and third trimesters in healthy women with positive pregnancy outcomes (Prentice et al., 1996b). The cumulative increase in BEE was positively correlated with weight gain and body fatness. Prediction equations for the BEE of pregnant women have not been published. Nonpregnant prediction equations based on weight are not accurate during pregnancy since metabolic rate increases disproportion- ately to the increase in total body weight. Prentice and colleagues (1996b) suggested that BEE could be predicted from weight using the Schofield equations, plus an additional 48, 96, and 263 kcal/d during the first, second, and third trimesters.
189 E NERGY EER, Men (kcal/d)c EER, Women (kcal/d)d BMI of BMI of BMI of BMI of 18.5 kg/m2 24.99 kg/m2 18.5 kg/m2 24.99 kg/m2 2,464 2,837 2,151 2,371 2,694 3,107 2,392 2,637 2,986 3,452 2,692 2,971 3,466 4,018 3,053 3,371 2,548 2,940 2,221 2,452 2,786 3,222 2,470 2,728 3,090 3,581 2,781 3,074 3,590 4,171 3,154 3,489 PAL (⥠1.0 < 1.4), 1.11 for low active PAL (⥠1.4 < 1.6), 1.25 for active PAL (⥠1.6 < 1.9), and 1.48 for very active PAL (⥠1.9 < 2.5). d EER for women calculated as: EER = 354 â (6.91 à age [y]) + PA à (9.36 à weight [kg] + 726 à height [m]), where PA is the physical activity coefficient of 1.00 for sedentary PAL, 1.12 for low active PAL, 1.27 for active PAL, and 1.45 for very active PAL. In late gestation, the anti-insulinogenic and lipolytic effects of human chorionic somatomammotropin, prolactin, cortisol, and glucagon contrib- ute to glucose intolerance, insulin resistance, decreased hepatic glycogen, and mobilization of adipose tissue (Kalkhoff et al., 1978). Although levels of serum prolactin, cortisol, glucagon, and fatty acids were elevated and serum glucose levels were lower in one study, a greater utilization of fatty acids was not observed during late pregnancy (Butte et al., 1999). On the contrary, higher mean respiratory quotients (RQs) were observed for BEE and TEE compared with the postpartum period. Higher basal RQs have been observed in pregnancy by several (Bronstein et al., 1995; Denne et al., 1991; Knuttgen and Emerson, 1974; van Raaij et al., 1989), but not all (Spaaij et al., 1994b) investigators. These observations are consistent with persistent glucose production in fasted pregnant women, despite lower fasting plasma glucose concentrations. After fasting, the total rates of glu- cose production and total gluconeogenesis were increased, even though the fraction of glucose oxidized and the fractional contribution of gluco- neogenesis to glucose production remained unchanged (Assel et al., 1993; Kalhan et al., 1997). In pregnant women, the sustained energy expendi- ture and higher RQ may reflect the obligatory oxygen consumption of the fetus and the contribution of glucose as the primary oxidative substrate of the fetus. In late gestation, the fetus is estimated to use 17 to 26 g/d of
190 DIETARY REFERENCE INTAKES TABLE 5-23 Cumulative Changes in Basal Energy Expenditure (BEE) Throughout Pregnancy Pregravid Weight Reference (kg [lb]) Gestation Interval n Durnin et al., 88 57.3±7.5 Prepregnancy to 40 wk 1987 (126.1±16.5) van Raaij et al., 57 62.5±8.1 3 wk to term 1987 (137.5±17.8) Forsum et al., 22 61.0± 9.9 Prepregnancy to 40 wk 1988 (134.2±21.8) Goldberg et al., 12 61.7±8.8 Prepregnancy to 40 wk 1993 (135.7±19.3) Kopp-Hoolihan 10 NA Prepregnancy to 35 wk et al., 1999 a The Douglas bag technique of indirect calorimetry was used to estimate BEE. glucose (Hay, 1994), well within the increment of carbohydrate oxidation observed in pregnancy. Thermic Effect of Food. In studies of pregnant women, TEF has been shown to be unchanged (Bronstein et al., 1995; Nagy and King, 1984; Spaaij et al., 1994b) or lower (Schutz et al., 1988) than values of non- pregnant women. Physical Activity. Until late gestation, the gross energy cost of standard- ized nonweight-bearing activity does not significantly change. In the last month of pregnancy, the energy expended while cycling was increased on the order of 10 percent. However, when corrected for increased BMR the increased energy expenditure due to the activity of cycling was 6 percent (Prentice et al., 1996b). The energy cost of standardized weight-bearing activities such as treadmill walking was unchanged until 25 weeks of gesta- tion, after which it increased by 19 percent (Prentice et al., 1996b). Stan- dardized protocols, however, do not allow for behavioral changes in pace and intensity of physical activity, which may occur and conserve energy during pregnancy. Growth of Maternal and Fetal Tissues. Gestational weight gain includes the products of conception (fetus, placenta, and amniotic fluid) and accretion of maternal tissues (uterus, breasts, blood, extracellular fluid, and adipose). The energy cost of deposition can be calculated from the amount of protein and fat deposited. Hytten (1991b) made theoretical
191 E NERGY Cumulative Cumulative Method Used Increase in Increase in to Estimate BEE (kcal) BEE (kcal/d) BEE Indirect calorimetrya 30,114 108 Indirect calorimetrya 34,416 133 50,300 180 DLW 29,636 106 DLW 36,089 147 DLW calculations based on a weight gain of 12.5 kg and birth weight of 3.4 kg. The energy equivalents for protein and fat deposition were assumed to be 5.6 kcal/g and 9.5 kcal/g, respectively. The energy cost of tissue deposi- tion was equivalent to 3.32 kcal/g gained (Table 5-24). Current recommendations for weight gain during pregnancy are speci- fied for a womanâs prepregnancy BMI (IOM, 1990). Total weight gain during pregnancy varies widely among women. For normal-weight women, the mean rate of weight gain is 1.6 kg in the first trimester and 0.44 kg/wk in the second and third trimesters (IOM, 1990). For underweight women, the mean rate of weight gain is 2.3 kg in the first trimester and 0.49 kg/wk in the second and third trimesters. For overweight women, the mean rate of weight gain is 0.9 kg in the first trimester and 0.30 kg/wk in the second and third trimesters. Fat gains associated with gestational weight gains within the IOM recom- mended ranges were measured in 200 women with varying prepregnancy BMIs using a four-component body composition model (Lederman et al., 1997). The total energy deposition between 14 and 37+ weeks of gestation was calculated based on an assumed protein deposition of 925 g of protein, and energy equivalences of 5.65 kcal/g of protein and 9.25 kcal/g of fat (Table 5-25). Empirical data on the longitudinal changes in the body composition of well-nourished, normal weight (prepregnancy BMI from 18.5 up to 25 kg/m2) pregnant women were used to estimate the energy deposition during pregnancy. Studies in which a prepregnancy baseline or first tri- mester value was available and methodology was appropriately corrected
192 DIETARY REFERENCE INTAKES TABLE 5-24 Theoretical Energy Cost of Tissue Deposition During Pregnancy Protein Fat Protein Fat Gain Gain Total Energy Depositiona (kcal) Gain (g) Gain (g) (kcal) (kcal) Fetus 440 440 2,464 4,180 6,644 Placenta 100 4 560 38 598 Amniotic fluid 3 0 17 0 17 Uterus 166 4 930 38 968 Breasts 81 12 454 114 568 Blood 135 20 756 190 946 Maternal stores 3,345 31,778 31,778 Total 925 3,825 5,180 36,338 41,518 a Based on 5.6 kcal/g for protein gained and 9.5 kcal/g for fat gained. SOURCE: Adapted from Hytten (1991b). TABLE 5-25 Estimated Energy Deposition During Pregnancy Prepregnancy Recommended Estimated Body Mass Gestational Actual Fat Energy Weight Gain a Depositionb Index (BMI) GWG Gain (kg/m2) (GWG) (kg [lb]) (kg [lb]) (kg) (kcal) Low (BMI < 19.8) 12.5â18.0 (28â40) 12.6±2.4 6.0±2.6 60,726 (28±5.3) Normal (BMI = 11.5â16.0 (25â35) 12.1±3.4 3.8±3.5 40,376 19.8â26.0) (27±7.5) High (BMI > 7.0â11.5 (15â25) 9.1±3.1 2.8±4.1 31,126 26.0â29.0) (20±6.8) At least 6.8 (15)c 6.9±4.4 â0.6±4.6 â324 Obese (BMI > 29.0) (15±9.7) a As recommended by IOM (1990). b Calculated based on assumed 5.65 kcal/g of protein gained and 9.25 kcal/g of fat gained. c Lederman et al. (1997), used 7â9.2 kg (15â20 lb). SOURCE: Adapted from Lederman et al. (1997). for pregnancy-induced changes in the hydration or density of FFM were used (Table 5-26). Total energy deposition during pregnancy was estimated from the mean fat gain of 3.7 kg from these studies, plus an assumed deposition of 925 g of protein, applying energy equivalencies of 5.65 kcal/g of protein and 9.25 kcal/g of fat. Mean total energy deposition was equal to 39,862 kcal or 180 kcal/d (Table 5-26).
193 E NERGY Total Energy Expenditure. The DLW method has been employed in four studies of well-nourished, pregnant women to measure free-living TEE (Forsum et al., 1992; Goldberg et al., 1991b, 1993; Kopp-Hoolihan et al., 1999) (Table 5-27). There appeared to be a steady decrease in PAL as pregnancy advanced, primarily due to the increase in the denominator, BEE. In the British (Goldberg et al., 1993) and Swedish women (Forsum et al., 1992) studied, the energy expenditure for activity (TEE â BEE) decreased in the 36th week of gestation; this decrease was not observed in the American women (Kopp-Hoolihan et al., 1999). EER Summary, Pregnancy The DLW database on pregnant women with prepregnancy BMIs from 18.5 up to 25 kg/m2 (Appendix Table I-4) consists of longitudinal mea- surements of TEE throughout pregnancy, and in most cases includes a TEE measurement prior to pregnancy. Therefore, the average TEE change/gestational week was computed for each woman, and the median value of these data were assumed to represent the general trend. The median change in TEE was 8 kcal per week of gestation with a range of â57 to 107 kcal/wk. There was great variability in the average TEE change/ week between women and studies; however, few predictive factors were identified. The change in TEE was not related to maternal age, prepregnancy weight, prepregnancy BMI, or weight gain or loss during pregnancy. The change in TEE, however, is negatively correlated to the baseline PAL. The EER for energy during pregnancy is derived from the sum of the TEE of the woman in the nonpregnant state plus a median change in TEE of 8 kcal/wk plus the energy deposition during pregnancy of 180 kcal/d (Table 5-26). Since TEE changes little and weight gain is minor during the first trimester, no increase in energy intake during the first trimester is recommended. EER for Pregnancy 14â18 years EERpregnant = adolescent EERnonpregnant + additional energy expended during pregnancy + energy deposition 1st trimester = adolescent EER + 0 + 0 2nd trimester = adolescent EER + 160 kcal (8 kcal/wk à 20 wk) + 180 kcal 3rd trimester = adolescent EER + 272 kcal (8 kcal/wk à 24 wk) + 180 kcal
194 DIETARY REFERENCE INTAKES TABLE 5-26 Energy Deposition During Pregnancy Observed Body Gestation Gestational Weight Composition Method a Reference Interval (wk) Gain (kg [lb]) n Pipe et al., 1979 27 12â37 10.40 (23) TBW TBK Forsum et al., 1988 22 0â36 13.60 (30) TBW TBK van Raaij et al., 1988 42 11â35 9.15 (20) UWW 11.60 (26) Goldberg et al., 1993 12 0â36 11.91 (26) TBW de Groot et al., 1994 12 0â34 11.70 (26) UWW Lederman et al., 1997 46 14â37 12.10 (27) TBW UWW BMC Lindsay et al., 1997 27 0â33/36 12.61 (28) UWW Sohlstrom and 16 0â5/10 d 15.80 (35) MRI Forsum, 1997 postpartum Kopp-Hoolihan et al., 10 0â34 11.60 (26) TBW 1999 UWW BMC Mean a TBW = total body water, TBK = total body potassium, UWW = underwater weighing, BMC = bone mineral content, MRI = magnetic resonance imaging. 19â50 years EERpregnant = EERnonpregnant + additional energy expended during pregnancy + energy deposition 1st trimester = adult EER + 0 + 0 2nd trimester = adult EER + 160 kcal (8 kcal/wk à 20 wk) + 180 kcal 3rd trimester = adult EER + 272 kcal (8 kcal/wk à 34 wk) + 180 kcal
195 E NERGY Theoretical Measured Energy Energy Energy Depositionc Protein Fat Gain Deposition Deposition Gain b (kg) (kg) (kcal) (kcal/d) (kcal/g) 0.925 2.40 27,426 157 2.64 0.925 5.8 58,876 234 4.33 0.925 1.9 22,801 136 2.49 0.925 2.8 31,126 124 2.61 0.925 3.4 36,676 154 3.13 0.925 3.8 40,376 251 3.34 0.925 5.9 59,801 247 4.74 0.925 3.6 38,526 138 2.44 0.925 4.5 43,151 176 3.85 3.7 38,862 180 b From Hytten (1991b) (see Table 5-24). c Based on 5.65 kcak/g of protein gained and 9.25 kcal/g of fat gained. Lactation Evidence Considered in Determining the Estimated Energy Requirement Basal Metabolism. Increased RMRs and SMRs have been observed in lactating women on the order of 4 to 5 percent (Butte et al., 1999; Forsum et al., 1992; Sadurskis et al., 1988; Spaaij et al., 1994a). The increased energy expenditure is consistent with the additional energy cost of milk synthesis. Others have reported lower (Guillermo-Tuazon et al., 1992) or
196 DIETARY REFERENCE INTAKES TABLE 5-27 Doubly Labeled Water Pregnancy Studies Pregravid Gestational Gestation Weight Weight Reference Week (kg) Gain (kg) n Goldberg et al., 1991b 10 36 â â Forsum et al., 1992 22 0 60.8 13.5 22 16â18 22 30 19 36 Goldberg et al., 1993 12 0 61.7 11.91 6 12 18 24 30 36 Kopp-Hoolihan et al., 1999 10 0 â 11.6 8â10 24â26 34â36 a Physical activity level = total energy expenditure/basal energy expenditure. similar BEE or RMR in lactating women compared to the nonlactating state (Frigerio et al., 1991; Goldberg et al., 1991b; Illingworth et al., 1986; Motil et al., 1990; Piers et al., 1995b; van Raaij et al., 1991). Interpretation of these studies is difficult because BEE or RMR was not always adjusted for differences in body weight or body composition between comparison groups. In general, it would appear that BEE or RMR is unchanged or slightly elevated during lactation; there is little evidence of energy conser- vation. Higher RQs and rates of carbohydrate utilization have been reported in lactating compared with nonlactating women, consistent with the pref- erential use of glucose by the mammary gland (Butte et al., 1999). Con- flicting results of lower fasting RQ (0.82 versus 0.85) (Spaaij et al., 1994a), as well as no significant differences in RQ during lactation, have been reported (Frigerio et al., 1991; Piers et al., 1995b; van Raaij et al., 1991). Thermic Effect of Food. TEF was reported to be 30 percent lower during than after lactation in one study (Illingworth et al., 1986), but unchanged
197 E NERGY Total Activity Energy Physical Energy Expenditure Activity Expenditure Levela (kcal/d) (kcal/d) 2,470 1.42 731 2,484 1.87 1,147 2,293 1.65 860 2,986 1.82 1,338 2,914 1.66 1,171 2,274 1.58 835 2,322 1.54 818 2,426 1.64 939 2,456 1.65 964 2,621 1.66 1,042 2,675 1.62 1,026 2,688 1.50 885 2,205 1.68 892 2,047 1.57 743 2,410 1.56 867 2,728 1.61 1,038 in another (Spaaij et al., 1994a). Although results are conflicting, it is unlikely that TEF contributes significantly to the energetic economy of lactating women. Physical Activity. Theoretically, the energy cost of lactation could be met by a reduction in the time spent in physical activity or an increase in the efficiency of performing routine tasks. The energetic cost of nonweight-bearing and weight-bearing activities has been measured in lac- tating women (Spaaij et al., 1994a; van Raaij et al., 1990). Adaptations in the level of physical activity are not always seen in lactating women. Reduc- tions in physical activity have been reported in early lactation (4 to 5 weeks postpartum) in the Netherlands (van Raaij et al., 1991), the United States (Butte et al., 2001), and Great Britain (Goldberg et al., 1991b). Physical activity increased in the lactating Dutch women from 5 to 27 weeks post- partum (van Raaij et al., 1991). By 3 months postpartum, the American women (Butte et al., 2001) had resumed their prepregnancy occupational and recreational lifestyles in addition to their child-rearing responsibilities
198 DIETARY REFERENCE INTAKES TABLE 5-28 Doubly Labeled Water Lactation Studies Total Total Stage of Energy Energy Basal Lactation Expenditure Expenditure Estimation Reference (mo) (kcal/d) (kcal/kg/d) (kcal/d) n Goldberg et al., 10 1 2,109 35.8 1,406 1991b 2 2,171 36.9 1,397 3 2,138 36.5 1,345 Forsum et al., 1992 23 2 2,532 39.3 1,409 6 2,580 41.0 1,433 9 e 3â6 Lovelady et al., 1993 2,413 37.2 1,376 Kopp-Hoolihan 10 1 2,146 â 1,328 et al., 1999 Butte et al., 2001f 24 3 2,391 38.1 1,331 a Unless otherwise noted AEE includes TEF. b Estimated to be 0.67 kcal/g (Butte et al., 1984a, 1984b; Neville, 1995). c Observed change in body composition during lactation. and their physical activity had returned to prepregnancy levels. While a decrease in moderate and discretionary activities appears to occur in most lactating women in the early postpartum period, activity patterns beyond this period are highly variable. Total Energy Expenditure. TEEs of lactating women have been mea- sured by the DLW method in five studies (Butte et al., 2001; Forsum et al., 1992; Goldberg et al., 1991b; Kopp-Hoolihan et al., 1999; Lovelady et al., 1993) as shown in Table 5-28. There are several potential sources of error in using the DLW method in lactation studies. These sources of error may be attributed to isotope exchange and sequestration that occurs during the de novo synthesis of milk fat and lactose, and to increased water flux into milk (Butte et al., 2001). Underestimation of carbon dioxide by 1.0 to 1.3 percent may theoretically occur due to the export of exchangeable hydrogen bound to solids in milk (IDECG, 1990). This underestimation may increase to 1.5 to 3.4 percent due to 2H sequestration. As shown in Table 5-28, mean TEE values of 2,391 kcal/d (PAL = 1.79) (Butte et al., 2001) and 2,413 kcal/d (PAL = 1.76) (Lovelady et al., 1993) in American women were higher than average values reported for British women (2,139 kcal/d; PAL = 1.55) (Goldberg et al., 1991b), and lower than average values in Swedish women (2,556 kcal/d, PAL = 1.80) (Forsum et al., 1992) during lactation. The energy expended in activity (TEE â
199 E NERGY Activity Milk Energy Physical Energy Energy Energy Expenditurea Activity Outputb Mobilizationc Requirementd (kcal/d) Level (kcal/d) (kcal/d) (kcal/d) 703 1.50 536 Gained fat 2,645 774 1.55 532 mass 2,703 793 1.59 530 2,668 1,123 1.82 502 72 2,962 1,123 1.79 1,037 1.75 538 287 2,664 816 1.62 â â â 1,061 1.79 483 155 2,719 d Energy requirement = measured TEE DLW + energy of milk output â energy mobilized from tissues. e All subjects breast-fed, except one. f TEF only for Butte et al. (2001). TEF was 239. BEE) ranged from 700 to 1,100 kcal/d in American, British, and Swedish lactating women. Milk Energy Output. Milk energy output is computed from milk pro- duction and the energy density of human milk. Milk production rates increase during the first 6 months of full lactation. Beyond 6 months post- partum, typical milk production rates are variable and depend on weaning practices. Mean milk production rates of American women were 0.78 L/d in term infants from birth through 6 months of age (Allen et al., 1991; Heinig et al., 1993), and 0.6 L/d in term infants from 7 through 12 months of age (Dewey et al., 1984). The energy density of human milk has been measured by bomb calorimetry or proximate macronutrient analysis of representative 24-hour pooled milk samples. The mean energy density of human milk ranged from 0.64 to 0.74 kcal/g (Butte et al., 1984a, 1984b; Neville, 1995). The value of 0.67 kcal/g is used in this report. Energy Mobilization. The changes in weight and therefore energy mobilization from tissues occur in some, but not all, lactating women (Butte and Hopkinson, 1998; Butte et al., 2001; IOM, 1991). In general, during the first 6 months postpartum, well-nourished lactating women experience a mild, gradual weight loss, averaging â0.8 kg/mo (Butte et al.,
200 DIETARY REFERENCE INTAKES 2001). In some women, the energy costs of lactation may be met by an increase in energy intake or a decrease in physical activity, with no change or even an increase in weight or FM. After monitoring FM in 23 Swedish women, Sadurskis and colleagues (1988) found that FM decreased from 34.3 to 32.4 percent from 2 to 6 months postpartum by 18O dilution and total body potassium counting. Consistent with a minor weight loss and sedentary lifestyle, British women (n = 10) displayed a nonsignificant increase in percent of FM (30.3 to 31.4 percent between 1 to 3 months postpartum) estimated by 2H and 18O dilution (Goldberg et al., 1991b). In American women, FM decreased from 28.0 percent at 1 month to 26.3 percent at 4 months postpartum, mea- sured by underwater weighing (Butte et al., 1984b). Changes in adipose tissue volume in 15 Swedish women were measured by magnetic resonance imaging (Sohlstrom and Forsum, 1995). In the first 6 months postpartum, the subcutaneous region accounted for the entire reduction in adipose tissue volume, which decreased from 23.2 L to 20.0 L; nonsubcutaneous adipose tissue volume actually increased. Mobilization of tissue reserves is a general, but not obligatory, feature of lactation. Total Energy Requirements. The energy requirements of lactating women were estimated from measurements of TEE, milk energy output, and energy mobilization from tissue stores in the following studies in which DLW was used (Butte et al., 2001; Forsum et al., 1992; Goldberg et al., 1991b; Lovelady et al., 1993) (Table 5-28). In the 10 lactating British women, the total energy requirements (and net energy requirements, since there was no fat mobilization) were 2,646, 2,702, and 2,667 kcal/d (11.1, 11.3, and 11.2 MJ/d) at 1, 2, and 3 months postpartum, respectively. Milk energy output averaged 533 kcal/d (2.2 MJ/d) (Goldberg et al., 1991b). In 23 lactating Swedish women, the total energy requirement at 2 months postpartum was 3,034 kcal/d (12.7 MJ/d), offset by 72 kcal/d (0.3 MJ/d) from tissue stores to yield a net requirement of 2,962 kcal/d (12.4 MJ/d) (Forsum et al., 1992). In nine lactating American women, the total energy requirement was 2,413 kcal/d (10.1 MJ/d), with 538 kcal/d (2.3 MJ/d) exported into milk and 287 kcal/d (1.2 MJ/d) mobilized from tissues, yielding a net requirement of 2,663 kcal/d (11.1 MJ/d) (Lovelady et al., 1993). Data from other lactating American women (Butte et al., 2001) give similar results. The women in the above studies were fully breastfeeding their infants, who were less than 6 months of age. In these studies, mean milk energy outputs during full lactation were similar (483 to 538 kcal/d or 2.0 to 2.3 MJ/d). The energetic inefficiency of milk synthesis is encom- passed in the measurement of TEE.
201 E NERGY The stage and extent of breastfeeding affect the incremental energy requirements for lactation. During the first 6 months of lactation, milk production rates are increased (Butte et al., 2001). Customary milk pro- duction rates beyond 6 months postpartum typically vary and depend on weaning practices (Butte et al., 2001). EER Summary, Lactation The DLW database provided TEE values for lactating women with prepregnancy BMIs from 18.5 up to 25 kg/m2 at 1, 2, 3, 4, and 6 months postpartum (Appendix Table I-5). Analysis of the DLW database showed a small but significant change in TEE over these postpartum time periods (ANOVA, P = 0.05). A comparison was made between observed TEE of lactating women and TEE calculated from age, height, weight, and PAL using the prediction equation for adult women (see earlier section, âAdults Ages 19 Years and Olderâ). At 1 month postpartum, observed TEE was about 200 kcal less than predicted, while no differences were apparent at later months. For derivation of the EER for lactation, the TEE is based on the EER for normal-weight adult women using current age, weight, and PAL. The EERs to be used during lactation are estimated from TEE, milk energy output, and energy mobilization from tissue stores. Because adap- tations in basal metabolism and physical activity are not evident in well- nourished women, energy requirements of lactating women are met par- tially by mobilization of tissue stores, but primarily from the diet. In the first 6 months postpartum, well-nourished lactating women experience an average weight loss of 0.8 kg/mo, which is equivalent to 170 kcal/d (6,500 kcal/kg) (Butte and Hopkinson, 1998). Weight stability is assumed after 6 months postpartum. Milk production rates average 0.78 L/d from birth through 6 months of age and 0.6 L/d from 7 through 12 months of age. At 0.67 kcal/g of milk (Table 5-18), the milk energy output would be 523 kcal/d, which is rounded to 500 kcal/d, in the first 6 months and 402 kcal/d, which is rounded to 400 kcal/d, in the second 6 months of lactation. EER for Lactation 14â18 Years EERlactation = adolescent EERprepregnancy + milk energy output â weight loss 1st 6 mo adolescent EER + 500 â 170 2nd 6 mo adolescent EER + 400 â 0
202 DIETARY REFERENCE INTAKES 19â50 Years EERlactation = adult EERprepregnancy + milk energy output â weight loss 1st 6 mo adult EER + 500 â 170 2nd 6 mo adult EER + 400 â 0 Special Considerations Method Used to Estimate Weight Maintenance in Overweight and Obese Adults Since Dietary Reference Intakes are designed to apply to apparently health individuals, the EERs are defined as values appropriate for mainte- nance of long-term good health. Overweight and obese individuals have greater weight than is consistent with long-term good health, thus EER values given in previous sections are not intended for overweight or obese individuals or for those who desire to lose weight. Instead, weight mainte- nance TEE values are discussed, along with information on the relation- ship between reduction in energy intake and change in body composition. Equations to predict TEE for all adults from age, height, weight, gender, and activity level were generated from the combined DLW database of normal, overweight, and obese individuals (Appendix Tables I-3 and I-7). In addition, the DLW database of overweight and obese individuals (Appen- dix Table I-7) was used to generate equations to predict TEE in overweight and obese adult men and women (BMI 25 kg/m2 and higher) from age, height, weight, and physical activity category using nonlinear regression. PAL categorization was determined using the adultsâ observed BEE. Data were not used in the derivation of the TEE equations if the PAL value was less than 1.0 or greater than 2.5. The coefficients and standard error derived for only overweight and obese men and women are provided in Appendix Table I-10. For the over- weight and obese equations, the standard deviations of the residuals ranged from 190 to 331, with the highest value in the very active PAL category. The equations are shown below (see Table I-10 for coefficients used). Overweight and Obese Men Ages 19 Years and Older TEE = 1086 â (10.1 à age [y]) + PA à (13.7 à weight [kg] + 416 à height [m]) Where PA is the physical activity coefficient: PA = 1.00 if PAL is estimated to be ⥠1.0 < 1.4 (sedentary) PA = 1.12 if PAL is estimated to be ⥠1.4 < 1.6 (low active)
203 E NERGY PA = 1.29 if PAL is estimated to be ⥠1.6 < 1.9 (active) PA = 1.59 if PAL is estimated to be ⥠1.9 < 2.5 (very active) Overweight and Obese Women Ages 19 Years and Older TEE = 448 â (7.95 à age [y]) + PA à (11.4 à weight [kg] + 619 à height [m]) Where PA is the physical activity coefficient: PA = 1.00 if PAL is estimated to be ⥠1.0 < 1.4 (sedentary) PA = 1.16 if PAL is estimated to be ⥠1.4 < 1.6 (low active) PA = 1.27 if PAL is estimated to be ⥠1.6 < 1.9 (active) PA = 1.44 if PAL is estimated to be ⥠1.9 < 2.5 (very active) Method Used to Estimate Weight Maintenance in Normal-weight, Overweight, and Obese Adults TEE predictive equations were also developed combining normal- weight, overweight, and obese adults (BMI 18.5 kg/m2 and higher) as mentioned earlier; the coefficients and standard errors are shown in Appendix Table I-11. Mean of the residuals did not differ from zero. For the combined data sets, the standard deviations of the residuals ranged from 182 to 321. The adult predictive equations for TEE were subjected to statistical testing of their estimated coefficients and asymptotic standard deviations using a chi-square distribution (Hotelling T-squared test). The specific equations for the overweight and obese men and women (BMI from 25 kg/m2 and higher) given above were not statistically different from the equations derived solely from normal-weight individuals given in the previ- ous section (BMI from 18.5 up to 25 kg/m2; P > 0.99) or normal plus overweight and obese individuals shown below (BMI from 18.5 kg/m2 and higher; P = 0.96â0.99). In addition, the equations generated to predict TEE from the com- bined data set of normal plus overweight and obese individuals had a larger sample size, thus reducing the standard error of the coefficients, and improved the continuity of predicted TEEs at the BMI junction between normal-weight and overweight individuals. For these reasons, the combined data from normal-weight and overweight and obese individuals were used to develop equations to predict TEE in overweight and obese adults. The resulting equations, described in the following sections, are accurate for use in both normal-weight and overweight and obese adults, and are thus suitable for prediction of energy requirements both in over- weight and obese groups and in mixed groups containing normal-weight
204 DIETARY REFERENCE INTAKES and overweight adults. The equations are shown below (see Table I-11 for coefficients used). Normal-weight, Overweight, and Obese Men Ages 19 Years and Older TEE = 864 â (9.72 à age [y]) + PA à (14.2 à weight [kg] + 503 à height [m]) Where PA is the physical activity coefficient: PA = 1.00 if PAL is estimated to be ⥠1.0 < 1.4 (sedentary) PA = 1.12 if PAL is estimated to be ⥠1.4 < 1.6 (low active) PA = 1.27 if PAL is estimated to be ⥠1.6 < 1.9 (active) PA = 1.54 if PAL is estimated to be ⥠1.9 < 2.5 (very active) Normal-weight, Overweight, and Obese Women Ages 19 Years and Older TEE = 387 â (7.31 à age [y]) + PA à (10.9 à weight [kg] + 660.7 à height [m]) Where PA is the physical activity coefficient: PA = 1.00 if PAL is estimated to be ⥠1.0 < 1.4 (sedentary) PA = 1.14 if PAL is estimated to be ⥠1.4 < 1.6 (low active) PA = 1.27 if PAL is estimated to be ⥠1.6 < 1.9 (active) PA = 1.45 if PAL is estimated to be ⥠1.9 < 2.5 (very active) Current consensus guidelines for the management of obesity in adults (BMI 30 kg/m2 and higher) recommend weight loss of around 10 percent of initial weight over a 6-month period (NIH, 2000). For overweight indi- viduals (BMI from 25 up to 30 kg/m2) who have no other risk factors, a motivation and desire to lose weight is an important consideration for recommending weight loss. Persons who do not wish to lose weight should receive advice and monitoring aimed at weight maintenance and risk reduction. Nevertheless, there is consensus that BMIs of 25 kg/m2 and higher increase risk of premature morbidity and mortality (Chan et al., 1994; Colditz GA et al., 1995; Rimm et al., 1995; Stevens et al., 1998; Willett et al., 1999), and that relatively modest weight loss can improve blood pressure (Huang Z et al., 1998; Kannel et al., 1967; Reisin et al., 1978; Schotte and Stunkard, 1990), serum lipid (Grundy et al., 1979; Kesaniemi and Grundy, 1983; Osterman et al., 1992; Wood et al., 1988, 1991), and glucose tolerance (Amatruda et al., 1988; Doar et al., 1975; Hadden et al., 1975; Wing et al., 1991).
205 E NERGY Rationale for Recommending Use of Equations Based on Combined Database for Overweight and Obese Individuals Tables 5-29 and 5-30 show 24-h BEE and TEE values for 30-year-old men and women of different BMIs. The tables illustrate that obese men and women have consistently higher TEE than normal-weight men and women of comparable height and PAL, which implies that, on average, overweight and obese individuals need to consume more dietary energy to maintain weight than individuals within the healthy weight range to main- tain their larger body weights. The following predictive equations for BEE were derived from the observed BEE values in the DLW database (Appendix Tables I-3 and I-7): For normal-weight men: BEE (kcal/d) = 204 â (4 à age [y]) + 450.5 à height (m) + 11.69 à weight (kg) residual = 0 ± 149, R2 = 0.46. For normal-weight, overweight, and obese men: BEE (kcal/d) = 293 â (3.8 à age [y]) + 456.4 à height (m) + 10.12 à weight (kg) residual = 0 ± 156, R2 = 0.64. For normal-weight women: BEE (kcal/d) = 255 â 2.35 à age (y) + 361.6 à height (m) + 9.39 à weight (kg) residual = ± 125, R2 = 0.39. For normal-weight, overweight, and obese women: BEE (kcal/d) = 247 â (2.67 à age [y]) + 401.5 à height (m) + 8.60 à weight (kg) residual = ± 156, R2 = 0.62. The residuals (differences between the observed and predicted BEE) can be compared with the differences between the BEE values calculated for the adults in the DLW database using the BEE predictive equations by Henry (2000) and WN Schofield (1985) based on body weight, and the predictive BEE equation of WN Schofield (1985) based on body weight and height and the observed BEE in the DLW database. These differences (averages ± standard deviation [SD]) are: â35 ± 168, â9 ± 169, and â34 ± 184 in men, and â33 ± 134, 8 ± 137, and 16 ± 135 in women, respectively. For the normal-weight adults with BMIs from 18.5 up to 25 kg/m2 in Tables 5-29 and 5-30, BEE was calculated using the above BEE prediction
206 DIETARY REFERENCE INTAKES TABLE 5-29 Basal and Total Daily Energy Expenditure in Men 30 Years of Age as Calculated from Total Energy Expenditure (TEE) Equations for Normal-weight, Overweight, and Obese Mena Weight (kg [lb]) for a Body Mass Index (kg/m2) of: Height (m [in]) PALb 18.5 22.5 24.99 25 30 35 40 1.45 BEE 38.9 47.3 52.5 52.6 63.1 73.6 84.1 (57) Sedentary (86) (104) (116) (116) (139) (162) (185) Low active Active Very active 1.50 BEE 41.6 50.6 56.2 56.3 67.5 78.8 90.0 (59) Sedentary (92) (111) (124) (124) (149) (173) (198) Low active Active Very active 1.55 BEE 44.4 54.1 60.0 60.1 72.1 84.1 96.1 (61) Sedentary (98) (119) (132) (132) (159) (185) (211) Low active Active Very active 1.60 BEE 47.4 57.6 64.0 64.0 76.8 89.6 102.4 (63) Sedentary (104) (127) (141) (141) (169) (197) (225) Low active Active Very active 1.65 BEE 50.4 61.3 68.0 68.1 81.7 95.3 108.9 (65) Sedentary (111) (135) (150) (150) (180) (210) (240) Low active Active Very active 1.70 BEE 53.5 65.0 72.2 72.3 86.7 101.2 115.6 (67) Sedentary (118) (143) (159) (159) (191) (223) (254) Low active Active Very active 1.75 BEE 56.7 68.9 76.5 76.6 91.9 107.2 122.5 (69) Sedentary (125) (152) (168) (168) (202) (236) (270) Low active Active Very active
207 E NERGY TEEc (kcal/d) for a Body Mass Index (kg/m2) of: 18.5 22.5 24.99 25 30 35 40 1,192 1,290 1,351 1,373 1,479 1,585 1,692 1,777 1,911 1,994 2,048 2,197 2,347 2,496 1,931 2,080 2,172 2,225 2,393 2,560 2,727 2,128 2,295 2,399 2,447 2,636 2,826 3,015 2,450 2,648 2,771 2,845 3,075 3,305 3,535 1,246 1,352 1,417 1,433 1,547 1,661 1,774 1,848 1,991 2,080 2,126 2,285 2,445 2,605 2,010 2,169 2,268 2,312 2,491 2,670 2,849 2,216 2,395 2,506 2,545 2,748 2,951 3,154 2,554 2,766 2,898 2,964 3,210 3,456 3,702 1,302 1,414 1,484 1,494 1,616 1,737 1,859 1,920 2,073 2,168 2,205 2,376 2,546 2,717 2,089 2,259 2,365 2,401 2,592 2,783 2,974 2,305 2,497 2,616 2,646 2,862 3,079 3,296 2,661 2,887 3,028 3,087 3,349 3,612 3,875 1,358 1,478 1,553 1,557 1,686 1,816 1,946 1,993 2,156 2,257 2,286 2,468 2,650 2,831 2,171 2,352 2,464 2,492 2,695 2,899 3,102 2,397 2,601 2,728 2,749 2,980 3,210 3,441 2,769 3,010 3,160 3,211 3,491 3,771 4,051 1,416 1,543 1,623 1,621 1,759 1,896 2,034 2,068 2,241 2,349 2,369 2,562 2,755 2,949 2,254 2,446 2,566 2,584 2,801 3,017 3,234 2,491 2,707 2,842 2,854 3,099 3,345 3,590 2,880 3,136 3,296 3,339 3,637 3,934 4,232 1,475 1,610 1,694 1,686 1,832 1,979 2,125 2,144 2,328 2,442 2,453 2,659 2,864 3,069 2,339 2,542 2,670 2,679 2,909 3,139 3,369 2,586 2,816 2,959 2,961 3,222 3,483 3,743 2,993 3,265 3,434 3,469 3,785 4,101 4,417 1,535 1,678 1,767 1,753 1,907 2,062 2,217 2,222 2,417 2,538 2,540 2,757 2,975 3,192 2,425 2,641 2,776 2,776 3,019 3,263 3,507 2,683 2,927 3,079 3,071 3,347 3,623 3,899 3,108 3,396 3,576 3,602 3,937 4,272 4,607 continued
208 DIETARY REFERENCE INTAKES TABLE 5-29 Continued Weight (kg [lb]) for a Body Mass Index (kg/m2) of: Height (m [in]) PALb 18.5 22.5 24.99 25 30 35 40 1.80 BEE 59.9 72.9 81.0 81.0 97.2 113.4 129.6 (71) Sedentary (132) (160) (178) (178) (214) (249) (285) Low active Active Very active 1.85 BEE 63.3 77.0 85.5 85.6 102.7 119.8 136.9 (73) Sedentary (139) (169) (188) (188) (226) (264) (301) Low active Active Very active 1.90 BEE 66.8 81.2 90.2 90.3 108.3 126.4 144.4 (75) Sedentary (147) (179) (198) (199) (239) (278) (318) Low active Active Very active 1.95 BEE 70.3 85.6 95.0 95.1 114.1 133.1 152.1 (77) Sedentary (155) (188) (209) (209) (251) (293) (335) Low active Active Very active a For each year below 30, add 4 kcal/d to BEE and 10 kcal/d to TEE. For each year above 30, subtract 4 kcal/d from BEE and 10 kcal/d from TEE. Equations determined from combined DLW databases (Appendix Table I-11). equations for normal-weight men and women, and TEE was calculated utilizing the EER equations in the section âAdults Ages 19 Years and Older.â For overweight and obese adults with BMIs from 25 up to 40 kg/m2, the above BEE prediction equations for normal, overweight, and obese men and women were utilized to calculate BEE, and the above TEE equations for normal, overweight, and obese individuals were used to predict the TEE. The differences between the predictions made for BMI of 24.99 kg/m2 and BMI of 25 kg/m2 in Tables 5-29 and 5-30 show that the discrepancies at the junction of the two prediction ranges are essentially negligible as average differences (± SD) are 0.4 ± 2.1 percent in men, and 0.9 ± 1.1 per- cent in women, respectively.
209 E NERGY TEEc (kcal/d) for a Body Mass Index (kg/m2) of: 18.5 22.5 24.99 25 30 35 40 1,596 1,747 1,841 1,820 1,984 2,148 2,312 2,301 2,507 2,635 2,628 2,858 3,088 3,318 2,513 2,742 2,884 2,875 3,132 3,390 3,648 2,782 3,040 3,200 3,183 3,475 3,767 4,059 3,225 3,530 3,720 3,738 4,092 4,447 4,801 1,658 1,818 1,917 1,889 2,062 2,236 2,409 2,382 2,600 2,735 2,718 2,961 3,204 3,447 2,602 2,844 2,995 2,975 3,248 3,520 3,792 2,883 3,155 3,325 3,297 3,606 3,915 4,223 3,344 3,667 3,867 3,877 4,251 4,625 4,999 1,721 1,889 1,995 1,959 2,142 2,325 2,507 2,464 2,694 2,837 2,810 3,066 3,322 3,579 2,694 2,949 3,107 3,078 3,365 3,652 3,939 2,986 3,273 3,452 3,414 3,739 4,065 4,390 3,466 3,806 4,018 4,018 4,412 4,807 5,202 1,785 1,963 2,073 2,031 2,223 2,416 2,608 2,548 2,790 2,940 2,903 3,173 3,443 3,713 2,786 3,055 3,222 3,183 3,485 3,788 4,090 3,090 3,393 3,581 3,532 3,875 4,218 4,561 3,590 3,948 4,171 4,162 4,578 4,993 5,409 b PAL = physical activity level, BEE = basal energy expenditure. Weight Reduction in Overweight and Obese Adults When obese individuals need to lose weight, the necessary negative energy balance can theoretically be achieved by either a reduction in energy intake or an increase in energy expenditure of physical activity (EEPA). Most usually, a combination of both is desirable (NIH, 2000) because it is hard to achieve the high levels of negative energy balance necessary for 1 to 2 lb/wk weight loss with exercise alone. In support of this contention, meta-analyses show very low levels of weight loss in struc- tured exercise programs (Ballor and Keesey, 1991), but at the same time several studies suggest that the combination of dietary change and increased physical activity appears effective for promoting weight loss and successful weight maintenance after weight loss, perhaps by promoting
210 DIETARY REFERENCE INTAKES TABLE 5-30 Basal and Total Daily Energy Expenditure in Women 30 Years of Age as Calculated from Total Energy Expenditure (TEE) Equations for Normal-weight, Overweight, and Obese Womena Weight (kg [lb]) for a Body Mass Index (kg/m2) of: Height (m [in]) PALb 18.5 22.5 24.99 25 30 35 40 1.45 BEE 38.9 45.2 52.5 52.6 63.1 73.6 84.1 (57) Sedentary (86) (100) (116) (116) (139) (162) (185) Low active Active Very active 1.50 BEE 41.6 48.4 56.2 56.3 67.5 78.8 90.0 (59) Sedentary (92) (107) (124) (124) (149) (174) (198) Low active Active Very active 1.55 BEE 44.4 51.7 60.0 60.1 72.1 84.1 96.1 (61) Sedentary (98) (114) (132) (132) (159) (185) (212) Low active Active Very active 1.60 BEE 47.4 55.0 64.0 64.0 76.8 89.6 102.4 (63) Sedentary (104) (121) (141) (141) (169) (197) (226) Low active Active Very active 1.65 BEE 50.4 58.5 68.0 68.1 81.7 95.3 108.9 (65) Sedentary (111) (129) (150) (150) (180) (210) (240) Low active Active Very active 1.70 BEE 53.5 62.1 72.2 72.3 86.7 101.2 115.6 (67) Sedentary (118) (137) (159) (159) (191) (223) (255) Low active Active Very active 1.75 BEE 56.7 65.8 76.5 76.6 91.9 107.2 122.5 (69) Sedentary (125) (145) (169) (169) (202) (236) (270) Low active Active Very active
211 E NERGY TEE (kcal/d) for a Body Mass Index (kg/m2)of: 18.5 22.5 24.99 25 30 35 40 1,074 1,133 1,202 1,201 1,291 1,382 1,472 1,564 1,623 1,691 1,698 1,813 1,927 2,042 1,734 1,800 1,877 1,912 2,043 2,174 2,304 1,946 2,021 2,108 2,112 2,257 2,403 2,548 2,201 2,287 2,386 2,387 2,553 2,719 2,886 1,118 1,181 1,255 1,253 1,349 1,446 1,543 1,625 1,689 1,762 1,771 1,894 2,017 2,139 1,803 1,874 1,956 1,996 2,136 2,276 2,415 2,025 2,105 2,198 2,205 2,360 2,516 2,672 2,291 2,382 2,489 2,493 2,671 2,849 3,027 1,163 1,230 1,309 1,306 1,409 1,512 1,615 1,688 1,756 1,834 1,846 1,977 2,108 2,239 1,873 1,949 2,037 2,081 2,230 2,380 2,529 2,104 2,190 2,290 2,299 2,466 2,632 2,798 2,382 2,480 2,593 2,601 2,791 2,981 3,171 1,208 1,280 1,364 1,360 1,470 1,580 1,690 1,752 1,824 1,907 1,922 2,061 2,201 2,340 1,944 2,025 2,118 2,168 2,327 2,486 2,645 2,185 2,276 2,383 2,396 2,573 2,750 2,927 2,474 2,578 2,699 2,712 2,914 3,116 3,318 1,254 1,331 1,420 1,415 1,532 1,649 1,766 1,816 1,893 1,982 1,999 2,148 2,296 2,444 2,016 2,102 2,202 2,256 2,425 2,594 2,763 2,267 2,364 2,477 2,494 2,682 2,871 3,059 2,567 2,678 2,807 2,824 3,039 3,254 3,469 1,301 1,383 1,478 1,471 1,595 1,719 1,843 1,881 1,963 2,057 2,078 2,235 2,393 2,550 2,090 2,180 2,286 2,345 2,525 2,705 2,884 2,350 2,453 2,573 2,594 2,794 2,994 3,194 2,662 2,780 2,917 2,938 3,166 3,395 3,623 1,350 1,436 1,536 1,528 1,659 1,791 1,923 1,948 2,034 2,134 2,158 2,325 2,492 2,659 2,164 2,260 2,372 2,437 2,627 2,817 3,007 2,434 2,543 2,670 2,695 2,907 3,119 3,331 2,758 2,883 3,028 3,054 3,296 3,538 3,780 continued
212 DIETARY REFERENCE INTAKES TABLE 5-30 Continued Weight (kg [lb]) for a Body Mass Index (kg/m2 ) of: Height (m [in]) PALb 18.5 22.5 24.99 25 30 35 40 1.80 BEE 59.9 69.7 81.0 81.0 97.2 113.4 129.6 (71) Sedentary (132) (154) (178) (178) (214) (250) (285) Low active Active Very active 1.85 BEE 63.3 73.6 85.5 85.6 102.7 119.8 136.9 (73) Sedentary (139) (162) (188) (189) (226) (264) (302) Low active Active Very active 1.90 BEE 66.8 77.6 90.2 90.3 108.3 126.4 144.4 (75) Sedentary (147) (171) (198) (199) (239) (278) (318) Low active Active Very active 1.95 BEE 70.3 81.8 95.0 95.1 114.1 133.1 152.1 (77) Sedentary (155) (180) (209) (209) (251) (293) (335) Low active Active Very active a For each year below 30, add 2.5 kcal/d to BEE and 7 kcal/d to TEE. For each year above 30, subtract 2.5 kcal/d from BEE and 7 kcal/d from TEE. Equations determined from combined DLW databases (Appendix Table I-11). favorable metabolic changes or improved dietary compliance (DePue et al., 1995; Dunn et al., 1999; Hartman et al., 1993; Holden et al., 1992; Miller et al., 1997). Several studies indicate that energy expenditure decreases when energy intake is less than TEE, with the result that weight loss is less than anticipated based on the reduction in energy intake. As shown in Figure 5-9, a summary of studies on changes in resting energy expenditure (REE) with negative energy balance in adults have shown that the decline in REE with weight loss is greater than predicted from the loss of FFM that occurs concomitantly during negative energy balance. This suggests that there is a decrease in REE per unit of FFM during active weight loss (under- feeding).
213 E NERGY TEE (kcal/d) for a Body Mass Index (kg/m2)of: 18.5 22.5 24.99 25 30 35 40 1,398 1,490 1,596 1,586 1,725 1,865 2,004 2,015 2,106 2,211 2,239 2,416 2,593 2,769 2,239 2,341 2,459 2,529 2,731 2,932 3,133 2,519 2,634 2,769 2,799 3,023 3,247 3,472 2,855 2,987 3,141 3,172 3,428 3,684 3,940 1,448 1,545 1,657 1,645 1,792 1,940 2,087 2,083 2,179 2,290 2,322 2,509 2,695 2,882 2,315 2,422 2,548 2,624 2,836 3,049 3,262 2,605 2,727 2,869 2,904 3,141 3,378 3,615 2,954 3,093 3,255 3,292 3,562 3,833 4,103 1,499 1,601 1,719 1,706 1,861 2,016 2,171 2,151 2,253 2,371 2,406 2,603 2,800 2,996 2,392 2,505 2,637 2,720 2,944 3,168 3,393 2,693 2,821 2,971 3,011 3,261 3,511 3,760 3,053 3,200 3,371 3,414 3,699 3,984 4,270 1,550 1,657 1,782 1,767 1,931 2,094 2,258 2,221 2,328 2,452 2,492 2,699 2,906 3,113 2,470 2,589 2,729 2,817 3,053 3,290 3,526 2,781 2,917 3,074 3,119 3,383 3,646 3,909 3,154 3,309 3,489 3,538 3,838 4,139 4,439 b PAL = Physical activity level, BEE = basal energy expenditure. Role of Decreased Food Intake with or Without Increased Physical Activity There are also four underfeeding studies that have examined changes in TEE with negative energy balance achieved by a reduction in energy intake. As shown in Table 5-31, the reduction in energy intake in these studies ranged from 758 to 1,620 kcal/d and was associated with a reduc- tion in TEE that averaged 36 percent of the reduction in energy intake. It should be noted that there was a period of 3 to 52 weeks of underfeeding between the measurements of TEE made during weight maintenance and negative energy balance. Thus, some of the reduction in TEE was due to reduced energy requirements associated with reduced body weight.
214 DIETARY REFERENCE INTAKES Overfeeding Underfeeding 2,200 2,200 Resting Energy Expenditure 2,000 2,000 1,800 1,800 (kcal/day) 1,600 1,600 1,400 1,400 1,200 1,200 1,000 1,000 800 800 Fat-Free Mass (kg) Fat-Free Mass (kg) FIGURE 5-9 Relationship between changes in fat-free mass and resting energy expenditure during overfeeding and underfeeding. Reprinted, with permission, from Saltzman and Roberts (1995). Copyright 1995 by International Life Sciences Institute. In multiple regression analyses using the DLW data of the studies in Table 5-31, weight, age, and gender significantly predicted TEE, and the b-coefficient for the weight term was 16.6 kcal/d. This implies that for weight-stable individuals, differences in body weight of 1 kg are associated with differences in TEE of 16.6 kcal/d. By correcting the changes in TEE that can be attributed to the decrease in body size in the four underfeed- ing studies described in Table 5-31, 8.4 percent of the reduction in TEE was unaccounted for by weight loss and appears therefore to be associated with a state of negative energy balance. This could be due to a reduction in energy expenditure per kg body weight or to a decrease in physical activity. These values can be used to estimate the anticipated reduction in metabolizable energy intake necessary to achieve a given level of weight loss, if weight loss is achieved solely by a reduction in energy intake and there is no change in energy expenditure for physical activity. For example, a weight loss of 1 to 2 lb/wk (65 to 130 g/d) is equivalent to a body energy loss of 468 to 936 kcal/d, because the energy content of weight loss aver- ages 7.2 kcal/g (i.e., 75 percent fat containing 9.25 kcal/g and 25 percent FFM containing 1 kcal/g) (Saltzman and Roberts, 1995). Taking into account the decrease in TEE due to weight loss (16.6 kcal/kg) and due to negative energy balance (8.4 percent of initial TEE), the total expected reduction in TEE after 10 weeks of dieting is predicted to be 376 to
215 E NERGY TABLE 5-31 Changes (â) in Total Energy Expenditure (TEE) During Underfeeding Studiesa âTEE âBEb âEIc (kcal/d) (kcal/d) (kcal/d) âTEE/âEI CoorâTEE/âEId Reference Heyman et al., 1992 â297 â461 â758 0.392 0.076 Kempen et al., 1995 â359 â765 â1,124 0.319 0.087 Racette et al., 1995 â349 â695 â1,044 0.334 0.079 van Gemert et al., â645 â975 â1,620 0.398 0.093 2000 Means 0.361 0.084 a Where all values are in kcal/d, â describes changes in value between weight mainte- nance and underfeeding. b BE = body energy. c EI = energy intake (calculated as âBE + âTEE). d CorrâTEE is change in total energy expenditure after subtracting the estimated change in TEE due to weight loss in the underfeeding period prior to measurement of TEE. This value indicates the change in TEE is due to negative energy balance rather than weight loss. It was estimated as weight loss prior to the underfeeding TEE Ã 16.6, where 16.6 is the weight coefficient in the relationship, TEE = constant + weight + age + gender in the doubly labeled water data from these studies. 542 kcal/d for an individual with an initial weight maintenance TEE of 2,500 kcal/d. Therefore, to maintain a rate of weight loss of 1 to 2 lb/wk, the reduction in energy intake would need to be 844 (468 + 376) to 1,478 kcal/d (936 + 542) after 10 weeks of weight loss. This calculation serves both to emphasize the importance of exercise in helping prevent reduced TEE during weight loss, and to illustrate the relatively high level of reduction in energy intake needed when weight loss is to be achieved by dieting alone. It should be noted that the above calcu- lations were based on TEE data derived from studies in adults in which reduction in energy intake was in the range of 758 to 1,620 kcal/d. The impact on energy expenditure of weight loss regimens involving lesser or greater reductions in energy intake need to be assessed before rates of weight reduction can be more precisely predicted. However, it must be appreciated that reduction in resting rates of energy expenditure per kilo- gram of body weight have a small impact on the prediction of energy deficits imposed by food restriction, and the greatest cause of deviation from projected rates of weight loss lies in the degree of compliance. The coefficient of 16.6 kcal/kg of weight loss calculated from the data in Table 5-31 could be utilized to anticipate the reduction in energy intake required for maintaining lower body weights. Further studies in this area are needed.
216 DIETARY REFERENCE INTAKES Estimation of Energy Expenditure for Weight Maintenance in Overweight Children Ages 3 Through 18 Years While the Centers for Disease Control and Prevention (CDC) currently defines childhood ârisk of overweightâ as greater than the 85th percentile for BMI and âoverweightâ as greater than the 95th percentile of BMI, it gives no definition for obesity in childhood. Several organizations, however, define childhood obesity as a BMI above the 95th age-adjusted percentile (Barlow and Dietz, 1998; Bellizzi and Dietz, 1999). An inter- national standardized approach was also recently proposed, based on iden- tifying the childhood BMI at different ages that would be equivalent to a BMI of 25 kg/m2 (for overweight) or 30 kg/m2 (for obese) at age 18 years (Cole et al., 2000). Using this approach, the cutoff for obesity would fall near the 97th percentile of the current CDC growth charts (Figure 5-10). For this report, the CDC definitions of risk of overweight and overweight are accepted for children, namely BMI above the 95th percentile for over- weight and above the 85th percentile for risk of overweight. Age (years) Age (years) FIGURE 5-10 Comparison of body mass index (BMI) definitions of overweight and obesity during childhood with percentiles for BMI (85th, 95th, 97th). Reprint- ed, with permission, from Roberts and Dallal (2001). Copyright 2001 by Interna- tional Life Sciences Institute.
217 E NERGY Rapid weight loss is undesirable in children due to the risks of stunt- ing and micronutrient deficiencies. In addition, children under 2 years of age should not be placed on energy-restricted diets out of concern that brain development may inadvertently be compromised by inadequate dietary intake of fatty acids and micronutrients. A recent expert pediatric committee recommended that weight maintenance be the goal for most children over 2 years of age in the 85th to 95th percentiles for BMI (Barlow and Dietz, 1998). In addition, the committee recommended that weight loss be at a rate of 1 lb/mo for children over 7 years of age at or greater than the 95th percentile BMI and for children between the 85th and 95th percentiles who have comorbidities that would be anticipated to be improved by weight loss. Separate TEE predictive equations were developed from the DLW data for 3- through 18-year-old overweight and obese boys and girls (Appendix Table I-6) from age, height, weight, and PAL categories using nonlinear regression techniques. In order to utilize all the TEE data, PAL categoriza- tion was determined using predicted BEE rather than observed BEE, since only 67 percent (85/127) of the boys and 64 percent (123/192) of the girls and had observed BEEs. The following predictive equations for BEE were derived from the observed BEEs provided in the DLW database (Ap- pendix Table I-6). For overweight and obese boys: BEE (kcal/d) = 420 â 33.5 age (y) + 418.9 Ã height (m) + 16.7 weight (kg) SE = 89.9, R2 = 0.88. For overweight and obese girls: BEE (kcal/d) = 516 â (26.8 Ã age [y]) + 347 height (m) + 12.4 weight (kg) SE = 113.4, R2 = 0.79. For normal-weight, overweight, and obese boys: BEE (kcal/d) = 79 â (34.2 Ã age [y]) + 730 Ã height (m) + 15.3 weight (kg) SE = 90.6, R2 = 0.89. For normal-weight, overweight, and obese girls: BEE (kcal/d) = 322 â (26.0 Ã age [y]) + 504 Ã height (m) + 11.6 weight (kg) SE = 102.1, R2 = 0.80.
218 DIETARY REFERENCE INTAKES Prediction equations of TEE for overweight and obese girls and boys were developed using age, height, weight, and PAL category as predicted from the above BEE equations. Data were not used in the derivation of the TEE equations if the PAL value was less than 1.0 or greater than 2.5. In addition, TEE predictive equations were developed combining normal- weight, overweight, and obese children. The coefficients and SE for boys and girls in the overweight and obese database (Appendix Table I-6) are provided in Appendix Table I-12. Mean of the residuals did not differ from zero, and the standard deviation of the residuals ranged from 74 to 213. The coefficients and SE for boys and girls in the combined normal-weight, overweight, and obese database are described in Appendix Table I-13. The mean of the residuals did not differ from zero and the standard deviation of the residuals ranged from 73 to 208. The childrenâs predictive equations for TEE were subjected to statisti- cal testing of their estimated coefficients and asymptotic standard devia- tions using a chi-square distribution (Hotelling T-squared test). The spe- cific equation for the overweight and obese boys was statistically different from the equation derived solely from normal-weight boys (P > 0.032), and tended to differ from the combined equation derived from normal, overweight, and obese boys (P = 0.086). The specific equation for the overweight and obese girls was statistically different from the equa- tion derived solely from normal-weight girls (P > 0.001), but not from the combined equation derived from normal, overweight, and obese girls (P = 0.99). The equations for the normal-weight boys and girls differed from the combined equation (P = 0.001). Despite the suggestion of differences in the predictive equations for the TEE of boys, and because of the larger sample size, reduced SEs of the coefficients and increased stability, and consistency between the genders, the prediction equations for TEE based on the combined database are recommended for use in overweight and obese children for weight maintenanceâthey do not include growth. (See Table I-13 for coefficients used in the equations.) Weight Maintenance TEE in Overweight Boys Ages 3 Through 18 Years TEE = 114 â (50.9 à age [y]) + PA à (19.5 à weight [kg] + 1161.4 à height [m]) Where PA is the physical activity coefficient: PA = 1.00 if PAL is estimated to be ⥠1.0 < 1.4 (sedentary) PA = 1.12 if PAL is estimated to be ⥠1.4 < 1.6 (low active) PA = 1.24 if PAL is estimated to be ⥠1.6 < 1.9 (active) PA = 1.45 if PAL is estimated to be ⥠1.9 < 2.5 (very active)
219 E NERGY Weight Maintenance TEE in Overweight Girls Ages 3 Through 18 Years TEE = 389 â (41.2 à age [y]) + PA à (15.0 à weight [kg] + 701.6 à height [m]) Where PA is the physical activity coefficient: PA = 1.00 if PAL is estimated to be ⥠1.0 < 1.4 (sedentary) PA = 1.18 if PAL is estimated to be ⥠1.4 < 1.6 (low active) PA = 1.35 if PAL is estimated to be ⥠1.6 < 1.9 (active) PA = 1.60 if PAL is estimated to be ⥠1.9 < 2.5 (very active) As in adults, these TEE equations do not form the basis of EER values since the weight of the group is considered high (when BMI is greater than the 95th percentile) or at risk of being high (when BMI is greater than the 85th percentile). Nevertheless, TEE values are equivalent to EER values when weight maintenance is the goal. It should be noted that EER values for en- ergy in children of healthy weight also include an amount that will provide sufficient energy for normal rates of growth. When weight maintenance is the goal, as in most children between the 85th and 95th BMI percentiles, it is assumed that linear growth and lean tissue growth can occur at a normal rate when body weight gain is prevented, because over time body fat content gradually decreases in parallel with the increase in FFM. Weight Reduction in Overweight Children Ages 3 Through 18 Years Weight reduction at a rate of 1 lb/m (15 g/d) is equivalent to a body energy loss of 108 kcal/d (assuming the energy content of weight loss averages 7.2 kcal/g [Saltzman and Roberts, 1995]), an amount that is small enough to be achievable by either an increase in EEPA, a reduction in energy intake, or a combination of both. There is currently no informa- tion on changes in TEE with negative energy balance in children, and no information even from adults on changes in TEE at low levels of negative energy balance. Thus, the extent to which TEE falls when energy intake is reduced with the intention of producing very slow weight loss in children is not known. This lack of data makes it impossible to describe the rela- tionship between change in energy intake and change in body energy for children in whom weight loss is indicated. However, if the negative energy balance is achieved by a reduction in energy intake alone, at least a 108 kcal/d decrease in energy intake (i.e., equivalent to the indicated loss of body energy) would be necessary to result in a slow weight loss, and perhaps more if a reduction in TEE occurs. Small reductions in energy intake of the magnitude required to resolve childhood overweight gradu- ally over time are within the potential for ad libitum changes induced by improvements in dietary composition.
220 DIETARY REFERENCE INTAKES Undernutrition Undernutrition is still a frequent condition in many parts of the world, particularly in children. When energy intake is unable to match energy needs (due to insufficient dietary intake, excessive intestinal losses, or a combination thereof) several mechanisms of adaptation come into play (see earlier section, âAdaptation and Accommodationâ). Reduction in vol- untary physical activity is a rapid means of reducing energy needs to match limited energy input. In children, reduction in growth rates is another important mechanism of accommodation to energy deficit. Under condi- tions of persistent energy deficit, the low growth rate will result in short stature and low weight-for-age, a condition termed stunting. A chronic energy deficit elicits mobilization of energy reserves, pro- gressively depleting its main source: adipose tissue. Thus, an energy deficit of certain duration is associated with changes in body weight and body composition. As body weights decrease, so do energy requirements, although energy turnover may be higher when expressed per kg of body weight due to a predominant loss of fat tissue relative to lean tissue. In healthy, normal-weight individuals who face a sustained energy deficit, several hormonal mechanisms come into play, including a reduction in insulin release by the pancreas, a reduction in the active thyroid hormone T3, and a decrease in adrenergic tone. These steps are aimed at reducing cellular energy demands by reducing the rates of key energy-consuming metabolic processes. However, there is less evidence that similar mecha- nisms are available to individuals who already have a chronic energy deficit when they are faced with further reductions in energy input (Shetty et al., 1994). The effects of chronic undernutrition in children include decreased school performance, delayed bone age, and increased susceptibility to infections. In adults, an abnormally low BMI is associated with decreased work capacity and limited voluntary physical activity. Additional Energy Requirements to Restore Normal Weight In an adult with a low BMI (less than 18.5 kg/m2), the additional energy intake required to normalize body weight will depend on the initial deficit and the desired rate of recovery. Although estimates of energy needs can be made based on the initial deficit, body weight gain will include not only energy stored as fat tissue, but also some amount in the form of skeletal muscle and even visceral tissues. Thus, as recovery of body weight proceeds, the energy requirement will vary not only as a function of body weight but in response to changes in body composition.
221 E NERGY Catch-up Growth in Children. The energy needs for catch-up growth for children can be estimated from the energy cost of tissue deposition. The average energy cost of tissue synthesis and deposition was estimated at 5 kcal/g of tissue deposited (FAO/WHO/UNU, 1985). Based on experi- mental data from DLW studies in infants, Butte and colleagues (1989) estimated this cost as 4.8 kcal/g. Median weight for height has been used in the past as a target for recovery. Using BMI, the 50th BMI percentile for age may be considered as a target. However, in practical terms, the target for recovery depends on the initial deficit and the conditions of nutri- tional treatment: clinical unit or community. Under the controlled condi- tions of a clinical setting, undernourished children can exhibit rates of growth of 10 to 15 g/kg body weight/d (Fjeld et al., 1989), which are ten- fold higher than normal rates of weight gain at 1 year of age. Under less controlled conditions (e.g., community-dwelling children), the rates of growth are likely to be much lower. The 1985 FAO/WHO/UNU report estimated these rates as twice the normal rate (FAO/WHO/UNU, 1985). Undoubtedly, this figure would be highly dependent on the magnitude and effectiveness of the nutritional intervention. Dewey and coworkers (1996) estimated the energy needs for recovery growth for children with moderate or severe wasting, assuming that the latter would require a higher proportion of energy relative to protein. These estimates are presented in Table 5-32. Catch-up Grown Following Stunting. The above estimates apply to chil- dren with a weight deficit relative to height. If a child is stunted, however, weight may be adequate for height, and unless an increased energy intake elicits both gains in height and in weight, the child may become over- weight without correcting his or her height. In fact, this phenomenon is increasingly documented in urban settings of developing countries. It is a matter of debate whether significant catch-up gains in longitudinal growth are possible beyond about 3 years of age. Clearly, height gain is far more regulated than weight, which is primarily influenced by substrate availability and energy balance. Furthermore, longitudinal growth may also be depen- dent on the availability of other dietary constituents, such as zinc (Gibson et al., 1989; Walravens et al., 1983). Athletes With minor exceptions, dietary recommendations for athletes are not distinguished from the general population. As described in Chapter 12, the amount of dietary energy from the recommended nutrient mix should be adjusted to achieve or maintain optimal body weight for competitive athletes and others engaged in similarly demanding physical activities. As
222 DIETARY REFERENCE INTAKES TABLE 5-32 Energy Needs for Catch-up Growth at Different Rates of Weight Gain Normal Composition of High Rate of Weight Gainb Fat Depositionc EE d = 80 EE = 90 EE = 80 EE = 90 Rate of Gaina Energy e Energy e Energy e Energy e (g/kg/d) (kcal/kg/d) (kcal/kg/d) (kcal/kg/d) (kcal/kg/d) 1 83 93 86 96 2 87 97 92 102 5 97 107 110 120 10 113 123 140 150 20 146 156 200 210 a In normal children, average rates of weight gain are about 1.3 g/kg/d at 6â12 months, 0.8 g/kg/d at 12â18 months, and 0.5 g/kg/d at 18â24 months. b 17 percent protein, 9 percent fat; assume energy cost of growth = 3.3 kcal/g (based on 5.65 kcal/g protein and 9.25 kcal/g fat, with efficiencies of synthesis of 42 percent and 85 percent, respectively [Roberts and Young, 1988: 0.17 g protein à 5.65 kcal/g/0.42 = 2.3 kcal; 0.09 g fat à 9.25 kcal/g/0.85 = 1.0 kcal]); protein needs for growth = protein need/efficiency = 0.17/0.7 = 0.24 g/kg/d. c 10 percent protein, 43 percent fat; assume energy cost of growth = 6.0 kcal/g (based on 5.65 kcal/g protein and 9.25 kcal/g fat, with efficiencies of synthesis of 42 percent and 85 percent, respectively [Roberts and Young, 1988: 0.10 g protein à 5.65 kcal/g/ 0.42 = 1.3 kcal; 0.43 g fat à 9.25 kcal/g/0.85 = 4.7 kcal]); protein needs for growth = protein need/efficiency = 0.10/0.7 = 0.14 g/kg/d. d EE = energy expenditure for maintenance and activity expressed as kcal/kg/d. As described by Dewey and colleagues (1996), the lower value is similar to average energy expenditure of preschool children and to energy expenditure for maintenance and activity of recovering malnourished children in Peru. The higher value is typical of normal infants at 9â12 months of age, but may be higher than would be expected of malnourished children if they are less active. e Metabolizable energy intake. SOURCE: Adapted from Dewey et al. (1996). in the general population, the need to balance energy intake and expendi- ture over a wide range of body sizes, body compositions, and forms of exercise means that athletes will, in fact, require vastly different meal sizes and frequencies (e.g., female gymnasts compared to male American foot- ball linemen). While some athletes may be able to sustain extremely high power outputs over days or even weeks (such as in the Tour de France bicycle race), such endeavors are episodic and cannot be sustained indefi- nitely. Further, the recommendation for athletes to select foods in accor- dance with the same dietary guidelines as the general population is intended
223 E NERGY to teach sound dietary practices to men and women whose lifestyles will become more typical when their athletic careers diminish. Despite the difference in scope of energy flux associated with partici- pation in sports and extremely demanding physical activities such as mara- thon running and military operations, several advantages are associated with different forms of exercise. For example, resistance exercise promotes muscle hypertrophy and changes in body composition by increasing the ratio of muscle to total body mass (Brooks et al., 2000). Hence, the height- weight values given in Tables 5-4 and 5-5 are of little relevance to lean, but highly muscular individuals such as speed/power athletes who, because of muscle hypertrophy, will have BMIs in excess of 25 kg/m2. Athletes need- ing to increase strength will necessarily employ resistance exercises while ensuring that dietary energy is sufficient to increase muscle mass. Total body mass may increase, remain the same, or decrease depending on energy balance. Athletes needing to decrease body mass to obtain bio- mechanical advantages will necessarily increase total exercise energy out- put, reduce energy input, or use a combination of the two approaches. As distinct from weight loss by diet alone, having a major exercise component will serve to preserve lean body mass even in the face of negative energy balance. ADVERSE EFFECTS OF OVERCONSUMPTION OF ENERGY Hazard Identification Adverse Effects Adaptation to High Levels of Energy Intake. The ability of healthy indi- viduals to compensate for increases in energy intake by increasing energy expenditure (either for physical activity or resting metabolism) depends on physiological and behavioral factors. When individuals are given a diet providing a fixed (but limited) amount of energy in excess of the require- ments to maintain body weight, they will initially gain weight. However, over a period of several weeks, their energy expenditure will increase, mostly (Durnin, 1990; Ravussin et al., 1991), but perhaps not entirely (Leibel et al., 1995), on account of their increased body size, so that body weight eventually will stabilize at a higher level. A reduction of energy intake will produce the opposite effect. Some reports indicate that the magnitude of the reduction in energy expenditure when energy intake is reduced is greater than the corresponding increase in energy expenditure when energy intake is increased (Saltzman and Roberts, 1995). Neverthe- less, weight changes invariably occur under conditions of increased and
224 DIETARY REFERENCE INTAKES decreased energy intake. It is likely that for most individuals the principal mechanism for maintaining body weight is by controlling food intake rather than physical activity (Jequier and Tappy, 1999). Body Weight Gain and Chronic Disease. Weight gain that causes body mass index (BMI) to reach and exceed 25 kg/m2 is associated with an increased risk of premature mortality (NHLBI/NIDDK, 1998). As shown in Tables 5-33 through 5-38, cohort studies have shown that morbidity risk for type 2 diabetes, hypertension, coronary heart disease, stroke, gall- bladder disease, osteoarthritis, and some types of cancer also increases with increasing BMI of 25 kg/m2 and higher. Some data from large cohort studies suggest that disease risk begins to increase at BMI levels lower than those associated with increased risk of mortality (Manson et al., 1990). Thus, some investigators have recom- mended that individuals should aim at having a BMI of 22 kg/m2 at the end of adolescence (NHLBI/NIDDK, 1998). This level would also provide some margin for weight gain in mid-life without surpassing the 25 kg/m2 threshold. For these reasons, energy intakes associated with adverse risk are defined as those that cause weight gain for individuals with a body weight within the healthy range (BMI from 18.5 up to 25 kg/m2) and overweight individuals (BMI from 25 up to 30 kg/m2). In the case of obese individuals who need to lose weight to improve their health, energy intakes that cause adverse risk are those that are higher than those needed to lose weight without causing negative health consequences. Summary Because of the direct impact of deviations from energy balance on body weight and of changes in body weight, body-weight data represent critical indicators of the adequacy of energy intake. Energy requirements are defined as the amounts of energy that need to be consumed by indi- viduals to sustain stable body weights in the range desired for good health (BMI from 18.5 up to 25 kg/m2) while maintaining lifestyles that include adequate levels of physical activity to maintain social, cultural, and economic activity. Since any energy intake above the Estimated Energy Requirement (EER) would be expected to result in weight gain and a likely increased risk of morbidity, the Tolerable Upper Intake Levels are not applicable to energy. If weight gain was identified as the hazard, the lowest-observed- adverse-effect level (LOAEL) would be any intake above the EER for adults. The uncertainty factor would be one as there is no uncertainty in the fact that overconsumption of energy leads to weight gain.
225 E NERGY Intake Assessment Based on distribution data from the 1994â1996, 1998 Continuing Survey of Food Intakes by Individuals, the highest mean intake of energy from diet for any gender and life stage group was estimated to be about 2,840 kcal/d (Appendix Table E-1), the intake of boys ages 14 through 18 years. Men 19 through 30 years of age had the highest reported energy intake with the 99th percentile of intake at 5,378 kcal/d. RESEARCH RECOMMENDATIONS ⢠The number of available doubly labeled water studies for the deter- mination of total energy expenditure (TEE) in certain age and gender categories is limited and should be expanded. This is particularly true for young children 3 to 5 years of age, adolescent boys, and adult men and women 40 through 60 years of age. ⢠Development of reliable methods to track dietary energy intakes in population groups is needed. ⢠Identification of biological markers of risk of excess weight gain in children and young adults is needed. ⢠Methods suitable for free-living population-based studies or appli- cations should be developed to measure physical activity levels in order to classify children and adults into sedentary, low active, active, and very active levels of physical activity. ⢠More studies are necessary to determine whether and which dietary composition patterns facilitate permanent weight loss in adults and children. ⢠Development of practical, accurate means to assess body composi- tion in populations is needed. ⢠Physical activity patterns consistent with normal health and devel- opment of children should be described that are applicable across age, gender, and ethnic backgrounds. ⢠Factors affecting the energy intake required to satisfy nutrient requirements should be explored, including diet digestibility, viscosity, and energy and nutrient density. ⢠Factors affecting the changes in TEE during pregnancy, as well as equations to predict the basal metabolic rate throughout pregnancy, are needed to better predict the energy requirements of nonobese, overweight, and obese pregnant women. ⢠More information is needed on the energy requirements of over- weight and obese adults and children. It would be desirable for this addi- tional TEE information to be collected in studies that also document physical activity patterns, so that the relationship between activity and TEE can be further evaluated.
226 DIETARY REFERENCE INTAKES TABLE 5-33 Body Mass Index (BMI) and Risk of Noninsulin-Dependent Diabetes Mellitus Length of Reference Country Study Population Follow-Up Westlund and Sweden 3,751 men, 40â49 y 10 y Nicolaysen, 1972 Medalie et al., 1974 Israel 10,059 men, 40+ y 5y Ohlson et al., 1985 Sweden 792 men, 54 y 13.5 y Despres et al., 1989 Canada 52 premenopausal Not obese women applicable Lundgren et al., 1989 Sweden 1,462 women, 38â60 y 12 y Colditz et al., 1990 United States 113,861 women, 8y 30â55 y Haffner et al., 1991 United States 254 men and 8y 366 women
227 E NERGY Outcomea Obesity Index Weight-height relationship Incidence of diabetes (%) Normal ± 10% 0.6 10â15% overweight 1.8 15â25% overweight 2.5 25â35% overweight 3.7 35â45% overweight 7.1 > 45% overweight 12.6 Weight/height index (kg/cm) Incidence rate of diabetes 0.24â0.39 26/1,000 0.40â0.45 39/1,000 0.46â0.69 57/1,000 BMI, waist-to-hip ratio Risk of development of diabetes was significantly associated with BMI (p = 0.0003) and waist-to-hip ratio (p < 0.0001) BMI, body fat mass BMI and body fat mass were significantly associated with plasma glucose and insulin BMI Significant correlation between initial BMI and incidence of diabetes during follow-up (p < 0.001) BMI (kg/m 2) Proportional hazards RR for diabetes (95% CI) < 22 1.0 22â22.9 2.1 (1.4â3.3) 23â23.9 3.5 (2.3â5.1) 24â24.9 2.9 (1.9â4.5) 25â26.9 5.2 (3.7â7.5) 27â28.9 9.6 (6.8â13.6) 29â30.9 19.0 (13.6â26.4) 31â32.9 28.0 (19.9â39.4) 33â34.9 38.5 (27.0â54.9) ⥠35 58.2 (42.4â79.9) OR for diabetes (95% CI) BMI (kg/m 2) Men Women < 24.6 1.00 1.00 24.6â28.2 1.33 (0.25â7.27) 1.38 (0.32â6.08) > 28.2 2.51 (0.49â12.6) 3.70 (1.03â13.3) continued
228 DIETARY REFERENCE INTAKES TABLE 5-33 Continued Length of Reference Country Study Population Follow-Up Chan et al., 1994 United States 27,983 men, 40â75 y 5y Ford et al., 1997 United States 8,545 adults 10 y a RR = relative risk, CI = confidence interval, OR = odds ratio, CVD = cardiovascular disease.
229 E NERGY Outcomea Obesity Index BMI (kg/m 2) RR for diabetes (95% CI) < 23 1.0 23â23.9 1.0 (0.5â2.0) 24â24.9 1.5 (0.8â2.9) 25â26.9 2.2 (1.3â3.8) 27â28.9 4.4 (2.6â7.7) 29â30.9 6.7 (3.8â12.0) 31â32.9 11.6 (6.3â21.5) 33â34.9 21.3 (11.4â41.2) ⥠35 42.1 (22.0â80.6) Weight gain since age 21 RR for diabetes (95% CI) 0â2 kg 1.0 3â5 kg 0.9 (0.5â1.8) 6â7 kg 1.9 (1.0â3.7) 8â9 kg 3.5 (2.0â6.3) 10â14 kg 3.4 (2.0â5.8) 15+ kg 8.9 (5.5â14.7) BMI at baseline (kg/m2) Hazard ratio for diabetes (95% CI) < 22 1.00 22â22.9 1.16 (0.48â2.82) 23â23.9 2.39 (1.30â4.40) 24â24.9 2.82 (1.45â5.50) 25â26.9 2.75 (1.55â4.91) 27â28.9 4.63 (2.69â7.96) 29â30.9 4.88 (2.77â8.59) 31â32.9 6.96 (3.79â12.81) 33â34.9 9.28 (4.60â18.72) ⥠35 11.24 (6.66â18.96) Weight gain since baseline Hazard ratio for diabetes (95% CI) < 5 kg 1.00 5 to < 8 kg 2.11 (1.40â3.18) 8 to < 11 kg 1.19 (0.75â1.89) 11 to < 20 kg 2.66 (1.84â3.85) ⥠20 kg 3.84 (2.04â7.22) NOTE: BMI = kg/m2 unless noted otherwise. Multivariate-adjusted relative risk/hazard risk/odds ratio estimates were used in this table whenever possible.
230 DIETARY REFERENCE INTAKES TABLE 5-34 Body Mass Index (BMI) and Risk of Hypertension and Stroke Length of Reference Country Study Population Follow-Up Hypertension Ballantyne et al., UK 637 men and 835 women, Not 1978 mean 45â49 y applicable Brennan et al., Australia 600 men and 400 women, Not 1980 20â49 y applicable Criqui et al., 1982 United States 2,482 men and 2,298 Not women, 20+ y applicable MacMahon et al., Australia 5,550 men and women, Not 1984 25â64 y applicable Brown et al., 2000 United States 16,681 adults, 20+ y Not applicable Stroke Walker et al., 1996 United States 28,643 men, 40â75 y 5y Rexrode et al., United States 116,759 women, 30â55 y 16 y 1997 a RR = relative risk, OR = odds ratio.
231 E NERGY Outcomea Obesity Index Ponderal Index Ponderal index was significantly associated with (height/weight1/3) blood pressure only in hypertensive, male nonsmokers BMI Significant correlation between BMI and hypertension in men (p < 0.05) and women (p < 0.01) BMI BMI was significantly associated with diastolic and systolic blood pressure in both men and women BMI in men (kg/m2) RR for hypertension (95% CI) 19.5â25.4 1.00 25.5â30.4 1.72 (1.44â2.05) ⥠30.5 2.47 (1.83â3.34) BMI in women (kg/m2) RR for hypertension (95% CI) 18.5â24.4 1.00 24.5â30.4 2.09 (1.72â2.55) ⥠30.5 2.96 (2.14â4.10) OR for high blood pressure BMI (kg/m2) Men Women < 25 1.0 1.0 25 to <27 2.4 1.7 27 to <30 3.1 2.3 ⥠30 8.7 9.7 BMI (kg/m2) RR for stroke (95% CI) < 23 1.00 23.1â24.4 0.61 (0.32â1.16) 24.5â25.8 1.00 (0.57â1.75) 25.9â27.6 1.16 (0.67â2.02) ⥠27.7 1.25 (0.72â2.19) BMI (kg/m2) RR for ischemic stroke (95% CI) < 21 1.00 21 to <23 1.01 (0.70â1.45) 23 to <25 1.20 (0.83â1.71) 25 to <27 1.15 (0.78â1.70) 27 to <29 1.75 (1.17â2.59) 29 to <32 1.90 (1.28â2.82) ⥠32 2.37 (1.60â3.50) NOTE: BMI = kg/m2 unless noted otherwise. Multivariate-adjusted relative risk/ hazard risk/odds ratio estimates were used in this table whenever possible.
232 DIETARY REFERENCE INTAKES TABLE 5-35 Body Mass Index (BMI) and Risk of Coronary Heart Disease Length of Reference Country Study Population Follow-Up Hubert et al., 1983 United States 2,252 men and 2,818 26 y women, 28â62 y Willett et al., 1995 United States 115,818 women, 30â55 y 14 y Rexrode et al., 2001 United States 16,164 men, 40â84 y 9y a RR = relative risk, CI = confidence interval. NOTE: BMI = kg/m2 unless noted otherwise. Multivariate-adjusted relative risk/hazard risk/odds ratio estimates were used in this table whenever possible.
233 E NERGY Outcomea Obesity Index Metropolitan relative weight MRW predicted incidence of coronary disease, (MRW) at baseline (% coronary death, and congestive heart failure of desirable weight) in men In women, MRW was positively associated with coronary disease, stroke, congestive failure, and coronary and cardiovascular disease death BMI at baseline (kg/m2) RR for coronary heart disease (95% CI) < 21 1.00 21â22.9 1.19 (0.98â1.44) 23â24.9 1.46 (1.20â1.77) 25â28.9 2.06 (1.72â2.48) ⥠29 3.56 (2.96â4.29) Weight Gain from age 18 RR for coronary heart disease (95% CI) < 5 kg 1.00 5â7.9 kg 1.25 (1.01â1.55) 8â10.9 kg 1.65 (1.33â2.05) 11â19 kg 1.92 (1.61â2.29) ⥠20 kg 2.65 (2.17â3.22) BMI (kg/m2) RR for coronary heart disease (95% CI) < 22.8 1.00 22.8 to < 24.3 1.33 (0.99â1.79) 24.3 to < 25.7 1.28 (0.95â1.73) 25.7 to < 27.6 1.74 (1.31â2.30) ⥠27.6 1.89 (1.43â2.51)
234 DIETARY REFERENCE INTAKES TABLE 5-36 Body Mass Index (BMI) and Risk of Gallbladder Disease Length of Reference Country Study Population Follow-Up Kato et al., 1992 United States 7,831 men, 45+ y 22 y Stampfer et al., 1992 United States 90,302 women, 34â59 y 8y Sahi et al., 1998 United States 16,785 men, 15â24 y 61 y a RR = relative risk, CI = confidence interval.
235 E NERGY Outcomea Obesity Index BMI (kg/m2) RR for gallbladder disease (95% CI) < 21.65 1.0 21.65â23.79 1.1 (0.9â1.5) 23.80â25.80 1.4 (1.1â1.9) > 25.80 1.8 (1.4â2.3) RR for cholecystectomy or unremoved BMI (kg/m2) gallstones (95% CI) < 24 1.00 24 to <25 1.36 (1.16â1.60) 25 to <26 1.60 (1.36â1.88) 26 to <27 1.92 (1.60â2.30) 27 to <29 2.32 (2.02â2.66) 29 to <30 2.63 (2.16â3.19) 30 to <35 3.52 (3.11â3.98) 35 to <40 4.64 (3.86â5.57) 40 to <45 5.42 (4.01â7.34) 45+ 6.99 (4.48â10.90) BMI at baseline (kg/m2) Rate ratio for gallbladder disease < 20.0 1.00 20.0â21.9 1.05 22.0â23.9 1.12 ⥠24.0 1.43 BMI change from baseline (kg/m2) Rate ratio for gallbladder disease ⤠0.9 1.00 1.0â2.9 1.01 3.0â5.9 1.74 ⥠6.0 2.16 NOTE: BMI = kg/m2 unless noted otherwise. Multivariate-adjusted relative risk/hazard risk/odds ratio estimates were used in this table whenever possible.
236 DIETARY REFERENCE INTAKES TABLE 5-37 Body Mass Index (BMI) and Risk of Osteoarthritis Length of Reference Country Study Population Follow-Up Felson et al., 1988 United States 1,420 adults, 63â94 ~ 36 y at follow-up Hart and Spector, United 985 women, 45â64 y Not 1993 Kingdom applicable Carman et al., 1994 United States 588 men and 688 23 y women, 50â74 y at follow-up Hochberg et al., 1995 United States 465 men and 275 Not women, 40+ y applicable Cicuttini et al., 1996 United 658 women, Not Kingdom twins, 48â69 y applicable a OR = odds ratio.
237 E NERGY Outcomea Obesity Index Metropolitan relative weight at Cumulative incidence rate of knee baseline osteoarthritis (n/n [%]) Men Women Men Women < 105 < 100 34/110 (30.9) 28/155 (18.1) 105â112 100â108 26/113 (23.0) 42/173 (24.3) 113â120 109â116 38/128 (29.7) 58/170 (34.1) 121â128 117â127 31/112 (27.7) 60/157 (38.2) ⥠129 ⥠128 53/126 (42.1) 98/176 (55.7) BMI (kg/m2) OR for osteoarthritis of the knee (95% CI) < 23.4 1.00 23.4â26.4 2.86 (1.44â5.68) > 26.4 6.17 (3.26â11.71) Relative weight index at Incidence rate for osteoarthritis of baseline (% of ideal weight) the hand and wrist < 100 70.0/100 100â109 74.1/100 110â119 80.7/100 120â129 83.7/100 ⥠130 88.9/100 OR for osteoarthritis of the knee (95% CI) BMI Men Women Tertile 1 1.00 1.00 Tertile 2 0.94 (0.52â1.70) 2.03 (0.89â4.66) Tertile 3 2.40 (1.32â4.35) 4.34 (1.89â9.98) BMI OR for developing a radiological feature of osteoarthritis per unit of BMI ranged from 1.07 (0.91â1.25) to 1.63 (1.09â2.44) for all twins NOTE: BMI = kg/m2 unless noted otherwise. Multivariate-adjusted relative risk/hazard risk/odds ratio estimates were used in this table whenever possible.
238 DIETARY REFERENCE INTAKES TABLE 5-38 Body Mass Index (BMI) and Risk of Cancer Length of Reference Country Study Population Follow-Up Helmrich et al., United States, 1,185 women breast cancer ~3y 1983 Canada, cases, median 52 y Israel 3,227 women controls, median 47 y Rosenberg et al., Canada 607 women breast cancer 4 yr 1990 cases, < 70 y 1,214 women controls Chu et al., 1991 United States 4,323 cases and Not 4,358 controls, applicable women, 20â54 y Giovannucci et al., United States 47,723 men, 40â75 y 6y 1995 Giovannucci et al., United States 13,057 women, 40â65 y 6y 1996 Huang et al., 1997 United States 95,256 women, 30â55 y 16 y a RR = relative risk, CI = confidence interval.
239 E NERGY Outcomea Obesity Index RR for breast cancer in postmenopausal women BMI (kg/m2 ) (95% CI) < 21 1.0 21â24 1.5 (1.1â1.9) 25â27 1.6 (1.2â2.1) ⥠28 1.3 (1.0â1.8) RR for breast cancer (95% CI) BMI (kg/m2 ) Premenopausal Postmenopausal < 21 1.0 1.0 21â25 0.9 (0.7â1.3) 0.8 (0.5â1.1) ⥠26 0.8 (0.5â1.2) 1.2 (0.8â1.7) RR for breast cancer in menopausal BMI (kg/m2 ) women (95% CI) < 20.0 1.0 20.0â21.99 1.1 (0.7â1.5) 22.0â24.89 1.5 (1.0â2.2) 24.9â27.29 2.2 (1.4â3.5) 27.3â32.29 1.8 (1.1â2.8) ⥠32.3 2.7 (1.5â5.4) BMI (kg/m2 ) RR for colon cancer (95% CI) < 22 1.0 22â24.9 0.87 (0.54â1.39) 25â26.9 1.31 (0.85â2.02) 27â28.9 1.48 (0.89â2.56) ⥠29 1.48 (0.89â2.46) BMI (kg/m2 ) RR for distal colon adenomas (95% CI) < 21 1.00 21â22 0.82 (0.59â1.15) 23â24 1.18 (0.85â1.63) 25â28 1.03 (0.72â1.47) ⥠29 1.50 (1.02â2.21) RR for breast cancer in postmenopausal women Weight gain from age 18 (95% CI) ⤠2.0 kg 1.00 2.1â5.0 kg 1.20 (0.96â1.51) 5.1â10.0 kg 1.18 (0.96â1.45) 10.1â20.0 kg 1.20 (0.98â1.47) 20.1â25.0 kg 1.40 (1.10â1.78) > 25.0 kg 1.41 (1.12â1.78) NOTE: BMI = kg/m2 unless noted otherwise. Multivariate-adjusted relative risk/hazard risk/odds ratio estimates were used in this table whenever possible.
240 DIETARY REFERENCE INTAKES ⢠Additional research is needed on the extent to which energy expen- diture changes when a hypocaloric diet is consumed, and whether dietary composition affects the extent of change in energy expenditure. ⢠Independent of energy, identification of dietary components, if any, that could favorably affect body composition is needed. REFERENCES Abbott WG, Howard BV, Christin L, Freymond D, Lillioja S, Boyce VL, Anderson TE, Bogardus C, Ravussin E. 1988. Short-term energy balance: Relationship with protein, carbohydrate, and fat balances. Am J Physiol 255:E332âE337. Acheson K, Jéquier E, Wahren J. 1983. Influence of beta-adrenergic blockade on glucose-induced thermogenesis in man. J Clin Invest 72:981â986. Albu J, Shur M, Curi M, Murphy L, Heymsfield SB, Pi-Sunyer FX. 1997. Resting metabolic rate in obese, premenopausal black women. Am J Clin Nutr 66:531â 538. Allen JC, Keller RP, Archer P, Neville MC. 1991. Studies in human lactation: Milk composition and daily secretion rates of macronutrients in the first year of lactation. Am J Clin Nutr 54:69â80. Amatruda JM, Richeson F, Welle SL, Brodows RG, Lockwood DH. 1988. The safety and efficacy of a controlled low-energy (âvery-low-calorieâ) diet in the treatment of non-insulin-dependent diabetes and obesity. Arch Intern Med 148:873â877. Amatruda JM, Statt MC, Welle SL. 1993. Total and resting energy expenditure in obese women reduced to ideal body weight. J Clin Invest 92:1236â1242. Anderson DM, Williams FH, Merkatz RB, Schulman PK, Kerr DS, Pittard WB. 1983. Length of gestation and nutritional composition of human milk. Am J Clin Nutr 37:810â814. Anderson GH, Atkinson SA, Bryan MH. 1981. Energy and macronutrient content of human milk during early lactation from mothers giving birth prematurely and at term. Am J Clin Nutr 34:258â265. Armstrong DW. 1998. Metabolic and endocrine responses to cold air in women differing in aerobic capacity. Med Sci Sport Exerc 30:880â884. Ashworth A. 1969. Metabolic rates during recovery from proteinâcalorie malnutrition: The need for a new concept of specific dynamic action. Nature 223:407â409. Assel B, Rossi K, Kalhan S. 1993. Glucose metabolism during fasting through human pregnancy: Comparison of tracer method with respiratory calorimetry. Am J Physiol 265:E351âE356. Astrup A, Buemann B, Western P, Toubro S, Raben A, Christensen NJ. 1994. Obesity as an adaptation to a high-fat diet: Evidence from a cross-sectional study. Am J Clin Nutr 59:350â355. Astrup A, Toubro S, Dalgaard LT, Urhammer SA, Sorensen TI, Pedersen O. 1999. Impact of the v/v 55 polymorphism of the uncoupling protein 2 gene on 24-h energy expenditure and substrate oxidation. Int J Obes Relat Metab Disord 23:1030â1034. Bahr R, Ingnes I, Vaage O, Sejersted OM, Newsholme EA. 1987. Effect of duration of exercise on excess postexercise O2 consumption. J Appl Physiol 62:485â490. Bailey DA, McCulloch RG. 1990. Bone tissue and physical activity. Can J Sport Sci 15:229â239. Ballantyne D, Devine BL, Fife R. 1978. Interrelation of age, obesity, cigarette smoking, and blood pressure in hypertensive patients. Br Med J 1:880â881.
241 E NERGY Ballor DL, Keesey RE. 1991. A meta-analysis of the factors affecting exercise- induced changes in body mass, fat mass and fat-free mass in males and females. Int J Obes 15:717â726. Bandini LG, Schoeller DA, Cyr HN, Dietz WH. 1990a. Validity of reported energy intake in obese and nonobese adolescents. Am J Clin Nutr 52:421â451. Bandini LG, Schoeller DA, Dietz WH. 1990b. Energy expenditure in obese and nonobese adolescents. Pediatr Res 27:198â203. Barlow SE, Dietz WH. 1998. Obesity evaluation and treatment: Expert Committee recommendations. Pediatrics 102:E29. Bathalon GP, Tucker KL, Hays NP, Vinken AG, Greenberg AS, McCrory MA, Roberts SB. 2000. Psychological measures of eating behavior and the accuracy of 3 common dietary assessment methods in healthy postmenopausal women. Am J Clin Nutr 71:739â745. Baumgartner RN, Roche AF, Himes JH. 1986. Incremental growth tables: Supple- mentary to previously published charts. Am J Clin Nutr 43:711â722. Bellizzi MC, Dietz WH. 1999. Workshop on childhood obesity: Summary of the discussion. Am J Clin Nutr 70:173Sâ175S. Benedict FG, Cathcart EP. 1913. Muscular Work. A Metabolic Study with Special Refer- ence to the Efficiency of the Human Body as a Machine. Washington, DC: Carnegie Institution. Pp. 163â176. Benedict FG, Talbot FB. 1914. The Gaseous Metabolism of Infants, with Special Reference to its Relation of Pulse-Rate and Muscular Activity. Washington, DC: Carnegie Institution. Benedict FG, Talbot FB. 1921. Metabolism and Growth from Birth to Puberty. Washington, DC: Carnegie Institution. Bielinski R, Schutz Y, Jequier E. 1985. Energy metabolism during the postexercise recovery in man. Am J Clin Nutr 42:69â82. Bingham SA, Day NE. 1997. Using biochemical markers to assess the validity of prospective dietary assessment methods and the effect of energy adjustment. Am J Clin Nutr 65:1130Sâ1137S. Bingham SA, Goldberg GR, Coward WA, Prentice AM, Cummings JH. 1989. The effect of exercise and improved physical fitness on basal metabolic rate. Br J Nutr 61:155â173. Bingham SA, Gill C, Welch A, Day K, Cassidy A, Khaw KT, Sneyd MJ, Key TJ, Roe L, Day NE. 1994. Comparison of dietary assessment methods in nutritional epi- demiology: Weighed records v. 24 h recalls, food-frequency questionnaires and estimated-diet records. Br J Nutr 72:619â643. Bisdee JT, James WP, Shaw MA. 1989. Changes in energy expenditure during the menstrual cycle. Br J Nutr 61:187â199. Bitar A, Fellmann N, Vernet J, Coudert J, Vermorel M. 1999. Variations and deter- minants of energy expenditure as measured by whole-body indirect calorimetry during puberty and adolescence. Am J Clin Nutr 69:1209â1216. Blaak EE, Westerterp KR, Bar-Or O, Wouters LJ, Saris WH. 1992. Total energy expenditure and spontaneous activity in relation to training in obese boys. Am J Clin Nutr 55:777â782. Black AE. 1999. Small eaters or under-reporters? In: Guy-Grand B, Ailhaud G, eds. Progress in Obesity Research 8. London: John Libbey. Pp. 223â228. Black AE, Prentice AM, Goldberg GR, Jebb SA, Bingham SA, Livingstone MB, Coward WA. 1993. Measurements of total energy expenditure provide insights into the validity of dietary measurements of energy intake. J Am Diet Assoc 93:572â579.
242 DIETARY REFERENCE INTAKES Black AE, Coward WA, Prentice AM. 1996. Human energy expenditure in affluent societies: An analysis of 574 doubly-labelled water measurements. Eur J Clin Nutr 50:72â92. Blaza S, Garrow JS. 1983. Thermogenic response to temperature, exercise and food stimuli in lean and obese women, studied by 24 h direct calorimetry. Br J Nutr 49:171â180. Bloesch D, Schutz Y, Breitenstein E, Jequier E, Felber JP. 1988. Thermogenic response to an oral glucose load in man: Comparison between young and elderly subjects. J Am Coll Nutr 7:471â483. Bogardus C, Lillioja S, Ravussin E, Abbott W, Zawadzki JK, Young A, Knowler WC, Jacobowitz R, Moll PP. 1986. Familial dependence of the resting metabolic rate. N Engl J Med 315:96â100. Bouchard C, Perusse L. 1993. Genetics of obesity. Annu Rev Nutr 13:337â354. Bouchard C, Tremblay A, Nadeau A, Despres JP, Theriault G, Boulay MR, Lortie G, Leblanc C, Fournier G. 1989. Genetic effect in resting and exercise meta- bolic rates. Metabolism 38:364â370. Bouchard C, Tremblay A, Despres JP, Nadeau A, Lupien PJ, Theriault G, Dussault J, Moorjani S, Pinault S, Fournier G. 1990. The response to long-term over- feeding in identical twins. N Engl J Med 322:1477â1482. Bratteby LE, Sandhagen B, Lotborn M, Samuelson G. 1997. Daily energy expendi- ture and physical activity assessed by an activity diary in 374 randomly selected 15-year-old adolescents. Eur J Clin Nutr 51:592â600. Brennan PJ, Simpson JM, Blacket RB, McGilchrist CA. 1980. The effects of body weight on serum cholesterol, serum triglycerides, serum urate and systolic blood pressure. Aust N Z J Med 10:15â20. Briefel RR, Sempos CT, McDowell MA, Chien S, Alaimo K. 1997. Dietary methods research in the Third National Health and Nutrition Examination Survey: Underreporting of energy intake. Am J Clin Nutr 65:1203Sâ1209S. Bronstein MN, Mak RP, King JC. 1995. The thermic effect of food in normal- weight and overweight pregnant women. Br J Nutr 74:261â275. Brooks GA, Butterfield GE, Wolfe RR, Groves BM, Mazzeo RS, Sutton JR, Wolfel EE, Reeves JT. 1991. Increased dependence on blood glucose after acclimati- zation to 4,300 m. J Appl Physiol 70:919â927. Brooks GA, Wolfel EE, Groves BM, Bender PR, Butterfield GE, Cymerman A, Mazzeo RS, Sutton JR, Wolfe RR, Reeves JT. 1992. Muscle accounts for glucose disposal but not lactate appearance during exercise after acclimatization to 4,300 m. J Appl Physiol 72:2435â2445. Brooks GA, Fahey TD, White TP, Baldwin KM. 2000. Exercise Physiology: Human Bioenergetics and Its Applications, 3rd ed. Mountain View, CA: Mayfield Publishing. Brown CD, Higgins M, Donato KA, Rohde FC, Garrison R, Obarzanek E, Ernst ND, Horan M. 2000. Body mass index and the prevalence of hypertension and dyslipidemia. Obes Res 8:605â619. Buemann B, Astrup A, Christensen NJ, Madsen J. 1992. Effect of moderate cold exposure on 24-h energy expenditure: Similar response in postobese and nonobese women. Am J Physiol 263:E1040â1045. Buenen GP, Malina RM, Renson R, Simons J, Ostyn M, Lefevre J. 1992. Physical activity and growth, maturation and performance: A longitudinal study. Med Sci Sports Exerc 24(5):576â585.
243 E NERGY Burstein R, Coward AW, Askew WE, Carmel K, Irving C, Shpilberg O, Moran D, Pikarsky A, Ginot G, Sawyer M, Golan R, Epstein Y. 1996. Energy expenditure variations in soldiers performing military activities under cold and hot climate conditions. Mil Med 161:750â754. Butte NF. 1990. Basal metabolism of infants. In: Schürch B, Scrimshaw NS, eds. Activity, Energy Expenditure and Energy Requirements of Infants and Children. Switzerland: Nestlé Foundation. Pp. 117â137. Butte NF. 2000. Fat intake of children in relation to energy requirements. Am J Clin Nutr 72:1246Sâ1252S. Butte NF, Calloway DH. 1981. Evaluation of lactational performance in Navajo women. Am J Clin Nutr 34:2210â2215. Butte NF, Hopkinson JM. 1998. Body composition changes during lactation are highly variable among women. J Nutr 128:381Sâ385S. Butte NF, Garza C, OâBrian Smith E, Nichols BL. 1984a. Human milk intake and growth in exclusively breast-fed infants. J Pediatr 104:187â195. Butte NF, Garza C, Stuff JE, Smith EO, Nichols BL. 1984b. Effect of maternal diet and body composition on lactational performance. Am J Clin Nutr 39:296â306. Butte NF, Wong WW, Garza C. 1989. Energy cost of growth during infancy. Proc Nutr Soc 48:303â312. Butte NF, Wong WW, Ferlic L, Smith EO, Klein PD, Garza C. 1990. Energy expen- diture and deposition of breast-fed and formula-fed infants during early in- fancy. Pediatr Res 28:631â640. Butte NF, Hopkinson JM, Mehta N, Moon JK, Smith EO. 1999. Adjustments in energy expenditure and substrate utilization during late pregnancy and lacta- tion. Am J Clin Nutr 69:299â307. Butte NF, Hopkinson JM, Wong WW, Smith EO, Ellis KJ. 2000a. Body composition during the first two years of life: An updated reference. Pediatr Res 47:578â585. Butte NF, Wong WW, Hopkinson JM, Heinz CJ, Mehta NR, Smith EO. 2000b. Energy requirements derived from total energy expenditure and energy depo- sition during the first 2 y of life. Am J Clin Nutr 72:1558â1569. Butte NF, Wong WW, Hopkinson JM. 2001. Energy requirements of lactating women derived from doubly labeled water and milk energy output. J Nutr 131:53â58. Butterfield GE, Gates J, Fleming S, Brooks GA, Sutton JR, Reeves JT. 1992. In- creased energy intake minimizes weight loss in men at high altitude. J Appl Physiol 72:1741â1748. Carman WJ, Sowers M, Hawthorne VM, Weissfeld LA. 1994. Obesity as a risk factor for osteoarthritis of the hand and wrist: A prospective study. Am J Epidemiol 139:119â129. Carpenter WH, Poehlman ET, OâConnell M, Goran MI. 1995. Influence of body composition and resting metabolic rate on variation in total energy expendi- ture: A meta-analysis. Am J Clin Nutr 61:4â10. Carpenter WH, Fonong T, Toth MJ, Ades PA, Calles-Escandon J, Walston JD, Poehlman ET. 1998. Total daily energy expenditure in free-living older Afri- can-Americans and Caucasians. Am J Physiol 274:E96âE101. Cartee GD, Douen AG, Ramlal T, Klip A, Holloszy JO. 1991. Stimulation of glucose transport in skeletal muscle by hypoxia. J Appl Physiol 70:1593â1600. Chan JM, Rimm EB, Colditz GA, Stampfer MJ, Willett WC. 1994. Obesity, fat distri- bution, and weight gain as risk factors for clinical diabetes in men. Diabetes Care 17:961â969.
244 DIETARY REFERENCE INTAKES Chu SY, Lee NC, Wingo PA, Senie RT, Greenberg RS, Peterson HB. 1991. The relationship between body mass and breast cancer among women enrolled in the Cancer and Steroid Hormone Study. J Clin Epidemiol 44:1197â1206. Cicuttini FM, Baker JR, Spector TD. 1996. The association of obesity with osteo- arthritis of the hand and knee in women: A twin study. J Rheumatol 23:1221â 1226. Clagett DD, Hathaway ML. 1941. Basal metabolism of normal infants from three to fifteen months of age. Am J Dis Child 62:967â980. Clarke WR, Schrott HG, Leaverton PE, Connor WE, Lauer RM. 1978. Tracking of blood lipids and blood pressures in school age children: the Muscatine study. Circulation 58:626â634. Colditz GA, Willett SC, Stampfer MJ, Manson JE, Hennekens CH, Arky RA, Speizer FE. 1990. Weight as a risk factor for clinical diabetes in women. Am J Epidemiol 132:501â513. Colditz GA, Willett WC, Rotnitzky A, Manson JE. 1995. Weight gain as a risk factor for clinical diabetes mellitus in women. Ann Intern Med 122:481â486. Cole TJ, Bellizzi MC, Flegal KM, Dietz WH. 2000. Establishing a standard defini- tion for child overweight and obesity worldwide: International survey. Br Med J 320:1â6. Consolazio CF, Johnson RE, Pecora LJ. 1963. Physiological Measurements of Metabolic Functions in Man. New York: McGraw-Hill. Pp. 414â436. Coward WA, Prentice AM, Murgatroyd PR, Davies HL, Cole TJ, Sawyer M, Goldberg GR, Halliday D, MacNamara JP. 1984. Measurement of CO2 and water produc- tion rates in man using 2H, 18O-labelled H2O: Comparisons between calorimeter and isotope values. In: Van Es AJ, ed. Human Energy Metabolism: Physical Activity and Energy Expenditure Measurements in Epidemiological Research Based upon Direct and Indirect Calorimetry. Den Haag: CIP-gegevens Koninklijke Bibliotheek. Pp. 126â128. Criqui MH, Mebane I, Wallace RB, Heiss G, Holdbrook MJ. 1982. Multivariate correlates of adult blood pressures in nine North American populations: The Lipid Research Clinics Prevalence Study. Prev Med 11:391â402. Dauncey MJ. 1981. Influence of mild cold on 24 h energy expenditure, resting metabolism and diet-induced thermogenesis. Br J Nutr 45:257â267. Davies PS, Ewing G, Lucas A. 1989. Energy expenditure in early infancy. Br J Nutr 62:621â629. Davies PS, Ewing G, Coward WA, Lucas A. 1990. Energy metabolism in breast and formula fed infants. In: Atkinson SA, Hanson LA, Chandra RK, eds. Breast- Feeding, Nutrition, Infection and Infant Growth in Developed and Emerging Countries. St. Johnâs, Newfoundland: Arts Biomedical. P. 521. Davies PS, Day JM, Lucas A. 1991. Energy expenditure in early infancy and later body fatness. Int J Obes 15:727â731. Davies PS, Wells JC, Fieldhouse CA, Day JM, Lucas A. 1995. Parental body composi- tion and infant energy expenditure. Am J Clin Nutr 61:1026â1029. Davies PS, Wells JC, Hinds A, Day JM, Laidlaw A. 1997. Total energy expenditure in 9 month and 12 month infants. Eur J Clin Nutr 51:249â252. de Bruin NC, Degenhart HJ, Gal S, Westerterp KR, Stijnen T, Visser HK. 1998. Energy utilization and growth in breast-fed and formula-fed infants measured prospectively during the first year of life. Am J Clin Nutr 67:885â896. de Castro JM, Orozco S. 1990. Moderate alcohol intake and spontaneous eating patterns of humans: Evidence of unregulated supplementation. Am J Clin Nutr 52:246â253.
245 E NERGY de Groot LC, Boekholt HA, Spaaij CJ, van Raaij JM, Drijvers JJ, van der Heijden LJ, van der Heide D, Hautvast JG. 1994. Energy balances of healthy Dutch women before and during pregnancy: Limited scope for metabolic adaptations in pregnancy. Am J Clin Nutr 59:827â832. Deheeger M, Rolland-Cachera MF, Fontvieille AM. 1997. Physical activity and body composition in 10 year old French children: linkages with nutritional intake? Int J Obes Relat Metab Disord 21:372-379. Denne SC, Kalhan SC. 1987. Leucine metabolism in human newborns. Am J Physiol 253:E608âE615. Denne SC, Patel D, Kalhan SC. 1991. Leucine kinetics and fuel utilization during a brief fast in human pregnancy. Metabolism 40:1249â1256. DePue JD, Clark MM, Ruggiero L, Medeiros ML, Pera V. 1995. Maintenance of weight loss: A needs assessment. Obes Res 3:241â248. Despres J-P, Nadeau A, Tremblay A, Ferland M, Moorjani S, Lupien PJ, Thériault G, Pinault S, Bouchard C. 1989. Role of deep abdominal fat in the association between regional adipose tissue distribution and glucose tolerance in obese women. Diabetes 38:304â309. Dewey KG, Finley DA, Lonnerdal B. 1984. Breast milk volume and composition during late lactation (7â20 months). J Pediatr Gastroenterol Nutr 3:713â720. Dewey KG, Beaton G, Fjeld C, Lonnerdal B, Reeds P. 1996. Protein requirements of infants and children. Eur J Clin Nutr 50:S119âS150. Dhuper S, Warren MP, Brooks-Gunn J, Fox R. 1990. Effects of hormonal status on bone density in adolescent girls. J Clin Endocrinol Metab 71:1083â1088. Dionne I, Despres JP, Bouchard C, Tremblay A. 1999. Gender difference in the effect of body composition on energy metabolism. Int J Obes Relat Metab Disord 23:312â319. Doar JWH, Wilde, Thompson ME, Stewell PFJ. 1975. Influence of treatment with diet alone on oral glucose-tolerance test and plasma sugar and insulin levels in patients with maturity-onset diabetes mellitus. Lancet 1:1263â1266. Dunn AL, Marcus BH, Kampert JB, Garcia ME, Kohl HW, Blair SN. 1999. Compari- son of lifestyle and structured interventions to increase physical activity and cardiorespiratory fitness: A randomized trial. J Am Med Assoc 281:327â334. Durnin JV. 1990. Low energy expenditures in free-living populations. Eur J Clin Nutr 44:95â102. Durnin JV. 1996. Energy requirements: General principles. Eur J Clin Nutr 50: S2âS10. Durnin JV, McKillop FM, Grant S, Fitzgerald G. 1987. Energy requirements of pregnancy in Scotland. Lancet 2:897â900. Edholm OG, Adam JM, Healey MJ, Wolff HS, Goldsmith R, Best TW. 1970. Food intake and energy expenditure of army recruits. Br J Nutr 24:1091â1107. Elia M. 1991. Energy equivalents of CO2 and their importance in assessing energy expenditure when using tracer techniques. Am J Physiol 260:E75âE88. Eliakim A, Barstow TJ, Brasel JA, Ajie H, Lee WN, Renslo R, Berman N, Cooper DM. 1996. Effect of exercise training on energy expenditure, muscle volume, and maximal oxygen uptake in female adolescents. J Pediatr 129:537â543. Ellis KJ. 1997. Body composition of a young, multiethnic, male population. Am J Clin Nutr 66:1323â1331. Ellis KJ, Abrams SA, Wong WW. 1997. Body composition of a young, multiethnic female population. Am J Clin Nutr 65:724â731. EPA (Environmental Protection Agency). 1991. Building Air Quality: A Guide for Building Owners and Facility Managers. Washington, DC: U.S. Government Print- ing Office.
246 DIETARY REFERENCE INTAKES FAO/WHO/UNU (Food and Agriculture Organization/World Health Organiza- tion/United Nations University). 1985. Energy and Protein Requirements. Report of a Joint FAO/WHO/UNU Expert Consultation. Technical Report Series No. 724. Geneva: WHO. Felson DT, Anderson JJ, Naimark A, Walker AM, Meenan RF. 1988. Obesity and knee osteoarthritis. The Framingham Study. Ann Intern Med 109:18â24. Ferraro R, Lillioja S, Fontvieille AM, Rising R, Bogardus C, Ravussin E. 1992. Lower sedentary metabolic rate in women compared with men. J Clin Invest 90:780â784. Ferris AM, Dotts MA, Clark RM, Ezrin M, Jensen RG. 1988. Macronutrients in human milk at 2, 12, and 16 weeks postpartum. J Am Diet Assoc 88:694â697. Firouzbakhsh S, Mathis RK, Dorchester WL, Oseas RS, Groncy PK, Grant KE, Finklestein JZ. 1993. Measured resting energy expenditure in children. J Pediatr Gastroenterol Nutr 16:136â142. Fjeld CR, Schoeller DA, Brown KH. 1989. Body composition of children recover- ing from severe protein-energy malnutrition at two rates of catch-up growth. Am J Clin Nutr 50:1266â1275. Flatt JP. 1978. The biochemistry of energy expenditure. In: Bray GA, ed. Recent Advances in Obesity Research II. London: Newman Publishing. Pp. 211â228. Fletcher GF, Balady GJ, Amsterdam EA, Chaitman B, Eckel R, Fleg J, Froelicher VF, Leon AS, Piña IL, Rodney R, Simons-Morton DG, Williams MA, Bazzarre T. 2001. Exercise standards for testing and training: A statement for healthcare professionals from the American Heart Association. Circulation 104:1694â1740. Fomon SJ, Haschke F, Ziegler EE, Nelson SE. 1982. Body composition of reference children from birth to age 10 years. Am J Clin Nutr 35:1169â1175. Fontvieille AM, Dwyer J, Ravussin E. 1992. Resting metabolic rate and body compo- sition of Pima Indian and Caucasian children. Int J Obes Relat Metab Disord 16:535â542. Forbes GB. 1987. Human Body Composition. Growth, Aging, Nutrition, and Activity. New York: Springer-Verlag. Ford ES, Williamson DF, Liu S. 1997. Weight change and diabetes incidence: Find- ings from a national cohort of US adults. Am J Epidemiol 146:214â222. Forman JN, Miller WC, Szymanski LM, Fernhall B. 1998. Differences in resting metabolic rates of inactive obese African-American and Caucasian women. Int J Obes Relat Metab Disord 22:215â221. Forsum E, Sadurskis A, Wager J. 1988. Resting metabolic rate and body composi- tion of healthy Swedish women during pregnancy. Am J Clin Nutr 47:942â947. Forsum E, Kabir N, Sadurskis A, Westerterp K. 1992. Total energy expenditure of healthy Swedish women during pregnancy and lactation. Am J Clin Nutr 56:334â342. Foster GD, Wadden TA, Vogt RA. 1997. Resting energy expenditure in obese African American and Caucasian women. Obes Res 5:1â8. Foster GD, Wadden TA, Swain RM, Anderson DA, Vogt RA. 1999. Changes in resting energy expenditure after weight loss in obese African American and white women. Am J Clin Nutr 69:13â17. Frigerio C, Schutz Y, Whitehead R, Jequier E. 1991. A new procedure to assess the energy requirements of lactation in Gambian women. Am J Clin Nutr 54:526â533. Fukagawa NK, Bandini LG, Young JB. 1990. Effect of age on body composition and resting metabolic rate. Am J Physiol 259:E233âE238. Fukagawa NK, Bandini LG, Lim PH, Roingeard F, Lee MA, Young JB. 1991. Protein- induced changes in energy expenditure in young and old individuals. Am J Physiol 260:E345âE352.
247 E NERGY Gaesser GA, Brooks GA. 1984. Metabolic bases of excess post-exercise oxygen con- sumption: A review. Med Sci Sports Exerc 16:29â43. Garby L, Kurzer MS, Lammert O, Nielsen E. 1987. Energy expenditure during sleep in men and women: Evaporative and sensible heat losses. Hum Nutr Clin Nutr 41:225â233. Garby L, Lammert O, Nielsen E. 1990. Changes in energy expenditure of light physical activity during a 10 day period at 34°C environmental temperature. Eur J Clin Nutr 44:241â244. Geithner CA, Woynarowska B, Malina RM. 1998. The adolescent spurt and sexual maturation in girls active and nonactive in sport. Ann Hum Biol 25(5):415â 423. Gibson RS, Vanderkooy PD, MacDonald AC, Goldman A, Ryan BA, Berry M. 1989. A growth-limiting, mild zinc-deficiency syndrome in some Southern Ontario boys with low height percentiles. Am J Clin Nutr 49:1266â1276. Gilliam TB, Freedson. 1980. Effects of a 12-week school physical fitness program on peak VO2, body composition and blood lipids in 7 to 9 year old children. Int J Sports Med 1:73â78. Giovannucci E, Ascherio A, Rimm EB, Colditz GA, Stampfer MJ, Willett WC. 1995. Physical activity, obesity, and risk for colon cancer and adenoma in men. Ann Intern Med 122:327â334. Giovannucci E, Colditz GA, Stampfer MJ, Willett WC. 1996. Physical activity, obesity, and risk of colorectal adenoma in women (United States). Cancer Causes Control 7:253â263. Golay A, Schutz Y, Meyer HU, Thiebaud D, Curchod B, Maeder E, Felber JP, Jequier E. 1982. Glucose-induced thermogenesis in nondiabetic and diabetic obese subjects. Diabetes 31:1023â1028. Goldberg GR, Black AE, Jebb SA, Cole TJ, Murgatroyd PR, Coward WA, Prentice AM. 1991a. Critical evaluation of energy intake data using fundamental prin- ciples of energy physiology: 1. Derivation of cut-off limits to identify under- recording. Eur J Clin Nutr 45:569â581. Goldberg GR, Prentice AM, Coward WA, Davies HL, Murgatroyd PR, Sawyer MB, Ashford J, Black AE. 1991b. Longitudinal assessment of the components of energy balance in well-nourished lactating women. Am J Clin Nutr 54:788â798. Goldberg GR, Prentice AM, Coward WA, Davies HL, Murgatroyd PR, Wensing C, Black AE, Harding M, Sawyer M. 1993. Longitudinal assessment of energy expenditure in pregnancy by the doubly labeled water method. Am J Clin Nutr 57:494â505. Goran MI, Poehlman ET. 1992. Endurance training does not enhance total energy expenditure in healthy elderly persons. Am J Physiol 263:E950âE957. Goran MI, Calles-Escandon J, Poehlman ET, OâConnell M, Danforth E. 1994a. Effects of increased energy intake and/or physical activity on energy expendi- ture in young healthy men. J Appl Physiol 77:366â372. Goran MI, Kaskoun M, Johnson R. 1994b. Determinants of resting energy expendi- ture in young children. J Pediatr 125:362â367. Goran MI, Carpenter WH, McGloin A, Johnson R, Hardin JM, Weinsier RL. 1995a. Energy expenditure in children of lean and obese parents. Am J Physiol 268:E917âE924. Goran MI, Kaskoun M, Johnson R, Martinez C, Kelly B, Hood V. 1995b. Energy expenditure and body fat distribution in Mohawk children. Pediatrics 95:89â95. Goran MI, Gower BA, Nagy TR, Johnson RK. 1998a. Developmental changes in energy expenditure and physical activity in children: Evidence for a decline in physical activity in girls before puberty. Pediatrics 101:887â891.
248 DIETARY REFERENCE INTAKES Goran MI, Nagy TR, Gower BA, Mazariegos M, Solomons N, Hood V, Johnson R. 1998b. Influence of sex, seasonality, ethnicity, and geographic location on the components of total energy expenditure in young children: Implications for energy requirements. Am J Clin Nutr 68:675â682. Goran MI, Shewchuk R, Gower BA, Nagy TR, Carpenter WH, Johnson RK. 1998c. Longitudinal changes in fatness in white children: No effect of childhood energy expenditure. Am J Clin Nutr 67:309â316. Griffiths M, Payne PR. 1976. Energy expenditure in small children of obese and non-obese parents. Nature 260:698â700. Grund A, Vollbrecht H, Frandsen W, Krause H, Siewers M, Rieckert H, Muller MJ. 2000. No effect of gender on different components of daily energy expenditure in free living prepubertal children. Int J Obes Relat Metab Disord 24:299â305. Grund A, Krause H, Kraus M, Siewers M, Rieckert H, Müller MJ. 2001. Association between different attributes of physical activity and fat mass in untrained, endurance- and resistance-trained men. Eur J Appl Physiol 84:310â320. Grundy SM, Mok HYI, Zech L, Steinberg D, Berman M. 1979. Transport of very low density lipoprotein triglycerides in varying degrees of obesity and hypertriglyceridemia. J Clin Invest 63 :1274â1283. Guillermo-Tuazon MA, Barba CV, van Raaij JM, Hautvast JG. 1992. Energy intake, energy expenditure, and body composition of poor rural Philippine women throughout the first 6 mo of lactation. Am J Clin Nutr 56:874â880. Gutin B, Barbeau P, Owens S, Lemmon CR, Bauman M, Allison J, Kang HS, Litaker MS. 2002. Effects of exercise intensity on cardiovascular fitness, total body composition, and visceral adiposity of obese adolescents. A m J Clin Nutr 75:818â826. Guo S, Roche AF, Fomon SJ, Nelson SE, Chumlea WC, Rogers RR, Baumgartner RN, Ziegler EE, Siervogel RM. 1991. Reference data on gains in weight and length during the first two years of life. J Pediatr 119:355â362. Hadden DR, Montgomery DAD, Skelly RJ, Trimble ER, Weaver JA, Wilson EA, Buchanan KD. 1975. Maturity onset diabetes mellitus: response to intensive dietary management. Br Med J 2:276â278. Haffner SM, Mitchell BD, Hazuda HP, Stern MP. 1991. Greater influence of central distribution of adipose tissue on incidence of non-insulin-dependent diabetes in women than men. Am J Clin Nutr 53:1312â1317. Haggarty P, McNeill G, Abu Manneh MK, Davidson L, Milne E, Duncan G, Ashton J. 1994. The influence of exercise on the energy requirements of adult males in the UK. Br J Nutr 72:799â813. Harris JA, Benedict FG. 1919. A Biometric Study of Basal Metabolism in Man. Washing- ton, DC: Carnegie Institution. Hart DJ, Spector TD. 1993. The relationship of obesity, fat distribution and osteo- arthritis in women in the general population: The Chingford Study. J Rheumatol 20:331â335. Hartman WM, Stroud M, Sweet DM, Saxton J. 1993. Long-term maintenance of weight loss following supplemented fasting. Int J Eat Disord 14:87â93. Haschke F. 1989. Body composition during adolescence. In: Body Composition Mea- surements in Infants and Children: Report of the 98th Ross Conference on Pediatric Research. Columbus, OH: Ross Laboratories. Pp. 76â83. Hay WW. 1994. Placental supply of energy and protein substrates to the fetus. Acta Paediatr Suppl 405:13â19.
249 E NERGY Hayter JE, Henry CJ. 1993. Basal metabolic rate in human subjects migrating between tropical and temperate regions: A longitudinal study and review of previous work. Eur J Clin Nutr 47:724â734. Heinig MJ, Nommsen LA, Peerson JM, Lonnerdal B, Dewey KG. 1993. Energy and protein intakes of breast-fed and formula-fed infants during the first year of life and their association with growth velocity: The DARLING Study. Am J Clin Nutr 58:152â161. Heitmann BL, Kaprio J, Harris JR, Rissanen A, Korkeila M, Koskenvuo M. 1997. Are genetic determinants of weight gain modified by leisure-time physical activity? A prospective study of Finnish twins. Am J Clin Nutr 66:672â678. Helmrich SP, Shapiro S, Rosenberg L, Kaufman DW, Slone D, Bain C, Miettinen OS, Stolley PD, Rosenshein NB, Knapp RC, Leavitt T, Schottenfeld D, Engle RL, Levy M. 1983. Risk factors for breast cancer. Am J Epidemiol 117:35â45. Henry CJ. 2000. Mechanisms of changes in basal metabolism during ageing. Eur J Clin Nutr 54:S77âS91. Herring JL, Mole PA, Meredith CN, Stern JS. 1992. Effect of suspending exercise training on resting metabolic rate in women. Med Sci Sports Exerc 24:59â65. Hessemer V, Bruck K. 1985. Influence of menstrual cycle on thermoregulatory, metabolic, and heart rate responses to exercise at night. J A ppl Physiol 59:1911â1917. Heyman MB, Young VR, Fuss P, Tsay R, Joseph L, Roberts SB. 1992. Underfeeding and body weight regulation in normal-weight young men. Am J Physiol 263:R250âR257. Heymsfield SB, Gallagher D, Kotler DP, Wang Z, Allison DB, Heshka S. 2002. Body-size dependence of resting energy expenditure can be attributed to nonenergetic homogeneity of fat-free mass. Am J Physiol 282:E132âE138. Hill JO, Peters JC. 1998. Environmental contributions to the obesity epidemic. Science 280:1371â1374. Hill JR. 1964. The development of thermal stability in the newborn baby. In: Jonxis JH, Visser HK, Troelstra JA, eds. The Adaptation of the Newborn Infant to Extra- Uterine Life. Springfield, IL: Charles Thomas. Pp. 223â228. Hochberg MC, Lethbridge-Cejku M, Scott WW, Reichle R, Plato CC, Tobin JD. 1995. The association of body weight, body fatness and body fat distribution with osteoarthritis of the knee: Data from the Baltimore Longitudinal Study of Aging. J Rheumatol 22:488â493. Holden JH, Darga LL, Olson SM, Stettner DC, Ardito EA, Lucas CP. 1992. Long- term follow-up of patients attending a combination very-low calorie diet and behaviour therapy weight loss programme. I nt J Obes Relat Metab Disord 16:605â613. Holliday MA. 1971. Metabolic rate and organ size during growth from infancy to maturity and during late gestation and early infancy. Pediatrics 47:169â179. Holmes FL. 1985. Lavoisier and the Chemistry of Life. Madison, WI: University of Wisconsin Press. Howe JC, Rumpler WV, Seale JL. 1993. Energy expenditure by indirect calorimetry in premenopausal women: Variation within one menstrual cycle. J Nutr Biochem 4:268â273. Huang Z, Hankinson SE, Colditz GA, Stampfer MJ, Hunter DJ, Manson JE, Hennekens CH, Rosner B, Speizer FE, Willett WC. 1997. Dual effects of weight and weight gain on breast cancer risk. J Am Med Assoc 278:1407â1411.
250 DIETARY REFERENCE INTAKES Huang Z, Willett WC, Manson JE, Rosner B, Stampfer MJ, Speizer FE, Colditz GA. 1998. Body weight, weight change, and risk for hypertension in women. Ann Intern Med 128:81â88. Hubert HB, Feinleib M, McNamara PM, Castelli WP. 1983. Obesity as an indepen- dent risk factor for cardiovascular disease: A 26-year follow-up of participants in the Framingham Heart Study. Circulation 67:968â977. Hunt JF, White JR. 1980. Effect of ten weeks of vigorous daily exercise on serum lipids and lipoproteins in teenage males. Med Sci Sports Exerc 12:93. Hunter GR, Weinsier RL, Darnell BE, Zuckerman PA, Goran MI. 2000. Racial differences in energy expenditure and aerobic fitness in premenopausal women. Am J Clin Nutr 71:500â506. Hytten FE. 1991a. Nutrition. In: Hytten FE, Chamberlain G, eds. Clinical Physiology in Obstetrics. Oxford: Blackwell Scientific. Pp. 150â172. Hytten FE. 1991b. Weight gain in pregnancy. In: Hytten FE, Chamberlain G, eds. Clinical Physiology in Obstetrics. Oxford: Blackwell Scientific. Pp. 173â203. IDECG (International Dietary Energy Consulting Group). 1990. The Doubly-Labelled Water Method for Measuring Energy Expenditure: A Consensus Report by the IDECG Working Group. Technical Recommendations for Use in Humans. Vienna, Austria: NAHRES-4, International Atomic Energy Agency. Illingworth PJ, Jung RT, Howie PW, Leslie P, Isles TE. 1986. Diminution in energy expenditure during lactation. Br Med J 292:437â441. Illner K, Brinkmann G, Heller M, Bosy-Westphal A, Muller MJ. 2000. Metabolically active components of fat free mass and resting energy expenditure in non- obese adults. Am J Physiol 278:E308âE315. IOM (Institute of Medicine). 1990. Nutrition During Pregnancy. Washington, DC: National Academy Press. IOM. 1991. Nutrition During Lactation. Washington, DC: National Academy Press. Jakicic JM, Wing RR. 1998. Differences in resting energy expenditure in African- American vs. Caucasian overweight females. I nt J Obes R elat Metab Disord 22:236â242. James WPT, McNeill G, Ralph A. 1990. Metabolism and nutritional adaptation to altered intakes of energy substrates. Am J Clin Nutr 51:264â269. Jensen CL, Butte NF, Wong WW, Moon JK. 1992. Determining energy expenditure in preterm infants: Comparison of 2H218O method and indirect calorimetry. Am J Physiol 263:R685âR692. Jequier E, Tappy L. 1999. Regulation of body weight in humans. P hysiol Rev 79:451â480. Jiang Z, Yan Q, Su Y, Acheson KJ, Thelin A, Piguet-Welsch C, Ritz P, Ho Z. 1998. Energy expenditure of Chinese infants in Guangdong Province, south China, determined with use of the doubly labeled water method. Am J Clin Nutr 67:1256â1264. Johnson RK. 2000. What are people really eating and why does it matter? Nutr Today 35:40â45. Johnson RK, Goran MI, Poehlman ET. 1994. Correlates of over- and under- reporting of energy intake in healthy older men and women. Am J Clin Nutr 59:1286â1290. Johnson RK, Soultanakis RP, Matthews DE. 1998. Literacy and body fatness are associated with underreporting of energy intake in U.S. low-income women using the multiple-pass 24-hour recall: A doubly labeled water study. J Am Diet Assoc 98:1136â1140.
251 E NERGY Jones PJ, Winthrop AL, Schoeller DA, Swyer PR, Smith J, Filler RM, Heim T. 1987. Validation of doubly labeled water for assessing energy expenditure in infants. Pediatr Res 21:242â246. Jones PJ, Martin LJ, Su W, Boyd NF. 1997. Canadian Recommended Nutrient Intakes underestimate true energy requirements in middle-aged women. Can J Public Health 88:314â319. Kalhan S, Rossi K, Gruca L, Burkett E, OâBrien A. 1997. Glucose turnover and gluconeogenesis in human pregnancy. J Clin Invest 100:1775â1781. Kalkhoff RK, Kissebah AH, Kim H-J. 1978. Carbohydrate and lipid metabolism during normal pregnancy: Relationship to gestational hormone action. Semin Perinatol 2:291â307. Kannel WB, Brand N, Skinner JJ, Dawber TR, McNamara PM. 1967. The relation of adiposity to blood pressure and development of hypertension. Ann Intern Med 67:48â59. Kaplan AS, Zemel BS, Stallings VA. 1996. Differences in resting energy expendi- ture in prepubertal black children and white children. J Pediatr 129:643â647. Karlberg P. 1952. Determinations of standard energy metabolism (basal metabo- lism) in normal infants. Acta Paediatr Scand 41:11â151. Kashiwazaki H, Dejima Y, Suzuki T. 1990. Influence of upper and lower thermo- neutral room temperatures (20°C and 25°C) on fasting and post-prandial resting metabolism under different outdoor temperatures. Eur J Clin Nutr 44:405â413. Kato I, Nomura A, Stemmermann GN, Chyou P-H. 1992. Prospective study of clini- cal gallbladder disease and its association with obesity, physical activity, and other factors. Dig Dis Sci 37:784â790. Kempen KP, Saris WH, Westerterp KR. 1995. Energy balance during an 8-wk energy-restricted diet with and without exercise in obese women. Am J Clin Nutr 62:722â729. Kesaniemi YA, Grundy SM. 1983. Increased low density lipoprotein production associated with obesity. Arteriosclerosis 3:170â177. Keys A, Taylor H, Grande F. 1973. Basal metabolism and age of adult man. Metabo- lism 22:579â587. Klannemark M, Orho M, Groop L. 1998. No relationship between identified variants in the uncoupling protein 2 gene and energy expenditure. Eur J Endocrinol 139:217â223. Klausen B, Toubro S, Astrup A. 1997. Age and sex effects on energy expenditure. Am J Clin Nutr 65:895â907. Kleiber M. 1975. The Fire of Life. An Introduction to Animal Energetics. New York: Robert E. Krieger Publishing. Klein PD, James WP, Wong WW, Irving CS, Murgatroyd PR, Cabrera M, Dallosso HM, Klein ER, Nichols BL. 1984. Calorimetric validation of the doubly-labelled water method for determination of energy expenditure in man. Hum Nutr Clin Nutr 38C:95â106. Knuttgen HG, Emerson K. 1974. Physiological response to pregnancy at rest and during exercise. J Appl Physiol 36:549â553. Kopp-Hoolihan LE, Van Loan MD, Wong WW, King JC. 1999. Longitudinal assess- ment of energy balance in well-nourished, pregnant women. Am J Clin Nutr 69:697â704. Krebs-Smith SM, Graubard B, Kahle L, Subar A, Cleveland L, Ballard-Barbash R. 2000. Low energy reporters vs. others: A comparison of reported food intakes. Eur J Clin Nutr 54:281â287.
252 DIETARY REFERENCE INTAKES Kuczmarski RJ, Ogden CL, Grummer-Strawn LM, Flegal KM, Guo SS, Wei R, Mei Z, Curtin LR, Roche AF, Johnson CL. 2000. CDC growth charts: United States. Adv Data 314:1â28. Kushner RF, Racette SB, Neil K, Schoeller DA. 1995. Measurement of physical activity among black and white obese women. Obes Res 3:261Sâ265S. Lammi-Keefe CJ, Ferris AM, Jensen RG. 1990. Changes in human milk at 0600, 1000, 1400, 1800, and 2200 h. J Pediatr Gastroenterol Nutr 11:83â88. Lanzola E, Tagliabue A, Cena H. 1990. Skin temperature and energy expenditure. Ann Nutr Metab 34:311â316. Larson DE, Ferraro RT, Robertson DS, Ravussin E. 1995. Energy metabolism in weight-stable postobese individuals. Am J Clin Nutr 62:735â739. Lean ME, Murgatroyd PR, Rothnie I, Reid IW, Harvey R. 1988. Metabolic and thyroidal responses to mild cold are abnormal in obese diabetic women. Clin Endocrinol 28:665â673. Lederman SA, Paxton A, Heymsfield SB, Wang J, Thornton J, Pierson RN. 1997. Body fat and water changes during pregnancy in women with different body weight and weight gain. Obstet Gynecol 90:483â488. Leibel RL, Rosenbaum M, Hirsch J. 1995. Changes in energy expenditure resulting from altered body weight. N Engl J Med 332:621â628. Leonard WR, Galloway VA, Ivakine E. 1997. Underestimation of daily energy expenditure with the factorial method: Implications for anthropological research. Am J Phys Anthropol 103:443â454. Leon-Velarde F, Gamboa A, Chuquiza JA, Esteba WA, Rivera-Chira M, Monge CC. 2000. Hematological parameters in high altitude residents living at 4,355, 4,660, and 5,500 meters above sea level. High Alt Med Biol 1:97â104. Levine JA, Eberhardt NL, Jensen MD. 1999. Role of nonexercise activity thermo- genesis in resistance to fat gain in humans. Science 283:212â214. Levine JA, Schleusner SJ, Jensen MD. 2000. Energy expenditure of nonexercise activity. Am J Clin Nutr 72:1451â1454. Lichtman SW, Pisarska K, Berman ER, Pestone M, Dowling H, Offenbacher E, Weisel H, Heshka S, Matthews DE, Heymsfield SB. 1992. Discrepancy between self-reported and actual caloric intake and exercise in obese subjects. N Engl J Med 327:1893â1898. Lifson N, McClintock R. 1966. Theory of use of the turnover rates of body water for measuring energy and material balance. J Theoret Biol 12:46â74. Lifson N, Gordon GB, Visscher MB, Nier AO. 1949. The fate of utilized molecular oxygen and the source of the oxygen of respiratory carbon dioxide, studied with the aid of heavy oxygen. J Biol Chem 180:803â811. Lifson N, Gordon GB, McClintock R. 1955. Measurement of total carbon dioxide production by means of D2O18. J Appl Physiol 7:704â710. Linder CW, Durant RH, Mahoney OM. 1983. The effect of physical conditioning on serum lipids and lipoproteins in white male adolescents. Med Sci Sports Exerc 15:232â236. Lindsay CA, Huston L, Amini SB, Catalano PM. 1997. Longitudinal changes in the relationship between body mass index and percent body fat in pregnancy. Obstet Gynecol 89:377â382. Lipmann F. 1941. Metabolic generation and utilization of phosphate bond energy. Adv Enzymol 1:99â162.
253 E NERGY Livesey G, Elia M. 1988. Estimation of energy expenditure, net carbohydrate utili- zation, and net fat oxidation and synthesis by indirect calorimetry: Evaluation of errors with special reference to the detailed composition of fuels. Am J Clin Nutr 47:608â628. Livingstone MB, Coward WA, Prentice AM, Davies PS, Strain JJ, McKenna PG, Mahoney CA, White JA, Stewart CM, Kerr MJ. 1992a. Daily energy expendi- ture in free-living children: Comparison of heart-rate monitoring with the doubly labeled water (2H218O) method. Am J Clin Nutr 56:343â352. Livingstone MB, Prentice AM, Coward WA, Strain JJ, Black AE, Davies PS, Stewart CM, McKenna PG, Whitehead RG. 1992b. Validation of estimates of energy intake by weighed dietary record and diet history in children and adolescents. Am J Clin Nutr 56:29â35. Lovelady CA, Meredith CN, McCrory MA, Nommsen LA, Joseph LJ, Dewey KG. 1993. Energy expenditure in lactating women: A comparison of doubly labeled water and heart-rate-monitoring methods. Am J Clin Nutr 57:512â518. Lucas A, Ewing G, Roberts SB, Coward WA. 1987. How much energy does the breast fed infant consume and expend? Br Med J 295:75â77. Lundgren H, Bengtsson C, Blohme G, Lapidus L, Sjöström L. 1989. Adiposity and adipose tissue distribution in relation to incidence of diabetes in women: Results from a prospective population study in Gothenburg, Sweden. Int J Obes 13:413â423. MacMahon SW, Blacket RB, Macdonald GJ, Hall W. 1984. Obesity, alcohol con- sumption and blood pressure in Australian men and women. The National Heart Foundation of Australia Risk Factor Prevalence Study. J Hypertens 2:85â91. Maffeis C, Schutz Y, Zoccante L, Micciolo R, Pinelli L. 1993. Meal-induced thermo- genesis in lean and obese prepubertal children. Am J Clin Nutr 57:481â485. Malina RM. 1994. Physical activity: Relationship to growth, maturation, and physi- cal fitness. In: Bouchard C, Shephard RJ, Stephens T, eds. Physical Activity, Fitness, and Health. International Proceedings and Consensus Statement. Champaign, IL: Human Kinetics. Pp. 918â930. Manson JE, Colditz GA, Stampfer MJ, Willett WC, Rosner B, Monson RR, Speizer FE, Hennekens CH. 1990. A prospective study of obesity and risk of coronary heart disease in women. N Engl J Med 322:882â889. Margaria R, Cerretelli P, Aghemo P, Sassi G. 1963. Energy cost of running J Appl Physiol 18:367â370. Mawson JT, Braun B, Rock PB, Moore LG, Mazzeo R, Butterfield GE. 2000. Women at altitude: Energy requirement at 4,300 m. J Appl Physiol 88:272â281. McCargar L, Taunton J, Birmingham CL, Paré S, Simmons D. 1993. Metabolic and anthropometric changes in female weight cyclers and controls over a 1-year period. J Am Diet Assoc 93:1025â1030. Medalie JH, Papier C, Herman JB, Goldbourt U, Tamir S, Neufeld HN, Riss E. 1974. Diabetes mellitus among 10,000 adult men. I. Five-year incidence and associated variables. Isr J Med Sci 10:681â697. Meijer GA, Westerterp KR, Saris WH, ten Hoor F. 1992. Sleeping metabolic rate in relation to body composition and the menstrual cycle. A m J Clin Nutr 55:637â640. Melanson KJ, Saltzman E, Russell R, Roberts SB. 1996. Postabsorptive and post- prandial energy expenditure and substrate oxidation do not change during the menstrual cycle in young women. J Nutr 126:2531â2538.
254 DIETARY REFERENCE INTAKES Melanson KJ, Saltzman E, Vinken AG, Russell R, Roberts SB. 1998. The effects of age on postprandial thermogenesis at four graded energetic challenges: Find- ings in young and older women. J Gerontol A Biol Sci Med Sci 53:B409âB414. Merrill AL, Watt BK. 1973. Energy Value of Foods, Basis and Derivation. Agricultural Handbook No.74. Human Nutrition Research Branch, Agricultural Research Service, United States Department of Agriculture. U.S. Government Printing Office, Washington, D.C. Miller WC, Koceja DM, Hamilton EJ. 1997. A meta-analysis of the past 25 years of weight loss research using diet, exercise or diet plus exercise intervention. Int J Obes Relat Metab Disord 21:941â947. Minghelli G, Schutz Y, Charbonnier A, Whitehead R, Jequier E. 1990. Twenty-four- hour energy expenditure and basal metabolic rate measured in a whole-body indirect calorimeter in Gambian men. Am J Clin Nutr 51:563â570. Moore FS. 1963. The Body Cell Mass and Its Supporting Environment: Body Composition in Health and Disease. Philadelphia, PA: Saunders. Moore LL, Nguyen USDT, Rothman KJ, Cupples LA, Ellison RC. 1995. Preschool physical activity level and change in body fatness in young children. Am J Epidemiol 142:982â988. Morgan JB, York DA. 1983. Thermic effect of feeding in relation to energy balance in elderly men. Ann Nutr Metab 27:71â77. Morio B, Ritz P, Verdier E, Montaurier C, Beaufrere B, Vermorel M. 1997. Critical evaluation of the factorial and heart-rate recording methods for the determi- nation of energy expenditure of free-living elderly people. Br J Nutr 78:709â722. Morrison JA, Alfaro MP, Khoury P, Thornton BB, Daniels SR. 1996. Determinants of resting energy expenditure in young black girls and young white girls. J Pediatr 129:637â642. Motil KJ, Montandon CM, Garza C. 1990. Basal and postprandial metabolic rates in lactating and nonlactating women. Am J Clin Nutr 52:610â615. Murgatroyd PR, Goldberg GR, Diaz E, Prentice AM. 1990. The influence of mild cold on human energy expenditure: Is there a sex difference in the response? Br J Nutr 64:777. Must A, Strauss RS. 1999. Risks and consequences of childhood and adolescent obesity. Int J Obes Relat Metab Disord 23:S2âS11. Nagy LE, King JC. 1984. Postprandial energy expenditure and respiratory quotient during early and late pregnancy. Am J Clin Nutr 40:1258â1263. Nair KS, Halliday D, Garrow JS. 1983. Thermic response to isoenergetic protein, carbohydrate or fat meals in lean and obese subjects. Clin Sci 65:307â312. Nelson KM, Weinsier RL, Long CL, Schutz Y. 1992. Prediction of resting energy expenditure from fat-free mass and fat mass. Am J Clin Nutr 56:848â856. Neville MC. 1995. Determinants of milk volume and composition. In: Jensen RG, ed. Handbook of Milk Composition. San Diego, CA: Academic Press. Pp. 87â113. Neville MC, Keller R, Seacat J, Lutes V, Neifert M, Casey C, Allen J, Archer P. 1988. Studies in human lactation: Milk volumes in lactating women during the onset of lactation and full lactation. Am J Clin Nutr 48:1375â1386. Newman WP 3rd, Freedman DS, Voors AW, Gard PD, Srinivasan SR, Cresanta JL, Williamson GD, Webber LS, Berenson GS. 1986. Relation of serum lipoprotein levels and systolic blood pressure to early artherosclerosis. The Bolgalusa heart study. N Engl J Med 314:138â144.
255 E NERGY NHLBI/NIDDK (National Heart, Lung, and Blood Institute/National Institute of Diabetes and Digestive and Kidney Diseases). 1998. Clinical Guidelines on the Identification, Evaluation, and Treatment of Overweight and Obesity in Adults. The Evidence Report. NIH Publication No. 98-4083. Bethesda, MD: National Insti- tutes of Health. Nicklas BJ, Toth MJ, Goldberg AP, Poehlman ET. 1997. Racial differences in plasma leptin concentrations in obese postmenopausal women. J Clin Endocrinol Metab 82:315â317. Nickleberry BL, Brooks GA. 1996. No effect of cycling experience on leg cycle ergometer efficiency. Med Sci Sports Exerc 28:1396â1401. Nielsen E. 1987. Acute modest changes in relative humidity do not affect energy expenditure at rest in human subjects. Hum Nutr Clin Nutr 41:485â488. NIH (National Institutes of Health). 2000. The Practical Guide. Identification, Evalua- tion, and Treatment of Overweight and Obesity in Adults. NIH Publication No. 00-4084. Bethesda, MD: National Institutes of Health. Nommsen LA, Lovelady CA, Heinig MJ, Lonnerdal B, Dewey KG. 1991. Determi- nants of energy, protein, lipid, and lactose concentrations in human milk during the first 12 mo of lactation: The DARLING Study. Am J Clin Nutr 53:457â465. NRC (National Research Council). 1989. Recommended Dietary Allowances, 10th ed. Washington, DC: National Academy Press. Ohlson L-O, Larsson B, Svärdsudd K, Welin L, Eriksson H, Wilhelmsen L, Björntorp P, Tibblin G. 1985. The influence of body fat distribution on the incidence of diabetes mellitus. 13.5 years of follow-up of the participants in the study of men born in 1913. Diabetes 34:1055â1058. Osterman J, Lin Tu, Nankin HR, Brown KA, Hornung CA. 1992. Serum choles- terol profiles during treatment of obese outpatients with a very low calorie diet. Effect of initial cholesterol levels. Int J Obes Relat Metab Disord 16:49â58. Owen OE. 1988. Regulation of energy and metabolism. In: MJ Kinney, Jeejeebhoy KN, Hill GH, Owen OE, eds. Nutrition and Metabolism in Patient Care. Philadelphia: W.B. Saunders. Pp. 35â59. Owen OE, Kavle E, Owen RS, Polansky M, Caprio S, Mozzoli MA, Kendrick ZV, Bushman MC, Boden G. 1986. A reappraisal of caloric requirements in healthy women. Am J Clin Nutr 44:1â19. Owen OE, Holup JL, DâAlessio DA, Craig ES, Polansky M, Smalley KJ, Kavle EC, Bushman MC, Owen LR, Mozzoli MA, Kendrick ZV, Boden GH. 1987. A reappraisal of the caloric requirements of men. Am J Clin Nutr 46:875â885. Owens S, Gutin B, Allison J, Riggs S, Ferguson M, Litaker M, Thompson W. 1999. Effect of physical training on total and visceral fat in obese children. Med Sci Sports Exerc 31:143â148. Pacy PJ, Cox M, Khalouha M, Elkins S, Robinson AC, Garrow JS. 1996. Does mod- erate aerobic activity have a stimulatory effect on 24 h resting energy expendi- ture: A direct calorimeter study. Int J Food Sci Nutr 47:299â305. Pahud P, Ravussin E, Jequier E. 1980. Energy expended during oxygen deficit period of submaximal exercise in man. J Appl Physiol 48:770â775. Pandolf KB, Givoni B, Goldman RF. 1977. Predicting energy expenditure with loads while standing or walking very slowly. J Appl Physiol 43:577â581. Pannemans DL, Westerterp KR. 1995. Energy expenditure, physical activity and basal metabolic rate of elderly subjects. Br J Nutr 73:571â581.
256 DIETARY REFERENCE INTAKES Pannemans DL, Bouten CV, Westerterp KR. 1995. 24 h Energy expenditure during a standardized activity protocol in young and elderly men. Eur J Clin Nutr 49:49â56. Parizkova J. 1974. Particularities of lean body mass and fat development in growing boys as related to their motor activity. Acta Paediatrica Belgica 28:233Sâ243S. Passmore R, Durnin JV. 1955. Human energy expenditure. Physiol Rev 35:801â840. Penn D, Schmidt-Sommerfeld E. 1989. Lipids as an energy source for the fetus and newborn infant. In: Lebenthal E, ed. Textbook of Gastroenterology and Nutrition in Infancy. New York: Raven Press. Pp. 293â310. Piers LS, Diggavi SN, Rijskamp J, van Raaij JM, Shetty PS, Hautvast JG. 1995a. Resting metabolic rate and thermic effect of a meal in the follicular and luteal phases of the menstrual cycle in well-nourished Indian women. Am J Clin Nutr 61:296â302. Piers LS, Diggavi SN, Thangam S, van Raaij JM, Shetty PS, Hautvast JG. 1995b. Changes in energy expenditure, anthropometry, and energy intake during the course of pregnancy and lactation in well-nourished Indian women. Am J Clin Nutr 61:501â513. Pipe NG, Smith T, Halliday D, Edmonds CJ, Williams C, Coltart TM. 1979. Changes in fat, fat-free mass and body water in human normal pregnancy. Br J Obstet Gynaecol 86:929â940. Platte P, Pirke KM, Wade SE, Trimborn P, Fichter MM. 1995. Physical activity, total energy expenditure, and food intake in grossly obese and normal weight women. Int J Eating Disord 17:51â57. Poehlman ET. 1992. Energy expenditure and requirements in aging humans. J Nutr 122:2057â2065. Poehlman ET. 1993. Regulation of energy expenditure in aging humans. J Am Geriatr Soc 41:552â559. Poehlman ET, Danforth E. 1991. Endurance training increases metabolic rate and norepinephrine appearance rate in older individuals. Am J Physiol 261:E233â E239. Poehlman ET, Melby CL, Badylak SF. 1991. Relation of age and physical exercise status on metabolic rate in younger and older healthy men. J Gerontol 46:B54â B58. Poehlman ET, Toth MJ, Gardner AW. 1995. Changes in energy balance and body composition at menopause: A controlled longitudinal study. Ann Intern Med 123:673â675. Poppitt SD, Swann D, Black AE, Prentice AM. 1998. Assessment of selective under- reporting of food intake by both obese and non-obese women in a metabolic facility. Int J Obesity Relat Metab Disord 22:303â311. Prentice AM, Black AE, Coward WA, Davies HL, Goldberg GR, Murgatroyd PR, Ashford J, Sawyer M, Whitehead RG. 1986. High levels of energy expenditure in obese women. Br Med J 292:983â987. Prentice AM, Lucas A, Vasquez-Velasquez L, Davies PS, Whitehead RG. 1988. Are current dietary guidelines for young children a prescription for overfeeding? Lancet 2:1066â1069. Prentice AM, Goldberg GR, Davies HL, Murgatroyd PR, Scott W. 1989. Energy- sparing adaptations in human pregnancy assessed by whole-body calorimetry. Br J Nutr 62:5â22. Prentice AM, Black AE, Coward WA, Cole TJ. 1996a. Energy expenditure in over- weight and obese adults in affluent societies: An analysis of 319 doubly-labelled water measurements. Eur J Clin Nutr 50:93â97.
257 E NERGY Prentice AM, Spaaij CJ, Goldberg GR, Poppitt SD, van Raaij JM, Totton M, Swann D, Black AE. 1996b. Energy requirements of pregnant and lactating women. Eur J Clin Nutr 50:S82âS111. Price GM, Paul AA, Cole TJ, Wadsworth ME. 1997. Characteristics of the low- energy reporters in a longitudinal national dietary survey. Br J Nutr 77:833â851. Pryer JA, Vrijheid M, Nichols R, Kiggins M, Elliot P. 1997. Who are the âlow energy reportersâ in the dietary and nutritional survey of British adults? Int J Epidemiol 26:146â154. Racette SB, Schoeller DA, Kushner RF, Neil KM, Herling-Iaffaldano K. 1995. Effects of aerobic exercise and dietary carbohydrate on energy expenditure and body composition during weight reduction in obese women. A m J Clin Nutr 61:486â494. Raitakari OT, Porkka KVK, Taimela S, Telama R, Rasanen L, Viikari JSA. 1994. Effects of persistent physical activity and inactivity on coronary risk factors in children and young adults. Am J Epidemiol 140:195â205. Ravussin E, Lillioja S, Anderson TE, Christin L, Bogardus C. 1986. Determinants of 24-hour energy expenditure in man: Methods and results using a respiratory chamber. J Clin Invest 78:1568â1578. Ravussin E, Lillioja S, Knowler WC, Christin L, Freymond D, Abbott WG, Boyce V, Howard BV, Bogardus C. 1988. Reduced rate of energy expenditure as a risk factor for body-weight gain. N Engl J Med 318:467â472. Ravussin E, Harper IT, Rising R, Bogardus C. 1991. Energy expenditure by doubly labeled water: Validation in lean and obese subjects. Am J Physiol 261:E402âE409. Reichman BL, Chessex P, Putet G, Verellen GJ, Smith JM, Heim T, Swyer PR. 1982. Partition of energy metabolism and energy cost of growth in the very low- birth-weight infant. Pediatrics 69:446â451. Reisin E, Abel R, Modan M, Silverberg DS, Eliahou HE, Modan B. 1978. Effect of weight loss without salt restriction on the reduction of blood pressure in over- weight hypertensive patients. N Engl J Med 298:1â6. Rexrode KM, Hennekens CH, Willett WC, Colditz GA, Stampfer MJ, Rich-Edwards JW, Speizer FE, Manson JE. 1997. A prospective study of body mass index, weight change, and risk of stroke in women. J Am Med Assoc 277:1539â1545. Rexrode KM, Buring JE, Manson JE. 2001. Abdominal and total adiposity and risk of coronary heart disease in men. Int J Obes Relat Metab Disord 25:1047â1056. Rimm EB, Stampfer MJ, Giovannucci F, Ascherio A, Spiegelman D, Colditz GA, Willett WC. 1995. Body size and fat distribution as predictors of coronary heart disease among middle-aged and older US women. A m J Epidemiol 15:1117â1127. Riumallo JA, Schoeller D, Barrera G, Gattas V, Uauy R. 1989. Energy expenditure in underweight free-living adults: Impact of energy supplementation as deter- mined by doubly labeled water and indirect calorimetry. A m J Clin Nutr 49:239â246. Roberts SB. 1996. Energy requirements of older individuals. E ur J Clin Nutr 50:S112âS118. Roberts SB, Dallal GE. 1998. Effects of age on energy balance. Am J Clin Nutr 68:975Sâ979S. Roberts SB, Dallal GE. 2001. The new childhood growth charts. Nutr Rev 59:31â36. Roberts SB, Young VR. 1988. Energy costs of fat and protein deposition in the human infant. Am J Clin Nutr 48:951â955.
258 DIETARY REFERENCE INTAKES Roberts SB, Coward WA, Schlingenseipen K-H, Nohria V, Lucas A. 1986. Compari- son of the doubly labeled water (2H218O) method with indirect calorimetry and a nutrient-balance study for simultaneous determination of energy expen- diture, water intake, and metabolizable energy intake in preterm infants. Am J Clin Nutr 44:315â322. Roberts SB, Savage J, Coward WA, Chew B, Lucas A. 1988. Energy expenditure and intake in infants born to lean and overweight mothers. N E ngl J Med 318:461â466. Roberts SB, Young VR, Fuss P, Fiatarone MA, Richard B, Rasmussen H, Wagner D, Joseph L, Holehouse E, Evans WJ. 1990. Energy expenditure and subsequent nutrient intakes in overfed young men. Am J Physiol 259:R461âR469. Roberts SB, Heyman MB, Evans WJ, Fuss P, Tsay R, Young VR. 1991. Dietary energy requirements of young adult men, determined by using the doubly labeled water method. Am J Clin Nutr 54:499â505. Roberts SB, Young VR, Fuss P, Heyman MB, Fiatarone M, Dallal GE, Cortiella J, Evans WJ. 1992. What are the dietary energy needs of elderly adults? Int J Obes Relat Metab Disord 16:969â976. Roberts SB, Fuss P, Heyman MB, Young VR. 1995. Influence of age on energy requirements. Am J Clin Nutr 62:1053Sâ1058S. Rolland-Cachera MF, Deheeger M, Bellisle F, Sempe M, Guilloud-Bataille M, Patois E. 1984. Adiposity rebound in children: a simple indicator for predicting obesity. Am J Clin Nutr 39:129â135. Rolland-Cachera MF. 2001. Early adiposity rebound is not associated with energy or fat intake in infancy. Pediatrics 108:218â219. Rosenberg L, Palmer JR, Miller DR, Clarke EA, Shapiro S. 1990. A case-control study of alcoholic beverage consumption and breast cancer. Am J Epidemiol 131:6â14. Sadurskis A, Kabir N, Wager J, Forsum E. 1988. Energy metabolism, body composi- tion, and milk production in healthy Swedish women during lactation. Am J Clin Nutr 48:44â49. Sahi T, Paffenbarger RS, Hsieh C-C, Lee I-M. 1998. Body mass index, cigarette smoking, and other characteristics as predictors of self-reported, physician- diagnosed gallbladder disease in male college alumni. A m J Epidemiol 147:644â651. Salbe AD, Fontvieille AM, Harper IT, Ravussin E. 1997. Low levels of physical activity in 5-year-old children. J Pediatr 131:423â429. Saltzman E, Roberts SB. 1995. The role of energy expenditure in energy regula- tion: Findings from a decade of research. Nutr Rev 53:209â220. Saris WHM, Emons HJG, Groenenboom DC, Westerterp KR. 1989. Discrepancy between FAO/WHO energy requirements and actual energy expenditure in healthy 7-11 year old children. In: Beunen G, Ghesquiere J, Reybrouck T, Claessens AL, eds. Children and Exercise: 14th International Seminar on Pediatric Work Physiology. Stuttgart, Germany: Ferdinand Enke Verlag Press. Sasaki J, Shindo M, Tanaka M, Ando M, Arakawa K. 1987. A long-term aerobic exercise program decreases the obesity index and increases high density lipo- protein cholesterol concentration in obese children. Int J Obes 11:339â345. Savage MP, Petratis MM, Thomson WH, Berg K, Smith JL, Sady SP. 1986. Exercise training effects on serum lipids of prepubescent boys and adult men. Med Sci Sports Exerc 18:197â204.
259 E NERGY Sawaya AL, Saltzman E, Fuss P, Young VR, Roberts SB. 1995. Dietary energy requirements of young and older women determined by using the doubly labeled water method. Am J Clin Nutr 62:338â344. Schoeller DA. 1983. Energy expenditure from doubly labeled water: Some funda- mental considerations in humans. Am J Clin Nutr 38:999â1005. Schoeller DA. 1995. Limitations in the assessment of dietary energy intake by self- report. Metabolism 44:18â22. Schoeller DA. 2001. The importance of clinical research: The role of thermo- genesis in human obesity. Am J Clin Nutr 73:511â516. Schoeller DA, Fjeld CR. 1991. Human energy metabolism: What we have learned from the doubly labeled water method? Annu Rev Nutr 11:355â373. Schoeller DA, Webb P. 1984. Five-day comparison of the doubly labeled water method with respiratory gas exchange. Am J Clin Nutr 40:153â158. Schoeller DA, Ravussin E, Schutz Y, Acheson KJ, Baertschi P, Jequier E. 1986. Energy expenditure by doubly labeled water: Validation in humans and pro- posed calculation. Am J Physiol 250:R823âR830. Schofield C. 1985. An annotated bibliography of source material for basal meta- bolic rate data. Hum Nutr Clin Nutr 39C:42â91. Schofield WN. 1985. Predicting basal metabolic rate, new standards and review of previous work. Hum Nutr Clin Nutr 39C:5â41. Schotte DE, Stunkard AJ. 1990. The effects of weight reduction on blood pressure in 301 obese patients. Ann Intern Med 150:1701â1704. Schulz LO, Nyomba BL, Alger S, Anderson TE, Ravussin E. 1991. Effect of endur- ance training on sedentary energy expenditure measured in a respiratory chamber. Am J Physiol 260:E257âE261. Schulz LO, Alger S, Harper I, Wilmore JH, Ravussin E. 1992. Energy expenditure of elite female runners measured by respiratory chamber and doubly labeled water. J Appl Physiol 72:23â28. Schutz Y, Golay A, Felber JP, Jéquier E. 1984. Decreased glucose-induced thermo- genesis after weight loss in obese subjects: A predisposing factor for relapse obesity? Am J Clin Nutr 39:380â387. Schutz Y, Golay A, Jéquier E. 1988. 24 h Energy expenditure (24-EE) in pregnant women with a standardized activity level. Experentia 44:A31. Schwartz RS, Jaeger LF, Veith RC. 1990. The thermic effect of feeding in older men: The importance of the sympathetic nervous system. Metabolism 39:733â737. Seale JL, Rumpler WV. 1997. Comparison of energy expenditure measurements by diet records, energy intake balance, doubly labeled water and room calorimetry. Eur J Clin Nutr 51:856â863. Seale JL, Rumpler WV, Conway JM, Miles CW. 1990. Comparison of doubly labeled water, intake-balance, and direct- and indirect-calorimetry methods for measuring energy expenditure in adult men. Am J Clin Nutr 52:66â71. Segal KR, Gutin B, Albu J, Pi-Sunyer FX. 1987. Thermic effects of food and exercise in lean and obese men of similar lean body mass. Am J Physiol 252:E110âE117. Segal KR, Edano A, Blando L, Pi-Sunyer FX. 1990a. Comparison of thermic effects of constant and relative caloric loads in lean and obese men. Am J Clin Nutr 51:14â21. Segal KR, Edano A, Tomas MB. 1990b. Thermic effect of a meal over 3 and 6 hours in lean and obese men. Metabolism 39:985â992. Segal KR, Chun A, Coronel P, Cruz-Noori A, Santos R. 1992. Reliability of the measurement of postprandial thermogenesis in men of three levels of body fatness. Metabolism 41:754â762.
260 DIETARY REFERENCE INTAKES Seidell JC, Verschuren WM, Van Leer EM, Kromhout D. 1996. Overweight, under- weight, and mortality: A prospective study of 48,287 men and women. Arch Intern Med 156:958â963. Shah M, Geissler CA, Miller DS. 1988. Metabolic rate during and after aerobic exercise in post-obese and lean women. Eur J Clin Nutr 42:455â464. Shetty PS, Soares MJ, James WPT. 1994. Body mass index: Its relationship to basal metabolic rates and energy requirements. Eur J Clin Nutr 48:S28âS38. Siler SQ, Neese RA, Hellerstein MK. 1999. De novo lipogenesis, lipid kinetics, and whole-body lipid balances in humans after acute alcohol consumption. Am J Clin Nutr 70:928â936. Sinclair JC. 1978. Temperature Regulation and Energy Metabolism in the Newborn. New York: Grune and Stratton. Soares MJ, Piers LS, Shetty PS, Robinson S, Jackson AA, Waterlow CJ. 1991. Basal metabolic rate, body composition and whole-body protein turnover in Indian men with differing nutritional status. Clin Sci 81:419â425. Soares MJ, Piers LS, OâDea K, Shetty PS. 1998. No evidence for an ethnic influence on basal metabolism: An examination of data from India and Australia. Br J Nutr 79:333â341. Sohlstrom A, Forsum E. 1995. Changes in adipose tissue volume and distribution during reproduction in Swedish women as assessed by magnetic resonance imaging. Am J Clin Nutr 61:287â295. Sohlstrom A, Forsum E. 1997. Changes in total body fat during the human repro- ductive cycle as assessed by magnetic resonance imaging, body water dilution, and skinfold thickness: A comparison of methods. Am J Clin Nutr 66:1315â1322. Solomon SJ, Kurzer MS, Calloway DH. 1982. Menstrual cycle and basal metabolic rate in women. Am J Clin Nutr 36:611â616. Spaaij CJK, van Raaij JMA, de Groot LC, van der Heijden LJ, Boekholt HA, Hautvast JG. 1994a. Effect of lactation on resting metabolic rate and on diet- and work- induced thermogenesis. Am J Clin Nutr 59:42â47. Spaaij CJK, van Raaij JMA, van der Heijden LJ, Schouten FJM, Drijvers JJ, de Groot LC, Boekholt HA, Hautvast JG. 1994b. No substantial reduction of the thermic effect of a meal during pregnancy in well-nourished Dutch women. Br J Nutr 71:335â344. Sparks JW, Girard JR, Battaglia FC. 1980. An estimate of the caloric requirements of the human fetus. Biol Neonate 38:113â119. Stampfer MJ, Maclure KM, Colditz GA, Manson JE, Willett WC. 1992. Risk of symp- tomatic gallstones in women with severe obesity. Am J Clin Nutr 55:652â658. Stevens J, Cai J, Pamuk ER, Williamson DF, Thun MJ, Wood JL. 1998. The effect of age on the association between body-mass index and mortality. N Engl J Med 338:1â7. Stubbs RJ, Harbron CG, Murgatroyd PR, Prentice AM. 1995. Covert manipulation of dietary fat and energy density: Effect on substrate flux and food intake in men eating ad libitum. Am J Clin Nutr 62:316â329. Stunkard AJ, Berkowitz RI, Stallings VA, Schoeller DA. 1999. Energy intake, not energy output, is a determinant of body size in infants. A m J Clin Nutr 69:524â530. Sun M, Gower BA, Nagy TR, Trowbridge CA, Dezenberg C, Goran MI. 1998. Total, resting, and activity-related energy expenditures are similar in Caucasian and African-American children. Am J Physiol 274:E232âE237.
261 E NERGY Sun SS, Chumlea WC, Heymsfield SB, Lukaski HC, Schoeller D, Friedl K, Kuczmarski RJ, Flegal KM, Johnson CL, Hubbard VS. 2003. Development of bioelectrical impedance analysis prediction equations for body composition with the use of a multicomponent model for use in epidemiologic surveys. Am J Clin Nutr 77: 331â340. Sunnegardh J, Bratteby LE, Hagman U, Samuelson G, Sjolin S. 1986. Physical activity in relation to energy intake and body fat in 8- and 13-year-old children in Sweden. Acta Paediatr Scand 75:955â963. Suominen H, Heikkinen E, Parkatti T, Frosberg S, Kiiskinen A. 1977. Effects of âlifelongâ physical training on functional aging in men. S cand J Soc Med 14:225â240. Suter PM, Schutz Y, Jequier E. 1992. The effect of ethanol on fat storage in healthy subjects. N Engl J Med 326:983â987. Suter PM, Hasler E, Vetter W. 1997. Effects of alcohol on energy metabolism and body weight regulation: Is alcohol a risk factor for obesity? Nutr Rev 55:157â171. Svendsen OL, Hassager C, Christiansen C. 1995. Age- and menopause-associated variations in body composition and fat distribution in healthy women as mea- sured by dual-energy x-ray absorptiometry. Metabolism 44:369â373. Tanner JM. 1955. Growth at Adolescence. Springfield, IL: Charles C. Thomas. Thorne A, Wahren J. 1990. Diminished meal-induced thermogenesis in elderly man. Clin Physiol 10:427â437. Timmons BA, Araujo J, Thomas TR. 1985. Fat utilization enhanced by exercise in a cold environment. Med Sci Sports Exerc 17:673â678. Tomoyasu NJ, Toth MJ, Poehlman ET. 2000. Misreporting of total energy intake in older African Americans. Int J Obes Relat Metab Disord 24:20â26. Torun B, Davies PSW, Livingstone MBE, Paolisso M, Sackett R, Spurr GB. 1996. Energy requirements and dietary energy recommendations for children and adolescents 1 to 18 years old. Eur J Clin Nutr 50:S37âS81. Tounian P, Girardet J, Carlier L, Frelut ML, Veinberg F, Fontaine JL. 1993. Resting energy expenditure and food-induced thermogenesis in obese children. J Pediatr Gastroenterol Nutr 16:451â457. Tremblay A, Nadeau A, Fournier G, Bouchard C. 1988. Effect of a three-day inter- ruption of exercise-training on resting metabolic rate and glucose-induced thermogenesis in training individuals. Int J Obes 12:163â168. Tremblay A, Nadeau A, Despres JP, St-Jean L, Theriault G, Bouchard C. 1990. Long-term exercise training with constant energy intake. 2: Effect on glucose metabolism and resting energy expenditure. Int J Obes 14:75â84. Treuth MS, Adolph AL, Butte NF. 1998a. Energy expenditure in children pre- dicted from heart rate and activity calibrated against respiration calorimetry. Am J Physiol 275:E12âE18. Treuth MS, Hunter GR, Pichon C, Figueroa-Colon R, Goran MI. 1998b. Fitness and energy expenditure after strength training in obese prepubertal girls. Med Sci Sports Exerc 30:1130â1136. Treuth MS, Butte NF, Wong W. 2000. Effects of familial predisposition to obesity on energy expenditure in multiethnic prepubertal girls. Am J Clin Nutr 71:893â900. Troiano RP, Flegal KM, Kuczmarski RJ, Campbell SM, Johnson CL. 1995. Over- weight prevalence and trends for children and adolescents. The National Health and Nutrition Examination Surveys, 1963 to 1991. Arch Pediatr Adolesc Med 149:1085â1091.
262 DIETARY REFERENCE INTAKES Troiano RP, Frongillo EA, Sobal J, Levitsky DA. 1996. The relationship between body weight and mortality: A quantitative analysis of combined information from existing studies. Int J Obes Relat Metab Disord 20:63â75. Trowbridge CA, Gower BA, Nagy TR, Hunter GR, Treuth MS, Goran MI. 1997. Maximal aerobic capacity in African-American and Caucasian prepubertal chil- dren. Am J Physiol 273:E809âE814. Tuttle WW, Horvath SM, Presson LF, Daum K. 1953. Specific dynamic action of protein in men past 60 years of age. J Appl Physiol 5:631â634. Twisk JWR. 2001. Physical activity guidelines for children and adolescents. A criti- cal review. Sports Med 31:617â627. Tzankoff SP, Norris AH. 1977. Effect of muscle mass decrease on age-related BMR changes. J Appl Physiol 43:1001â1006. USDA/HHS (U.S. Department of Agriculture/U.S. Department of Health and Human Services). 2000. Nutrition and Your Health: Dietary Guidelines for Ameri- cans. Home and Garden Bulletin No. 232. Washington, DC: U.S. Government Printing Office. Valencia ME, McNeill G, Brockway JM, Smith JS. 1992. The effect of environ- mental temperature and humidity on 24 h energy expenditure in men. Br J Nutr 68:319â327. Valve R, Heikkinen S, Rissanen A, Laakso M, Uusitupa M. 1998. Synergistic effect of polymorphisms in uncoupling protein 1 and β3-adrenergic receptor genes on basal metabolic rate in obese Finns. Diabetologia 41:357â361. van Baak MA. 1999. Physical activity and energy balance. Public Health Nutr 2:335â339. Van Etten LM, Westerterp KR, Verstappen FT, Boon BJ, Saris WH. 1997. Effect of an 18-wk weight-training program on energy expenditure and physical activity. J Appl Physiol 82:298â304. van Gemert WG, Westerterp KR, van Acker BA, Wagenmakers AJ, Halliday D, Greve JM, Soeters PB. 2000. Energy, substrate and protein metabolism in morbid obesity before, during and after massive weight loss. Int J Obes Relat Metab Disord 24:711â718. van Raaij JMA, Vermaat-Miedema SH, Schonk CM, Peek ME, Hautvast JG. 1987. Energy requirements of pregnancy in the Netherlands. Lancet 2:953â955. van Raaij JMA, Peek ME, Vermaat-Miedema SH, Schonk CM, Hautvast JG. 1988. New equations for estimating body fat mass in pregnancy from body density or total body water. Am J Clin Nutr 48:24â29. van Raaij JMA, Schonk CM, Vermaat-Miedema SH, Peek ME, Hautvast JG. 1989. Body fat mass and basal metabolic rate in Dutch women before, during, and after pregnancy: A reappraisal of energy cost of pregnancy. Am J Clin Nutr 49:765â772. van Raaij JMA, Schonk CM, Vermaat-Miedema SH, Peek ME, Hautvast JG. 1990. Energy cost of physical activity throughout pregnancy and the first year post- partum in Dutch women with sedentary lifestyles. Am J Clin Nutr 52:234â239. van Raaij JMA, Schonk CM, Vermaat-Miedema SH, Peek ME, Hautvast JG. 1991. Energy cost of lactation, and energy balances of well-nourished Dutch lactat- ing women: Reappraisal of the extra energy requirements of lactation. Am J Clin Nutr 53:612â619. van Staveren WA, Deurenberg P, Burema J, de Groot LC, Hautvast JG. 1986. Sea- sonal variation in food intake, pattern of physical activity and change in body weight in a group of young adult Dutch women consuming self-selected diets. Int J Obes 10:133â145.
263 E NERGY Vaughan L, Zurlo F, Ravussin E. 1991. Aging and energy expenditure. Am J Clin Nutr 53:821â825. Visser M, Deurenberg P, van Staveren WA, Hautvast JG. 1995. Resting metabolic rate and diet-induced thermogenesis in young and elderly subjects: Relation- ship with body composition, fat distribution, and physical activity level. Am J Clin Nutr 61:772â778. Walker SP, Rimm EB, Ascherio A, Kawachi I, Stampfer MJ, Willett WC. 1996. Body size and fat distribution as predictors of stroke among US men. Am J Epidemiol 144:1143â1150. Walravens PA, Krebs NF, Hambidge KM. 1983. Linear growth of low income pre- school children receiving a zinc supplement. Am J Clin Nutr 38:195â201. Warren MP, Brooks-Gunn J, Hamilton LH, Warren LF, Hamilton WG. 1986. Scoliosis and fractures in young ballet dancers. Relation to delayed menarche and secondary amenorrhea. N Engl J Med 314:1348â1353. Warwick PM, Busby R. 1990. Influence of mild cold on 24 h energy expenditure in ânormallyâ clothed adults. Br J Nutr 63:481â488. Washburn RA, Kline G, Lackland DT, Wheeler FC. 1992. Leisure time physical activity: Are there black/white differences? Prev Med 21:127â135. Waterlow JC. 1999. The nature and significance of nutritional adaptation. Eur J Clin Nutr 53:S2âS5. Waterlow JC, James WPT, Healy MJR. 1989. Nutritional adaptation and variability. Eur J Clin Nutr 43:203â210. Webb P. 1981. Energy expenditure and fat-free mass in men and women. Am J Clin Nutr 34:1816â1826. Webber J, Macdonald IA. 2000. Signalling in body-weight homeostasis: Neuro- endocrine efferent signals. Proc Nutr Soc 59:397â404. Webber LS, Cresanta JL, Voors AW, Berenson GS. 1983. Tracking of cardiovascular disease risk factor variables in school-age children. J Chron Dis 36:647â660. Weinsier RL, Schutz Y, Bracco D. 1992. Reexamination of the relationship of rest- ing metabolic rate to fat-free mass and to the metabolically active components of fat-free mass in humans. Am J Clin Nutr 55:790â794. Weinsier RL, Hunter GR, Heini AF, Goran MI, Sell SM. 1998. The etiology of obesity: Relative contribution of metabolic factors, diet, and physical activity. Am J Med 105:145â150. Weinsier RL, Nagy TR, Hunter GR, Darnell BE, Hensrud DD, Weiss HL. 2000. Do adaptive changes in metabolic rate favor weight regain in weight-reduced indi- viduals? An examination of the set-point theory. Am J Clin Nutr 72:1088â1094. Wells JC, Davies PS. 1995. The effect of diet and sex on sleeping metabolic rate in 12-week old infants. Eur J Clin Nutr 49:329â335. Wells JC, Cole TJ, Davies PS. 1996. Total energy expenditure and body composi- tion in early infancy. Arch Dis Child 75:423â426. Westerterp KR, Brouns F, Saris WHM, ten Hoor F. 1988. Comparison of doubly labeled water with respirometry at low and high activity levels. J Appl Physiol 65:53â56. Westerterp KR, Lafeber HN, Sulkers EJ, Sauer PJ. 1991. Comparison of short term indirect calorimetry and doubly labeled water method for the assessment of energy expenditure in preterm infants. Biol Neonate 60:75â82. Westerterp KR, Meijer GA, Janssen EM, Saris WH, ten Hoor F. 1992. Long-term effect of physical activity on energy balance and body composition. Br J Nutr 68:21â30.
264 DIETARY REFERENCE INTAKES Westlund K, Nicolaysen R. 1972. Ten-year mortality and morbidity related to se- rum cholesterol. A follow-up of 3,751 men aged 40â49. Scand J Clin Lab Invest 30:1â24. Weyer C, Snitker S, Bogardus C, Ravussin E. 1999a. Energy metabolism in African Americans: Potential risk factors for obesity. Am J Clin Nutr 70:13â20. Weyer C, Snitker S, Rising R, Bogardus C, Ravussin E. 1999b. Determinants of energy expenditure and fuel utilization in man: Effects of body composition, age, sex, ethnicity and glucose tolerance in 916 subjects. Int J Obes Relat Metab Disord 23:715â722. Whitehead RG, Paul AA, Cole TJ. 1981. A critical analysis of measured food energy intakes during infancy and early childhood in comparison with current inter- national recommendations. J Hum Nutr 35:339â348. WHO (World Health Organization). 1998. Obesity: Preventing and Managing the Global Epidemic. Report of a World Health Organization Consultation on Obesity. Geneva: WHO. WHO Working Group. 1986. Use and interpretation of anthropometric indicators of nutritional status. Bull World Health Organ 64:929â941. Widdowson EM. 1974. Nutrition. In: Davis JA, Dobbing J, eds. Scientific Foundations of Paediatrics. London: William Heinemann Medical Books. Pp. 44â55. Willett WC, Manson JE, Stampfer MJ, Colditz GA, Rosner B, Speizer FE, Hennekens CH. 1995. Weight, weight change, and coronary heart disease in women. Risk within the ânormalâ weight range. J Am Med Assoc 273:461â465. Willett WC, Dietz WH, Colditz GA. 1999. Guidelines for healthy weight. N Engl J Med 341:427â434. Wing RR, Marcus MD, Salata R, Epstein LH, Miaskiewicz S, Blair EH. 1991. Effects of a very-low-calorie diet on long-term glycemic control in obese Type 2 dia- betic subjects. Arch Intern Med 151:1334â1340. Withers RT, Smith DA, Tucker RC, Brinkman M, Clark DG. 1998. Energy metabolism in sedentary and active 49- to 70-yr-old women. J Appl Physiol 84:1333â1340. Wong WW. 1994. Energy expenditure of female adolescents. J A m Coll Nutr 13:332â337. Wong WW, Butte NF, Ellis KJ, Hergenroeder AC, Hill RB, Stuff JE, Smith E. 1999. Pubertal African-American girls expend less energy at rest and during physical activity than Caucasian girls. J Clin Endocrinol Metab 84:906â911. Wood PD, Stefanick ML, Dreon DM, Frey-Hewitt B, Garay SC, William PT, Superko HR, Fortmann SP, Albers JJ, Vranizan KM, et al. 1988. Changes in plasma lipids and lipoproteins in overweight men during weight loss through dieting as compared with exercise. N Engl J Med 319(18):1173-1179. Wood PD, Stefanick ML, Williams PT, Haskell WL. 1991. The effects on plasma lipoproteins of a prudent weight-reducing diet, with or without exercise, in overweight men and women. N Engl J Med 325:461â466. Yanovski SZ, Reynolds JC, Boyle AJ, Yanovski JA. 1997. Resting metabolic rate in African-American and Caucasian girls. Obes Res 5:321â325. Zinker BA, Wilson RD, Wasserman DH. 1995. Interaction of decreased arterial PO 2 a nd exercise on carbohydrate metabolism in the dog. A m J Physiol 269:E409âE417. Zlotkin SH. 1996. A review of the Canadian âNutrition Recommendations Update: Dietary Fat and Children.â J Nutr 126:1022Sâ1027S. Zurlo F, Ferraro RT, Fontvieille AM, Rising R, Bogardus C, Ravussin E. 1992. Spon- taneous physical activity and obesity: Cross-sectional and longitudinal studies in Pima Indians. Am J Physiol 263:E296âE300.
