
1
The Epidemiology of Underage Drinking in the United States: An Overview
Robert L. Flewelling, Mallie J. Paschall, and Christopher Ringwalt*
Alcohol is by far the most widely used psychoactive substance in the United States. This is true for both adults and adolescents, even though the minimum legal age for drinking is 21 in all states. Underage drinking is a pressing public health and safety concern because of the high prevalence of this behavior and the correspondingly high costs it exacts, either directly or indirectly, in terms of lost lives, injury and disability, illness, damaged interpersonal relationships, and lost productivity. In addition, early involvement with drinking has been shown to increase the likelihood of alcohol-related problems as an adult (Grant and Dawson, 1997; Hingson, Heeren, Levenson, and Voas, 2002).
The purpose of this chapter is to provide an overview of what is known about the prevalence, patterns, and trends of underage drinking in this country from an epidemiological perspective. The information presented is based primarily on data that are available from large-scale national surveys that have been conducted regularly for many years. It also focuses on what might be considered fairly basic measures and patterns of alcohol use, and breakdowns in these measures according to standard demographic characteristics such as age, gender, and race/ethnicity. These demographic characteristics should not be viewed as the causes of observed differences in alcohol use patterns across subgroups. Rather, they serve as easily identified markers for subgroups of the population that may share relatively
similar experiences, accumulated over the life course, that help to shape alcohol-related attitudes, beliefs, and drinking behaviors.
Creditable information on the scope, demographic patterns, and trends in underage drinking behaviors provides an important empirical foundation in helping to justify and prioritize needs for policies and programmatic efforts to address this problem and reduce its negative public health consequences. Rigorous analysis of even more detailed epidemiologic data can also contribute to our understanding of the factors that influence this behavior and help suggest more specific strategies for preventing it.1 Because the purpose of this chapter is to provide a broad overview of underage drinking patterns and trends, rather than examine etiological factors, it does not include complex analyses that simultaneously involve or control for multiple variables. Research based on such strategies, however, will be cited in a number of the more substantively focused chapters in this volume in order to support particular perspectives on underage drinking and approaches for addressing the problem.
Underage Drinking: Measures and Data Sources
Measures of Alcohol Use
Since 1988, and as a direct consequence of the passage of the National Minimum Drinking Age Act in 1984, the minimum legal drinking age for every state in the nation has been 21. In this context, the term “underage drinking” refers to alcohol consumption by persons less than 21 years of age, and is the focus of this volume. Statistics presented in this chapter, therefore, focus primarily on persons under the age of 21. Furthermore, because there appears to be very little alcohol use by persons under the age of 12, and because surveillance data are generally not available for persons younger than 12 anyway, the age range of interest is further delimited by a lower bound of 12 years. Some of the information presented here, however, is based on somewhat different or more restricted age ranges because readily available epidemiological data do not always coincide precisely with this age range, or they pertain to only subsets within this range. Such circumstances are noted accordingly.
In attempting to quantify “drinking” behavior, whether with respect to an individual person or in aggregate, it is clear that no single measure or dimension can adequately capture all the meaningful attributes of this behavior. For example, both the amounts of alcohol consumed and the tem-
poral patterns of consumption within a specified time frame describe important aspects of underage drinking, or drinking by persons of any age for that matter, that are directly linked with the extent and seriousness of potential problems due to that behavior. A number of different measures, therefore, have been developed and are routinely used in epidemiologic surveys to measure patterns of alcohol use.
There are currently no universally accepted measures of alcohol use, and patterns of use, even among researchers. Even a standard dichotomous measure of lifetime use must deal with such methodologically vexing issues as whether and how to exclude alcohol used in religious services. More sophisticated measures of quantity and frequency of alcohol consumption are still confounded by variations in the alcohol content of different types of beverages, and differences in the sizes of standard drinks.
With these limitations in mind, the types of survey instrumentation used to assess alcohol consumption generally may be categorized as follows. “Frequency” measures ask the respondent to report typical drinking frequency over a specified reference period (e.g., a month or year); response categories vary, but may include options such as “never,” “once a month,” “once a week,” and “daily.” “Quantity/frequency” (QF) measures tap both drinking frequency and the average quantity of alcohol consumed on any given occasion, yielding a measure of the total amount of alcohol consumed. Frequency and QF measures may be obtained for alcohol use in general (i.e., any type or alcoholic beverage), or separate responses may be solicited for each specific type of beverage (e.g., beer, wine, hard liquor). “Graduated frequency” measures, a subset of QF, begin with a question concerning the greatest amount of alcohol consumed within a given referent period (and the number of occasions on which this amount of alcohol was consumed), then ask about the number of occasions on which each progressively smaller amount of alcohol was imbibed. Although there is evidence that such measures yield more accurate estimates of drinking patterns and the volume of alcohol consumed (Greenfield, 2000), the number of questions necessary limits the utility of this approach in large, multipurpose surveys. Two other types of alcohol consumption questions, which are less well suited for a survey format, include “short-term recall methods” in which respondents are asked to remember each drink consumed over a several-day period, and “diary methods,” in which participants record their alcohol consumption prospectively. In general, the more detailed the questions, the greater the estimates (Dufour, 1999).
Measures of “heavy” or “binge” drinking, concepts used by the Monitoring the Future (MTF) and National Household Survey on Drug Abuse (NHSDA) studies respectively, also vary in their specific definitions. Heavy or binge drinking is customarily defined as having five or more drinks on any one occasion during a specific period, although for women that number
is sometimes reduced to four or more drinks. More sophisticated still are measures that take into account the respondent’s body weight in calculating a ratio of consumption to mass. Generally speaking, however, the consumption rates and patterns that are employed by epidemiologists interested in surveillance, and reported here, are more straightforward. The simplest of these measures, including any use and “heavy use” in the respondent’s lifetime or the previous 30 days and the frequency of consumption within these periods, may be relatively crude but still are widely used due to their ease of measurement and straightforward interpretation.
Measures of Alcohol Abuse and Dependence
In addition to measures of drinking per se, such as frequency of use and quantity of alcohol consumed, another important dimension of drinking behavior is whether it causes significant problems for the user or is indicative of physiological dependency. Diagnostic criteria have been developed for assessing symptoms of alcohol dependence and various other problems stemming from alcohol use. Recent attempts to construct survey-based measures for these conditions have been based on criteria for alcohol dependence and abuse as stipulated in the Diagnostic Statistical Manual of Mental Disorders, Fourth Edition (DSM-IV, American Psychiatric Association [APA], 1994) for both clinical and general population studies. The DSM-IV includes four criteria for alcohol abuse and seven criteria for alcohol dependence, which are summarized in Table 1-1.
According to the DSM-IV, a person receives a diagnosis of alcohol abuse if he or she experiences at least one of the abuse criteria and does not meet the definition for dependence. A person receives a diagnosis of alcohol dependence if he or she meets at least three of the seven dependence criteria.
The NHSDA, which is sponsored by the Substance Abuse and Mental Health Services Administration (SAMHSA), has included questions to estimate alcohol dependence in the United States population age 12 and older since 1991. From 1991 to 1993, DSM-III-R dependence criteria (APA, 1987) were used, and DSM-IV dependence criteria (APA, 1994) have been used in subsequent years. An additional criterion of dependence for the NHSDA is that a person must have used alcohol on six or more days in the past year. In 2000, a number of changes were made to alcohol dependence questions to improve their reliability and validity (SAMHSA, 2002a). The revised dependence questions were generally more restrictive and less global than the ones used prior to 2000, and resulted in somewhat lower prevalence estimates of alcohol dependence in the U.S. population. Also in 2000, DSM-IV questions regarding alcohol abuse were included in the NHSDA for the first time. As with dependence, an additional criterion applied in the NHSDA is that a person must have used alcohol on six or
TABLE 1-1 Criteria for Alcohol Abuse and Dependence as Defined in the Diagnostic and Statistical Manual of Mental Disorders, Fourth Edition (DSM-IV)
|
Alcohol Use Disorder |
Brief Identifier of Symptom |
DSM-IV Definition |
|
Alcohol abuse |
Role impairment |
Frequent intoxication leading to failure to fulfill major role obligations (e.g., at school, work, or home) |
|
|
Hazardous use |
Recurrent use when it is physically hazardous (e.g., driving while intoxicated) |
|
|
Legal problems |
Recurrent alcohol-related legal problems |
|
|
Social problems |
Continued drinking despite knowledge of persistent or recurrent social or interpersonal problems caused by or exacerbated by alcohol use |
|
Alcohol dependence |
Tolerance |
Need to increase consumption by 50 percent or more to achieve the same effects; markedly reduced effects when drinking the same amount |
|
|
Withdrawal |
Signs of alcohol withdrawal; drinking to avoid or relieve withdrawal |
|
|
Using more or longer than intended |
Recurrent drinking of larger amounts or for a longer period of time than intended |
|
|
Quit/cut down |
Unsuccessful attempts or a persistent desire to quit or cut down on drinking |
|
|
Much time spent using alcohol |
Much time spent using, obtaining, or recovering from the effects of alcohol |
|
|
Reduced activities |
Important social or recreational activities given up or reduced in favor of alcohol use |
|
|
Psychological/physical problems |
Continued drinking despite knowledge of a recurrent or persistent psychological or physical problem caused or exacerbated by alcohol use |
|
SOURCE: Martin and Winters (1998). |
||
more days in the past year. Prevalence estimates for alcohol dependence and abuse in the underage drinking population (based on the 2000 NHSDA) are provided in a later section of this chapter.
Some concerns have been raised about the validity of survey-based self-report measures for assessing conditions such as alcohol abuse and dependence, especially among adolescents. For example, very low prevalence rates of certain alcohol abuse and dependence symptoms (e.g., legal problems, withdrawal symptoms) have been observed in both clinical and general population samples of adolescents and young adults (Martin and Winters,
1998; SAMHSA, 2002a), raising questions about (1) the appropriateness of using DSM-IV alcohol abuse and dependence criteria for underage youth, and (2) the most appropriate methodology for assessing alcohol use disorders in the underage population. In addition, drinking behaviors tend to be sporadic during the developmental period of adolescence and early adulthood, and most alcohol use disorders take years to develop. Moreover, some indicators of abuse such as driving after drinking may not be relevant for adolescents under the age of 16. Thus, DSM-IV criteria may be less reliable and valid indicators of abuse and dependence for youthful drinkers than adult drinkers.
Based on these considerations, it is suggested that the data provided in this chapter regarding alcohol abuse and dependence, which are derived from the 2000 NHSDA, be interpreted with caution, as they may not reflect the prevalence rates that would be obtained through clinical diagnoses. Even so, the survey questions have strong face validity as being indicative of problems stemming from alcohol use and symptoms of dependence. Studies to assess the reliability and validity of adolescent self-report measures of abuse and/or dependence generally have found such measures to be consistent with information obtained from parents, peers, and archival records (Martin and Winters, 1998).
One particular type of abusive drinking behavior is so directly and specifically linked with immediate negative consequences that it is often assessed and reported separately from other alcohol-related problems and conditions. This behavior is driving a motorized vehicle while under the influence of alcohol (DUI), and is captured through a single specific item in the NHSDA separate from the criterion items used to assess alcohol abuse. Although data on the consequences of this behavior, which can be measured in terms of DUI arrests and alcohol-related crashes and fatalities, are provided in Chapter 2, epidemiologic data on self-reported DUI are reported in this chapter along with the other measures of underage alcohol use already described.
Data Sources
A number of ongoing or recently conducted national surveys provide information on drinking behaviors of underage persons in the United States. Nationally representative surveys that are conducted on an annual or biannual basis, and that include persons under age 18 in their samples, include:
-
National Household Survey on Drug Abuse (NHSDA)
-
Monitoring the Future (MTF)
-
Youth Risk Behavioral Survey (YRBS)
The NHSDA target population includes all persons in the United States aged 12 and older except the homeless, active military, and those living in institutionalized group quarters such as jails or hospitals. Interviews are conducted in person and at the respondents’ place of residence. Since 1999, the mode of administration has been the computer-assisted interview (CAI), which includes the use of audio computer-assisted self-interview (ACASI) for all sections of the interview in which respondents are asked to provide information regarding sensitive behaviors.
MTF and YRBS are school-based surveys in which students comprise the target population (grades 8, 10, and 12 for MTF and grades 9 through 12 for YRBS). Information is provided by respondents through self-completion of optically scannable forms, usually in the classroom.
Estimates of the prevalence of alcohol use by adolescents based on the NHSDA have consistently been lower than those based on the MTF and YRBS. For example, the estimated prevalence of any alcohol use in the past month for twelfth-grade students as provided by the 2001 MTF is 50 percent, whereas the NHSDA-based estimate for twelfth-grade students is 40 percent. Somewhat larger proportional differences were obtained for eighth- and tenth-grade students (SAMHSA, 2002b, Table E.10). Although some degree of underreporting with the NHSDA is suspected due to the fact that the interviews are conducted in respondents’ homes, it is also possible that exaggeration of risky behaviors occurs in the classroom settings used for the school-based surveys. Even though there are differences in the absolute rates of alcohol use provided by household-based and school-based surveys, the demographic patterns of use and the trends across time in alcohol use measures have been remarkably consistent across the different surveys (Harrison, 2001).
The summary data provided in this chapter are based primarily on the NHSDA. This source was used because it covers the entire age range of “underage” persons (i.e., ages 12 to 20), thus allowing all analyses, including comparisons across age subgroups, to be based on the same survey. In addition, the NHSDA includes school-aged respondents who are not in school (or are home schooled). Findings from the MTF and YRBS, however, are used to augment those based on the NHSDA. Voluminous summary data for all three surveys, in both graphical and tabular form and including many more ways of breaking down the data than could be included in this chapter, are available from the sponsoring agencies for each of these surveys.
A number of other data sources that are national in scope also provide information on drinking behaviors of underage persons (or various subsets thereof), but do not meet the specific criteria used in identifying the three survey data sources just described. For example, a large school-based sur-
vey of students in grades 6 through 12 is conducted annually by the Parents’ Resource Institute for Drug Education (PRIDE). Although the PRIDE survey does not employ a stratified national sampling design, its size and extensive coverage in many states produce overall estimates that are typically close to the national estimates based on the MTF.
The National Alcohol Survey and the National Longitudinal Alcohol Epidemiologic Survey both provide detailed information on drinking behaviors and patterns among adults aged 18 and older, and thus cover at least a portion of the “underage” population. In addition, three different national surveys are (or have recently been) conducted with college students: the College Alcohol Study conducted by the Harvard School of Public Health, the Core Institute Survey conducted by Southern Illinois University, and the National College Health Risk Behavior Survey conducted by the Centers for Disease Control and Prevention. Although data from these surveys are not incorporated into the findings presented in this chapter, they are sources for detailed information on drinking behavior of specific segments of the underage population.
Prevalence of Underage Drinking Behaviors and Patterns in the United States2
Age, Race/Ethnicity, and Gender Differences in Past-Month Alcohol Use
Even before they reach the age of 21, the majority of persons in the United States have consumed an alcoholic beverage at least once in their lifetime. In fact, the majority of 20-year-olds report consuming alcohol in the past month, and thus may be categorized as “current” users. As would be expected, the estimated prevalence of current use based on the 2000 NHSDA increases steadily with age, from ages 12 to 20 (see Figure 1-1). Although not shown in the figure, the highest prevalence of past-month drinking for any age occurs at age 21 (65.2 percent in 2000), the age at which alcohol use becomes legal.
Also shown in Figure 1-1 are estimated prevalence rates based on the 2000 NHSDA, by single year of age, for heavy drinking, and for frequent
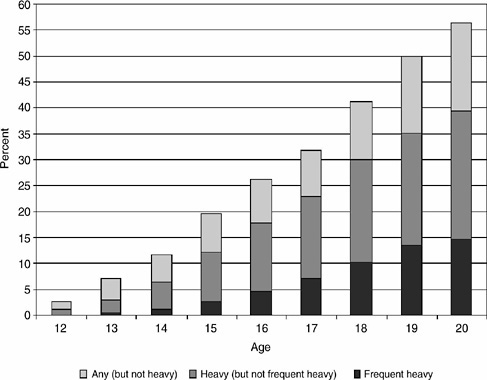
FIGURE 1-1 Prevalence of any use, heavy use, and frequent heavy use of alcohol in the past 30 days, by single years of age, 2000.
SOURCE: National Household Survey on Drug Abuse (Analysis of Public Use File Data) (2000).
heavy drinking. Heavy drinking is defined here as reporting having five or more drinks on the same occasion in the past 30 days, and frequent heavy drinking as having five or more drinks (on the same occasion) on each of five or more days in the past 30 days.3 The prevalence rates depicted in the figure are provided in tabular form in Table 1-2. This table also includes the prevalence rates for frequent drinking in the past month, defined as having used any amount of alcohol on six or more days within the past thirty days.
TABLE 1-2 Prevalence of Any Use, Heavy Use, Frequent Use, and Frequent Heavy Use of Alcohol in the Past 30 Days, by Single Years of Age, 2000
|
|
Percentage Reporting Alcohol Use in Past 30 Days |
|||
|
Age |
Any |
Heavy |
Frequent |
Frequent Heavy |
|
12 |
2.5 |
1.1 |
0.2 |
0.1 |
|
13 |
7.1 |
3.0 |
0.9 |
0.3 |
|
14 |
11.5 |
6.3 |
2.0 |
1.2 |
|
15 |
19.7 |
12.1 |
3.6 |
2.6 |
|
16 |
26.3 |
17.7 |
6.7 |
4.7 |
|
17 |
31.9 |
22.9 |
10.5 |
7.1 |
|
18 |
41.2 |
30.1 |
14.3 |
10.2 |
|
19 |
50.0 |
35.1 |
20.3 |
13.5 |
|
20 |
56.6 |
39.4 |
22.3 |
14.6 |
|
SOURCE: National Household Survey on Drug Abuse (Analysis of Public Use File Data) (2000). |
||||
Immediately apparent in the data provided in Figure 1-1 and Table 1-2 is the steady increase in the prevalence of all four drinking behaviors with age. Relatively few (2.5 percent) 12-year-olds reported any alcohol use in the past month. That rate is nearly three times higher (7.1 percent) for 13-year-olds and continues to increase dramatically with each successive year. The same general pattern is evident for the other three drinking measures as well.
What is also very striking, and troubling, about Figure 1-1 is the high proportion of drinkers who are also heavy drinkers. By age 14, more than half of those who reported using any alcohol in the past month also reported that they had five or more drinks on a single occasion in the same 30-day period. The proportion of drinkers who drink heavily continues to increase with age, so that by ages 19 and 20, more than 70 percent of all drinkers are also classified as heavy drinkers. This is one of the most distinguishing patterns of underage drinking when compared to drinking patterns of adults. By age 22 (not shown in figure), the ratio of heavy drinkers to all drinkers is already starting to decrease with age, and in general, adults who drink alcohol are much less likely to be heavy drinkers than are drinkers in middle to late adolescence.
Another striking pattern evident in Table 1-2 is the relatively low prevalence of frequent drinking (i.e., drinking alcohol on six or more of the past 30 days) in comparison to the prevalence of heavy drinking. As a rule, underage drinkers are not frequent drinkers, but when they do drink, they tend to drink large amounts. Of those who are frequent drinkers, most tend to also be frequent heavy drinkers.
Significant differences in the prevalence of underage drinking across racial/ethnic groups have been observed for decades and continue to persist. Prevalence rates based on the 2000 NHSDA for any use in the past month by persons ages 12 to 20, along with rates for heavy, frequent, and frequent heavy use, broken down by major categories of race/ethnicity, are shown in Table 1-3. For all for behaviors, the prevalence rates are highest among non-Hispanic whites, followed closely by Native Americans (including Alaskan Natives). The prevalence rates for African-Americans and Asians are substantially lower than those for whites and Native Americans, while rates for Hispanics and persons reporting multiple racial/ethnic backgrounds fall about halfway between the lowest and highest values. Although the sample size for Pacific Islanders is small, it is still noteworthy that although their rates of any use and heavy use are also relatively moderate, their rates of frequent use and frequent heavy use are much closer to the relatively high values observed for whites.
Due to sample size limitations, finer breakdowns by age groups and gender within the underage population are only possible for the three major racial/ethnic groups: non-Hispanic whites, non-Hispanic African-Americans, and Hispanics. Prevalence rates for any alcohol use in the past month, by these three race/ethnicity categories, are displayed for subgroupings based on age and gender in Figure 1-2. Similar data for heavy use of alcohol are displayed in Figure 1-3. These data are repeated in tabular form, along with prevalence rates for frequent drinking and frequent heavy drinking, in Table 1-4.
The figures and table clearly show that the overall age effects described previously remain strong and consistent even when broken out by racial/ ethnic group and gender. They also indicate that the relative prevalence
TABLE 1-3 Prevalence of Any Use, Heavy Use, Frequent Use, and Frequent Heavy Use of Alcohol in the Past 30 Days, Persons Ages 12 to 20, by Race/Ethnicity, 2000
|
|
Percentage Reporting Alcohol Use in Past 30 Days |
|||
|
Race/Ethnicity |
Any |
Heavy |
Frequent |
Frequent Heavy |
|
White |
30.8 |
21.5 |
10.8 |
7.5 |
|
African-American |
18.2 |
10.2 |
4.9 |
2.1 |
|
Native American |
28.9 |
20.5 |
10.5 |
5.6 |
|
Pacific Islander |
23.3 |
15.5 |
8.6 |
7.0 |
|
Asian |
14.0 |
8.1 |
2.4 |
1.6 |
|
Multiple races |
25.1 |
16.8 |
6.6 |
4.6 |
|
Hispanic |
24.6 |
16.9 |
6.5 |
4.5 |
|
SOURCE: National Household Survey on Drug Abuse (Analysis of Public Use File Data) (2000). |
||||
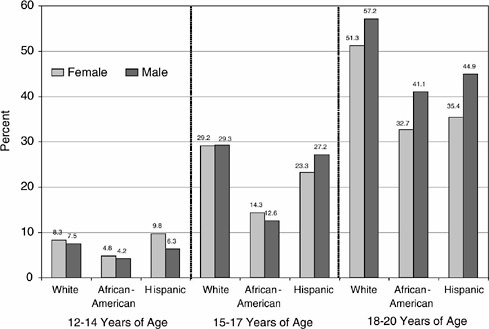
FIGURE 1-2 Prevalence of any use of alcohol in the past 30 days, persons aged 12 to 20, by gender, race/ethnicity, and age group, 2000.
SOURCE: National Household Survey on Drug Abuse (Analysis of Public Use File Data) (2000).
levels across racial/ethnic subgroups observed in the aggregate generally persist when broken down by age group and gender. That is, even within most age group and gender combinations, whites consistently have the highest rates of use and African-Americans the lowest. One exception is for females in the youngest age group, where Hispanic girls have as high or higher rates than white girls on all of the drinking measures. Conversely, Hispanic females ages 18 to 20 have the lowest rates of frequent alcohol use, even lower than the rate for African-American females in this age range.
For comparison purposes, Table 1-4 also shows the prevalence rates of each drinking behavior for young adults who are of legal age, that is, ages 21 through 25. The data for this age group indicate that the prevalence of any past-month use continues to increase with age into young adulthood. This is true for all three racial/ethnic groups, for both females and males. For heavy and frequent drinking, however, meaningfully higher rates in the 21- to 25-year age group, as compared to persons ages 18 to 20, are observed only among males. For frequent heavy drinking, this pattern of higher prevalence rates in young adulthood is seen only for African-Ameri-
can males. Also, although whites continue to have the highest prevalence rates for all measures in this age group, the rates of use among African-Americans are as high as or higher than those for Hispanics. Although not shown in these analyses, it is noteworthy that the racial/ethnic differences in heavy use among underaged persons and young adults reported here do not generalize to older age groups. Among persons aged 35 and older, data from the 2000 NHSDA show that Hispanics have the highest prevalence rates of heavy use (20 percent), followed by African-Americans (17 percent) and whites (16 percent).
Other Characteristics of Underage Drinking Behavior
The information provided in the preceding section pertains to the consumption of alcoholic beverages of any type. The NHSDA does not ask about specific types of alcoholic beverages, but this information is collected annually from a subsample of seniors in the MTF study. Prevalence rates based on the 2000 MTF (Bachman, Johnston, and O’Malley, 2001) for any use of beer, wine coolers, wine, and hard liquor in the past 30 days by high
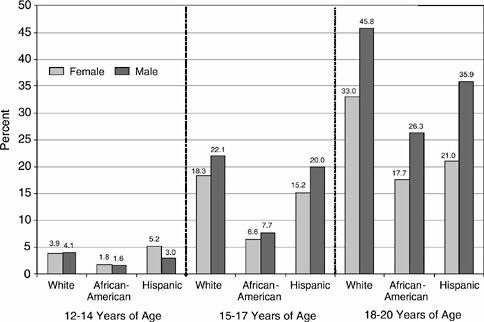
FIGURE 1-3 Prevalence of heavy use of alcohol in the past 30 days, persons aged 12 to 20, by gender, race/ethnicity, and age group, 2000.
SOURCE: National Household Survey on Drug Abuse (Analysis of Public Use File Data) (2000).
TABLE 1-4 Prevalence of Any Use, Heavy Use, Frequent Use, and Frequent Heavy Use of Alcohol in the Past 30 Days, Persons Ages 12 to 25, by Gender, Race/Ethnicity, and Age Group, 2000
|
|
Percentage Reporting Alcohol Use in Past 30 Days |
|||||||
|
|
Any Use |
Heavy |
Frequent |
Heavy Frequent |
||||
|
Age, Race/Ethnicity |
Female |
Male |
Female |
Male |
Female |
Male |
Female |
Male |
|
Ages 12-14 |
||||||||
|
White |
8.3 |
7.5 |
3.9 |
4.1 |
1.2 |
1.4 |
0.5 |
0.6 |
|
African-American |
4.8 |
4.2 |
1.8 |
1.6 |
0.5 |
0.4 |
0.1 |
0.5 |
|
Hispanic |
9.8 |
6.3 |
5.2 |
3.0 |
1.2 |
0.9 |
0.8 |
0.7 |
|
Ages 15-17 |
||||||||
|
White |
29.2 |
29.3 |
18.3 |
22.1 |
7.3 |
8.5 |
4.6 |
6.8 |
|
African-American |
14.3 |
12.6 |
6.6 |
7.7 |
2.6 |
3.4 |
0.7 |
2.2 |
|
Hispanic |
23.3 |
27.2 |
15.2 |
20.0 |
5.1 |
8.2 |
3.5 |
5.7 |
|
Ages 18-20 |
||||||||
|
White |
51.3 |
57.2 |
33.0 |
45.8 |
18.1 |
26.9 |
10.3 |
21.1 |
|
African-American |
32.7 |
41.1 |
17.7 |
26.3 |
8.9 |
14.1 |
2.6 |
6.6 |
|
Hispanic |
35.4 |
44.9 |
21.0 |
35.9 |
6.9 |
15.9 |
4.6 |
11.4 |
|
Ages 21-25 |
||||||||
|
White |
64.8 |
75.7 |
34.6 |
57.3 |
20.7 |
40.2 |
9.0 |
23.5 |
|
African-American |
40.3 |
57.6 |
17.5 |
35.5 |
10.7 |
24.0 |
3.4 |
9.8 |
|
Hispanic |
38.0 |
55.9 |
22.0 |
44.9 |
7.3 |
19.7 |
3.6 |
10.8 |
|
SOURCE: National Household Survey on Drug Abuse (Analysis of Public Use File Data) (2000). |
||||||||
school seniors, broken out by gender, are provided in Figure 1-4. For both females and males, beer and hard liquor are consumed by substantially higher percentages of seniors than are wine coolers and wine. For females, in fact, the use of hard liquor is nearly as prevalent as the use of beer. Although males have higher rates of past-month beer and hard liquor use, rates for use of wine coolers and wine are approximately the same for females and males.
A fairly similar pattern is seen when heavy drinking within the past two weeks is examined for each of these four beverage types (Figure 1-5). Especially noteworthy are differences across the beverage types in the relative proportions of drinkers who are also heavy drinkers (as indicated by comparing the prevalence rates shown in Figure 1-5 with those in Figure 1-4). Most beer drinkers and hard liquor drinkers also tend to be heavy drinkers of those beverages, especially among males. This tendency to drink heavily if at all is not as strong in the case of wine and wine coolers.
The annual PRIDE survey also asks about specific types of alcoholic
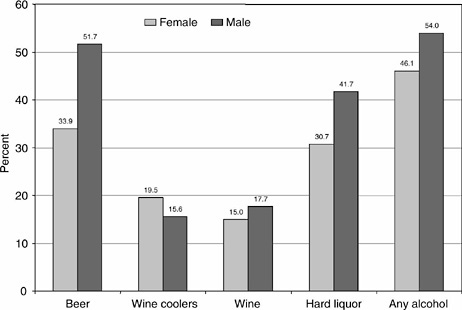
FIGURE 1-4 Prevalence of any use of beer, wine coolers, wine, and hard liquor in the past 30 days, high school seniors, by gender.
SOURCE: Bachman et al. (2001).
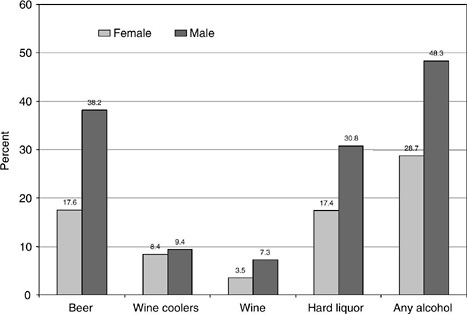
FIGURE 1-5 Prevalence of having five or more drinks of beer, wine coolers, wine, and hard liquor in a row during the past two weeks, high school seniors, by gender.
SOURCE: Bachman et al. (2001).
beverages consumed (i.e., beer, wine coolers, and hard liquor), and collects these data from students in grades six through twelve. As might be expected, the 2001-2002 PRIDE data (PRIDE, 2002) show that consumption of hard liquor in the past year by students in the lower grades (seven through nine) is much less prevalent than the consumption of beer and wine coolers. By the upper grades, however, prevalence rates for hard liquor consumption are similar to those for beer and wine coolers. The data also show a strong association between grade level and perceived ease of obtaining alcoholic beverages. By the twelfth grade, a substantial majority of students report that it would be very easy or fairly easy to obtain beer (79 percent) and hard liquor (75 percent).
The MTF also collects information about the setting and the reasons for alcohol use among high school seniors that is useful in further describing and understanding underage drinking. By far the most common setting for alcohol consumption by high school seniors is at parties—based on the 2000 survey, 57 percent of seniors reported that when they consumed alcohol in the past year, most or all of these times were at parties. The next most common settings were with one or two other people (18.4 percent reporting most or all of the times) and with a date or spouse (15.8 percent reporting most or all of the times). Drinking rarely occurred at school, as just over 90 percent of seniors who used alcohol in the past year also said they never did so at school. Drinking alone was also relatively uncommon, with 76 percent of past-year drinkers reporting that they never drank alone.
Important reasons for drinking as reported by high school seniors likewise convey the strong social aspects and functions of this behavior. The important reason most often given by seniors was “to have a good time with my friends” (74 percent). Other reasons given by a substantial percentage of seniors (between 40 and 50 percent) dealt with a desire to experiment, to relax, and to feel good. A little further down the list of reasons was because alcoholic beverages taste good (38 percent). Only 1.6 percent of seniors (2.5 percent of males and 0.4 percent of females) mentioned that an important reason for their drinking was because they were “hooked” and felt that they had to drink.
Finally, it is instructive to examine the percentage of seniors who indicated that they usually get moderately high or very high when they consume alcohol. Just over half of the seniors responded in this manner (56 percent of males and 46 percent of females). These figures are consistent with the relatively high rates of heavy drinking seen among underage persons who drink alcohol. They also suggest that even though underage alcohol consumption is primarily a social activity intended to facilitate having a good time, many seniors believe that heavy consumption, or getting drunk, is necessary or desirable for this purpose.
Prevalence of Alcohol Abuse, Dependence, and DUI Among Underage Persons in the United States
As was the case with measures of alcohol consumption, rates of underage alcohol abuse and dependence are also very age dependent. As shown in Figure 1-6, both abuse and dependence are extremely rare among 12-yearolds, but the prevalence rates increase rapidly with age. According to the DSM-IV-based criterion used in the 2000 NHSDA, roughly 5 percent of persons in their late adolescence (i.e., 19 or 20 years old) were categorized as being alcohol dependent, and twice that many (i.e., another 10 percent) reported abusive patterns of alcohol use. This ratio generally holds for all ages in the 12- to 20-year age range. As discussed earlier in this chapter, these prevalence rates may not reflect the prevalence of clinically detectable cases of alcohol abuse and dependence.
Looking across all ages, including ages 21 and older, the highest rate for alcohol abuse occurs among persons who are 19 years old. The peak age for alcohol dependence is somewhat later, at age 22. The relatively low ages for peak alcohol abuse may be due in part to the greater likelihood of alcohol-related legal problems for underage drinkers because of the illegality of their behavior.
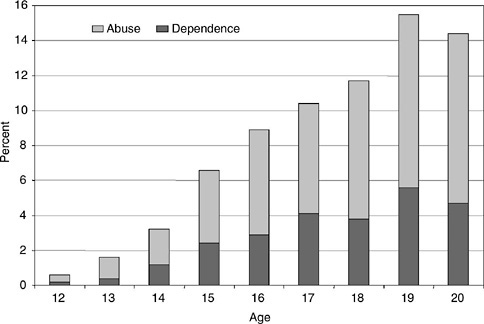
FIGURE 1-6 Prevalence of abuse and dependence, by single years of age, 2000.
SOURCE: National Household Survey on Drug Abuse (Analysis of Public Use File Data) (2000).
For nearly all ages, the rate of abuse or dependence lies somewhere between the rate for heavy drinking and frequent heavy drinking. As age increases, however, the abuse/dependence rate shifts toward the frequent heavy drinking rate, so that by age 20 these two rates are virtually the same.
With a couple of notable exceptions, the patterns in prevalence rates for alcohol abuse and dependence across racial/ethnic groups (Table 1-5) mirror those observed for heavy and frequent heavy drinking as summarized in Table 1-3. In the case of abuse and dependence, however, the rates for Native Americans are the highest of any group. The rates for persons of multiple races are also relatively higher than they were for measures of use, and very comparable to those observed for whites. Also of interest are the low rates of abuse and dependence observed for Pacific Islanders, which are comparable to those for African-Americans and Asians, even though their rates of heavy and frequent heavy use are relatively high.
Age- and gender-related patterns of alcohol abuse or dependence across the three major racial/ethnic groups are depicted in Figure 1-7. The data reveal that for all three racial/ethnic groups, alcohol abuse or dependence becomes progressively more prevalent among males than females as age increases. In fact, females in the 12- to 14-year age group have even slightly higher rates than males, although the rates in general for this young age group are extremely low. The data also show that for the oldest age category, in particular, the relative difference in the prevalence rates for abuse or dependence between African-Americans and whites are considerably smaller than for heavy and frequent heavy drinking. Additional data from persons older than 20 show that this pattern of convergence continues, resulting in similar rates of alcohol abuse and dependence for whites and African-Americans aged 26 and older.
According to the 2000 NHSDA, approximately 15 percent of persons 16 to 20 years old drove a vehicle in the past year while under the influence
TABLE 1-5 Prevalence of Alcohol Abuse and Dependence, Persons Ages 12 to 20, by Race/Ethnicity, 2000
|
Race/Ethnicity |
Abuse |
Dependence |
Abuse or Dependence |
|
White |
6.0 |
3.2 |
9.1 |
|
African-American |
3.3 |
1.7 |
5.0 |
|
Native American |
7.5 |
4.1 |
11.6 |
|
Pacific Islander |
4.2 |
1.6 |
5.8 |
|
Asian |
2.4 |
2.2 |
4.6 |
|
Multiple races |
6.3 |
2.9 |
9.2 |
|
Hispanic |
4.6 |
2.5 |
7.0 |
|
SOURCE: National Household Survey on Drug Abuse (Analysis of Public Use File Data) (2000). |
|||
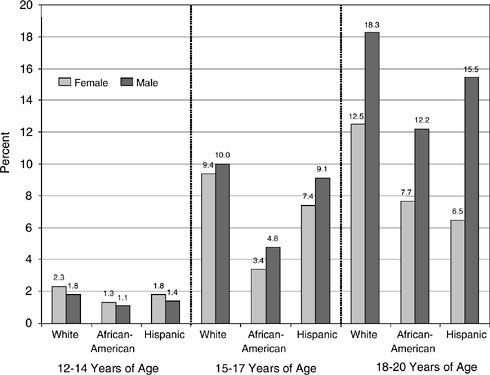
FIGURE 1-7 Prevalence of alcohol abuse or dependence, persons aged 12 to 20, by gender, race/ethnicity, and age group, 2000.
SOURCE: National Household Survey on Drug Abuse (Analysis of Public Use File Data) (2000).
of alcohol. Patterns for this behavior, differentiated by major racial/ethnic groupings, age group, and gender, are shown in Figure 1-8. The patterns are similar to those observed for measures of alcohol abuse or dependence. Most prominent are the strong association of DUI with age; the relative rates of DUI (from highest to lowest) among whites, Hispanics, and African-Americans; and the more pronounced gender differences (higher rates for males) observed for Hispanics and African-Americans than for whites.
Sociodemographic Characteristics Associated with Alcohol Use, Abuse, and Dependence
In addition to age, gender, and race/ethnicity, a number of other sociodemographic characteristics may be useful for helping to identify subgroups of the underage population at greatest risk for alcohol misuse. Even these additional characteristics, however, only begin to scratch the surface with
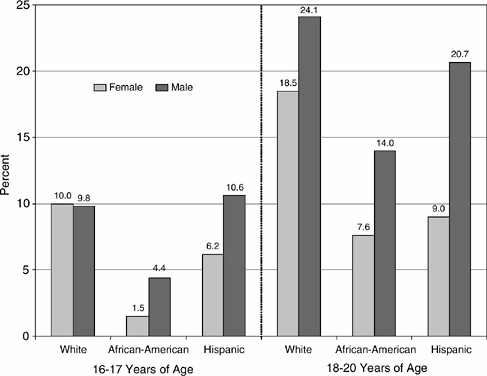
FIGURE 1-8 Prevalence of driving while under the influence of alcohol in the past year, persons aged 16 to 20, by gender, race/ethnicity, and age group, 2000.
SOURCE: National Household Survey on Drug Abuse (Analysis of Public Use File Data) (2000).
respect to identifying variables that are associated with underage drinking, and they may be less strongly associated than others based on psychosocial attributes such as attitudes, social relationships, and both learned and innate behavioral tendencies. Nevertheless, basic demographic variables can be useful in identifying relatively intact segments of the population that can be prioritized and targeted for tailored interventions, and can also help to suggest some of the underlying mechanisms that might contribute to greater levels of alcohol misuse in selected subpopulations.
Slightly different sets of sociodemographic characteristics are pertinent to (and available in the NHSDA for) youth ages 12 to 17 and young adults ages 18 to 20. For this reason, separate tables are used to display prevalence rates, by each characteristic, for these two age groups. Table 1-6 presents prevalence rates for any alcohol use, heavy use, and abuse or dependence, by each of six sociodemographic variables, for persons ages 12 to 17.
Very generally, the data presented in the table suggest that each of the following attributes is related to higher levels of alcohol use, heavy use, and abuse/dependence among persons under age 18:
-
Higher levels of family income
-
Not living in a two-parent household
-
Moving during the past year
-
Living in smaller areas or areas not in a Metropolitan Statistical Area (MSA)
-
Dropping out of school
-
Working more than 11 hours per week
TABLE 1-6 Prevalence of Any and Heavy Alcohol Use in the Past 30 Days, and Alcohol Abuse or Dependence, Among Persons Ages 12 to 17, by Selected Demographic Variables
|
|
Any Use |
Heavy Use |
Abuse or Dependence |
|
Family income |
|||
|
Low |
13.7 |
8.9 |
4.6 |
|
Medium |
16.3 |
10.5 |
5.4 |
|
High |
18.5 |
11.5 |
5.1 |
|
Family structure |
|||
|
Two parents in home |
15.2 |
9.4 |
4.4 |
|
Other |
19.2 |
12.9 |
7.1 |
|
Number of moves in past year |
|||
|
None |
15.8 |
9.9 |
4.8 |
|
One |
17.3 |
11.2 |
5.7 |
|
Two or more |
20.7 |
14.8 |
8.1 |
|
Metropolitan status Large Metropolitan |
|||
|
Statistical Area (MSA) |
15.9 |
9.9 |
4.5 |
|
Small MSA |
16.7 |
10.5 |
5.4 |
|
Not in MSA |
16.8 |
11.4 |
6.1 |
|
School drop-out status (ages 16 and 17 only) |
|||
|
In school |
28.4 |
19.5 |
9.5 |
|
Dropped out |
36.7 |
31.4 |
14.6 |
|
Hours worked per week (ages 16 and 17 only) |
|||
|
None |
26.7 |
18.2 |
8.4 |
|
1 to 10 |
27.5 |
19.5 |
9.9 |
|
11 to 20 |
33.4 |
23.4 |
11.2 |
|
More than 20 |
33.4 |
25.0 |
12.3 |
|
SOURCE: National Household Survey on Drug Abuse (Analysis of Public Use File Data) (2000). |
|||
Although the overall patterns of relationship were fairly consistent across the different measures of use, some of these attributes tended to be more highly associated with any use (e.g., family income), while others showed relatively stronger associations with abuse/dependence (e.g., metropolitan status). Although some relationships were stronger than others, none of the characteristics examined exhibited exceptionally strong associations with drinking behavior. In other words, there is considerable variation in alcohol use behaviors that cannot be explained by these sociodemographic characteristics. Rather, underage drinking is pervasive across sociodemographically defined subgroups, even though some variation exists. In contrast, there is some research evidence showing that the rates of adolescent use of alcohol and other substances do vary widely according to other sociodemographic variables, such as school catchment area (Ennett, Flewelling, Lindrooth, and Norton, 1997).
One characteristic not included in Table 1-6 is region of the country (this variable was not available in the NHSDA Public Use File). Published findings from the 2000 NHSDA, however, do include alcohol use prevalence rates by region. Summary data for persons ages 12 to 17 show that both any use and heavy use of alcohol are more prevalent in the Northeast and Midwest regions of the country compared to the South and West. The same was true for persons ages 18 to 25. This pattern is consistent with recent findings from Monitoring the Future, and reflects regional differences in alcohol use patterns that have been evident for the past two decades.
When comparing and interpreting patterns of use across sociodemographic subgroups, it is important to keep in mind that other related but unmeasured factors could be largely responsible for subgroup differences observed. The data on the number of hours worked per week provide an example. Studies conducted with national samples of adolescents suggest that the relationship between level of employment (or work intensity) and heavy drinking in adolescence is largely attributable to demographic characteristics (e.g., age, race/ethnicity), level of disposable income, and prior alcohol use (Paschall and Flewelling, 2002; Paschall, Ringwalt, and Flewelling, 2002). Although the narrowly constrained age range used for the summary data displayed in Table 1-6 is expected to remove much of the influence due to age, the associations depicted in that table do not control for the effects of other factors such as race/ethnicity, personal income, and prior levels of alcohol use.
Prevalence rates for alcohol use measures among persons 18 to 20 years old, by selected sociodemographic variables, are displayed in Table 1-7. Among this set of attributes, those that were generally related to higher levels of use, heavy use, and abuse/dependence were
TABLE 1-7 Prevalence of Any and Heavy Alcohol Use in the Past 30 Days, and Alcohol Abuse or Dependence, Among Persons Ages 18 to 20, by Selected Demographic Variables
|
|
Any Use |
Heavy Use |
Abuse or Dependency |
|
Marital status |
|||
|
Married |
36.8 |
21.7 |
5.1 |
|
Not married |
49.7 |
35.4 |
14.3 |
|
Pregnancy status (women only) |
|||
|
Pregnant |
8.6 |
6.8 |
8.1 |
|
Not pregnant |
47.7 |
29.5 |
10.8 |
|
Number of moves in past year |
|||
|
None |
45.4 |
31.4 |
11.9 |
|
One |
51.5 |
37.4 |
14.5 |
|
Two or more |
57.9 |
42.3 |
19.5 |
|
Metropolitan status |
|||
|
Large Metropolitan Statistical Area (MSA) |
48.0 |
31.7 |
12.3 |
|
Small MSA |
50.9 |
38.1 |
14.5 |
|
Not in MSA |
47.6 |
34.6 |
15.3 |
|
College student status (excluding persons still in high school) |
|||
|
Full time college student |
56.5 |
39.4 |
15.0 |
|
Part time student or not in college |
47.4 |
34.3 |
14.5 |
|
Employment status |
|||
|
Full-time |
51.9 |
36.2 |
14.6 |
|
Part-time |
50.3 |
35.1 |
13.7 |
|
Unemployed |
51.1 |
41.3 |
22.9 |
|
Not working and not in labor force |
42.5 |
30.5 |
10.6 |
|
SOURCE: National Household Survey on Drug Abuse (Analysis of Public Use File Data) (2000). |
|||
-
being single,
-
not being pregnant (assessed only for women),
-
moving during the past year, and
-
being a full-time college student.
In addition, persons residing in small metropolitan areas had the highest rates of heavy use, while persons from non-MSA areas had the highest rates of abuse or dependence. These differences, however, were relatively small. Unemployed persons were more likely to report heavy use of alcohol or symptoms of abuse/dependence, but their rates of any use were similar to those who are employed.
The strength of association for marital status varied substantially according to the alcohol use measure. Although unmarried persons were somewhat more likely to use any alcohol than married persons (50 percent compared to 37 percent), the proportionate differences were much greater for heavy use (35 percent versus 22 percent) and especially for abuse/dependence (14 percent versus 5 percent). Conversely, greater rates of any and heavy use were observed among full-time college students compared to others, but the rates for abuse or dependence were similar between these two groups. Although other studies have also documented a higher prevalence of young adult heavy drinking among college students (e.g., Bachman et al., 2002), it has been noted that this relationship is quite strong for white young adults, but does not hold at all for African-Americans (Paschall and Flewelling, 2002).
Understandably, the greatest difference across all the sociodemographic measures was for pregnancy status. Nearly 48 percent of nonpregnant women ages 18 to 20 reported using alcohol in the past month, compared to only 9 percent of pregnant women. This encouraging finding is tempered by the finding that the majority of pregnant women who did use alcohol tended to also report heavy use. The relatively high rate of abuse/dependence among pregnant women is also troubling, although it could be due to in part to a greater tendency by these respondents to report their alcohol use as problematic (and thus meet the criteria for abuse) precisely because they are pregnant.
Recent Trends in Underage Drinking
Examination of recent trends in underage drinking prevalence rates may be useful for helping to anticipate where these rates are headed in upcoming years. Just as important, trend data are valuable for retrospectively reviewing the relative levels of this behavior over time and thus providing a foundation for identifying and/or exploring hypotheses about societal influences on levels of underage drinking. The potential utility of such efforts can be further enhanced if significant differences in trends are observed for identifiable subgroups of the population.
Published estimates of the prevalence of any use and heavy use of alcohol in the past month since 1985 are available from the NHSDA for the age groups 12 to 17 and 18 to 25. Figure 1-9 displays these trends for any alcohol use. The dashed lines between 1985 and 1988, and again between 1988 and 1990, reflect interpolated values for intervening years in which no surveys were conducted. The break in the trend lines between 1998 and 1999 reflect changes in survey methodology that make the estimates for years starting with 1999 not strictly comparable with estimates for the previous years. In 1999, the NHSDA switched to a computer-assisted inter-
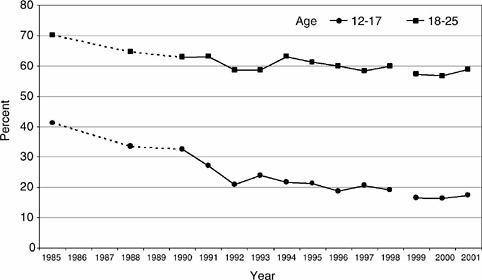
FIGURE 1-9 Trends in the prevalence of any alcohol use in the past 30 days, by age group, 1985 to 2001.
SOURCE: National Household Survey on Drug Abuse (2001) and prior years (published data).
view format that involved changes in the questionnaire structure and imputation procedures, in addition to affording respondents greater privacy. Studies conducted by SAMHSA to compare prevalence levels in heavy drinking (and other key measures of substance use) found no difference in the prevalence rates for any use or heavy use between 1998 and 1999 for any age group when controlling for differences in methodological features, including interviewer experience of the survey administration (SAMHSA, 2000).
Prevalence rates of underage drinking as determined by the NHSDA have not changed appreciably over the past ten years, even though a slight but statistically significant increase in any use for both age groups was observed between 2000 and 2001 (SAMHSA, 2002b, Chapter 3). Relatively stable trends in any use of alcohol in the past month among students over the past eight years were also seen in the MTF (grades eight, ten, and twelve) and YRBS (grades nine through twelve) surveys, although there were slight variations across individual grade levels. Figure 1-9 also depicts the more substantial declines in past-month use of alcohol, especially for persons ages 12 to 17, that occurred between 1985 and 1992. This decline continued a trend that began in the late 1970s, when the use of alcohol and many other substances reached their peaks. The MTF observed similar
dramatic declines for high school seniors. Although the declines in adolescent and young adult rates of alcohol use during this time period began prior to the National Minimum Drinking Age Act in 1984 that led to all states adopting age 21 as the minimum legal drinking age, the largest drops were observed in the years following passage of this legislation.
Trends for heavy use of alcohol in the past month, again based on published data from the NHSDA, are provided in Figure 1-10. The patterns are similar to what was found for any use in the past month, although the decline in heavy use for those ages 18 to 25 was less pronounced. As with Figure 1-9, the rates before and after 1999 are not strictly comparable, with the large apparent increase between 1998 and 1999 being due primarily to methodological changes in the survey administration and imputation procedures rather than to any actual increases in prevalence. Assuming that these changes have enhanced the accuracy of the survey estimates, it appears that the NHSDA-derived prevalence rates of heavy drinking prior to 1999 may have been slightly underestimated.
By analyzing NHSDA Public Use Files from recent years, it was also
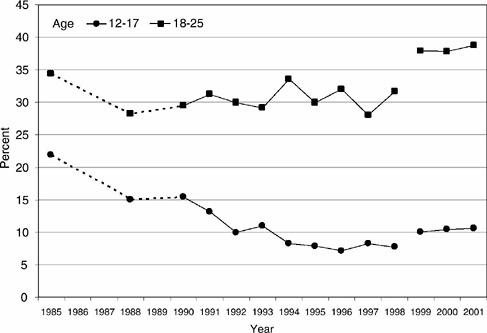
FIGURE 1-10 Trends in the prevalence of heavy alcohol use in the past 30 days, by age group, 1985 to 2001.
SOURCE: National Household Survey on Drug Abuse (2001) and prior years (published data).
possible to generate separate trend estimates from 1994 to 2000 for the 18-to 20-year age group and the 21- to 25-year group. Trends for any past-month use of alcohol are shown in Figure 1-11, and trends for heavy drinking prevalence are provided in Figure 1-12. The figures indicate that the recent trends for these two age groups are roughly parallel and reflect the same overall and relatively flat trends in any use and heavy use of alcohol that already have been noted. Figure 1-12 also visually portrays the very similar rates of heavy alcohol use among underage young adults (ages 18 to 20) with those of legal-aged young adults (ages 21 to 25).
The lack of any definitive trend in these measures of underage drinking in recent years is not particularly encouraging for those looking for progress in this area, and presents a formidable challenge for achieving national goals to reduce underage drinking as outlined in the Centers for Disease Control and Prevention’s Healthy People 2010 (U.S. Department of Health and Human Services, 2000). Trend data for underage DUI presented by O’Malley and Johnston (1999) present a similarly disturbing scenario, especially when viewed in contrast to the dramatic reductions in DUI rates seen in the 1980s and early 1990s. Furthermore, data from the 1995 and 2000 National Alcohol Surveys suggest that among individuals ages 18 to
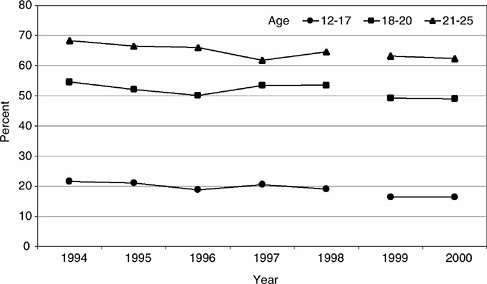
FIGURE 1-11 Trends in the prevalence of any alcohol use in the past 30 days, by finer age groups, 1994 to 2000.
SOURCE: National Household Survey on Drug Abuse (Analysis of Public Use File Data) (1994 to 2000).
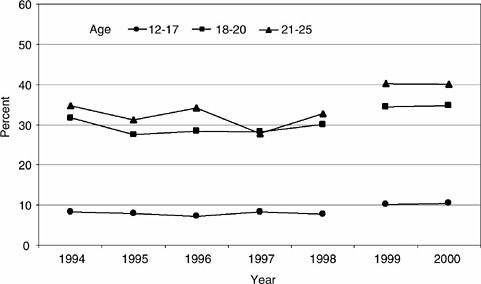
FIGURE 1-12 Trends in the prevalence of heavy alcohol use in the past 30 days, by finer age groups, 1994 to 2000.
SOURCE: National Household Survey on Drug Abuse (Analysis of Public Use File Data) (1994 to 2000).
20 who are frequent heavy drinkers, the number of days per year in which they drink heavily has increased substantially (T.K. Greenfield, personal communication, Alcohol Research Group, Berkeley, California, September 30, 2002).
Historical trend data for underage drinking measures among sociodemographic subgroups are not readily available for the NHSDA. Summary data for high school students based on the MTF, however, are available for this purpose (Johnston, O’Malley, and Bachman, 2002a, 2002b), and include breakdowns according to gender, race/ethnicity, college plans, metropolitan status, region, and family socioeconomic status (SES). Following are some of the key observations made by these researchers regarding trend differences for subgroups based on these sociodemographic characteristics:
-
Trends in rates of any use and heavy use of alcohol have been similar for females and males in recent years through 1999. However, there were notable gender differences in trends among high school seniors during the period when these rates declined substantially (i.e., during the 1980s and early 1990s). These differences were characterized by greater declines among males, which served to reduce the magnitude of the large gender differences that had existed in the 1970s.
-
Among eighth- and tenth-grade students, rates of heavy use among noncollege-bound students during the 1990s noticeably increased relative to the more stable rates among college-bound students.
-
Recent trends in drinking measures generally have been similar across racial/ethnic groups. One exception is the greater decrease in heavy drinking among Hispanic eighth-grade students in recent years, resulting in similar current rates for white and Hispanic eighth graders.
-
Although differences exist in underage drinking across groups defined by region, metropolitan status, and parents’ SES, these differences have been relatively stable over time—that is, there have been no dramatic differences in subgroup trends.
Limited analyses of NHSDA data since 1994, with respect to gender and racial/ethnic group differences, largely support these observations. One interesting recent development, however, is the apparent resumption of a trend toward gender equality in rates of heavy drinking among underage persons. Between 1999 and 2000, the prevalence rate of heavy drinking decreased slightly among males, and increased slightly among females. This was true for both the 12- to 17-year age group and the 18- to 25-year age group. A trend of diminishing relative differences between males and females in rates of heavy drinking from 1999 to 2000 was also observed among senior high school students in the Monitoring the Future data, and has continued through 2001 (Johnston et al., 2002b).
SUMMARY AND CONCLUSIONS
As has been the case for the past several decades, alcohol continues to be the most widely used psychoactive substance by adolescents and young adults in the nation. Before reaching the age of 21, the great majority of our country’s young people have consumed an alcoholic beverage at least once in their lifetime, and more than 57 percent are current drinkers (i.e., they have drunk alcohol within the past 30 days). These levels of current use of alcohol correspond with 42 percent of 20-year-olds who have smoked a cigarette in the past month and 16 percent who have used marijuana in the past month. Perhaps even more significant, the majority of underage persons who drink alcohol also drink large amounts on at least a monthly basis, and 15 percent of persons ages 16 to 20 report driving a vehicle under the influence of alcohol within the past month.
Underage drinking increases steadily with age throughout the range from 12 to 20. Persons in the upper values of this range are likely to drink as much as or more than most adults, and are much more likely to drink heavily. Underage drinking occurs among both males and females, although the rates are higher for males except at the lowest ages (e.g., 12 to 14). It
also occurs across all racial/ethnic groups, but with noticeably higher rates among non-Hispanic whites and Native Americans, and generally lower rates among African-Americans.
Differences are also observed across other sociodemographic subgroups, such as region, metropolitan status, and SES, although these differences are generally not very large. For the most part, demographic correlates of underage drinking are quite stable and have been well documented in prior reviews (e.g., O’Malley, Johnston, and Bachman, 1998; Johnston et al., 2002b). Numerous studies have identified a wide variety of other personal and environmental variables associated with adolescent substance use behaviors (including alcohol use), many of which will be reviewed in Chapters 4 and 5.
Despite very strong and encouraging progress in reducing the prevalence of underage drinking in the 1980s and very early 1990s, prevalence rates have been relatively stable over the past ten years. The same is true for underage DUI. The lack of progress in reducing underage drinking in recent years, including heavy drinking and DUI, warrants heightened attention to this issue and a reexamination of current prevention priorities and approaches. Perhaps there are lessons yet to be learned from the significant reductions in underage drinking achieved during the 1980s, and the dramatic reductions that have occurred more recently in rates of adolescent smoking. As referenced earlier, there is strong evidence that increases in minimum drinking age during the 1980s did lead to the significant reductions in underage drinking and DUI rates, thus supporting the potential efficacy of other types of environmentally focused regulatory approaches as described in Chapters 7, 8, and 9 of this volume.
Regarding adolescent smoking trends, and in contrast to underage drinking, there has been remarkable success in recent years in reducing cigarette use among adolescents. Between 1997 and 2001, past-month use of cigarettes among high school seniors has dropped from 36.5 percent to 29.5 percent, with even larger proportional declines among eighth- and tenth-grade students (Johnston, O’Malley, and Bachman, 2002b). Developing a better understanding of the forces behind this encouraging news, and adapting successful prevention and intervention strategies where possible to underage drinking, holds promise for renewing progress in reducing underage drinking rates and related problems. One of the great challenges in this effort will be to stimulate a genuine and sustainable shift in societal norms and attitudes that will be more conducive to reducing underage drinking, as well as alcohol misuse in general, and more supportive of the specific steps needed to help achieve this goal.
REFERENCES
American Psychiatric Association. (1987). Diagnostic and statistical manual of mental disorders, third edition. Washington, DC: Author.
American Psychiatric Association. (1994). Diagnostic and statistical manual of mental disorders, fourth edition. Washington, DC: Author.
Bachman, J.G., Johnston, L.D., and O’Malley, P.M. (2001). Monitoring the Future: Questionnaire responses from the nation’s high school seniors, 2000. Ann Arbor, MI: Institute for Social Research.
Bachman, J.G., O’Malley, P.M., Schulenberg, J.E., Johnston, L.D., Bryant, A.L., and Merline, A.C. (2002). The decline of substance use in young adulthood: Changes in social activities, roles, and beliefs. Mahwah, NJ: Lawrence Erlbaum Associates.
Dufour, M. (1999). What is moderate drinking? Alcohol Research and Health, 23, 5-14.
Ennett, S.T., Flewelling, R.L., Lindrooth, R.C., and Norton, E.C. (1997). School and neighborhood characteristics associated with school rates of alcohol, cigarette, and marijuana use. Journal of Health and Social Behavior, 38, 55-71.
Grant, B.F., and Dawson, D.A. (1997). Age of onset of alcohol use and its association with DSM-IV alcohol abuse and dependence: Results from the National Longitudinal Alcohol Epidemiologic Survey. Journal of Substance Abuse, 9, 103-110.
Greenfield, T.K. (2000). Ways of measuring drinking patterns and the difference they make: Experience with graduated frequencies. Journal of Substance Abuse, 12, 33-49.
Harrison, L.D. (2001). Understanding the differences in youth drug prevalence rates produced by the MTF, NHSDA, and YRBS studies. Journal of Drug Issues, 31, 665-694.
Hingson, R., Heeren, T., Levenson, A.J., and Voas, R. (2002). Age of drinking onset, driving after drinking, and involvement in alcohol-related motor vehicle crashes. Accident Analysis and Prevention, 34, 85-92.
Johnston, L.D. (1991). Contributions of drug epidemiology to the field of drug abuse prevention. In W. Bukoski (Ed.), Drug abuse prevention research: Methodological issues (pp. 57-80), NIDA Research Monograph No. 107. Rockville, MD: National Institute on Drug Abuse.
Johnston, L.D., O’Malley, P.M., and Bachman, J.G. (2002a). Demographic subgroup trends for various licit and illicit drugs, 1975-2001. Monitoring the Future Occasional Paper No. 57. Ann Arbor, MI: Institute for Social Research.
Johnston, L.D., O’Malley, P.M., and Bachman, J.G. (2002b). Monitoring the Future national survey results on drug use, 1975-2001. Vol. I: Secondary school students. NIH Publication No. 02-5106. Bethesda, MD: National Institute on Drug Abuse.
Martin, C.S., and Winters, K.C. (1998). Diagnosis and assessment of alcohol use disorders among adolescents. Alcohol Health and Research World, 22, 95-105.
O’Malley, P.M., and Johnston, L.D. (1999). Drinking and driving among U.S. high school seniors, 1984-1997. American Journal of Public Health, 89, 678-684.
O’Malley, P.M., Johnston, L.D., and Bachman, J.G. (1998). Alcohol use among adolescents. Alcohol Health & Research World, 22, 85-93.
Parents’ Resource Institute for Drug Education (PRIDE). (2002). PRIDE questionnaire report: 2001-2002 national summary, grades 6 through 12. Bowling Green, KY: Pride Surveys.
Paschall, M.J., and Flewelling, R.L. (2002). Post-secondary education and heavy drinking by young adults: The moderating effect of race. Journal of Studies on Alcohol, 63, 447-455.
Paschall, M.J., Ringwalt, C.L., and Flewelling, R.L. (2002). Explaining higher levels of alcohol use among working adolescents: An analysis of potential explanatory variables. Journal of Studies on Alcohol, 63, 169-178.
Substance Abuse and Mental Health Services Administration. (2000). Summary of findings from the 1999 National Household Survey on Drug Abuse. DHHS Publication No. SMA 00-3466. Rockville, MD: SAMHSA Office of Applied Studies.
Substance Abuse and Mental Health Services Administration. (2002a). Substance dependence, abuse, and treatment: Findings from the 2000 National Household Survey on Drug Abuse, Appendix C: Measurement of dependence, abuse, treatment, and treatment need. NHSDA Series A-16, DHHS Publication No. SMA 02-3642. Rockville, MD: SAMHSA Office of Applied Studies.
Substance Abuse and Mental Health Services Administration. (2002b). 2001 National household survey on drug abuse: Summary of findings. Available: http://www.samhsa.gov/oas/NHSDA/2k1NHSDA/vol12/appendixe.htm [September 16, 2002].
U.S. Department of Health and Human Services. (2000). Tracking healthy people 2010. Washington, DC: U.S. Government Printing Office.


