
Appendix A
Sample Size Determination
(Portions of this text are reprinted from Dell et al., 2002.)
Scientists who intend to use animals in research must justify the number of animals to be used, and committees that review proposals to use animals in research must review justification to ensure the appropriateness of the number of animals to be used. Sometimes, the number of animals to be used can be estimated best from experience; more often, a simple sample-size calculation should be performed. Even complicated experimental designs requiring sophisticated statistical models for analysis can usually be simplified to a single key or critical question so that simple formulas can be used to estimate the required sample size.
The purpose of the study may be to obtain enough tissue to analyze, to use a small number of animals for a pilot experiment, or to test a hypothesis. There is a statistical basis for estimating the number of animals (sample size) needed for several classes of hypotheses. The formula to be used depends on whether a dichotomous or continuous variable is observed and on the experimental design. Often, too few animals are used to make it possible to detect a significant effect.
EXPERIMENTS TO TEST A FORMAL HYPOTHESIS
Most animal experiments involve formal tests of hypotheses. It is possible to estimate the number of animals required for such an experiment if a few items of information are available. Broadly, three types of variables can be measured: dichotomous variables, often expressed as rates or proportions of a yes-no outcome, such as occurrence of a disease or survival at a given time; continuous variables, such as the concentration of a substance in a body fluid or a physiologic function, such as blood flow rate or urine output; and time to occurrence of
an event, such as the appearance of a disease or death. Many statistical models have been developed to test the significance of differences among means of these types of data. Detailed discussions of the models can be found in books on statistics (Cohen, 1988; Fleiss, 1981; Snedecor & Cochran, 1989), in manuals for various computer programs used for statistical analyses (Kirkpatric & Feeney, 2000; SAS, 2000), and on web sites that present elementary courses in statistics (e.g., www.ruf.rice.edu/~lane/rvls.html).
DEFINING THE HYPOTHESIS TO BE TESTED
Although experimental designs can be complicated, an investigator’s hypothesis can usually be reduced to one or a few important questions. It is then possible to compute a sample size that has a particular chance or probability of detecting (with statistical significance) an effect (or difference) that the investigator has postulated. Simple methods are presented below for computing the sample size for each of the three types of variables listed above. Note: the smaller the difference the investigator wishes to detect or the larger the population variability, the larger the sample size must be to detect a significant difference.
EFFECT SIZE, STANDARD DEVIATION, POWER, AND SIGNIFICANCE LEVEL
In general, several factors must be known or estimated to calculate sample size: the effect size (usually the difference between two groups), the population standard deviation (for continuous data), the desired power of the experiment to detect the postulated effect, and the significance level. The first two are unique to the particular experiment; the last two are generally fixed by convention. The magnitude of the effect that the investigator wishes to detect must be stated quantitatively, and an estimate of the population standard deviation of the variable of interest must be available from a pilot study, from data obtained in a previous experiment in the investigator’s laboratory, or from the scientific literature. Power is the probability of detecting a difference between treatment groups and is defined as 1-ß, where ß is the probability of committing a Type II error (concluding that no difference between treatment groups exists, when, in fact, there is a difference). Significance, denoted as a, is the probability of committing a Type I error (concluding that a difference between treatment groups exists, when, in fact, there is no difference). Once values for power and significance level are chosen and the statistical model (such as chi-squared, t-test, analysis of variance, or linear regression) is selected, sample size can be computed by using the size of the effect that the investigator wishes to detect and the estimate of the population standard deviation of the factor to be studied.
It should be noted that in the following discussion of sample-size calculations, the aim is to simplify the question being addressed so that power calcula-
tions can be performed easily. There is no need to alter the design of the experiment and data analysis. Using, for example, randomized block, Latin square, or factorial experimental designs and the analysis of variance, it is possible to control for the effect of strain differences on such a factor as survival or response to an intervention and to obtain a more significant result than would be possible with more elementary methods. However, the simplified designs discussed here yield sample sizes close to what would be obtained with more complex analyses and therefore should help the investigator to be self-sufficient in planning experiments.
CALCULATING SAMPLE SIZE FOR SINGLE-GROUP EXPERIMENTS
If the aim is to determine whether an event has occurred (for example, whether a pathogen is present in a colony of animals), the number of animals that need to be tested or produced is given by
where ß is the probability of committing a Type II error (usually 0.10 or 0.05) and p represents the proportion of the animals in the colony that are not infected. Note that the proportion not infected is used in the formula. For example, if 30% of the animals are infected and the investigator wishes to have a 95% chance of detecting that infection, the number, n, of animals that are need is:
Thus nine animals should be examined to have a 95% chance of detecting an infection that has affected 30% of the animals in the colony. If the prevalence of infection is lower—say, 10%—then
and about 30 animals would be needed. More animals are needed if the prevalence of the pathogen is low.
CALCULATING SAMPLE SIZE FOR CONTINUOUS VARIABLES
Experiments are often designed to measure continuous variables, such as concentration of a substance in a body fluid or blood flow rate. Although the statistical models may be complex, it is often critical to detect the difference in
the mean of a variable between two groups if there is such a difference. In this case, a simple formula derived from the formula for the t-test can be used to compute sample size when power, significance level, size of difference in means (called the effect), and variability or standard deviation of the population means are specified:
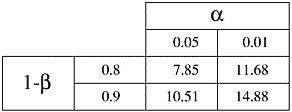
where C is dependent on values chosen for significance level (a) and power (1-ß); see Table A-1. Values of C for significance levels and powers not found in Table A-1 can be obtained from statistics books.
TABLE A-1 The Constant C is Dependent on the Value of a and 1-ß
|
 |
Suppose that a chemical that reduces appetite is to be tested to learn whether it alters the body weight of the rats. In previous experiments, the mean body weight of the rats used was 400g, with a standard deviation of 23g. Assume also that the scientist would like to be able to detect a 20g reduction in body weight between control and treated rats with a power (1-ß) of 90% and a significance level (a) of 5%. Then,
animals are needed in each group or roughly 60 animals for the whole study.
CALCULATING SAMPLE SIZE FOR REPEAT STUDIES
Estimates of required sample size depend on the variability of the population. The greater the variability, the larger the required sample. One method of controlling for variability of a continuous variable, such as blood flow, is to measure the variable before and after an experimental intervention in a single animal, also called a paired study. In this case, instead of using an estimate of the
variability of the population mean, one estimates the variability of the difference. The standard deviation of a difference in measurement in an individual is lower because it does not include interindividual variability. Stated in other terms, each animal is its own control. The number of animals needed to test a hypothesis will be reduced because the effect of animal-to-animal variation on the measurement is eliminated. Such an experiment is normally analyzed with a paired t-test. The following equation for n is derived from the paired t-test equation:
Values for C can be obtained from Table A-1. Note that
is multiplied by C in paired studies, rather than 2C, showing that a paired study is more powerful than a comparison of two independent means, as occurs in sample size calculations of continuous variables.
SAMPLE SIZE FOR TIME TO AN EVENT
The statistical analysis of time to an event involves complicated models; however, there are two simple approaches to estimating sample size for this type of variable. The first approach is to estimate sample size by using the proportions of the experimental groups that exhibit the event by a certain time. The proportions of the experimental and control groups that exhibit an event are treated as dichotomous variables. Sample-size calculations for dichotomous variables do not require knowledge of any standard deviation. The aim of the experiment is typically to compare the proportions in two groups. If more than two groups are studied, it is often possible to identify two rates that are most important to compare.
In this method the investigator knows or can estimate the proportion of the control group that will exhibit the event and can state a difference that must be detected between the control group and the experimental group. The smaller this difference, the more animals will be needed. Thus, given estimates for proportion of the control group exhibiting the event (pc) and the desired proportion of the experimental group exhibiting the event (pe), then
where qc = 1 – pc; qe = 1 – pe; and d = |pc – pe|. d is the difference between pc and pe, expressed as a positive quantity. Values for C can be obtained from Table A-1.
Suppose that the occurrence of spontaneously developing cancer in a group of transgenic animals is 50% (pc = 0.5) and the investigator wishes to test an anti-cancer drug. The investigator would like to detect when the drug causes the occurrence rate to drop to 25% of animals (pe = 0.25), with a power of 90% and a significance level of 5%. Then d = .25 and C = 10.51 (see Table A-1 for value of C), and
animals are needed in each group, which is about 85 animals in each group, for a total number of 170 animals necessary for the experiment.
The second approach is to treat time to occurrence as a continuous variable. This approach is applicable only if all animals are followed to event occurrence (for example, until death or time to exhibit a disease, such as cancer), but it cannot be used if some animals do not reach the event during the study. To compute sample size, it is necessary to obtain the estimate of the standard deviation of the variable (s) and the magnitude of the difference (d) the investigator wishes to detect, then
where C is a constant dependent on the value of a and 1-ß, as above.
Suppose that a strain of rats spontaneously develops cancer in 12 months with a standard deviation of 4 months. Assume that an investigator would like to test a drug postulated to delay the onset of cancer. If the investigator would like to be able to detect when the time to occurrence of cancer is extended to 15 months with a power of 90% and a significance level of 5%, then the difference to be detected is 3 months and 2C = 21 (C = 10.51, see Table A-1), and
animals in each group or roughly 80 animals for the whole study.


