
2
Introduction and Overview
HISTORY OF OYSTERS IN THE CHESAPEAKE BAY
The Eastern oyster, Crassostrea virginica,1 is native to coastal waters from the St. Lawrence River in Canada to the Atlantic coast of Argentina (Carriker and Gaffney, 1996). It was an important dietary component for Native Americans in the Chesapeake region and has supported a major fishery in the Chesapeake since colonial times (Lunz, 1938; Stenzel, 1971; Ham and Irvine, 1975; Waselkov, 1982; Kent, 1988; Mackenzie and Burrell, 1997). This oyster has also been an important component of the bay ecosystem. At peak abundance, sometime prior to 1870 (Wharton, 1957), Newell (1988) estimates that oysters could filter the water of the bay every 3.3 days. In addition to filtering algae and particulates from the water column, the Eastern oyster forms three-dimensional reefs that provide habitat for other species in the bay (Wells, 1961; Bahr and Lanier, 1981; Dame and Patten, 1981; Mann et al., 1991; Coen and Luckenbach, 2000; Lenihan et al., 2001; Newell et al., 2002).
In the late 1880s the Chesapeake Bay was the greatest oyster-producing region in the world, with an oyster harvest twice that of the rest of the (non-U.S.) world. The oyster fishery in the bay represented 39% of the U.S. oyster harvest, 17% of all U.S. fisheries, and employed 20% of all Americans who worked in the fishing industry (Kennedy and Breisch, 1983). Oyster landings peaked in the latter part of the 19th century and
|
1 |
Scientific names for species mentioned in the text are given in Appendix K. |

FIGURE 2.1 History of commercial oyster landings in the Chesapeake Bay.
SOURCES: Data from Chesapeake Bay Program, http://www.chesapeakebay.net/data/historicaldb/livingresourcesmain.htm; National Marine Fisheries Service, http://www.st.nmfs.gov/st1/commercial/landings/annual_landings.html
have declined steadily since then (see Figure 2.1). While the average density of oysters in the bay in 1991 was estimated to be 4% of the 1884 levels (Rothschild et al., 1994), oyster landings hit historically low levels in 2002. The decline in oyster abundance has been attributed to many factors, including fishing pressure, reduced water quality, habitat destruction, diseases, and interaction among factors.
Over the years, fishing pressure increased on the bay’s oyster population as the oyster-harvesting gear used by fishermen became progressively more elaborate and efficient, beginning initially with rakes and hand tongs and progressing to dredges (legalized in 1865) and hydraulic patent tongs. Changes in fishing gear improved oyster landings (e.g., 8 to 25 bushels/day for a fisherman using a hand tong versus 30 to 100 bushels/day for a fisherman using patent tongs; Johnson, 1988) but negatively impacted oyster reefs. Dredging reduces the integrity of oyster reef habitat because large clumps of oysters are broken off (Winslow, 1881; Hargis and Haven, 1988, 1999; Rothschild et al., 1994; Lenihan and Peterson, 1998; Coen and Luckenbach, 2000).
Water quality in the Chesapeake Bay has also declined dramatically since colonial times as a result of increased sediment and nutrient loads due to population growth, land-use changes in the Chesapeake Bay watershed, and pollution (Rothschild et al., 1994; Boynton et al., 1995; Seagle et al., 1999; Smodlaka et al., 1999). This is perhaps best documented in the paleological record from sediment cores taken across the Chesapeake Bay near the mouth of the Choptank River (Cooper and Brush, 1991, 1993). For the bay, enhanced sedimentation and eutrophication have translated into increased phytoplankton biomass, reduced water transparency, loss of submerged aquatic vegetation, and expansion of hypoxic conditions in the stratified waters of the estuary during the summer (Harding et al., in Malone, 1999).
By 1959 Eastern oyster populations in the Chesapeake Bay had already been in decline when the disease MSX, caused by the protozoan parasite Haplosporidium nelsoni, spread to oyster populations in the lower Chesapeake from the Delaware Bay (Virginia Institute of Marine Science (VIMS),2 1998; Burreson et al., 2000). By the 1970s, MSX dramatically reduced oyster densities in Virginia’s high salinity oyster grounds. Oysters populating less saline waters (less than 15 ppt) were generally spared the effects of the disease. Another protozoan parasite, Perkinsus marinus, which causes the disease Dermo, had been identified in Chesapeake Bay oysters in 1949 but did not become a major problem until the mid-1980s (VIMS, 1998; Ford and Tripp, 1996). Like MSX, Dermo caused high oyster
|
2 |
Acronyms cited in the text are listed in Appendix C. |
mortality, particularly at salinities above 12 to 15 ppt. Unlike MSX, Dermo also killed oysters at lower salinities (less than 9 ppt), although under these conditions the disease takes 2 to 3 years to develop.
In assessing the historical changes to the oyster populations in the Chesapeake Bay, it is clear that over the past 110 years the population decline has been the result of multiple interacting factors. During the latter part of the 20th century, diseases had a devastating impact on oyster populations in the Chesapeake Bay, particularly where salinities were greater than 15 ppt; however, they acted on an oyster population that was already compromised by poor water quality, fishing, and habitat loss. Thus, a combination of interacting factors occurring over the past 150 years has threatened the survival of oyster fisheries in both Virginia and Maryland (Ulanowicz and Tuttle, 1992; Rothschild et al., 1994; Newell et al., 2000, 2002; Jackson et al., 2001; US ASMFC, 2002).
There are significant differences in the nature of the Chesapeake Bay oyster fishery as it is pursued in Maryland versus Virginia. In Maryland most of the watermen fish public bottom (96%), while in Virginia more than 60% of the fishing occurs on private beds. Hand tongs, patent tongs, and hand (divers) are used to collect most of the catch in Maryland (Chesapeake Bay Program, 2002) while in Virginia most of the oysters are taken with patent tongs, oyster dredges, and by hand (divers) (Virginia Marine Resources Commission [VMRC], 2003a). Virginia does more processing and marketing than Maryland, with about two-thirds of the oysters processed coming from outside the area (J. Wesson, VMRC, Newport News, personal communication 2003).
Restoration of the Eastern oyster is at the center of the Chesapeake 2000 Agreement, signed by Maryland, Virginia, Pennsylvania, the District of Columbia, the Chesapeake Bay Commission, and the U.S. Environmental Protection Agency. The agreement calls for a 10-fold increase in native oysters in the bay by 2010 relative to the 1994 baseline. This is to be achieved through continued improvements to bay water quality, reduced oyster fishing pressure in selected areas, shell deposition to rebuild the reef structure, and continued development of disease-resistant oyster strains. Past restoration efforts, dating back to the 1920s, were directed toward maintaining the oyster fishery. Recent programs have included establishment of more than 30 oyster reef sanctuaries and production of disease-free oyster seed for stocking both sanctuary and harvest areas (Luckenbach, 2001).
At the same time, a debate has arisen over whether the nonnative Asian or Suminoe oyster C. ariakensis should be introduced into the Chesapeake Bay for commercial harvest. In 1995 the Virginia General Assembly, through House Joint Resolution 450, directed VIMS to begin research on nonnative oyster species for possible use in the Chesapeake Bay. VIMS
used sterile (triploid) oysters to prevent any unintended introduction, initially working with the Pacific oyster, C. gigas, and then C. ariakensis (Calvo et al., 1999; Hallerman et al., 2001). Results of the C. gigas trials were disappointing; at low- and medium-salinity locations, the oysters had high mortality rates and slow growth rates. However, controlled experiments in Virginia waters with the Asian oyster suggested that it might grow faster and be more disease resistant than the native, Eastern oyster, C. virginica (Calvo et al., 2001). The Asian oyster was also well received in marketing trials undertaken by the Virginia Seafood Council (VSC; also see a more recent study by Grabowski et al., 2003). Based on these promising results, the VSC requested state approval to use chemically derived triploid C. ariakensis in a field trial in 2002 with 40 participants from the Virginia oyster aquaculture industry.
The proposal, which was withdrawn after criticism from the Chesapeake Bay Program’s ad hoc review panel, was the stimulus for the request for this National Research Council (NRC) study. A second VSC proposal recommended the introduction of genetically derived sterile C. ariakensis for use in a 2003 economic field trial to test whether C. ariakensis aquaculture would provide an economic alternative to the diseased native oyster (Virginia General Assembly, 2002) and potentially contribute to restoration of the ecosystem function historically provided by the extensive beds of native oysters. Because of concerns not addressed in the second VSC proposal, this NRC committee submitted interim comments in the form of a brief letter to the Virginia Marine Resources Commission (VMRC) outlining some of the risks that should be addressed in the field trial (Appendix B). The VMRC approved the VSC proposal with modifications to address many of these concerns. Field trials using triploid C. ariakensis are also underway in North Carolina.
Little is known about the interactions of C. ariakensis with the native oyster or the ecological consequences of introducing this oyster to the Chesapeake Bay (Zhou and Allen, 2003). Nonnative species introduced by accident over the years have already altered the bay’s ecological balance, and several previous experiences with exotic species invasions (e.g., mute swans, nutria, kudzu, zebra mussels, and gypsy moths) argue against unregulated introduction of species that have the potential to spread throughout ecosystems (see Carlton, 2001; Moser, 2002, and references therein). Not all introductions have caused ecological problems and economic losses. Still, many resource managers, environmentalists, and bay scientists fear that introduction of a nonnative species could upset the bay’s ecological balance. Maryland officials, who have no apparent legal authority over these experiments in Virginia waters, initially objected to open-water testing of C. ariakensis. It is also unclear which, if any, federal agencies have jurisdiction to review further experiments or introductions
of C. ariakensis (e.g., the North Carolina study, which was originally funded by the state legislature, has proceeded with no federal involvement).
VIMS research to date has shown that aquaculture of triploid C. ariakensis offers promise for economic development in Virginia and the region (Calvo et al., 2001). Using current technologies and production methods, large-scale use of triploid C. ariakensis would entail the possibility of introducing reproductive (diploid) nonnative oysters over the long term through reversion, production errors, or both. The introduction of diploid C. ariakensis into the Atlantic coastal waters of the United States is a resource management decision with potentially far-reaching consequences. These consequences could extend well beyond Virginia if the oysters are shipped to other states or the larvae are spread by natural processes, and the risks and merits of this species may vary in different regions. As a result, there has been a call for more research on the ecological, genetic, and disease potential of C. ariakensis because of the possibility of introducing reproductively capable populations over the long term, even with current triploid technology and production methods.
The goal of this study was to examine the ecological and socioeconomic risks and benefits of open-water aquaculture or direct introduction of the nonnative oyster, C. ariakensis, in the Chesapeake Bay (see Box 2.1). The committee prepared this report after convening two public meetings (Appendix H). At the first meeting the study’s sponsors (see Box 2.2) were invited to explain their goals for the study and to describe what they thought were the most important issues for the committee to consider.
|
BOX 2.1 This study will examine the ecological and socioeconomic risks and benefits of open-water aquaculture or direct introduction of the nonnative oyster Crassostrea ariakensis in the Chesapeake Bay. The committee will address how C. ariakensis might affect the ecology of the bay, including effects on native species, water quality, habitat, and the spread of human and oyster diseases. Possible effects on recovery of the native oyster C. virginica will be considered. The potential range and effects of the introduced oyster will be explored, both within the bay and in neighboring coastal areas. The study will investigate the adequacy of existing regulatory and institutional frameworks to monitor and oversee these activities. The committee will assess whether the breadth and quality of existing research, on oysters and other introduced species, are sufficient to support risk assessments of three management options: (1) no use of nonnative oysters, (2) open-water aquaculture of triploid oysters, and (3) introduction of reproductive diploid oysters. Where current knowledge is inadequate, the committee will recommend additional research priorities. |
|
BOX 2.2
|
Standish Allen (VIMS) provided an overview of what is known about C. ariakensis, both in research conducted at VIMS and in the oyster’s native habitat in China. The committee then organized a workshop to be held at its second meeting to bring together scientists, managers, policymakers, watermen, and environmental groups to discuss the many different biological, environmental, regulatory, social, and economic issues that are essential components of informed decision making on the proposed introduction into the bay of a nonnative species. The committee met twice more to prepare the findings that are reported here.
Report Organization
This report is organized as a review of the information available to support a detailed analysis of the risks and benefits of introducing an exotic oyster into the Chesapeake Bay and considering the potential expansion of this oyster into other waters along the eastern seaboard. The remainder of Chapter 2 describes major features of the Chesapeake Bay ecosystem, highlighting the sources of change that may contribute to the current depleted status of the native oyster population. Chapter 3 provides a review of invasive species science and presents case studies of introductions of nonnative oysters around the world. An overview of the biology of both C. virginica and C. ariakensis is given in Chapter 4, with special reference to the similarities and differences relevant to the survival and propagation of these species in the bay. Chapter 5 presents an analysis of the social and economic value of oysters in the Chesapeake Bay and describes differences between the oyster industries in Virginia and Maryland. Chapters 6 and 7 review the status of native oyster restoration efforts and the aquaculture industry respectively. The regulatory authority governing the decision to introduce a nonnative species into marine waters has not been well defined in the United States. An exami-
nation of the existing regulatory framework for introduction of nonnative species at the state, federal, and international levels is presented in Chapter 8. In Chapter 9 the committee presents an assessment of the various risks that may be associated with the three management options defined in the Statement of Task and includes background on risk assessment methodology, underscoring the great uncertainty in all areas. Finally, Chapter 10 presents the committee’s conclusions and suggestions for research that would enable decision making for future use of nonnative oysters in aquaculture or to establish another oyster species for harvest in the Chesapeake Bay and neighboring waters.
CHESAPEAKE BAY LIMNOLOGY AND OCEANOGRAPHY
Physical Description
The Chesapeake Bay is a long, narrow, relatively shallow estuary (see Figure 2.2 and Table 2.1) created more than 10,000 years ago when the Susquehanna River valley was drowned by the sea-level rise following the Wisconsin ice age (Boicourt et al., 1999). The bay extends from Cape Charles, Virginia, at its mouth northward for more than 300 km to Havre de Grace, Maryland, at its head. There are three main tributaries of the bay: the Susquehanna River, the Potomac River, and the James River. The Susquehanna River provides approximately half of the freshwater input and with the other two primary tributaries accounts for 70 to 80% of the bay’s freshwater input (Boicourt et al., 1999; Seagle et al., 1999).
The Chesapeake Bay can be characterized as a partially mixed estuary with three main factors influencing its circulation: freshwater inflow, the geometry of the basin, and tidal strength (Pritchard, 1967; Boicourt et al., 1999). Synoptic-scale winds (i.e., winds generated by large moving pressure systems) can also be important. Fresh water moves seaward over saltwater that is moving toward the head of the estuary. Mixing is directed to both the upper and lower layers, so water properties are altered in both layers during travel along the axis of the bay. In addition, transport within each layer increases in the seaward direction (Boicourt et al., 1999). Like many rivers and estuaries, the Chesapeake Bay has a characteristic freshwater outflow at its mouth. This transport has been estimated at about five times the entering river flow (Kemp et al., 1999; Malej et al., 1999), which in an average year is typically greatest in the spring and least in the late summer and early fall (Malej et al., 1999). Fresh water in the bay has a mean residence time of 7 months (Malej et al., 1999). The bay’s outflow plume is distinct, generally making a wide anticyclonic turn and flowing southward as a coastal current (Rennie et al., 1999; Marmorino and Trump, 2000). However, wind speed and the direction and volume of
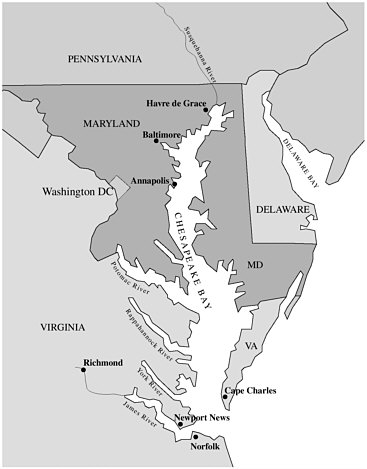
FIGURE 2.2 Map of the Chesapeake Bay.
bay discharge can affect both the direction and speed of this coastal current. The Chesapeake Bay plume propagates more rapidly to the south during moderate-to-weak southeastward winds (downwelling favorable conditions). Under these conditions the current becomes narrower (less
TABLE 2.1 Profile of the Chesapeake Bay
|
Chesapeake Bay Main Basin |
||
|
Length: |
195 mi |
|
|
Shoreline: |
4600 mi |
|
|
Volume: |
18 trillion gallons |
|
|
Area: |
Maryland |
1726 sq mi |
|
|
Virginia |
1511 sq mi |
|
|
Total |
3237 sq mi |
|
Width: |
“Cape Charles, VA” |
30 mi |
|
|
“Annapolis, MD” |
4 mi |
|
Depth: |
average |
25 ft |
|
|
greatest (SE of Annapolis) |
174 ft |
|
Tidal Range: |
Annapolis |
1 ft |
|
|
head |
2 ft |
|
|
mouth |
3 ft |
|
Surface Salinity: |
mouth |
30 ppt |
|
|
midway to head |
15 ppt |
|
|
above fall line |
00 ppt |
|
|
difference between surface and bottom |
2-3 ppt |
|
SOURCE: Modified from Maryland State Archives, http://www.mdarchives.state.md.us/msa/mdmanual/01glance/html/ches.html. |
||
than 10 km) and deeper (greater than 8 m). Southward propagation of the plume decreases for moderate-to-weak northwest winds (upwelling favorable conditions). Under these conditions the current is shallower (less than 8 m) and wider, often extending more than 10 km offshore and sometimes detaching from the coast (Rennie et al., 1999; Hallock and Marmorino, 2002).
Within the bay there are continuous gradients of physical, chemical, and biological properties along the axis of the mainstem (Kemp et al., 1999). Most notable is the north-south salinity gradient that is driven by the freshwater input of the Susquehanna River (Seagle et al., 1999; Harding et al., 1999). The salinity ranges from fresh water at the head of the bay to 85% seawater in the lower reaches (Kemp et al., 1999; Harding et al., 1999). Based on factors such as bottom topography, nutrient input, and water clarity, the bay is often divided into upper, middle, and lower regions, each with distinct characteristics (Kemp et al., 1999). The upper bay (above 39°N latitude) is a shallow area (less than 3.5 m) with low
relief bottom topography and active sediment deposition. It is turbid and well mixed with high nutrient concentrations (Kemp et al., 1997, 1999). Migrating fish and crabs tend to congregate in this turbidity zone in the spring and fall (Boynton and Kemp, 2000; Simenstad et al., 2000). The midbay is separated from the lower bay just below 38°N latitude and is characterized by relatively clear water and seasonally high nutrient concentrations. The topography of this area includes a narrow central channel and broad flanking shoals. The water in the central channel is well stratified. The lower bay generally has the clearest waters and somewhat lower concentrations of nutrients than the other bay areas (Kemp et al., 1999). The geometry of the Chesapeake Bay is conducive to oxygen depletion, particularly in the deeper areas of the mainstem where stratification suppresses vertical exchange (Boicourt et al., 1999; Kemp et al., 1999). This is significant because the channel, which represents less than 40% of the bay’s surface area, contains 75% of its volume (Smodlaka et al., 1999).
Changes in Human Population and Land Use
The Chesapeake Bay drainage basin encompasses an area of 64,000 square miles (166,512 km2) and extends over parts of six states (Maryland, Delaware, Pennsylvania, New York, Virginia, West Virginia) and the District of Columbia (Smodlaka et al., 1999). The current population in this watershed is estimated at 16 million people (Seagle et al., 1999; Smodlaka et al., 1999), or an average of 98 people/km2. Archeological evidence suggests that humans first inhabited this area about 10,000 to 12,000 years ago. Significant human impacts on the bay’s ecosystem appear to have begun well before the European settlers arrived (Stevenson et al., 1999), although change accelerated during and after colonial times (Cooper and Brush, 1991, 1993). Prior to European settlement, 95% of the Chesapeake Bay watershed was covered by forest (Seagle et al., 1999). By the middle of the 19th century, European settlers had cleared over 55 to 60% of the forested land area (Seagle et al., 1999; Malej et al., 1999). This deforestation resulted in significant increases in nutrient and sediment input into the waters of the drainage basin (Cooper and Brush, 1991, 1993) and caused additional changes to the trophic structure of the bay such that benthic plant productivity decreased and phytoplankton productivity increased (Malej et al., 1999). Today, more than 60% of the watershed area has been returned to forest cover (Seagle et al., 1999). The rest is comprised of urban and suburban development, pasture, and cropland (Seagle et al., 1999). Despite the gradual recovery of forested lands in the bay’s watershed, continued human population growth, greater fertilizer use, atmospheric deposition from fossil fuel combustion (especially coal), and
increased animal husbandry in the watershed area have added to sediment inputs and increased riverine nutrient inputs 10-fold since the mid-1940s (Krupnick et al., 1998; Russell et al., 1998; Malej et al., 1999). Cooper and Brush (1993), Brush and Hilgartner (2000), and Jackson et al. (2001) provide excellent historical overviews of how the synergistic effects of human activities have led to degraded water quality, loss of oyster populations, and decreased submerged aquatic vegetation in the Chesapeake Bay.
Nutrients and Sedimentation
Compared with other coastal ecosystems worldwide, the Chesapeake Bay estuary receives moderately high inputs of nitrogen and phosphorus (Nixon, 1995; Kemp et al., 1999) and thus is considered to be overenriched in these elements (Malone et al., 1986; Harding et al., 1999). A number of models have indicated that nutrient enrichment is having a major effect on the bay’s ecosystem (e.g., Darnell and Soniat, 1981). These effects include increases in the severity, duration, and frequency of hypoxic and anoxic events in the deeper areas of the bay and some of the tributaries (Officer et al., 1984; Seliger et al., 1985) and declining populations of submerged aquatic vegetation (Orth and Moore, 1983; Hurley, 1991), anadromous and freshwater fish (Flemer et al., 1983), and benthic organisms (Kemp and Boynton, 1992). Excess nutrient inputs also enhance phytoplankton blooms and subsequent responses of heterotrophic bacterioplankton (Smith et al., 1992). There is evidence that the trophic structure of the bay has shifted from one that is dominated by autotrophic production (primarily photosynthesis) to one dominated by bacterial production (Jonas and Tuttle, 1990). Most of the nutrients enter the estuary as diffuse nonpoint source inputs associated with river flow, although point source discharges and atmospheric deposition can sometimes be significant (Kemp et al., 1999). The major macronutrients generally decrease in concentration from north to south. The highest nutrient concentrations are near the bay’s confluence with the Susquehanna River, and the lowest are at the mouth of the bay (Harding et al., 1999).
The edge-of-stream sediment load for the entire Chesapeake Bay drainage is estimated to be 2.72 × 10³ tons/year, with a delivered load of 2.22 × 10⁶ tons. The sediment load is related to river flow and to landcover. Seventy-three percent of the total sediment load is derived from farmland using conventional tillage practices (Seagle et al., 1999). Data from sediment cores show that sedimentation rates in the Chesapeake Bay have increased five- to seven-fold since European settlement, averaging 0.13 to 0.27 cm/year after settlement compared with rates of 0.03 to 0.14 cm/year prior to settlement (Cooper and Brush, 1993).
In the 1970s, the U.S. Environmental Protection Agency (EPA) initiated a decade-long study that was focused on reducing sediment and nutrient inputs into the bay (Horton and Eichbaum, 1991). The first Chesapeake Bay Agreement (1983) formally recognized the need for cooperative efforts to reduce pollution (including nutrient enrichment) and enhance bay productivity (Appendix D). A second agreement in 1987 expanded upon the first and committed to a 40% reduction in nitrogen and phosphorus entering the mainstem of the bay by 2000. Although the goal has not been met, nutrient levels have declined despite increased population growth and development in the watershed. The model of the Chesapeake Bay watershed used by the Chesapeake Bay Program (CBP) to estimate nutrient input suggests that nitrogen loads have decreased by 51 million pounds/year between 1985 and 2000 (from 300 million pounds/year to 249 million pounds/year) and that phosphorus loads have declined by 8 million lbs/year (from 25 million pounds/year to 17 million pounds/ year) over the same time (Chesapeake Bay Program, 2000). U.S. Geological Survey measurements at nine river input monitoring stations provide more detailed and site-specific data. Nutrient levels computed using actual water quality data collected between 1985 and 1998 at these stations showed no statistically significant trends in either total nitrogen or total phosphorus loads at six of the nine stations. Some of the difference is attributable to high streamflows, which can lead to higher nutrient loads even if nutrient concentrations have maintained status quo or declined. Adjustment of the data to account for this variation resulted in downward trends for nitrogen concentrations (at six of the nine sites) and phosphorus concentrations (at seven of the nine sites; Belval and Sprague, 1999; Sprague et al., 2000). A further analysis of nutrient data from 31 sites in the nontidal portions of the Chesapeake Bay basin from 1985 to 1999 showed that flow-adjusted concentrations of total nitrogen and total phosphorus trended downward at 23 of 31 sites. This suggests that management actions are working in reducing nutrient concentrations (Langland et al., 2001; U.S. EPA, 2002). The Chesapeake 2000 Agreement reaffirms the commitment of its signatories to achieve and maintain the 40% nutrient reduction goal agreed to in 1987 and further strives to correct all nutrient-and sediment-related problems in the bay and its tidal tributaries by 2010 (Chesapeake Bay Program, 2000).


