
CHAPTER 6
THE RELATIONSHIP OF SULFUR OXIDE EMISSIONS TO SULFUR DIOXIDE AND SULFATE AIR QUALITY
(Chapter 6 was written by John Trijonis under the general supervision of the committee, which reviewed the work at several stages and suggested modifications which have been incorporated. While every committee member has not necessarily read and agreed to every detailed statement contained within, the committee believes that the material is of sufficient merit and relevance to be included in this report.)
Sulfur oxide emissions from man-made sources consist primarily of sulfur dioxide. Both during emission and while in the atmosphere, gaseous sulfur dioxide can become oxidized to form sulfate (SO4)† particulate matter. The sulfate aerosol is mainly composed of sulfuric acid and corresponding salts such as ammonium sulfate. This chapter reviews the relationship between sulfur oxide emissions and ambient air quality levels for sulfur dioxide and SO4.
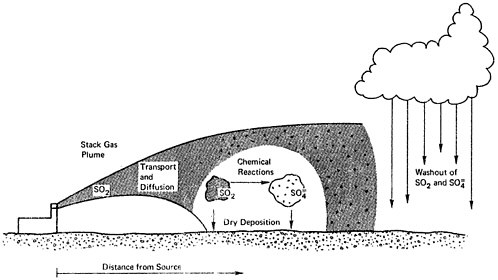
As illustrated in Figure 6–1, the relationship between sulfur oxide emissions and ambient air quality involves several complex processes. Atmospheric transport and diffusion control the dispersal of the emissions, while chemical oxidation processes lead to the formation of sulfate aerosol from gaseous sulfur dioxide. Removal processes of sulfur dioxide and particulate sulfate include deposition on plants, soil, and water bodies as well as washout by precipitation. The latter leads to further pollution problems associated with increased rainfall acidity.
The relationship between sulfur oxide emissions and air quality will be discussed below in five sections. Section 1 describes the nationwide SOx emission inventory; included are discussions of past trends and geographical features. Section 2 deals with sulfur dioxide air quality and its relationship to SOx emissions. Section 3 describes present ambient sulfate levels and examines the dependence of ambient sulfate formation on SOx emissions. In Section 4, recent trends in sulfur dioxide and SO4 air quality are analyzed, and comparisons are made to corresponding SOx emission trends. Finally, Section 5 gives an approximate forecast of the air quality impact to be expected from the substantial increases in SOx emissions that have been projected for electric power plants.
SULFUR OXIDE EMISSIONS
The principal natural source of atmospheric sulfur oxides is the oxidation of hydrogen sulfide or dimethyl sulfide gas which results from decaying vegetation (Kellogg et al. 1972, Lovelock et al. 1972). Over the oceans, significant sulfate is also emitted as part of sea spray. Presently, on a global basis, these natural occurrences of atmospheric sulfur compounds are estimated to be about one and one half times the emissions from anthropogenic (man-made) sources (Cavender et al. 1973, Kellogg 1972). However, in industrialized regions, the concentrated emissions from technological processes, in particular fossil fuel combustion, are much greater than natural contributions.
Data on the composition of SOx from combustion and other man-made sources indicate that about 98 percent of emitted SOx is sulfur dioxide. The remaining fraction of typical SOx emissions, about 1 to 2 percent, is sulfur trioxide and its derivatives. The main sulfur trioxide derivative in emission gases is sulfuric acid; metallic sulfates appear to be directly emitted only in trace amounts.
Table 6–1 summarizes the 1972 inventory of man-made SOx emissions for the United States as well as for six selected air basins. On a national basis, more than 75 percent of SOx emissions result from coal and fuel oil combustion in stationary sources, and more than 50 percent of SOx emissions result from fuel combustion in electric power plants alone. Industrial process SOx emissions, mostly from the metallurgical, petroleum, chemical, and mineral industries, are also significant. On a national basis, other stationary sources and transportation sources are relatively minor contributors.
As indicated in Table 6–1, the relative importance of different SOx source types varies considerably from region to region. In the three eastern/midwestern air basins listed in Table 6–1, (Boston, Atlanta, and St. Louis), stationary fuel combustion is especially important, accounting for 83 to 97 percent of total SOx emissions in those areas. Industrial processes and transportation are relatively more significant in the three western air basins (Dallas-Ft. Worth, Denver, and Los Angeles), where they account for 50 to 67 percent of total SOx emissions.
Figure 6–2 presents the geographical distribution of estimated SOx emissions in the United States (EPA 1974). It is evident that these emissions are particularly concentrated in the northeast sector of the country, which accounts for about half the total SOx emissions in the United States.
The trends in the SOx emission inventory are summarized in Table 6–2. From 1960 to 1970 total SOx emissions in the United States increased by 45 percent; about seven eighths of this increase was due to an almost doubling of electric power plant emissions. The remaining portion of the increase basically resulted from growth in emissions from industrial process sources. Total emissions from all other sources have remained essentially constant.
This increase in total SOx emissions was accompanied by significant alterations in the spatial distribution of those emissions. The
TABLE 6–1
Sulfur Oxide Emission Inventories for the United States and for Selected Air Quality Control Regions, (NEDS Data for 1972).
|
|
United States |
Boston AQCR |
Atlanta AQCR |
St. Louis AQCR |
Dallas/Ft. Worth AQCR |
Denver AQCR |
Los Angeles AQCR |
|
Total Sulfur Oxide Emissions (Thousand tons/year) |
32,000 |
332 |
94.7 |
1,234 |
17.3 |
33.5 |
238 |
|
Percentage of Sulfur Oxide Emissions by Source Category |
|||||||
|
Stationary Source Fuel Combustion |
|
||||||
|
Electric Power Plants |
54.3% |
41.6% |
70.8% |
76.2% |
3.0% |
34.2% |
16.8% |
|
Industrial |
15.3% |
8.2% |
5.6% |
6.0% |
5.0% |
10.4% |
14.6% |
|
Commercial & Residential |
7.1% |
48.6% |
5.7% |
1.9% |
19.8% |
5.3% |
18.8% |
|
Industrial Processes |
21.1% |
0.5% |
12.3% |
15.3% |
23.7% |
40.7% |
37.6% |
|
Other Stationary Sources |
0.2% |
0.1% |
0.5% |
0.1% |
5.3% |
0.2% |
1.6% |
|
Transportation Sources |
2.0% |
1.0% |
5.1% |
0.5% |
43.2% |
9.2% |
10.6% |
|
Source: Reference ( ) |
|||||||
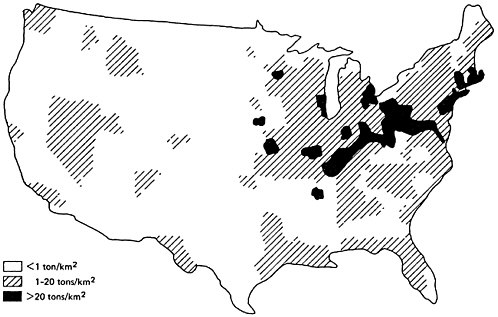
TABLE 6–2
Sulfur Oxide Emission Trends in the United States, 1960–1970
|
Source Category |
United States Emissions, 1960 (1000 Tons/Year) |
United States Emissions, 1970 (1000 Tons/Year) |
% Change 1960 to 1970 |
|
Stationary Source Fuel Combustion |
|||
|
Electrical Power Plants |
10,100 |
19,400 |
+92% |
|
Industrial |
4,800 |
4,890 |
+2% |
|
Commercial and Residential |
2,590 |
2,160 |
−17% |
|
Industrial Processes |
4,720 |
6,030 |
+28% |
|
Other Stationary Sources |
360 |
380 |
+6% |
|
Transportation |
675 |
984 |
+46% |
|
TOTAL |
23,300 |
33,900 |
+45% |
bulk of the increase occurred among sources which are located away from central-city areas and/or which emit pollutants through tall stacks. Further, the growth of ground-level sources tended to occur in a non-homogenous manner; the greatest growth occurred in suburban areas, leading to a spreading of emissions throughout metropolitan regions. Ground-level/central-city emissions appear to have actually been significantly reduced from 1960 to 1970. These changes in the spatial distribution of SOx emissions will be discussed in more detail in Section 4, which deals with ambient air quality trends for sulfur dioxide and sulfates.
With no further abatement programs, SOx emissions are expected to continue increasing in the future. The National Academy of Engineering has predicted a 66 percent national increase from 1970 to 1980 and a 135 percent national increase from 1970 to 1990 (National Academy of Engineering). These increases will again occur predominantly in the power plant category, where SOx emissions are expected to double from 1970 to 1980 and to triple from 1970 to 1990.
SULFUR DIOXIDE AIR QUALITY
Table 6–3 summarizes the present National Ambient Air Quality Standards for sulfur dioxide. Natural background sulfur dioxide levels are well below the air quality standards; measurements indicate that natural background sulfur dioxide concentrations are on the order of 0.5 to 4 ug/m3 (Georgii 1970, Cadle et al. 1968, Lodge and Pate 1968). In urban areas, man-made sources lead to sulfur dioxide concentrations which are considerably greater than background levels. In the early 1970’s, annual average sulfur dioxide concentrations in urban areas of the United States tended to range from 10 to 80 ug/m3 (EPA 1972). In 1970 and 1971, the average level among all urban National Air Surveillance Network (NASN) monitoring sites was about 25 ug/m3 (annual average), and only about 2 percent of measured annual averages at NASN urban sites exceeded the national primary
standard. At nonurban NASN monitoring sites, annual mean sulfur dioxide concentrations tend to be around 5 to 15 ug/m3, slightly above estimated natural background levels (EPA 1972).
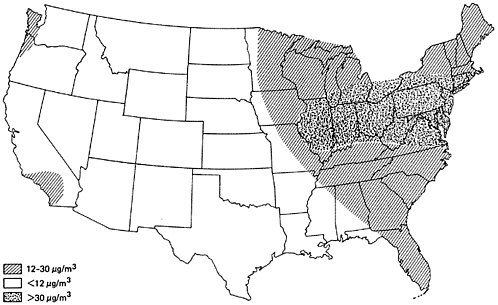
Figure 6–3 provides an approximate contour map for typical annual average sulfur dioxide levels in urban areas of the United States for 1970–1971. It can be seen that urban sulfur dioxide concentrations are generally higher east of the Mississippi. From 1964 to 1968, the average sulfur dioxide concentration at all eastern urban sites was three times the average at all western urban sites (Altshuller 1973). Particularly high urban sulfur dioxide concentrations are found in the industrialized northeast section of the country. As was illustrated in Figure 6–2, the northeast sector has the greatest SOx emission density.
The Relationship Between Sulfur Dioxide Air Quality and Emission Levels
The relationship between sulfur dioxide air quality and SOx emissions is simple in one sense but complex in another. It is simple in that the ambient sulfur dioxide contribution from a single source tends to vary in direct proportion with the emissions from that source. Thus, for an area dominated by a single source, the linear rollback formula is usually appropriate for relating sulfur dioxide air quality to SOx emission levels. The simple linear rollback formula is also valid for relating ambient sulfur dioxide levels to total emissions from a group of sources, provided that the emissions from all the sources are reduced or increased in proportion to one another. Another, more exact way of stating this proviso is that the temporal and spatial distribution of emissions remain fixed.
In reality, spatial distributions of emissions are altered by relocation of emission sources, by non-homogeneous growth patterns, and by non-proportional emission changes for different types of sources. Herein lies the complexity. When spatial emission patterns change there is no guarantee that the linear
rollback formula is valid; in fact, it can be grossly in error. For instance, consider an air basin which undergoes an increase in total SOx emissions. Assume that this increase is due to greater emissions from sources with tall stacks and from sources located away from the central-city area. Further assume that ground-level emissions in the central-city area remain constant. In this case, central-city/ground-level air quality will change little in comparison to the total emission increase for the region, i.e., the deterioration in central-city air quality will be considerably less than that which would be predicted by the linear rollback formula.* As will be discussed in Section 4, this hypothetical example has some resemblance to recent sulfur dioxide air quality history which involves an apparent paradox of increasing national SOx emission trends accompanied by decreasing urban sulfur dioxide concentrations.
For cases such as the example above, where significant changes in spatial patterns of emissions occur, mathematical-meteorological models are most appropriate for relating ambient
sulfur dioxide air quality to emission levels. Several of these models, which account explicitly for source location, sulfur dioxide oxidation rates, sulfur dioxide deposition rates, and regional meteorology, have been developed (Shir and Shigh 1974, Roberts et al., Randerson 1970). It is not necessary here to review these models but rather to point out the type of problem which requires their application.
SULFATE AIR QUALITY
There are two principal methods by which natural sources produce sulfate particulate matter: the formation of sulfate from the oxidation of naturally occurring sulfur dioxide and the emission of sulfate as part of the sea spray aerosol (Kellogg et al. 1972). In remote areas which are not downwind of concentrated man-made sources, sulfate levels tend to average in the range of 1 to 4 ug/m3 (Georgii 1970, Junge et al. 1969, Junge 1963). (A major exception involves remote areas in oceanic or sea shore environments which are very near the influence of strong wave action. Close to intensive breaker activity, sulfate levels can average as high as 5 to 20 ug/m3. However, this sea salt influence tends to drop off rapidly as distance inland increases. Recent measurements indicate that more normal background levels are reached within a few hundred yards of the breaker activity.)
This range appears to be a reasonable indication of natural background concentrations. However, it should be noted that even remote areas may be significantly influenced by long term transport from anthropogenic sources. Man-made SOx emissions, which are presently estimated to be about two-thirds as great as natural emissions on a global basis, are continually oxidized to form sulfate aerosol; these man-made contributions may constitute a significant fraction of sulfate measurements in remote areas.
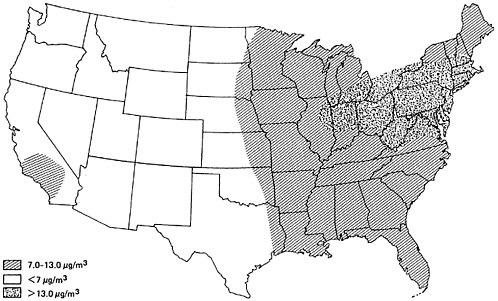
Sulfate levels in urban areas are higher than background levels due to the influence of man-made emission sources. During the late 1960’s, about 85 percent of measured annual average sulfate levels in urban areas east of the Mississippi ranged from 7 to 20 ug/m3 (Altshuller 1973, EPA 1972, 1971). The average of all eastern urban NASN monitoring sites was 12.5 ug/m3 from 1964 to 1968 (Altshuller 1973). Urban sulfate concentrations in the west are generally about half as great as in the east. During the late 1960’s, west of the Mississippi, about 85 percent of annual average sulfate levels in urban areas fell in the range of 3 to 10 ug/m3 (Altshuller 1973, EPA 1972, 1971). The average among all western NASN urban monitoring sites was 6.4 ug/m3 from 1964 to 1968 (Altshuller 1973). One major anomaly in the western United States is the Los Angeles area, where annual average sulfate ranges from 10 to 15 ug/m3 (MacPhee and Wadley, EPA 1972, 1971). As will be discussed later, overall ambient sulfate levels have remained relatively constant in the past decade; therefore, the average concentrations measured in the late sixties are probably indicative of present conditions.
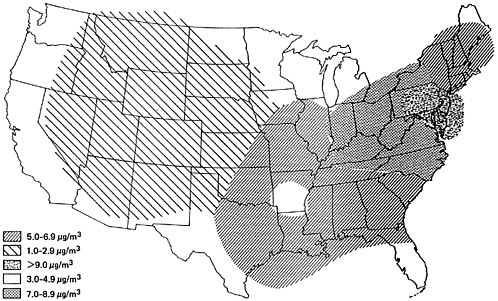
Figures 6–4 and 6–5 present the geographical distributions of typical sulfate concentrations for urban and nonurban locations, respectively (EPA 1974). A significant feature of each map is the particularly high sulfate level found in the industrialized northeast sector of the country which has the greatest SOx emission density (Figure 6–2.)
The Relationship Between Sulfate Air Quality and Sulfur Oxide Emissions
The relationship between emitted SOx and ambient SO4 concentrations is very complex and is the subject of much current research. Considerable uncertainty exists concerning the present state of knowledge; models are not now available for accurately relating SOx emissions to atmospheric sulfate concentrations. However, the general form of the relationship can be
analyzed by considering some known aspects of the chemical transformation processes and by examining certain atmospheric empirical evidence.
As noted previously, nearly all (>98 percent) SOx is emitted as sulfur dioxide. A variety of processes exist for oxidizing sulfur dioxide to yield sulfate aerosol. The relative importance of the various possible mechanisms is uncertain and depends heavily on local conditions. However, three general oxidation processes have been identified which appear to be significant for urban areas:
-
Photochemically-induced oxidation of sulfur dioxide to sulfur trioxide with subsequent reactions yielding sulfuric acid or sulfates.
Irradiation of sulfur dioxide, water, and clean air mixtures yields oxidation rates which are too slow to be significant in urban areas, (Bufalini 1971, HEW 1970, Urone et al. 1968, Gerhard and Johnstone 1955). However, when hydrocarbons and nitrogen oxides are added to such mixtures, substantial oxidation rates can result (Bufalini 1971, HEW 1970, Wilson and Levy 1968, Renzetti and Doyle 1960). It has been postulated that sulfur dioxide is oxidized to sulfur trioxide by an intermediary product of the HC/NOx photochemical reaction system. Once sulfur dioxide is oxidized to sulfur trioxide, subsequent reactions of sulfur trioxide with water (and particulates) yield sulfuric acid and other sulfates.
-
Absorption of sulfur dioxide into aqueous droplets with subsequent catalytic oxidation.
Numerous substances, particularly certain metallic salts (e.g., of iron, vanadium, or manganese), are effective in catalytically oxidizing sulfur dioxide (HEW 1970, Junge and Ryan 1958). The absorption of sulfur dioxide into water droplets, followed by catalytic oxidation from dissolved metallic salts, can be an important mechanism of sulfate production. In this chemical
-
mechanism, atmospheric ammonia may play a significant role by neutralizing some of the sulfuric acid built up in the droplet. (Sulfur dioxide becomes less soluble as acidity increases.) (Roberts 1974, HEW 1970).
-
Adsorption of sulfur dioxide on solid particles and subsequent reaction with adsorped oxygen.
There is evidence that adsorption and subsequent oxidation of sulfur dioxide on particle surfaces may be an important mechanism of sulfate production in urban atmospheres. Carbonaceous (soot) particles as well as metal oxide particulates are potential sites for this process.
From the description of the above processes, it is apparent that several factors are important in determining the degree to which sulfur dioxide will be converted to sulfuric acid and other sulfate aerosols. Significant atmospheric factors include the:
-
presence of HC and NOx
-
presence of catalysts
-
presence of atmospheric ammonia
-
presence of adsorbent particles
-
solar radiation intensity
-
temperature and humidity
Actual measurements indicate that the rate of sulfate formation is very sensitive to these factors. Measured oxidation rates vary from approximately .01 to 50 percent per hour. Another important factor affecting the total amount of sulfate produced is residence time in the atmosphere—the longer the time for reaction, the greater the conversion of sulfur dioxide to sulfate.
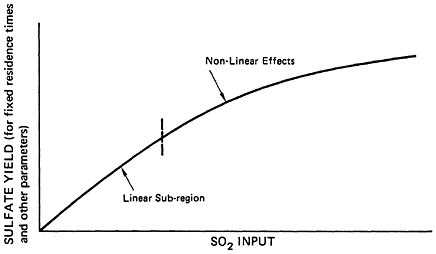
As to the dependence of sulfate on sulfur dioxide, it appears that at low sulfur dioxide concentrations all three of the chemical reaction mechanisms are such that the rate of sulfate production is directly proportional to sulfur dioxide concentrations. For given values of the other relevant parameters and for a given residence time, the amount of sulfate yield would be directly proportional to sulfur dioxide input. However, at higher sulfur dioxide concentrations, there are reasons to expect that
sulfate yield would become less than proportional to total sulfur dioxide input. First of all, at higher sulfur dioxide levels, insufficient ammonia may be present in the ambient air to prevent aqeous droplets from becoming strongly acidic. Since sulfur dioxide is less soluble in acid solutions, the depletion of ammonia would reduce the rate of sulfate production from process (2) above (Roberts 1974, Junge and Ryan 1958). Second, theoretical analyses of the gaseous reactions in mechanism (1) have indicated that the relative rate of oxidation should decrease at higher sulfur dioxide levels (Roberts 1974, Cox and Penkett 1972). Third, process (3) may yield non-linear results at high sulfur dioxide levels due to saturation of adsorption sites (Roberts 1974).
The implications of the above discussion of the chemical reaction mechanisms are summarized in Figure 6–6a, which provides a qualitative illustration of the dependence of sulfate levels on sulfur dioxide input for fixed residence time and other parameters. At low sulfur dioxide levels, the dependence should be nearly linear. At higher sulfur dioxide levels, nonlinear saturation effects take hold and the relationship becomes less than proportional. The sulfur dioxide level at which nonlinearities set in is not known; this critical level will vary from case to case and will depend on the key parameters described previously (e.g., amounts of NH3, HC, NOx present, adsorbent surface, etc.).
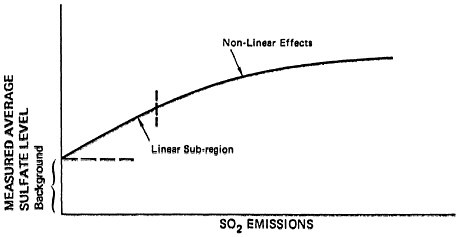
Actually, in a real air basin one would expect a slightly modified picture. A background sulfate level will exist due to natural sources as well as to man-made emissions external to the region in question. Thus, the effect of man-made sulfur dioxide emissions in a region on sulfate levels for that region should be as depicted in Figure 6–6b. Figure 6–6b is similar to Figure 6–6a except that sulfate levels reduce to a finite background level when sulfur dioxide emissions are eliminated.
Atmospheric data appear to be consistent with the above discussion of the dependence of sulfate on sulfur dioxide. Altshuller analyzed NASN sulfate and sulfur dioxide data from 18
urban monitoring sites for the period 1964 to 1968. He found that annual average sulfate levels initially increased linearly above mean background concentrations when plotted against annual average sulfur dioxide, but that sulfate formation levelled off at higher sulfur dioxide levels. A similar nonlinearity was observed in a recent study of Los Angeles data (Trijonis et al. 1974). However, these aerometric results do not necessarily confirm the theory that basic non-linearities exist in the relationship of sulfate yield to sulfur dioxide input, since alternative explanations have been suggested for the appearance of non-linearities in the atmospheric data (Frank 1974).
One further point should be mentioned concerning the relationship of sulfate air quality to SOx emissions. The above discussion of the dependence of sulfate on SOx emissions is appropriate to the case when all emission sources in a region are altered in the same proportion (i.e., when the relative spatial distribution of emissions remains fixed). Urban sulfate levels may not respond to total SOx emissions in a consistent manner if the spatial distribution of emissions is changed. It may be possible to increase total SOx emissions in a region but yet decrease urban sulfate concentrations (or alternatively to decrease total SOx emissions but increase sulfate), by changing the spatial pattern of emissions. Generally, for urban regions with significant photochemical smog activity or with high concentrations of atmospheric catalysts (e.g., from metallurgical industries), local SOx sources are much more important, on a per ton basis, than distant SOx sources to local sulfate air quality. This is because high local oxidation rates lead to considerable sulfate production from local SOx emissions. For regions with very low oxidation rates, e.g., regions with little photochemical smog and low levels of atmospheric catalysts, distant sources could be more important, on a per ton basis, than local sources to sulfate air quality.
One aspect of SOx emission distribution deserves special note. SOx emissions from stacks are probably more important than ground
level SOx emissions to sulfate levels some distance downwind of the source area. SOx emissions from ground level sources encounter more initial interaction with plants and soil; thus, a good bit of the sulfur dioxide is lost by dry deposition before sulfate can be formed. Research has not yet delineated the general significance of this factor. In any case, before this factor can be used as an argument against tall stack control, it should be remembered that sources which are suitable for tall stacks usually will be fitted with some sort of stack; the dry deposition factor is most relevant in comparing ground level sources vs. stack sources and may not be very significant in comparing medium stacks vs. tall stacks (Gifford 1975; Bolin et al. 1974).
Mathematical-meteorological models which can accurately assess the impact of changes in spatial distribution of SOx emissions on sulfate air quality are only in the initial stage of development, (Altshuller 1974, Mills 1974). Reliable models of this type do not now exist. One of the main difficulties involved in formulating these models is the uncertainty that exists concerning sulfur dioxide oxidation rates under various atmospheric conditions. Uncertainty also exists concerning pollutant deposition to the ground and dispersal at the top of mixing layers.
AMBIENT AIR QUALITY TRENDS FOR SULFUR DIOXIDE AND SULFATE
Figure 6–7 summarizes recent trends (1964 to 1971) in ambient sulfur dioxide concentrations at urban monitoring sites in the United States (EPA 1973). Table 6–4 provides the trend in terms of the number of violations of the annual Federal primary air quality standard for sulfur dioxide (EPA 1973). It is evident that substantial improvement in sulfur dioxide air quality has occurred at urban monitoring sites from 1964 to 1971. The average sulfur dioxide level for urban NASN stations decreased by about 50 percent, and the number of stations violating
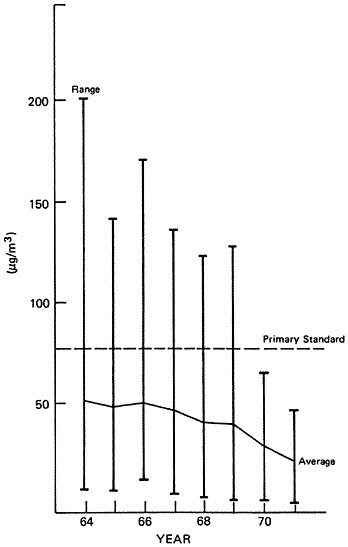
TABLE 6–4
Number of NASN Stations Exceeding Primary and Secondary Annual Mean Standards for Sulfur Dioxide, 1964–1971
|
|
1964 |
1965 |
1966 |
1967 |
1968 |
1969 |
1970 |
1971 |
|
Total Number of Stations |
18 |
17 |
15 |
29 |
74 |
88 |
86 |
54 |
|
Number>Primary Standard (80 μg/m3 Annual Mean) |
6 |
6 |
5 |
6 |
10 |
6 |
3 |
0 |
|
Percent>Primary Standard |
33 |
35 |
33 |
21 |
14 |
7 |
3 |
0 |
the national primary standard has dropped from about one-third of the total to zero.
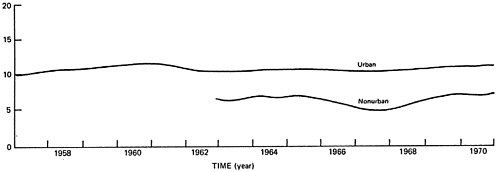
Sulfate trends for urban NASN monitoring sites are summarized in Figure 6–8 (EPA 1973). This figure does not indicate any discernable long term trend in urban sulfate concentrations. A recent statistical study of NASN data (Frank 1974) has confirmed the conclusion that urban sulfate levels have remained essentially unchanged from 1964 to 1970.
The data on SOx emission trends (Table 6–2) and on sulfur dioxide and sulfate ambient air quality trends (Figures 6–7 and 6–8) present an apparent paradox. During the 1960’s, total SOx emissions increased by 45 percent on a nationwide basis. In contrast, urban sulfur dioxide concentrations decreased by about 50 percent while average urban sulfate levels remained constant during this period.
A more in-depth analysis of changes in SOx emission during the 1960’s provides a plausible explanation for these trends. Although total SOx emissions increased, there was also a significant shift in the spatial distribution of emissions. The SOx emission increase occurred primarily at large point sources, about seven-eighths of the increase being from electric power plants and about one-eighth from industrial process sources. Many of these facilities are located outside central-city areas and/or are equipped with tall stacks. Those large sources which were situated in central-city areas tended to be most affected by air pollution control policies; they either switched to cleaner fuels, relocated, or phased down their operating levels (Frank 1974, EPA 1973). Thus, the SOx emission increase tended to occur at facilities with large stacks and in locations away from central-city areas. In fact, emissions from point sources in urban areas might actually have decreased.
Furthermore, the most significant ground-level sources of SOx emissions in urban areas, (residential and commercial sources) exhibited a significant decrease in SOx emissions.3
Central-city/ground-level emissions are substantially more important to central-city/ground-level ambient air quality than are
rural and/or tall stack emissions. Modeling studies, as well as some aeormetric data, indicate that (on a per ton basis) ground level emissions are typically about 5 to 10 times more important (EPA 1973, Wiedersum and Barr 1973, Woodburg 1972, Golden and Morgan 1971, National Air Pollution Control Adm. 1970). The relative importance (to central-city sulfur dioxide air quality) of central-city emissions compared to rural emissions is probably much greater. With these factors in mind, it seems reasonable to expect that reductions in urban SOx emissions could lead to significant improvement in central-city/ground-level sulfur dioxide air quality in spite of an increase in total, nationwide SOx emissions. Apparently this is what has happened.
The absence of significant urban sulfate trend can be accounted for in a manner consistent with the above discussion. Since sulfur dioxide emissions continually oxidize to form sulfate, distant sources are relatively more important for determining ambient sulfate levels than they are for determining ambient sulfur dioxide contributions.
An indication that long-term transport is more important for sulfate than for sulfur dioxide is that sulfate concentrations at non-urban sites are often greater than sulfur dioxide concentrations at those sites. This is particularly evident in the northeastern United States, where non-urban sulfate levels range from 6–12 ug/m3. The non-urban air quality picture is in contrast with the urban situation, where sulfur dioxide concentrations are typically 4 to 5 times greater than sulfate concentrations.
It has been estimated that distant sources are about one-half as important (on a per ton basis) as urban, ground-level sources to formation of urban, ground-level sulfate (EPA 1974). This estimated relative importance for urban sulfate air quality is significantly greater than the relative importance attached to the contribution of distant emissions to urban sulfur dioxide air quality. For urban sulfate formation, it is quite possible that the increase is SOx emissions from tall stacks
and/or from rural areas was enough to negate the decrease in central-city/ground-level SOx emissions; thus urban sulfate levels remained relatively constant.
Another important factor in explaining the absence of an increase or decrease in ambient sulfate concentrations may be the nonlinearities involved in the sulfur dioxide/sulfate relationship. As mentioned in the previous section, sulfate should increase proportional to the increase in sulfur dioxide ambient concentrations at low sulfur dioxide levels. However, at higher sulfur dioxide concentrations, sulfate formation may level off due to saturation effects which tend to cause sulfate production to be insensitive to variations in sulfur dioxide levels.
Ambient Non-urban Trends
It was suggested above that trends in urban concentrations of sulfur dioxide and sulfate could be explained by the recent increase in rural, tall stack SOx emissions, accompanied by a concomitant decrease in central-city/ground-level SOx emissions. In order to further support this hypothesis, it would be useful to examine ambient non-urban sulfur dioxide and sulfate trends.
Unfortunately, sulfur dioxide data from non-urban locations are extremely sparse. Yearly sulfur dioxide summaries from NASN data are typically available only for about 5 to 7 non-urban locations, and the locations reporting information often differ from year to year (EPA 1972, 1972, 1971). A recent report on ambient sulfur dioxide trends concluded that sulfur dioxide data at non-urban stations are too scarce to justify formal analysis (EPA 1973).
Considerable data are available on non-urban sulfate concentrations. Appendix A presents the annual average sulfate levels measured at non-urban sites from 1960 to 1970. These data have been interpreted as indicating that non-urban sulfate levels have remained relatively constant during the 1960’s. This interpretation is based on the non-urban sulfate line in Figure 6–8.
However, Figure 6–8 is a smoothed trend line fit to the averages of all non-urban NASN measurements. As indicated in Appendix A, a considerable number of new non-urban monitoring sites were added in the mid-1960’s; thus, the non-urban trend line in Figure 6–8 represents different sets of locations during different years. In order to examine trends in a rigorous manner, the measurements from year to year should be examined for the same set of locations.
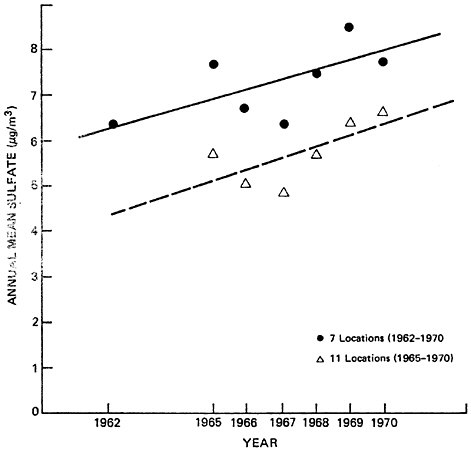
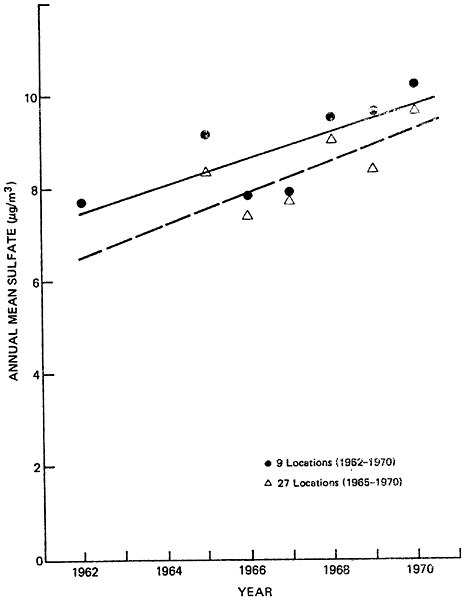
Figures 6–9a and 6–9b summarize average non-urban sulfate concentrations for fixed sets of locations during the 1960’s. Figure 6–9a represents nationwide data, while figure 6–9b includes northeastern locations only. Data are sufficient to establish average non-urban trends from 1962 to 1970 at only 9 locations nationwide, and 7 locations in the northeast. Non-urban sulfate trends can be examined at 27 nationwide locations (including the aforementioned 9 sites) and 11 northeastern locations (including the aforementioned 7 sites) for the years 1965 to 1970.
Although the non-urban sulfate averages fluctuate from year to year, Figures 6–9a and 6–9b do indicate a general increase in sulfate concentrations, both nationwide and in the northeast. This result is in contrast with the non-urban sulfate data in Figure 6–8, which did not indicate a distinct trend. In Figure 6–8, the increasing non-urban sulfate trend was apparently disguised by the addition of data in the mid-60’s from new monitoring sites which had lower average sulfate levels than the locations which provided data during the early 1960’s.
The data in Figures 6–9a and 6–9b are not conclusive enough to support firm, quantitative analysis. However, if one accepts the validity of the upper (9 and 7 station) trend lines and assumes an average natural background level of 1 to 4 ug/m3, it appears that man-made sulfate has increased by about 40 to 100 percent in non-urban areas during the 1960’s. This increase is qualitatively in agreement with the trends in SOx emissions which were discussed earlier.
THE AIR QUALITY IMPACT OF PROJECTED INCREASES IN POWER PLANT EMISSIONS
As noted in Section 1 of this paper, recent forecasts indicate that power plant SOx emissions will double between 1970 and 1980, assuming that no new emission control program are initiated. This section will examine the likely impact on sulfur dioxide and sulfate air quality to be expected if this increase in emissions is allowed to happen. The projected SOx emission increase will tend to occur at power plants which are located outside of central-city areas and/or which are equipped with tall stacks. Little deterioration in urban sulfur dioxide air quality would be expected form such an SOx emission increase. However, the increase in sulfate concentrations could be very significant.
A thorough and systematic investigation of the air quality impact associated with increased SOx emissions from power plants should be carried out on a region by region basis. Mathematical-meteorological models should be utilized to calculate changes in sulfur dioxide air quality due to increased total SOx emissions as well as to shifts in the spatial distribution of those emissions. Although sophisticated meteorological models are not available for explaining the effect on sulfate levels due to changes in SOx emissions, simplified quantitative analyses should be performed for sulfates which take into account local background levels and significant features of the spatial distribution of emissions. Such a detailed analysis is not possible within the time frame of this study; here, only a very approximate estimate will be made of the total nationwide impact on sulfur dioxide and sulfate levels.
For the purposes of this discussion, it will be assumed that power plant SOx emissions will double from 1970 to 1980 and that SOx emissions from other sources will remain constant. This hypothetical situation is summarized in Table 6–5. It will also be assumed that the increase in power plant SOx emissions will occur at plants which are equipped with tall stacks and/or which
TABLE 6–5
The Hypothetical National SOx Emission Increase to be Evaluated Here
|
|
1970 Emissions (1000 tons/year) |
1980 Emissions (1000 tons/year) |
|
Power Plants |
19,000 |
38,000 (+100%) |
|
Other Sources |
14,000 |
14,000 |
|
Total |
33,000 |
52,000 (+58%) |
TABLE 6–6
Urban SO2 Air Quality Projections
|
|
1970 |
1980 |
|
A. Power Plant SOx Emissions (tons/year) |
19×106 |
38×106 |
|
B. Other SOx Emissions (tons/year) |
14×106 |
14×106 |
|
|
Change |
|
|
Factor: 0 Weighted Emissions (0 A+B) |
14×106 |
14×106 (0%) |
|
Factor: 1/5 Weighted Emissions (1/5 A+B) |
17.8×10⁶ |
21×106 (+21%) |
|
Note that natural background SO2 concentrations are neglected in these SO2 air quality forecasts. This is reasonable since average natural background levels of SO2 are much smaller than average urban SO2 concentrations. |
||
are located outside contral-city areas. As noted earlier, these “distant” emissions tend to be less important to urban/ground-level air quality than emissions from urban/ground-level sources. The impact on urban air quality will be calculated here by assigning relative importance factors to power plant emissions compared to emissions from other sources.
TABLE 6–5. THE HYPOTHETICAL NATIONAL SOx EMISSION INCREASE TO BE EVALUATED HERE
|
|
1970 Emissions |
1980 Emissions |
|
Power Plants |
19,000 |
38,000 (+100%) |
|
Other Sources |
14,000 |
14,000 |
|
Total |
33,000 |
52,000 (+58%) |
On a per ton basis, urban/tall stack SOx emissions are about 1/5 or 1/10 as important to urban/ground-level sulfur dioxide concentrations as are emissions from urban/ground-level sources, (see discussion in previous section). Also, on a per ton basis, rural SOx emissions are of essentially negligible importance to urban sulfur dioxide air quality as compared to urban SOx emissions. With these considerations in mind, it appears reasonable to assign a range of near 0 to 1/5 for the relative importance factor of power plant SOx emissions vs. other SOx emissions to urban/ground-level sulfur dioxide air quality. Using this range, the forecasted increase in national urban/ground-level sulfur dioxide concentrations from the projected increase in power plant SOx emissions would be expected to range from near 0% up to 20%. (See Table 6–6).
The relative importance of “distant” SOx emission sources as compared to urban/ground-level SOx sources to urban/ground-level sulfate depends a great deal on regional characteristics. For urban areas with substantial photochemical smog activity or with high concentrations of atmospheric catalysts (e.g., from metallurgical industries), local SOx
sources are much more important to resulting local sulfate air quality on a per ton basis, than are distant SOx sources. In these urban areas, high local oxidation rates lead to considerable sulfate formation from local SOx emissions, and, the relative importance factor for distant emissions would be low (Finklea, personal conversation 1974). In the opposite situation, for urban areas with very low oxidation rates due to the absence of both photochemical activity and atmospheric catalysts, distant SOx sources can be of equal or greater importance to resulting sulfate air quality on a per ton basis than local SOx sources (Finklea, Personal Conversation 1974). In such cases, the relative importance factor for distant SOx emissions sources could reach (or exceed) one.
Recent EPA studies of trends in SOx emissions and sulfate air quality for different regions have shed some light on the issue of relative importance of distant vs. local sources to sulfate air quality (Finklea, personal conversation 1974). From the results of these studies, it would appear that the average nationwide relative importance factor for distant sources compared to local sources, on a per ton basis, lies between 1/4 and 1. It is assumed here that this range is appropriate in comparing power plant SOx emissions to SOx emissions from other sources. By accepting this range, by accounting for natural background sulfate concentrations, and by using a linear relationship of ambient sulfate concentrations, to SOx emissions, the forecasted increase in urban sul fate levels due to the projected doubling of power plant emissions would be +20 percent to +40 percent (See Table 6–7). As noted in Section 3, the increase in sulfate may be less than this due to nonlinearities in the relationship of sulfate to sulfur dioxide. To allow for uncertainty concerning the non-linear effect, the lower bound of the estimated urban sulfate increase should be reduced. A predicted urban sulfate increase in the range of 10 percent to 40 percent appears reasonable.
To summarize, we have examined the impact on urban sulfur dioxide and sulfate air quality to be expected from a hypothetical doubling of
TABLE 6–7
Urban Sulfate Air Quality Projections
|
|
1970 |
1980 |
|
A. Power Plant SOx Emissions (tons/year) |
19×106 |
38×106 |
|
B. Other SOx Emissions (tons/year |
14×106 |
14×106 |
|
|
Change |
|
|
Factor: 1/4 Weighted Emissions (1/4A+B) |
18.75×10⁶ |
23.5×10⁶ (+25%) |
|
Factor: 1 Weighted Emissions (1 A+B) |
33×106 |
52×106 (+58%) |
|
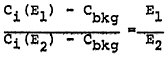
Average 1970 urban sulfate concentrations were 10 μg/m3, of which about 3 μg/m3 was natural background. The weighted emission changes calculated above apply only to man-made contributions. Thus, accounting for the natural background levels, the total sulfate changes would be |
||
|
|
||
|
and |
||
|
|
||
power plant SOx emissions. Properly, such an analysis should be carried out on a region by region basis, using available models for sulfur dioxide and formulating simple quantitative models for sulfate. Because of time limitations, only a very approximate estimate of nationwide air quality changes is presented here. This estimate indicates that the expected increase in nationwide urban sulfur dioxide concentrations would be in the range of 0 percent to 20 percent, while the likely increase in nationwide urban sulfate concentrations would range from 10 percent to 40 percent.
TABLE 6–8
NASN Nonurban Annual Arithmetic Mean Sulfate Concentrations μg/m3
LITERATURE CITED
Altshuller, A.P. (1973) Atmospheric Sulfur Dioxide and Sulfate, Environmental Science and Technology, Vol. 7, p. 709.
Altshuller, A.P. (1974) Director of the EPA Chemistry and Physics Laboroatory. Research Triangle Park, North Carolina, personal communication, November.
Appel, B. (1974) Sulfate and Nitrate Chemistry in Photochemical Smog, presentations before the Division of Environmental Chemistry, American Chemical Society, Los Angeles, April.
Bolin, B., G.Aspling, and C.Persson (1974) Residence Time of Atmospheric Pollutants as Dependent on Source Characteristics, Atmospheric Diffusion Processes, and Sink Mechanisms, Tellus, Vol. XXVI, p. 195.
Bufalini, M. (1971) Oxidation of Sulfur Dioxide in Polluted Atmospheres—A Review, Environmental Science and Technology, Vol 5, August.
Cadle, R.D., W.H.Fischer, E.R.Frank, and J.P. Lodge, Jr. (1968) Particulates in the Antarctic Atmosphere, J. Atmos. Sci., Vol. 25, p. 100.
Cavender, J.H., D.S.Kircher, and A.J.Hoffman (1973) Nationwide Air Pollutant Emission Trends 1940–1970, Office of Air and Water Programs, Environmental Protection Agency, Publication No. AP-115, January.
Cox, R.A. and S.A.Penkett (1972) Aerosol Formations from Sulfur Dioxide in the Presence of Ozone and Olefinic Hydrocarbons, Journal of the Chemical Society, Faraday Transactions 1, Vol. 68, p. 1735.
Finklea, John (1974) Director of National Environmental Research Center, personal conversation, December.
Frank, Neil H. (1974a) Temporal and Spatial Relationships of Sulfates, Total Suspended Particulates, and Sulfur Dioxide, presented at the 67th Annual Meeting of the Air Pollution Control Association, Denver, Colorado, June 9–13.
Frank, Neil H. (1974b) Office of Air Quality Planning and Standards, U.S. Environmental
Protection Agency, Research Triangle Park, North Carolina, personal communication. December.
Georgii, H.W. (1970) Contribution to the Atmosphere Sulfur Budget, Journal of Geophys. Res., Vol. 75, p. 2365.
Gerhard, E.R. and E.F.Johnstone (1955) Photochemical Oxidation of Sulfur Dioxide in Air, Ind. Eng. Chem., Vol 47, May.
Gifford, Frank (1975) National Oceanic and Atmospheric Administration, personal communication, February.
Golden, J. and T.R.Morgan (1971) Sulfur Dioxide Emissions from Power Plants: Their Effect on Air Quality, Science, Vol. 171, January 29, p. 381.
Hidy, G.M. P.K.Mueller et. al. (1973) Observations of Aerosols over Southern California Coastal Waters, submitted to Journal of Applied Meteorology, May.
Holzworth, G.C. (1959) Atmospheric Contamiation at Remote California Sites, J. Meteorol. Vol. 16, February.
Junge, C.E. (1963) Air Chemistry and Radioactivity, Academic Press, New York.
Junge, C.E. and T.Ryan (1958) Study of Sulfur Dioxide Oxidation in Solution and Its Role in Atmospheric Chemistry, Quart. J. Roy. Meteorol. Soc., Vol. 84, January.
Junge, C.E., E.Robinson, and F.L.Ludwig (1969) A Study of Aerosols in Pacific Air Masses, J. Appl. Meteor. Vol. 8, p. 340.
Kellogg, W.W., R.D.Cadle, E.R.Allen, A.L. Lazrus, and E.A.Martell (1972) The Sulfur Cycle, Science, Vol. 175, February 11, p. 587.
Lodge, J.P., Jr. and J.B.Pate (1966) Atmospheric Gases and Particulates in Panama, Science, Vol. 153, p. 408.
Lovelock, J.E., R.J.Maggs, and R.A.Rasmussen, (1972) Atmospheric Dimethyl Sulfide and the Natural Sulfur Cycle, Nature, Vol. 237, June 23, p. 452.
MacPhee, R.D. and M.W.Wadley (19) Airborne Particulate Matter in the Los Angeles Region, Reports for 1965–1972, Los Angeles County Air Pollution Control District Technical Services Division Reports.
Mills, M.T. (1974) Proposed Sulfate Modeling Effort, A Discussion Document Prepared for the Environmental Protection Agency under Contract No. 68–02–1337, GCA Corporation, Bedford, Massachusetts, October.
National Academy of Engineering (19) Abatement of Sulfur Oxide Emissions from Stationary Combustion Sources, COPAC-2.
National Academy of Sciences (1974) Air Quality and Automobile Emissions Control: Volume 3, The Relationship of Emissions to Ambient Air Quality, Serial No. 93–24, September.
National Air Pollution Control Administration (1970) Impact of Source Types on Sulfur Dioxide Air Quality—Urban and Rural, Internal Draft Report, Division of Meteorology, April.
Randerson, D. (1970) A Numerical Experiment in Simulating Transport of Sulfur Dioxide Through the Atmosphere, Atmospheric Environment, Vol. 4, p. 615.
Renzetti, N.A. and G.J.Doyle (1960) Photochemical Aerosol Formation in Sulfur Dioxide-Hydrocarbon Systems, International Journal of Air Pollution, Vol. 2, June.
Roberts, J.J., J.E.Norco, A.S.Kennedy, and E.J.Kroke (19) A Model for Simulation of Air Pollution Transients, 2nd International Clean Air Congress, p. 1161.
Roberts, Paul (1974) Graduate Student in Environmental Health Engineering, California Institute of Technology, personal communication, June.
Shir, C.C. and L.J.Shigh (1974) A Generalized Urban Air Pollution Model and Its Application to the Study of Sulfur Dioxide Distributions in the St. Louis Metropolitan Area, Journal of Applied Meteorology.
Smith, B.M., J.Wagman, and B.R.Foh (1969) Interaction of Airborne Particles with Gases, Environmental Science and Technology, vol. 3.
Trijonis, J., G.Richard, K.Crawford, and R.Tan (1974) A Particulate Implementation Plan for the Metropolitan Los Angeles Region, Final Report-Preliminary Draft, prepared for the Environmental Protection Agency, Contract No. 68–02–1384, October.
U.S. Department of Health, Education, and Welfare (1970) Air Quality Criteria for Sulfur Oxides, Publication No. AP-50, April.
U.S. Environmental Protection Agency (1971) Air Quality Data for 1967, Division of Atmospheric Surveillance, Publication No. APTD 69–22, August.
U.S. Environmental Protection Agency (1972) Air Quality Data for Sulfur Dioxide, 1969, 1970, and 1971, Office of Air Programs, Publication No. APTD-1354, November. U.S. Environmental Protection Agency (1972) Air Quality Data for 1968, Division of Atmospheric Surveillance, Publication No. APTD-0978, August.
U.S. Environmental Protection Agency (1973) Summary Report on Suspended Sulfates and Sulfuric Acid, Preliminary Draft Report, October.
U.S. Environmental Protection Agency (1973) National Air Quality Levels and Trends in Total Suspended Particulates and Sulfur Dioxide Determined by Data in the National Air Surveillance Network, Office of Air Quality Planning and Standards, April.
U.S. Environmental Protection Agency (1973) The National Air Monitoring Program: Air Quality and Emission Trends Annual Report, Volume I, Office of Air Quality Planning and Standards, Publication No. EPA-450/1–73–001a, August.
U.S. Environmental Protection Agency (1974) Briefing Notes—A Status Report on Sulfur Oxides, Preliminary Draft Report, Office of Research and Development, April.
U.S. Environmental Protection Agency (1974) 1972 National Emissions Report, Monitoring and Data Analysis Division, June.
Urone, P., H.Lutsep, C.M.Nozes, and J.F.Parcher (1968) Static Studies of Sulfur Dioxide Reactions in Air, Environmental Science and Technology, Vol. 2.
Wiedersum, G.C. and S.Barr (1973) The Effects of Power Plant Stack Emissions on the Ground Level Sulfur Dioxide Concentrations in an Urban Area, presented at the 66th Annual Meeting of the Air Pollution Control Association, Chicago, June 24–28.
Wilson, W.E., Jr. and A.Levy (1968) A Study of Sulfur Dioxide in Photochemical Smog, American Petroleum Institute, Project S-11, Batelle Memorial Institute.
Woodbury, H.G. (1972) Statement on the New York State Implementation Plan to Achieve Air Quality Standards for the Metropolitan New York Air Quality Control Region.


