
CHAPTER 7
SULFATES AND ACIDITY IN PRECIPITATION: THEIR RELATIONSHIP TO EMISSIONS AND REGIONAL TRANSPORT OF SULFUR OXIDES
(Chapter 7 was written by Ian Nisbet under the general supervision of the committee, which reviewed the work at several stages and suggested modifications which have been incorporated. While every committee member has not necessarily read and agreed to every detailed statement contained within, the committee believes that the material is of sufficient merit and relevance to be included in this report.)
INTRODUCTION
The principal route by which sulfates are returned to earth is in precipitation (Kellogg et al. 1972, Rodhe 1972, Robinson and Robbins 1968, Eriksson 1963, Bolin et al. 1971). Hence—with certain important limitations to be discussed below—the occurrence of sulfates in precipitation can provide useful information about the distribution and deposition of sulfates. Such information is needed to complement the somewhat limited data provided by direct measurements of ambient concentrations of suspended sulfates. This chapter of the report summarizes observations of sulfates in precipitation, and uses them to amplify the evidence given in Chapter 6 for regional transport of sulfur oxides and a secular increase in sulfate concentrations. This section also summarizes measurements of the acidity of precipitation, which has attracted
much attention in recent years, both in North America (Likens et al. 1972, Likens and Bormann 1974, Cogbill and Likens 1974, Likens 1972) and in Europe (Bolin et al, 1971, Oden 1968, Brosset 1973).1 The acidity of rainfall is not only of importance in itself, because of its known or suspected effects on biological systems (Chapter 5), but can give indirect information—otherwise lacking-about the acidity of the suspended sulfates.
THE SULFUR CYCLE AND SULFATE DEPOSITION
The occurrence of sulfates in rain and snow must be interpreted in the context of the sulfur cycle in nature (Kellogg et al, 1972, Rodhe 1973, Robinson and Robbins 1968, Eriksson 1963, Bolin et al. 1971). Sulfur is introduced into the atmosphere by three principal routes: in spray from ocean waves (primarily in the form of neutral sulfates); by decomposition of biological materials (primarily in the form of hydrogen sulfide); and by combustion of fossil fuels (primarily in the form of sulfur dioxide). After transport and oxidation, it is returned to earth by four principal routes:
-
absorption of gaseous sulfur dioxide by the soil or vegetation;
-
deposition of sulfur dioxide in rain or snow;
-
deposition of sulfates (including sulfuric acid) in rain or snow;
-
dry deposition of particles containing sulfates.
Studies of the sulfur cycle (Kellogg et al. 1972, Rodhe 1972, Robinson and Robbins 1968, Eriksson 1963, Bolin et al. 1971) suggest that (a) and (c)—direct absorption of sulfur dioxide and deposition of sulfates in precipitation—are the most important routes of deposition. Concentrations of sulfur dioxide in precipitation appear to be generally low in comparison with those of sulfates (Miller and de Pena 1972, Dana et al. 1973), and suspended sulfates are generally on small particles which are deposited very slowly (Garland 1974).
On a global basis, deposition of sulfates in precipitation is estimated to account for 40–80 percent of the sulfur deposited on land; direct absorption of sulfur dioxide accounts for much of the rest (Kellogg et al. 1972, Rodhe 1972, Robinson and Robbins 1968, Eriksson 1963, Bolin et al. 1971). According to the models of sulfur transport and deposition outlined in Chapter 6 and in Chapter 13 (Appendix A), direct absorption will be relatively important in circumstances where the oxidation rate of sulfur dioxide to sulfates is low (especially in dry, unpolluted air). Deposition of sulfates will be more important where the oxidation rate of sulfur dioxide is high, or far downwind from sources where ambient concentrations of sulfur dioxide are low.
Two principal processes lead to the occurrence of sulfates, including sulfuric acid, in precipitation: (a) the absorption of sulfur dioxide into cloud droplets, with subsequent oxidation (Miller and de Pena 1972, Dana et al. 1973, Beilke and Georgii 1968, Petrenchuk and Drozdova 1966)2; (b) the uptake of suspended particulate sulfates into raindrops (Kellogg et al. 1972, Miller and de Pena 1972). Where the ambient concentration of sulfure dioxide is very high, the former process may be more important (Kellogg et al. 1972, Beilke and Georgii 1968, Petrenchuk and Drozdova 1966). However, where the ambient sulfur dioxide level is moderate or low, scavenging of suspended particulates (“washout”) is probably the dominant source of sulfates in precipitation (Likens 1972). Hence, close to major sources, the concentrations of sulfates and acidity in precipitation may be determined primarily by local oxidation of sulfur dioxide; far from major sources they are likely to reflect suspended sulfate levels. Thus, with due attention to the likely influence of local sources, regional patterns of deposition of sulfates can provide indirect information about the distribution of airborne sulfates.
SULFATES IN PRECIPITATION IN EASTERN NORTH AMERICA
Large-scale surveys of the chemical composition of precipitation in the United States were conducted in 1955–56 (Junge 1958, Junge and Werby 1958) and in 1965–66 (Pearson and Fisher 1971, Lodge et al. 1968, Gambell and Fisher 1966). By multiplying the average concentration of sulfates in precipitation by the observed rainfall for the year, it is possible to calculate the total amount of sulfur deposited in precipitation per unit area at each station. This has been done for the 1955–56 survey by Eriksson (1960), whose map of “excess”3 sulfur deposition is reproduced here as Figure 7–1. It will be seen that the rates of sulfur deposition were relatively high throughout the northeastern United States; the highest rates [up to 13 kilograms of sulfur per hectare per year (kg/ha/yr)] were observed in western Pennsylvania and western New York. (Eriksson’s map was based on data from the United States alone: in view of subsequent observations of high rates of deposition in southeast Ontario (Shiomi and Kuntz 1974)4 it is likely that the area of maximum deposition should be extended somewhat further to the north).
The data from the 1965–66 survey (Pearson and Fisher 1971, Lodge et al. 1968, Gambell and Fisher 1966), when treated in the same way, show a very similar pattern, but with consistently higher rates of deposition. At nine stations that were in operation during both surveys, the average rate of sulfur deposition was higher by 63 percent in 1965–66 than in 1955–56. Within the area outlined by the contour line for 9 kg/ha/yr in 1955–56, all stations operated in 1965–66 reported deposition rates between 13 and 20 kg/ha/yr. Similarly the contour line for 6 kg/ha/yr in 1955–56 corresponds closely to that for 10 kg/ha/yr in 1965–66. Thus there appears to have been an increase in total deposition of sulfur by 60–65 percent during the decade, with little change in the geographical pattern of distribution. In addition, the 1965–66 survey indicated especially high rates of deposition at three urban stations: Chicago (32–62 kg/ha/yr),
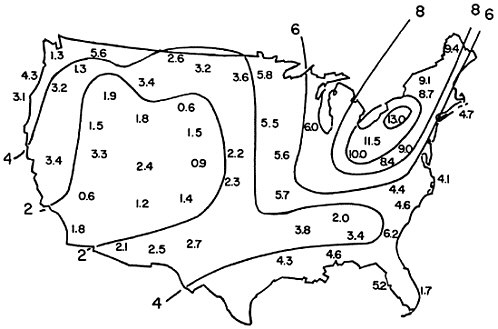
Albany (21 kg/ha/yr), and Philadelphia (19 kg/ha/yr).
No comprehensive survey has been conducted since 1965–66. Data obtained at Hubbard Brook, New Hampshire (Table 7–1) and in central New York (Likens 1972) suggest a levelling-off or even a decline in sulfur deposition rates between 1965–66 and 1970–71. However, relatively high deposition rates (average 17.2 kg/ha/yr) were recorded at seven stations in southern Ontario in 1970–71 (Shiomi and Kuntz 1974, see fn. 4); deposition at the Hubbard Brook station increased again to reach its highest level in 1972–73 (Table 7–1), and relatively high deposition rates were recorded at five other widely scattered stations operated by NOAA/EPA in 1972–73.5 Thus the available data are consistent with a continued, if irregular, increase in sulfur deposition in eastern North America since 1965–66.
By integrating the observed deposition rates in the areas marked on the maps in Figure 7–1, it is possible to estimate the total amount of sulfur that fell out as sulfates in precipitation in eastern North America in 1955–56. This estimate, together with corresponding estimates for 1965–66 and 1972–73, is given in Table 7–2 and compared to estimates of emissions in the same area. According to these estimates, deposition of “excess” sulfates in precipitation accounted for about one-third of the sulfur emitted into the air in eastern North America. This estimate is a minimal figure for the fraction of sulfur dioxide converted to sulfates, because some airborne sulfates must be carried eastwards over the North Atlantic Ocean.
During the 17-year period under review, total deposition of sulfates in eastern North America has roughly doubled (Table 7–2). This is probably less rapid than the increase in emissions from power plants (about 200 percent), but more rapid than the increase in total emissions in the area (about 50 percent). This suggests that power plants are somewhat more important than other sources in leading to sulfate formation—perhaps because sulfur dioxide emitted from stacks is mixed better with the atmosphere than sulfur dioxide emitted from
TABLE 7–1. Sulfur Deposition in Rain and Snow at Hubbard Brook, New Hampshire, 1965–73 (Likens and Bormann 1974, Cogbill and Likens 1974, Likens et al. 1971, Cogbill, personal communication)
|
Year |
1965–66 |
'66–'67 |
'67–'68 |
'68–'69 |
'69–'70 |
'70–'71 |
'71–'72 |
'72–'73 |
|
Mean sulfate concentration in bulk precipitation (mg/l) |
3.3 |
3.1 |
3.3 |
2.4 |
2.4 |
2.8 |
2.7 |
2.9 |
|
Total precipitation (mm) |
132 |
142 |
128 |
130 |
126 |
123 |
151 |
186 |
|
Calculated sulfur deposition (kg/ ha/yr) |
14.5 |
14.7 |
14.1 |
10.4 |
10.1 |
11.5 |
13.6 |
18.0 |
TABLE 7–2. Comparison of SO2 Emissions in Eastern North America1 with Total Deposition of Sulfates in Precipitation
(Units: Million tons sulfur)
|
|
1955–56 |
1965–66 |
1972–73 |
|
Estimated emissions |
|
|
|
|
Canada2 |
1.3 |
1.8 |
1.3 |
|
U.S.: Electric power plants3 |
2.9 |
5.6 |
8.9 |
|
U.S.: Other emissions3 |
3.6 |
3.4 |
3.6 |
|
Natural sources4 |
1.8 |
1.8 |
1.8 |
|
Total |
9.6 |
12.6 |
15.6 |
|
Estimated deposition in precipitation |
2.9 |
4.7 |
5.75 |
|
Deposition as % of emissions |
30% |
38% |
37% |
|
Notes: 1. The area considered is that from the Mississippi River east to the Atlantic Coast and Nova Scotia (60E), north of central Alabama (33N) and south of 50N (Winnipeg to the Gulf of St. Lawrence). 2. Canadian emissions for 1970 are given in Rennie and Halstead (1973): these were dominated by the emissions from the Sudbury smelters, which have probably been relatively constant during the period considered (Beamish and Harvey 1972, Balsillie, personal communication). 3. U.S. emissions were estimated by interpolating from the data for 1950, 1960, and 1970 in EPA (1973), assuming that 80 of power plant emissions and 50 of other emissions were in the area considered (cf. 13–10 and Figure 6–2). 4. Natural emissions were estimated by scaling the global estimate of ref. 1 in proportion to the area under consideration (about 2 percent of the earth’s land surface) (cf. Rodhe 1972). 5. An increase of 3 percent per year is assumed for the period 1965–1972: this is consistent with Table 7–1 and other data quoted in the text, and also with 6–9b. |
|||
low-level sources, and therefore has a longer period in which it can be oxidized to sulfates before it can be absorbed by the ground. If emissions from tall stacks and low-level sources are weighted in the ratio 2:1, the observed increase in sulfate deposition would be roughly parallel to that in the weighted emissions.
Very few data are available on sulfates in precipitation prio to the 1955 survey.6
ACIDITY OF PRECIPITATION IN EASTERN NORTH AMERICA
Acid rain and snow have been reported in a number of localities in the eastern and northeastern United States (Likens et al. 1972, Likens and Bormann 1974, Cogbill and Likens 1974, Likens 1972, Johnson et al. 1972). The only large-scale synoptic survey is a student-conducted study (Anon 1974) carried out between 15–31 March 1973.7 The results of this study, reproduced here as Figure 7–2, indicated that rain below the “normal” pH of 5.58 was falling throughout most of the eastern United States; the pH level was actually below 5.0 over extensive areas, especially in the Northeast. In addition there were small areas with precipitation pH below 4 near several cities, including Los Angeles, Chicago, Evansville, Louisville, Birmingham, Philadelphia, New York, Providence, and Boston.
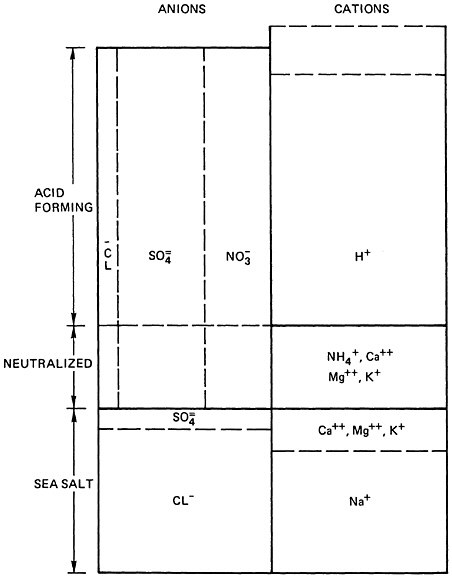
No direct measurements of the pH of precipitation in the United States prior to 1959 appear to be available (Likens and Bormann 1974, Likens 1972). However, Granat (1972) and Cogbill and Likens (1974) have shown that is is possible to compute the pH of chemically analyzed rainwater samples with reasonable accuracy, by means of a stoichiometric balance between cations and anions. The principle of the method is shown in Figure 7–3: tests have shown that it can predict the pH of precipitation samples within ±0.1 unit (Cogbill and Likens 1974; Figure 7–2).9
Accordingly Cogbill and Likens (1974) have constructed maps of the average pH of precipitation,10 based upon the precipitation chemistry data obtained in the surveys conducted in 1955–56 (Junge 1958, Junge and Werby 1958)
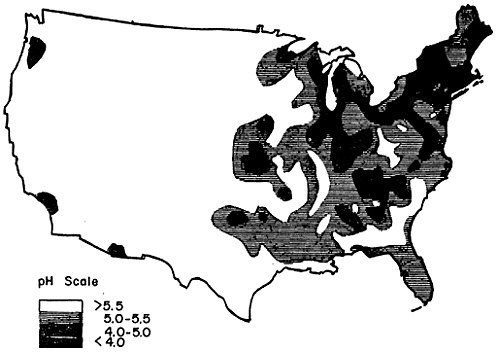
FIGURE 7–2: Acidity of Rainfall in the United States in the Period 17–31 March 1973 (ANON 1974). The map is based on a survey conducted by 16,000 High School Students at 1,100 Stations, Using a Method Accurate to ±0.5 Units or Better. See footnote 7 for Data on Rainfall in this Period.
and 1965–66 (Pearson and Fisher 1971, Lodge et al. 1968, Gambell and Fisher 1966). Both maps show that precipitation was significantly acidified (average pH below 5) throughout the northeastern United States; the area most affected (average pH below 4.5) was that between eastern Ohio and New Hampshire. The map for 1965–66 is reproduced here as Figure 7–4. Comparison of the two maps (Cogbill and Likens 1974) shows that a general increase in acidity had occurred in the intervening decade: the lowest computed pH’s fell from 4.42–4.47 in 1955–56 to 4.20–4.35 in 1965–66.
Cogbill (personal communication) has compiled a similar map of precipitation pH for 1972–73, using data from nine stations in the United States (Coghill and Likens 1974, see fn. 5) and unpublished data from 12 stations in Ontario. This map indicates a marked extension of the area of acid precipitation, especially to the south and west: by 1972–73 the contour line for pH 5.0 included the entire United States east of the Mississippi River except for the Gulf coast area; average pH’s at several stations in New York and New Hampshire were as low as 4.05–4.09, and that at Gatlingburg, Tennessee was 4.19 (Cogbill and Likens 1974). Cogbill’s 1972–73 map is generally consistent with the 1973 student survey (Figure 7–1), except that the latter shows more fine detail, including the pockets of very acid precipitation near industrial cities.
Other reported measurements of the pH of precipitation are generally consistent with the three maps prepared by Cogbill and Likens. A survey conducted between 1959 and 1964 showed consistently low pH’s (below 5.5) at 13 stations in eastern North America11: the principal difference from Figure 7–4 is that the former survey showed lower pH values at Nantucket, Massachusetts, and in northern Maine, suggesting greater northeastward extension of the area affected by acid precipitation than indicated by Cogbill and Likens’ maps. An earlier report had indicated significantly acid precipitation in Nova Scotia (Herman and Gorham 1957). The 1959–1964 survey also showed consistently high acidity (mean pH 4.0) at an urban station in
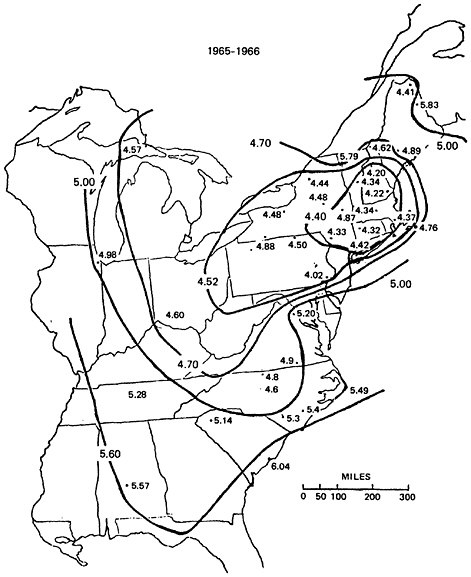
FIGURE 7–4: Acidity of Precipitation in the Eastern United States in 1965–66 (after Cogbill and Likens, 1974: Figure 4). The figures given are the annual average pH of precipitation (footnote 8) at each station (derived from data in Pearson and Fisher 1971, Lodge et al. 1968, Gambell and Fisher 1966).
Philadelphia (see fn. 11). Recent data from southern Ontario (Wiebe and Whelpdale 1974, Van Loon 1973), from ships in the Upper Great Lakes12, from Massachusetts13, Pennsylvania (Frohliger: personal communication), West Virginia and Maryland (Frohliger: personal communications, Gordon 1972) all show good agreement with Cogbill’s unpublished map for 1972–73. Data from six stations in central New York state obtained in 1970–71 showed average pH of precipitation in the range 3.91 to 4.02 (Likens 1972).
Analyses of rain from individual storms in New York state. New Hampshire, and elsewhere frequently yield pH values between 3 and 4 (Likens and Bormann 1974, Cogbill and Likens 1974, Likens 1972), and there is one reported incident of rain with a measured pH of 2.1 (Likens and Bormann 1974). In New York and New Hampshire precipitation is significantly more acid in the summer months than in the winter (Likens and Bormann 1974, Likens 1972). The seasonal difference in pH at some stations is as great as 0.4–0.8 units, and at Ithaca, New York, the average pH of rain in June-July 1971 was as low as 3.53 (Likens 1972). A similar seasonal difference was recorded during the 1959–1964 survey at several stations in the northeastern United States, but not elsewhere (see fn. 11). The summer peak in acidity has been attributed tentatively to seasonal differences in storm tracks and to the greater humidity in summer, which leads to more rapid oxidation of sulfur dioxide to sulfuric acid (Likens and Bormann 1974).
There is no direct information about the acidity of rain in the eastern United States prior to 1955, but there is indirect evidence that the pH of precipitation was formerly above 5.7 over wide areas where it is now below 4.5.14 Likens and Bormann have suggested that the acidification of rain began about 1950, as a consequence of the decrease in emissions of alkaline fly ash from coal-burning plants, in combination with increasing emissions of sulfur oxides and nitrogen oxides (Likens and Bormann 1974).
THE RELATIONSHIP OF ACID PRECIPITATION TO EMISSIONS OF SULFUR AND NITROGEN OXIDES
By multiplying the average hydrogen ion concentration observed at a meteorological station by the annual rainfall, an estimate can be derived for the total rate of deposition of hydrogen ions per unit area. Integrating these computed rates of deposition over the areas marked on the maps by Cogbill and Likens (1974), it is then possible to estimate the total quantity of hydrogen ions deposited in eastern North America in the course of a year. Such estimates for the two survey years 1955–56 and 1972–73 are tabulated on the first line of Table 7–3. These figures suggest tht the total amount of acid falling in precipitation increased by a factor of about 2.7 in the 17 years 1956–1973.
The principal acids involved are sulfuric and nitric acids, with small quantities of hydrochloric acid at some stations (see Figure 7–3). Data from all the surveys indicate that the ratio of sulfuric to nitric acids in precipitation has decreased substantially since 1955, because the concentrations of dissolved nitrates have increased more rapidly than those of sulfates. The best series of data is that from Hubbard Brook, New Hampshire, where the sulfate/nitrate ratio (expressed on an equivalent weight basis) has decreased from about 3.0 to 2.2 between 1965 and 1973 (Likens and Bormann 1974, Cogbill: personal communication), and from Ithaca and Geneva, New York, where this ratio has decreased from about 3.5 to 2.0 between 1955 and 1973 (Cogbill and Likens 1974, Likens 1972). Unfortunately the concentrations of nitrates in precipitation vary quite widely, and all three of these stations have atypically low sulfate/nitrate ratios [those at nearby stations range from 4 (Likens 1972: Table 13) up to 11 or higher (Shiomi and Kuntz 1974)]. Averaging all the data available for eastern North America, a sulfate/nitrate ratio of about 4 appears reasonable for 1955–56, and a ratio of about 3 for 1972–73. These figures have been used in Table 7–3 to calculate the changes in sulfuric acid and nitric acid deposition since 1955.
The last two lines in Table 7–3 compare the calculated deposition of sulfuric acid with the total deposition of sulfates, derived from Table 7–2. The fraction of sulfates deposited as sulfuric acid, averaged over the entire region, appears to have increased since 1955.15 This result is consistent with the hypothesis of Granat (1972), that the supply of alkaline materials (such as ammonia or calcium) to the atmosphere is limited: once this supply is exhausted, emission of further acid-forming materials is expected to lead to a rapid increase in acidity.16 Further support for Granat’s hypothesis is provided by the regional distribution of sulfates and acidity: in areas where the sulfate loading is high, the acid fraction of the sulfates is disproportionately high. For example, at Ithaca, New York, about 80 percent of the excess sulfates are in the form of sulfuric acid (Cogbill and Likens 1974), in comparison with the regional average of 24 percent (Table 7–3).
Another noteworthy feature of Table 7–3 is that total nitrates in precipitation have increased more rapidly (roughly threefold since 1955) than sulfates (roughly twofold in the same period). This presumably reflects the fact that total nitrogen oxide emissions have increased more rapidly than sulfur oxide emissions (see Chapter 14 Figure 14–15). The increase in nitrate deposition appears to have been more rapid than the increase in total nitrogen oxide emissions (which roughly doubled between 1955–1972), but matches reasonably well the increase in emissions from stationary fuel combustion and industrial processes (which roughly tripled in the same period). This suggests that high level emissions are more important than ground level emissions in leading to formation and deposition of nitrates,17 in just the way that was suggested earlier for sulfates. In fact, if attention is confined to high level emissions (power plants, smelters, and industrial processes), the geographical and temporal patterns of emissions of sulfates and nitrates appear to match well the patterns of emission of sulfur and nitrogen oxides.
TABLE 7–3. Deposition of Acid in Precipitation in Eastern North America, Assigned to Sulfuric Acid and Nitric Acid According to the Measured Sulfate/Nitrate Ratio
(Units: 104 ton-equivalents per year—See Note 1)
|
|
1955–56 |
1972–73 |
% change 1956–73 |
|
Total deposition of acid (as H+: unit 104 tons) |
4.4 |
11.9 |
+170% |
|
Estimated deposition as sulfuric acid (as 1/2 H2SO4: unit 49 104 tons) |
3.5(80%) |
8.7(73%) |
+150% |
|
Estimated deposition as nitric acid (as HNO3: unit 63 104 tons) |
0.84(19%) |
2.86(24%) |
+240% |
|
Total deposition of sulfates (from Table 2) (as 1/2 SO4: unit 48 104 tons) |
18 |
35 |
+95% |
|
Sulfuric acid as % of sulfates |
19% |
24% |
+25% |
|
Notes: 1. All deposition rates are expressed as multiples of the chemical equivalent weight, so that rates for different chemical species can be compared directly. 1 ton H+ is equivalent to 49 tons sulfuric acid or to 63 tons nitric acid. For comparison with emissions, 1 ton H+ is also equivalent to 32 tons SO2, 16 tons sulfur, or 30 tons nitric oxide. 2. A small but increasing fraction of the acid in precipitation is attributable to hydrochloric acid (see Figure 7–3 and Likens and Bormann 1974, Cogbill and Likens 1974, Likens 1972). |
|||
EVIDENCE FOR LONG RANGE TRANSPORT AND DEPOSITION OF SULFUR OXIDES
The pattern of sulfate deposition indicated in Figure 7–1, with its peak in the northeastern United States, agrees closely with the distribution of suspended sulfates plotted in Figures 6–4 and 6–5. A slight difference is that Eriksson’s map (Figure 7–1) suggests relatively low deposition rates near the Atlantic coast; however, this was based on data from very few stations and high deposition rates were recorded in the 1965–66 survey (Pearson and Fisher 1971).
The distribution of acidity in precipitation is very similar to that of sulfates (Figures 7–2, 7–4). Pearson and Fisher found a good correlation between acidity and sulfate deposition in the northeastern United States (Pearson and Fisher 1971: Figure 5). Likens found that this correlation was less strong in New York state (Likens 1972: Figure 12), but an exact correlation would not be expected because of the importance of nitric acid in that area (see discussion above).
Cogbill and Likens (1974: Figure 5) plotted the trajectories of air parcels associated with precipitation in central New York state. They found a strong association between rainfall with low pH values and air which had passed through the East-Central and Mid-Western states 1–2 days earlier. The area defined by these trajectories (broadly, the Mississippi and Ohio valleys north to the Great Lakes) coincides with the area of greatest emission density for both sulfur oxides (Figure 13–10) and nitrogen oxides (Table 14–8 in the nitrogen oxides report). Air parcels arriving in New York state from areas further north (i.e., Canada) or further southeast (i.e., the Appalachian mountains and beyond) were associated with rain that was much less acidic (Cogbill and Likens 1974: Figure 5). This finding is fully consistent with the hypothesis that acid precipitation results from regional transport of sulfur oxides (and perhaps nitrogen oxides) emitted 300–1500 km upwind (Cogbill and Likens 1974). It thus provides indirect support
for the models of regional transport of sulfur oxides discussed in Chapter 6 and Chapter 13.
According to the nitrogen oxides report (see Chapter 15), rates of conversion of nitrogen oxides to nitric acid are typically 3–4 times faster than those for conversion of sulfur dioxide to sulfates. Accordingly it might be expected that nitric acid would be more concentrated near major sources than sulfuric acid (see Chapter 15). However, there is no direct evidence for this in the precipitation chemistry data. The only stations where the reported nitrate/sulfate ratios in precipitation were greater than 0.3 are St. Albans Bay, Vermont (Pearson and Fisher 1971), Hubbard Brook, New Hampshire (Likens and Bormann 1974, Cogbill and Likens 1974), Ithaca and vicinity, New York (Likens 1972), Mntgomery, Alabama (Junge 1958, Junge and Werby 1958, Lodge et al. 1968), Greenville, South Carolina, and Chicago, Illinois (Lodge et al. 1968). With the exception of Chicago, where the concentrations of both nitrates and sulfates were exceptionally high, these are predominantly rural stations away from major sources. At other urban stations, including those such as Albany and Philadelphia where highly acidic precipitation has been reported, nitrate/sulfate ratios are consistently lower than 0.3 (Junge 1958, Junge and Werby 1958, Pearson and Fisher 1971, Lodge et al. 1968, Gambell and Fisher 1966, Van Loon 1973). Thus the concentration of acid precipitation around cities (Anon 1974) cannot be explained as being due to local fallout of nitric acid; it probably reflects primarily the rapid oxidation of sulfur dioxide in polluted urban atmospheres, as discussed in Chapter 6 and in Chapter 13, Appendix A.
SUMMARY OF COMPARABLE OBSERVATIONS IN EUROPE
Since the above survey of sulfates and acidity in precipitation in North America is based on somewhat limited data, it is at least reassuring that similar conclusions have been derived independently in Europe, where the phenomena of long-range sulfur transport and
acid precipitation have been studies for a longer period (Rodhe 1972, Bolin et al. 1971, Oden 1968, Brosset 1973, Granat 1972, Barrett and Brodin 1955, Munn and Rodhe 1971, Garland 1974, Nord 1974). Deposition of sulfur has been increasing at 2–3 percent per year, roughly in parallel with the increase in emissions of sulfur dioxide in western Europe (Bolin et al. 1971, Munn and Rodhe 1971). The total amount of sulfur deposited as sulfate in precipitation in western Europe has been estimated as between 27 and 45 percent of the total amount emitted (Rodhe 1972, Garland 1974). The acidity of precipitation has increased more rapidly than the sulfate content, locally more than 200-fold over a 10-year period (Bolin et al. 1971, Oden 1968). The area subject to acid precipitation has expanded to include most of western Europe (Bolin et al. 1971, Brosset 1973). The area most affected (average pH less than 4.0, sulfur deposition greater than 15 kg/ha/yr in 1965) is in the eastern Netherlands and N.W. Germany, a few hundred km downwind from the major sources (Rodhe 1972, Bolin et al. 1971, Oden 1968, Brosset 1973). By plotting atmospheric trajectories it has been possible to relate acid precipitation and sulfate deposition in northern Europe to sources in the industrialized regions to the south and west (Rodhe 1972, Bolin et al. 1971, Brosset 1973, Nord 1974): the data are consistent with a lifetime of 2–4 days for sulfur in the atmosphere and a corresponding range of 1000–2500 km (Rodhe 1972). By summing the rates of deposition mapped in Bolin et al. (1971: Figure 3:5), I have estimated the total rate of deposition of hydrogen ions in western Europe to have been about 4.5 104 tons/yr in 1965. If all this were attributable to sulfuric acid, it would account for 15–25 percent of the sulfates deposited in the same area (Rodhe 1972, Garland 1974). However, as in North America, there are substantial contributions of nitric acid to total acidity (Granat 1972). All these findings are similar both qualitatively and quantitavely to those summarized above for eastern North America.
PROJECTED CONSEQUENCES OF INCREASED EMISSIONS IN 1980
Following Trijonis (Chapter 6), I will consider the effects of a projected doubling in sulfur oxide production in power plants between 1970 and 1980, with other emissions projected to remain constant. Two extreme cases will be considered:
No SOx control: power plant emissions will increase to 38 million tons sulfur dioxide in 1980, mainly through tall stacks;
SOx control: power plant emissions in 1980 will remain unchanged at 19 million tons sufure dioxide.
For nitrogen oxide emissions in 1980, I will use the high projection in the nitrogen oxides report,18 assuming no control of emissions.
Canadian emissions of both SOx and NOx will be assumed to change in the same proportion as United States emissions.
To calculate the likely impact of these projected emissions on the chemistry and acidity of precipitation, the following assumptions will be made.
-
the fraction of SOx emissions that takes place in the eastern United States will be unchanged (assumed to be 80 percent of power plant emissions and 50 percent of others);
-
similarly, the fraction of NOx emissions that takes place in the eastern United States will remain constant at about 70 percent (Table 14–8 in the nitrogen oxides report).
-
the use of tall stacks and intermittent control systems will not affect the fractions of emitted sulfur dioxide and NOx that are ultimately converted to sulfates and nitrates (in fact, some increase is likely);
-
the total amount of sulfates deposited in precipitation in eastern North America will increase in proportion to weighted emissions of sulfur dioxide, where stack and ground-level emissions are weighted in the ratio 2:1 (see Table 7–2 and accompanying discussion in the text);
-
the total amount of nitrates deposited in precipitation in eastern North America will increase in proportion to stack emissions of NOx (stationary source fuel combustion and
-
industrial processes) (see text discussion above);
-
to estimate the fraction of nitrates and sulfates deposited as acids, two alternative assumptions will be made:
-
constant percent acid: the fraction deposited as acid will be the same in 1980 as in 1972–73;
-
all acid: all the nitrates/and sulfates produced in 1980 in excess of those deposited in 1972–73 will be deposited as acids (following the hypothesis of Granat (1972) that the neutralizing capacity of the atmosphere has been exhausted).
Table 7–4 presents the results of calculations of the rates of deposition in 1980 of sulfates, nitrates, and the corresponding acids, under the four sets of assumptions. These results suggest two major conclusions:
-
even if sulfur oxide emissions are not permitted to increase, there is likely to be a small increase in the acidity of precipitation, as a consequence of increased nitrogen oxide emissions;
-
if sulfur oxide emissions from power plants increase to twice the 1980 levels, the acidity of precipitation will increase by a larger factor. The exact magnitude of the increase depends on the fraction of the additional sulfates and nitrates that will be deposited as acids. Granat’s hypothesis (1972) that this fraction is likely to be high, because the neutralizing capacity of the atmosphere is nearly exhausted, is at least plausible and is supported by the observed rapid increase in acidity of precipitation both in North America and in Europe. Accordingly the “all acid” assumption is probably more likely to be correct than the “constant percent acid” assumption, which requres an additional source of alkaline materials into the atmosphere. Thus, if sulfur oxide emissions are uncontrolled, the total acidity of precipitation in eastern North America is likely to increase by a factor of 2–3 between 1972 and 1980. Projecting the trends of the period 1965–1973, it is likely that this increase will be accompanied by an extension of the area affected. In particular, if emissions
TABLE 7–4. Projected Deposition of Sulfates, Nitrates, and Acids in Eastern North America in 1980, under 4 Sets of Assumptions about Emission Controls and Acid Formation.
|
|
1980 projections |
||||
|
SOx control |
No SOx control |
||||
|
constant % acid5 |
all acid6 |
constant % acid5 |
all acid6 |
||
|
Sulfur emissions (106 tons S) |
|
|
|
|
|
|
Tall stacks |
12.5 |
12.5 |
12.5 |
18.9 |
18.9 |
|
Low level |
3.1 |
3.1 |
3.1 |
3.2 |
3.2 |
|
Weighted total (1:0.5) |
14.1 |
14.1 |
14.1 |
20.5 |
20.5 |
|
NOx emissions (106 tons NO) |
|
|
|
|
|
|
Tall stacks2 |
10.8 |
14.9 |
14.9 |
14.9 |
14.9 |
|
Sulfate deposition (106 tons S equivalent) |
|
|
|
|
|
|
Total3 |
5.7 |
5.7 |
5.7 |
8.2 |
8.2 |
|
As sulfuric acid |
1.4 |
1.4 |
1.4 |
2.0 |
3.9 |
|
% acid |
24% |
24% |
24% |
24% |
46% |
|
Nitrate deposition (106 tons NO equivalent) |
|
|
|
|
|
|
Total4 |
3.5 |
4.9 |
4.9 |
4.9 |
4.9 |
|
As nitric acid |
0.86 |
1.17 |
2.21 |
1.17 |
2.21 |
|
% acid |
24% |
24% |
45% |
24% |
45% |
|
Total acid deposition (104 tons H+) |
11.6 |
12.7 |
16.2 |
16.4 |
31.8 |
|
% increase in acid, 1972–80 |
— |
+10% |
+40% |
+40% |
+175% |
|
Notes: 1. Power plants, smelters and industrial emissions. It is assumed that 80 of power plant emissions and 50 of other emissions will be in the eastern United States. 2. Stationary fuel combustion and industrial emissions. It is assumed that 70 of these emissions will be in the eastern United States, as in 1972 (Table 14–8) in nitrogen oxides report). 3. Assumed to remain constant at 40 of weighted emissions. 4. Assumed to remain constant at 32 of stack emissions. 5. Sulfuric and nitric acids assumed to remain constant at 24 of deposited sulfates and nitrates respectively. 6. All sulfates and nitrates incremental between 1972 and 1980 assumed to be deposited as the corresponding acids. |
|||||
-
increase in the Midwest, it is likely that significantly acid precipitation will extend over a wider area of prime agricultural land from Ohio and Tennessee westwards.
NEUTRALIZATION AND RUN-OFF OF ACIDIFIED PRECIPITATION
When acid rain falls on vegetation, part of the acid is neutralized in the leaves. In a study carried out in New Hampshire, for example, rain falling in summer on a deciduous forest at an average pH of 4.06 was 90 percent neutralized in the foliage and reached the ground at an average pH of 5.01 (Eaton et al. 1973). Neutralization of acid results in losses (leaching) of cations such as potassium, magnesium, and calcium from the leaves (Eaton et al. 1973, Tukey et al. 1965, Wood and Bormann 1975).
In winter, and on agricultural land, acid rain falls directly on the soil and is partly neutralized there. Again the process of neutralization results in the removal of cations such as calcium and magnesium from the soil in the form of soluble sulfates (Overrein 1972). Unelss the soil is well buffered, continued exposure to acid precipitation can lead to progressive depletion of nutrients and acidification of the soil (Bolin et al. 1971, Overrein 1972, Malmer 1973). Direct absorption of sulfur dioxide contributes to these effects, because it is oxidized to sulfuric acid in the soil. Unless soils are naturally alkaline or well buffered, neutralization of acid is usually incomplete, so that run-off water is often significantly acidic (Bolin et al. 1971). In the New Hampshire study cited above, for example, the average pH of run-off water was 5.15 (Likens and Bormann 1974, Johnson et al. 1972). Experimental studies with a poorly buffered (podzol) soil showed marked acidification of run-off water after only 80 days when treated with simulated rainfall at pH 4.0 (Overrein 1972).
In Scandinavia acidification of a number of rivers and lakes has been reported in recent years (Bolin et al. 1971), Almer et al. 1974,
Hagen and Langeland 1973); typical changes in pH between 1965 and 1970 were of the order of 0.1 to 0.4 (Bolin et al. 1971). Similar phenomena have been recorded locally in North America (Beamish and Harvey 1972, Johnson et al. 1972, fn. 13). The rate at which streams and lakes become acidified appears to be highly variable and to depend upon the nature of the underlying rocks and of the soils in the watershed, and the buffering capacity of the lakes themselves (Bolin et al. 1971, Beamish and Harvey 1972, Malmer 1973). Where the underlying rocks are acidic and the soils poorly buffered, lakes may become significantly acidified after a few years of exposure to precipitation at pH 4.5 or below (Beamish and Harvey 1972, Almer et al. 1974).
Studies in Scandinavia (Bolin et al. 1971) and in the northeastern United States (Likens: personal communication, fn. 13) have shown that there is often a marked peak in the acidity of streams and lakes at the time of snow-melt in the spring. Hagen and Langeland (1973) found that acid contained in winter snowfall is concentrated in the surface layers of lakes immediately after the ice melts. These seasonal peaks in the acidity of surface waters are of special importance because they coincide with the spawning of fish; moreover in some lakes the deeper layers are depleted of oxygen during the winter, so that fish are forced to use the surface layers which are acidified in early spring (Hagen and Langeland 1973).
The full extent of the acidification of soils and surface waters in eastern North America has not been studied. However, as a broad generalization, much of the area of the United States and Canada most affected by acid precipitation is also characterized by acidic rocks and relatively thin soils. Accordingly, if the Scandinavian experience is any guide, continued exposure to highly acidic precipitation can be expected to lead to widespread acidification of soils and surface waters over a period of years or decades.
SUMMARY AND CONCLUSIONS
-
Deposition of sulfates in rain and snow results both from oxidation of sulfur dioxide absorbed into water droplets, and from washout of suspended sulfate particulates. With due regard for the local importance of the former process near major sources of sulfur dioxide, the occurrence of sulfates in precipitation gives information about the regional distribution of sulfates.
-
Concentrations of sulfates in precipitation are highest in the northeastern United States: their distribution parallels that of suspended sulfate particulates.
-
About one-third of the sulfur dioxide emitted to the atmosphere in the eastern United States is subsequently deposited as sulfates in precipitation.
-
The rate of deposition of sulfates in precipitation has increased in the past 20 years. The increase has probably been more rapid than the increase in total emissions of sulfur dioxide; it agrees better with the increase in high level emissions (from power plants and industrial processes).
-
Concentrations of nitrates in precipitation have increased even more rapidly than those of sulfates. The increase in the rate of deposition of nitrates is similar to the increase in high level emissions of nitrogen oxides.
-
The acidity of precipitation in the northeastern United States has increased rapidly in recent years. The areas affected by acid precipitation now covers most of eastern North America, including parts of southeast Canada. In some small areas in the Northeast the average pH of precipitation is near or below 4.0.
-
The distribution of acidity in precipitation is generally similar to that of dissolved sulfates. However, the fraction of the acidity attributable to nitric acid has increased and now amounts to roughly 24 percent.
-
Acid rain in the northeastern United States is associated with air parcels that have traveled through the major emitting areas in the mid-western and east-central states one or two
-
days earlier. This supports the hypothesis of regional transport of sulfur oxides and nitrogen oxides.
-
Closely similar phenomena have been reported from western Europe.
-
Even if sulfur oxide emissions are held constant, a small increase in the acidity of precipitation is likely by 1980, as a consequence of increased nitrogen oxide emissions.
-
If sulfur oxide emissions are allowed to double between 1970 and 1980, the average acidity of precipitation in the northeastern United States and in southeastern Canada is likely to increase by a factor of 2–3. The area affected may be enlarged also.
-
Acid precipitation is partly neutralized when it falls on vegetation and further neutralized in soil. The process of neutralization removes cations, including important nutrients.
-
The processes of neutralization in foliage and soil are usually incomplete, so that run-off water is often significantly acidic.
-
If the acidity of precipitation is maintained or increased, soils and surface waters are likely to become progressively acidified. The rate of acidification depends on the buffering capacity of the soil or water and is difficult to predict in individual cases.
FOOTNOTES
|
|
precipitation around point sources of sulfur dioxide indicate marked variations in the rate of oxidation. In a plume from a heating plant at Uppsala, Sweden, much of the sulfur dioxide emitted during precipitation was deposited as sulfate within 50–100 km (i.e., within 2–3 hours) (Hogstrom 1973). Studies around a sulfur extraction gas plant in Alberta Canada, showed similarly rapid oxidation of sulfur dioxide during rain (32–46 percent deposited as sulfate within 40 km), but much slower oxidation in snow (Summers and Hitchon 1973, Summers 1974). However, studies around a smelter at Sudbury, Ontario, showed very slow oxidation of sulfur dioxide (less than 1 percent deposited as sulfate within 50–100 km) even when emitted during rain (Muller and Kramer 1974, Wiebe and Whelpdale 1974). The low rate of oxidation in the Sudbury area may be related to the peculiar chemistry of the plume, which has high concentrations of iron, nickel, and copper, but low concentrations of vanadium and manganese which are effective catalysts for oxidation of sulfur dioxide to sulfates (A. Wiebe: personal communication). |
|
3 |
Dissolved sulfates in precipitation include a neutral fraction derived from ocean spray: this can be estimated from concentrations of sodium and chloride and is customarily subtracted out to derive an “excess” sulfate concentration (Junge and Werby 1958, Eriksson 1960). For details see notes to Figure 7–3. |
|
4 |
The deposition rates recorded in Shiomi and Kuntz (1974) were probably slightly low because the collectors did not sample snow efficiently. An earlier study of precipitation in southeastern Ontario in 1965–66 (Rutherford, Can. J. Earth Sci. 4:1151–1160, 1967) had shown anomalously high rates of sulfur deposition (average 39 kg/ha/yr), but the presence of silicates and aluminum in these samples suggests the possibility of contamination by wind-blown dust. For discussion of other technical problems see Likens (1972) and Pearson and |
|
9 |
Several reviewers have questioned the use of bulk precipitation samples or monthly samples for determining pH, because of the possibility of chemical changes prior to analysis. However, pH estimates obtained by the methods of Cogbill and Likens (1974) appear to agree well with those obtained from weekly or monthly samples (Cogbill and Likens 1974, Likens 1972). In this survey both single-storm and monthly samples are used indiscriminately, except where there was evidence of contamination by airborne dust or insects (for discussion see Likens 1972). |
|
10 |
“Average” pH’s quoted in this section are derived from weighted averages of hydrogen ion concentrations throughout a year. They thus represent the pH that corresponds to the average chemical composition of precipitation. |
|
11 |
Unpublished data from the National Precipitation Network, supplied by R.A.McCormick (EPA). |
|
12 |
Unpublished data of Canada Center for Inland Waters: personal communication from F.C. Elder. |
|
13 |
Unpublished data of Massachusetts Division of Fisheries and Game. |
|
14 |
Published measurements of bicarbonates in rainwater in the eastern United States prior to 1932 indicate that the pH of precipitation was uniformly above 5.7 at that period (Likens and Bormann 1974, Likens 1972). |
|
15 |
A similar conclusion holds a fortiori for nitrates, because the stoichiometric analysis summarized in Figure 7–3 assigns hydrogen ions to sulfates and nitrates in proportion to their ratio in the precipitation sample. |
|
16 |
This hypothesis does not necessarily conflict with that of Trijonis (Chapter 6), that oxidation rates of sulfur dioxide to sulfates are limited by the acidity of particles or water droplets when neutralizing materials are depleted. This mechanism would limit the local rate of oxidation in places where ambient levels are |
|
|
high. It would not prevent oxidation of the sulfur dioxide after further dispersal and dilution. |
|
17 |
The figures in Table 7–3 can be used to estimate the total amount of nitrates deposited in precipitation in eastern North America. For 1972–73 this turns out to be about 7 million tons expressed as nitrate, equivalent to 3.5 million tons NO. Although this estimate is indirect and subject to some error, it is clearly much smaller than the total NOx emissions in the area (about 17 million tons) or even those derived from stationary fuel combustion (9 million tons). Evidently deposition in precipitation is a substantial, but not the major sink for nitrogen oxides emitted into the atmosphere. |
|
18 |
Use of the high projection is based on the consensus of opinion in the Committee that a massive increase in nuclear generation of electric power is unlikely to take place by 1980. However, even the low projection involves an increase in NOx emissions about three-quarters as large as that considered here. |
LITERATURE CITED
Almer, G., W.Dickson, C.Ekstrom, and E.Hornstrom (1974) Effects of acidification on Swedish Lakes. Ambio 3:30–36.
Anon (1974) Acid rain in the United States. Current Science 59(14):1–5. Reprinted in Scientific American 230:122–127.
Barrett, E. and G.Brodin (1955) The acidity of Scandinavian precipitation. Tellus 7:251–257.
Beamish, R.J. and H.H.Harvey (1972) Acidification of the La Cloche Mountain Lakes, Ontario, and the resulting fish mortalities. J. Fish. Res. Bd. Canada 29:1131–1143.
Beilke, S. and H.W.Georgii (1968) Investigations on the incorporation of sulfur dioxide into fog- and rain-droplets. Tellus 20:435–442.
Bolin, B. et al. (1971) Air pollution across national boundaries. The impact on the environment of sulfur in air and precipitation. Sweden’s case study for the United Nations conference on the human environment. Stockholm, Royal Ministry of Foreign Affairs and Royal Ministry of Agriculture.
Brosset, C. (1973) Air-borne acid. Ambio 2:1–9.
Cogbill, C.V. (19) personal communication.
Cogbill, C.V. and G.E.Likens (1974) Acid precipitation in the northeastern United States. Water Resources Research: in press.
Dana, M.T., J.M.Hales, W.G.N.Slinn, and M.A.Wolf (1973) Natural precipitation washout of sulfur compounds from plumes. U.S. Environmental Protection Agency: Ecological Research Series, Report EPA-R3–73–047.
Eaton, J.S., G.E.Likens, and F.H.Bormann (1973) Throughfall and stemflow chemistry in a northern hardwood forest. J. Ecol. 61:495–508.
Eriksson, E. (1960) The yearly circulation of chloride and sulfur in nature; meteorological, geochemical and pedological implications. Part II. Tellus 12:63–109.
Eriksson, E. (1963) The yearly circulation of sulfur in nature. J. Geophys. Res. 68:4001–4008.
Frohliger, J. (19) personal communication.
Gambell, A.W. and D.W.Fisher (1966) Chemical composition of rainfall in eastern North Carolina and southeastern Virginia. Geol. Survey Water Supply Paper 1535-K, 41 pp.
Garland, J.A. (1974) Progress Report. U.K. Proposal No. 2: sorption of sulfur dioxide at land surfaces. MS.
Gordon, C.C. (1972) Mount Storm study. Report to Environmental Protection Agency under contract no. 68–02–0229.
Granat, L. (1972) On the relation between pH and the chemical composition in atmospheric precipitation. Tellus 24:550–560.
Hagen, A. and A.Langeland (1973) Polluted snow in Southern Norway and the effect of the meltwater on freshwater and aquatic organisms. Environmental Pollution 5:45–57.
Herman, F.A and E.Gorham (1957) Total mineral material, acidity, sulfur, and nitrogen in rain and snow at Kentville, Nova Scotia. Tellus 9:180–183.
Hogstrom, U. (1973) Residence time of sulfurous air pollutants from a local source during precipitation. Ambio 2:37–41.
Johnson, N.M., R.C.Reynolds, and G.E.Likens (1972) Atmospheric sulfur; its effect on the chemical weathering of New England. Science 177:514–516.
Junge, C.E. (1958) The distribution of ammonia and nitrate in rainwater over the United States. Amer. Geophys. Union Trans. 39:241–248.
Junge, C.E. and R.T.Werby (1958) The concentration of chloride, sodium, potassium, calcium, and sulfate in rainwater over the United States. J. Meteor. 15:417–425.
Kellogg, W.W., R.D.Cadle, E.R.Allen, A.L.Lazrus, and E.A.Martell (1972) The sulfur cycle. Science 175:587–596.
Likens, G.E. (19) personal communication.
Likens, G.E. (1972) The chemistry of precipitation in the central Finger Lakes region. Cornell Univ. Water Resources and Marine Science Center, Tech Rep. 50.
Likens, G.E. and F.H.Bormann (1974) Acid rain: a serious regional environmental problem. Science 184:1176–1179.
Likens, G.E., F.H.Bormann and N.M.Johnson (1972) Acid rain. Environment 14:33–40.
Likens, G.E., F.H.Bormann, R.S.Pierce, and D.W.Fisher (1971) Nutrient-hydrologic cycle interaction in small forested watershed ecosystems. In Productivity of Forest Ecosystems (P.Duvigneaud, Ed.), pp. 553–563. Proc. Brussels Symposium, 1969. UNESCO, Paris.
Lodge, J.P., Jr., K.C.Hill, J.B.Pate, E.Lorange, W.Basbergille, A.L.Lazrus, and G.E.Swanson (1968) Chemistry of United States precipitation. National Center for Atmospheric Research, Boulder, 66 pp.
Malmer, N. (1973) On the effects of water, soil, and vegetation from an increasing atmospheric supply of sulfur. Statens Naturvardsverk PM 402:1–8.
Miller, J.M. and R.G.de Pena (1972) Contribution of scavenged sulfur dioxide to the sulfate content of rain water. J. Geophys. Res. 77:5905–5916.
Muller, E.F. and J.R.Kramer (1974) Precipitation scavenging in central and northern Ontario. Paper presented at Precipitation Scavenging Symposium, USAEC Symposium Series, Champaign, Illinois.
Munn, R.E. and H.Rodhe (1971) On the meteorological interpretation of monthly precipitation samples. Tellus 23:1–13.
Nord, J. (1974) Sulphur pollution arising from distant emission sources. MS.
Oden, S. (1968) The acidification of air and precipitation and its consequences on the natural environment. Natural Research Council of Sweden, Ecology Committee, Bull. 1, 86 pp. Translated by Translation Consultants, Ltd., Arlington, Va. (TR-1172).
Overrein, L.N. (1972) Sulphur pollution patterns observed; leaching of calcium in forest soil determined. Ambio 1:145–147.
Pearson, F.J., Jr. and D.W.Fisher (1971) Chemical composition of atmospheric precipitation in the northeastern United States. Geol. Survey Water Supply Paper 1535-P. 23 pp.
Petrenchuk, O.P. and V.M Drozdova (1966) On the chemical composition of cloud water. Tellus 18:280–286.
Rennie, P.J. and R.L.Halstead (1973) The effects of sulphur on plants in Canada. Unpublished draft report to National Research Council, Ottawa.
Robinson, E. and R.C.Robbins (1968) Sources, abundance, and fate of gaseous atmospheric pollutants. Final report of Project PR-6755. Stanford Research Institute, Menlo Park, California.
Rodhe, H. (1972) A study of the sulfur budget for the atmosphere over northern Europe. Tellus 24:128–138.
Scott, W.D. and P.V.Hobbs (1967) The formation of sulfate in water droplets. J. Atmos. Sci. 24:54–57.
Shiomi, M.T. and K.W.Kuntz (1974) Great Lakes precipitation chemistry: Part 1. Lake Ontario Basin. Proc. 16th Conf. Great Lakes Res. 1973:581–602.
Summers, P.W. (1974) Note on sulfur dioxide scavenging in relation to precipitation type. Paper presented at Precipitation Scavenging Symposium, USAEC Symposium Series, Champaign, Illinois.
Summers, P.W. and B.Hitchon (1973) Source and budget of sulfate in precipitation from central Alberta, Canada. J. Air Pollution Control Assoc. 23:194–199.
Tukey, H.B., Jr., R.A.Mecklenburg, and J.V.Morgan (1965) A mechanism for the leaching of metabolites from foliage. In Radiation and Isotopes in Soil-Plant Nutrition Studies, pp. 371–385. International Atomic Energy Agency, Vienna.
U.S. Environmental Protection Agency (1973) Nationwide Air Pollutant Trends, 1940–1970. EPA Publication AP-115, Research Triangle Park, N.C.
Van Loon, J.C. (1973) Toronto’s precipitation analyzed for heavy metal content. Water and Pollution Control, February: 38–41.
Wiebe, H.A. and D.Whelpdale (1974) Precipitation scavenging from a tall stack plume. Paper presented at Precipitation Scavenging


