
6
Right-to-Carry Laws
This chapter is concerned with the question of whether violent crime is reduced through the enactment of right-to-carry-laws, which allow individuals to carry concealed weapons.1 In all, 34 states have right-to-carry laws that allow qualified adults to carry concealed handguns. Proponents of these laws argue that criminals are deterred by the knowledge that potential victims may be carrying weapons and therefore that the laws reduce crime. However, it is not clear a priori that such deterrence occurs. Even if it does, there may be offsetting adverse consequences. For example, increased possession of firearms by potential victims may motivate more criminals to carry firearms and thereby increase the amount of violence that is associated with crime. Moreover, allowing individuals to carry concealed weapons may increase accidental injuries or deaths or increase shootings during arguments. Ultimately, it is an empirical question whether allowing individuals to carry concealed weapons generates net social benefits or net social costs.
The statistical analysis of the effects of these laws was initiated by John Lott and David Mustard (1997) and expanded by Lott (2000) and Bronars and Lott (1998) (hereinafter referred to simply as Lott). Lott concludes that the adoption of right-to-carry laws substantially reduces the prevalence of violent crime. Many other researchers have carried out their own statistical analyses using Lott’s data, modified versions of Lott’s data, or expanded
data sets that cover the more recent time period not included in the original analysis.2
Because the right-to-carry issue is highly controversial, has received much public attention, and has generated a large volume of research, the committee has given it special attention in its deliberations. This chapter reviews the existing empirical evidence on the issue. We also report the results of our own analyses of the data. We conclude that, in light of (a) the sensitivity of the empirical results to seemingly minor changes in model specification, (b) a lack of robustness of the results to the inclusion of more recent years of data (during which there are many more law changes than in the earlier period), and (c) the imprecision of some results, it is impossible to draw strong conclusions from the existing literature on the causal impact of these laws. Committee member James Q. Wilson has written a dissent that applies to Chapter 6 only (Appendix A), and the committee has written a response (Appendix B).
DESCRIPTION OF THE DATA AND METHODS
Researchers studying the effects of right-to-carry laws have used many different models. However, all of the analyses rely on similar data and methodologies. Accordingly, we do not attempt to review and evaluate each of the models used in this literature. Instead, we describe the common data used and
|
2 |
Two other general responses to Lott’s analysis deserve brief mention. First, some critics have attempted to discredit Lott’s findings on grounds of the source of some of his funding (the Olin Foundation), the methods by which some of his results were disseminated (e.g., some critics have claimed, erroneously, that Lott and Mustard, 1997, was published in a student-edited journal that is not peer reviewed), and positions that he has taken on other public policy issues related to crime control. Much of this criticism is summarized and responded to in Chapter 7 of Lott (2000). The committee’s view is that these criticisms are not helpful for evaluating Lott’s data, methods, or conclusions. Lott provides his data and computer programs to all who request them, so it is possible to evaluate his methods and results directly. In the committee’s view, Lott’s funding sources, methods of disseminating his results, and opinions on other issues do not provide further information about the quality of his research on right-to-carry laws. A second group of critics have argued that Lott’s results lack credibility because they are inconsistent with various strongly held a priori beliefs or expectations. For example, Zimring and Hawkins (1997:59) argue that “large reductions in violence [due to right-to-carry laws] are quite unlikely because they would be out of proportion to the small scale of the change in carrying firearms that the legislation produced.” The committee agrees that it is important for statistical evidence to be consistent with established facts, but there are no such facts about whether right-to-carry laws can have effects of the magnitudes that Lott claims. The beliefs or expectations of Lott’s second group of critics are, at best, hypotheses whose truth or falsehood can only be determined empirically. Moreover, Lott (2000) has argued that there are ways to reconcile his results with the beliefs and expectations of the critics. This does not necessarily imply that Lott is correct and his critics are wrong. The correctness of Lott’s arguments is also an empirical question about which there is little evidence. Rather, it shows that little can be decided through argumentation over a priori beliefs and expectations. |
focus on the common methodological basis for all of them. In particular, we use the results presented in Tables 4.1 and 4.8 of Lott (2000) to illustrate the discussion. We refer to these as the “dummy variable” and “trend” model estimates, respectively. Arguably, these tables, which are reproduced in Table 6-1 and Table 6-2, contain the most important results in this literature.
Data
The basic data set used in the literature is a county-level panel on annual crime rates, along with the values of potentially relevant explanatory variables. Early studies estimated models on data for 1977-1992, while more recent studies (as well as our replication exercise below) use data up to 2000. Between 1977 and 1992, 10 states adopted right-to-carry laws.3 A total of 8 other states adopted right-to-carry laws before 1977. Between 1992 and 1999, 16 additional states adopted such laws.
The data on crime rates were obtained from the FBI’s Uniform Crime Reports (UCR). Explanatory variables employed in studies include the arrest rate for the crime category in question, population density in the county, real per capita income variables, county population, and variables for the percent of population that is in each of many race-by-age-by-gender categories. The data on explanatory variables were obtained from a variety of sources (Lott, 2000: Appendix 3).
Although most studies use county-level panels on crime rates and demographic variables, the actual data files used differ across studies in ways that sometimes affect the estimates. The data set used in the original Lott study has been lost, although Lott reconstructed a version of the data, which he made available to other researchers as well as the committee. This data set, which we term the “revised original data set,” covers the period 1977-1992.4 More recently, Lott has made available a data set covering the
period 1977-2000 that corrects acknowledged errors in data files used by Plassmann and Whitley (2003). We term this file the “revised new data set.”5 We make use of both of these data sets in our replication exercises.
Dummy Variable Model
For expository purposes it is helpful to begin by discussing the dummy variable model without “control” variables.6 The model (in Lott, 2000: Table 4.1) allows each county to have its own crime level in each category. Moreover, the crime rate is allowed to vary over time in a pattern that is common across all counties in the United States. The effect of a right-to-carry law is measured as a change in the level of the crime rate in a jurisdic-tion following the jurisdiction’s adoption of the law. Any estimate of a policy effect requires an assumption about the “counterfactual,” in this case what would have happened to crime rates in the absence of the change in the law. The implicit assumption underlying this simple illustrative dummy variable model is that, in the absence of the change in the law, the crime rate in each county would, on average, have been the county mean plus a time-period adjustment reflecting the common trend in crime rates across all counties.
Dummy variable models estimated in the literature are slightly more complicated than the above-described model. First, they typically include control variables that attempt to construct a more realistic counterfactual. For example, if crime rates vary over time with county economic condi-tions, then one can construct a more credible estimate of what would have happened in the absence of the law change by including the control vari-ables as a determinant of the crime rate. Most estimates in the literature use a large number of control variables, including local economic condi-tions, age-gender population composition, as well as arrest rates.
Second, some estimates in the literature model the time pattern of crime differently. In particular, some studies allow each region of the country to have its own time pattern, thereby assuming that in the ab-sence of the law change, counties in nearby states would have the same time pattern of crime rates in a crime category. We term this the “region-interacted time pattern model,” in contrast to the “common time pattern” dummy variable model above.
|
5 |
These data were downloaded by the committee from www.johnlott.org on August 22, 2003. |
|
6 |
This no-control model is often used as a way to assess whether there is an association between the outcome (crime) and the law change in the data. The committee estimates and evaluates this model below (see Tables 6-5 and 6-6, rows 2 and 3). |
Mathematically, the common time pattern dummy variable model takes the form
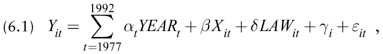
where Yit is the natural logarithm of the number of crimes per 100,000 population in county i and year t, YEARt = 1 if the year is t and YEARt = 0 otherwise, Xit is a set of control variables that potentially influence crime rates, LAWit = 1 if a right-to-carry law was in effect in county i and year t and LAWit = 0 otherwise, γi is a constant that is specific to county i, and εit is an unobserved random variable. The quantities αt, βb, and δ are coefficients that are estimated by fitting the model to data. The coefficient δ measures the percentage change in crime rates due to the adoption of right-to-carry laws. For example, if δ = –0.05 then the implied estimate of the adoption of a right-to-carry law is to reduce the crime rate by 5 percent. The coefficients αt measure common time patterns across counties in crime rates that are distinct from the enactment of right-to-carry laws or other variables of the model.
The vector Xit includes the control variables that may influence crime rates, such as indicators of income and poverty levels; the density, age distribution, and racial composition of a county’s population; arrest rates; and indicators of the size of the police force. The county fixed effect γi captures systematic differences across counties that are not accounted for by the other variables of the model and do not vary over time. The values of the parameters αt, β, and δ are estimated separately for each of several different types of crimes. Thus, the model accounts for the possibility that right-to-carry laws may affect different crimes differently.
Trend Model
While the dummy variable model measures the effect of the adoption of a right-to-carry law as a one-time shift in crime rates, one can alternatively estimate the effect as the change in time trends. The following trend model, which generated the results in Lott’s Table 4.8, allows right-to-carry laws to affect trends in crime:
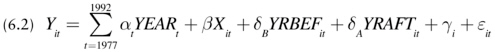
In this model, YRBEFit is a variable equal to 0 if year t is after the adoption of a right-to-carry law and the number of years until adoption if year t precedes adoption. YRAFTit is 0 if year t precedes adoption of a right-to-carry law and is the number of years since adoption of the law otherwise. The other variables are defined as in Model 6.1. The effect of adoption on the trend in crime is measured by δA – δB.
The interpretation of the “trend” model is slightly complicated, since the model already includes year effects to accommodate the time pattern of crime common across all counties. To see what this model does, consider a more flexible model with a series of separate dummy variables, for each number of years prior to—and following—the law change for adopting states (see the figures illustrating the section later in the chapter called “Extending the Baseline Specification to 2000”). Thus, for example, a variable called shall_issue_minus_1 is 1 if the observation corresponds to a county in a state that adopts the law in the following year, 0 otherwise. Similarly, shall_issue_plus_5 is 1 if the observation corresponds to a county in a state that adopted five years ago, 0 otherwise. And so on.
The coefficient on each of these variables shows how adopting states’ time patterns of crime rates move, relative to the national time pattern, surrounding the respective states’ law adoption. Note that the time pattern in question is not calendar time but rather time relative to local law adoption, which occurs in different calendar years in different places.
The trend model in equation 6.2 constrains the adopting states’ deviations to fall on two trend lines, one for years before and one for years after adoption. Thus, the model restricts the yearly movements in the deviations to fall on trend lines with break points at the time of law adoption.
STATISTICAL ANALYSES OF RIGHT-TO-CARRY LAWS
In this section, we review the basic empirical findings on the effects of right-to-carry laws. We begin with a discussion of Lott’s original estimates of Models 6.1 and 6.2 and the committee’s efforts to replicate these findings. We then discuss results from other studies that estimate the effects of right-to-carry laws on crime.
Lott’s Results
Table 6-1 (first row) displays Lott’s estimates from Model 6.1. Lott finds that where they have been adopted, right-to-carry laws have reduced homicide by about 8 percent, rapes by about 5 percent, and aggravated assaults by about 7 percent (Lott, 2000:51). Lott also finds that adoption of right-to-carry laws may increase the rates of nonviolent property crimes (burglary, larceny, auto theft). In theory, this is possible, as criminals substitute away from crimes that involve contact with victims toward crimes that do not involve encounters with victims.
Rows 2 and 3 of Table 6-1 report the results of the committee’s replication of these estimates. In row 2, we use the revised original data set and Lott’s computer programs. The committee was unable to replicate Lott’s estimate of the reduction in the murder rate, although the estimates are
TABLE 6-1 Dummy Variable Model with Common Time Pattern, Original and Revised Dataa
|
|
Sample |
Years |
Violent Crime |
Murder |
Rape |
|
1. Lott (2000) |
Original 1992 |
1992 |
–4.9% |
–7.7% |
–5.3% |
|
2. Committee replication SE |
Revised 1992b |
1992 |
–4.91 (0.98)** |
–7.30 (1.57)** |
–5.27 (1.22)** |
|
3. Committee replication SE |
Revised 2000c |
1992 |
–1.76 (1.07) |
–9.01 (1.70)** |
–5.38 (1.33)** |
|
aThe regressions use the covariates and specification from the original Lott and Mustard (1997) models that do not control for state poverty, unemployment, death penalty execution rates, or regional time trends. The controls include the arrest rate for the crime category in question (AOVIOICP), population density in the county, real per capita income variables (RPCPI RPCUI RPCIM RPCRPO), county population (POPC), and variables for the percentage of the population that is in each of many race x age x gender categories (e.g., PBM1019 is the percentage of the population that is black, male, and between ages 10 and 19). The “no controls” specification” includes county fixed effects, year dummies, and the dummy for whether the state has a right-to-carry law. |
|||||
close and consistent with the conclusion that right-to-carry laws reduce the incidence of murder. Through communication with Lott, the committee learned that the data used to construct Table 4.1 of Lott (2000) were lost and that the data supplied to the committee are a reconstruction and not necessarily identical to the original data.
Row 3 displays estimates using the revised new data set restricted to period 1977-1992. The estimates from these revised data are substantially different from those originally reported by Lott (2000). In the dummy variable model, the magnitude of the estimated reduction in the rates of violent crime and aggravated assault was reduced, the estimated reduction in the murder rate increased, and the sign of the estimated effects of right-to-carry laws on robbery reversed. Moreover, the effects of right-to-carry laws on violent crime are no longer statistically significantly different from zero at the 5 percent significance level. Finally, the estimated increase in the rates of all property crimes increased substantially.
Table 6-2 presents estimates of the trend model. The first row displays Lott’s estimates. Lott finds the passage of right-to-carry laws to be associated with changes in the crime trend. He finds a 0.9 percent reduction in the annual rate of growth of violent crime overall, and a 0.6 percent reduction in the rate of growth of property crimes. Row 2 of Table 6-2 shows the committee’s attempt to replicate Lott’s results using the revised original data set. The committee was unable to replicate most of the results in Lott’s Table 4.8. Through communication with Lott, the committee learned that
this is because there are many misprints in Table 4.8. Nonetheless, Lott’s and the committee’s results have the same signs for all crimes except aggravated assault. Row 3 displays estimates using the revised new data set restricted to the period 1977-1992. These new results tend to show larger reductions in the violent crime trends than those found using the revised original data.
Other Statistical Evaluations of Right-to-Carry Laws
Researchers have estimated the effects of right-to-carry laws using Lott’s or related data and models. Many of these studies have found that the use of plausible alternative data, control variables, specifications, or methods of computing standard errors, weakens or reverses the results. Tables 6-3 and 6-4 display estimates from selected studies that illustrate variability in the findings about the effects of right-to-carry laws. The committee does not endorse particular findings or consider them to provide better estimates of the effects of right-to-carry laws than do Lott’s results. Moreover, the committee recognizes that several independent investigators have used alternative models or data to obtain results that are consistent with Lott’s. These investigators include Bartley and Cohen (1998) and Moody (2001). We focus on the conflicting results in this section because they illustrate a variability of the findings that is central to the committee’s evaluation of their credibility.
TABLE 6-2 Trend Model with Common Time Pattern, 1977-1992a
|
|
Sample |
Years |
Violent Crime |
Murder |
Rape |
|
1. Lott (2000) |
Original 1992 |
1992 |
–0.9% |
–3.0% |
–1.4% |
|
2. Committee replication SE |
Revised 1992b |
1992 |
–0.50 (0.41) |
–4.25 (0.65)** |
–1.37 (0.51)** |
|
3. Committee replication SE |
Revised 2000c |
1992 |
–2.15 (0.39)** |
–3.41 (0.62)** |
–3.37 (0.48)** |
|
aThe regressions use the covariates and specification from the original Lott and Mustard (1997) models that do not control for state poverty, unemployment, death penalty execution rates, or regional time trends. The controls include the arrest rate for the crime category in question (AOVIOICP), population density in the county, real per capita income variables (RPCPI RPCUI RPCIM RPCRPO), county population (POPC), and variables for the percentage of the population that is in each of many race × age × gender categories (e.g., PBM1019 is the percentage of the population that is black, male, and between ages 10 and 19). |
|||||
Control Variables and Specification
The most common modifications to Lott’s original analyses of right-to-carry laws has been to assess the sensitivity of the findings to variation in the control variables or the specification of the model. Lott’s basic model relies on dozens of controls, but concerns have been raised that some controls may be missing, others may be unnecessary, and still others may be endogenous (that is, related to the unobserved determinates of county crime rates).
Duggan (2001), for example, raises concerns that county-level control variables may not be precisely measured on an annual basis and that the arrest rate control variable, which includes the crime rate in the denominator, may bias the estimates. In response to these concerns, Duggan estimated a simple dummy variable model that controls only for year and county fixed effects.7 Duggan drops all other covariates from the model. When estimated on all county-year observations with nonmissing crime
data, this reduced the magnitude of the estimated reduction in the rates of murder and aggravated assault, and it reversed the signs of the estimated effects of right-to-carry laws on rape, robbery, and all violent crime. That is, according to Duggan’s estimates, adoption of right-to-carry laws increases the frequencies of rape, robbery, and violent crime as a whole. Moreover, Duggan found there is no statistically significant effect of right-to-carry laws on violent crimes (at the 5 percent significance level).
Other researchers have varied the specification of the model, allowing for the effects of right-to-carry laws to be more heterogeneous. Black and Nagin (1998), for example, estimated a dummy variable model in which the effects of right-to-carry laws are allowed to vary among states (that is, the coefficient δ is allowed to take different values for different states). Plassmann and Tideman (2001) estimate a nonlinear Poisson regression model with a restricted set of covariates, but otherwise similar to Model 6.1. Ayres and Donohue (2003a) combined Models 6.1 and 6.2, thereby obtaining a hybrid model in which adoption of right-to-carry laws can affect both the level and the trend of crime. The results from these analyses, which vary the way in which right-to-carry laws can effect crime, are highly variable, with some suggesting that the laws increase crime, others suggesting that they decrease crime, and many being statistically insignificant.
In Black and Nagin (1998), for example, only Florida has a statistically significant decrease in the murder rate following adoption of a right-to-carry law, and only West Virginia has a statistically significant increase in
TABLE 6-3 Summary of Selected Studies: Dummy Variable Model (percentage) (shaded cells indicate a positive coefficient)
|
Source |
Modification |
Violent Crime |
Murder |
Rape |
|
Lott (2000) |
Original specification and data |
–5* |
–8* |
–5* |
|
Moody |
Unweighted |
–6* |
–4* |
–5* |
|
|
State-level analysis |
–11 |
15 |
–22* |
|
Duggana |
County and time effects only |
–1 |
–6 |
3 |
|
|
All counties |
0 |
–1 |
6 |
|
Black and Nagin |
Large counties |
|
–9* |
–4 |
|
|
Exclude Florida |
|
–1 |
1 |
|
|
Florida |
|
–27.7* |
–17* |
|
|
Georgia |
|
–5.2 |
–5 |
|
|
Idaho |
|
–21 |
–10 |
|
|
Maine |
|
7.2 |
4 |
|
|
Mississippi |
|
5.4 |
32* |
|
|
Montana |
|
–36.7 |
–97* |
|
|
Oregon |
|
–5.9 |
4 |
|
|
Pennsylvania |
|
–8.9 |
4 |
|
|
Virginia |
|
3.9 |
–8 |
|
|
West Virginia |
|
72* |
–29* |
|
Plassmann and Tideman |
No control for arrest rate |
|
–7* |
–6* |
|
All counties |
|
–2 |
–5 |
|
|
|
Count model (Poisson) |
|
–11* |
–4* |
|
|
Florida |
|
–24* |
–16* |
|
|
Georgia |
|
–8* |
–16* |
|
|
Idaho |
|
–6 |
10* |
|
|
Maine |
|
1 |
–2 |
|
|
Mississippi |
|
5 |
11* |
|
|
Montana |
|
–7 |
–4 |
|
|
Oregon |
|
–10* |
–2 |
|
|
Pennsylvania |
|
–5 |
14* |
|
|
Virginia |
|
8* |
–3 |
|
|
West Virginia |
|
5 |
–1 |
|
Ayres and Donohue (2003a) |
State trends |
0 |
–9* |
–2 |
|
1977-1997 data |
2 |
0 |
3 |
|
|
State level analysis |
|
|||
|
State and time effects only |
–3 |
–8 |
–1 |
|
|
1977-1999 data |
9* |
–2 |
6* |
|
|
Regional trend + others 1977-2000 data |
–3 |
–6* |
–7* |
|
|
Regional trends + other controls 1977-2000 corrected data |
0 |
–4 |
–5 |
|
|
Aggravated Assault |
Robbery |
Property Crimes |
Auto Theft |
Burglary |
Larceny |
|
–7* |
–2 |
3* |
7* |
0 |
3* |
|
–9* |
–1 |
3* |
3 |
1 |
4* |
|
–18* |
–10 |
1 |
–9 |
4 |
3 |
|
–6 |
4 |
6* |
9* |
8* |
5 |
|
–5 |
10 |
7* |
11* |
10* |
5 |
|
–7* |
–3 |
|
|||
|
–6* |
–5 |
|
|||
|
–7 |
7 |
|
|||
|
–4 |
8 |
|
|||
|
–31* |
–64* |
|
|||
|
–52* |
–33* |
|
|||
|
–45* |
10 |
|
|||
|
–71* |
–14 |
|
|||
|
–17* |
–4 |
|
|||
|
7* |
–5 |
|
|||
|
–16* |
–12 |
|
|||
|
–3 |
9 |
|
|||
|
|
–1 |
|
|||
|
|
2 |
|
|||
|
|
6* |
|
|||
|
|
–3* |
|
|||
|
|
1 |
|
|||
|
|
–41* |
|
|||
|
|
–22* |
|
|||
|
|
25* |
|
|||
|
|
–27* |
|
|||
|
|
–48* |
|
|||
|
|
–14* |
|
|||
|
|
–5* |
|
|||
|
|
–9* |
|
|||
|
3 |
–8 |
–1* |
–1* |
–4* |
1 |
|
7* |
0 |
–1 |
4 |
1 |
4 |
|
–10 |
–5 |
7* |
9* |
9* |
7* |
|
4* |
16* |
16* |
23* |
14* |
16* |
|
–2 |
–5 |
4 |
9* |
0 |
6 |
|
1 |
–3 |
6* |
11* |
2 |
8* |
TABLE 6-4 Summary of Selected Studies: Trend and Hybrid Variable Model (shaded cells indicate a positive coefficient)
|
Source |
Modification |
Violent Crime |
Murder |
Rape |
|
Lott (2000) |
Original specification and data |
2* |
–3* |
–1* |
|
Lott (2000)a |
1977-1996 |
–2* |
–2* |
–3* |
|
Ayres and Donohue (2003a) |
Hybrid model: Level Trend |
7* –2* |
3 –5* |
7* –3* |
|
|
1977-1997 data: Level Trend |
0 –2* |
7* –4* |
6* –3* |
|
Regional trend + others 1977-2000 data |
–1 |
–2 |
–3* |
|
|
Regional trends + other controls 1977-2000 corrected data |
0 |
–2 |
–2 |
|
|
aAdded covariates for state poverty, unemployment, death penalty execution rates, and regional time trends. bStandard errors adjusted for state clustering. |
||||
its murder rate. The estimated changes in the murder rates of other states that adopted right-to-carry laws are sometimes positive (three cases) and sometimes negative (five cases) and are not statistically significantly different from zero. Black and Nagin also report variations in the directions and statistical significance of changes in the rates of rape and aggravated assault. They report no statistically significant increases in robberies, but only 2 of the 10 states that adopted right-to-carry laws had statistically signifi-
cant decreases. In summary, according to Black and Nagin, adoption of a right-to-carry law may increase, decrease, or have no discernible effect on the crime rate depending on the crime and the state that are involved.8
Plassmann and Tideman (2001) document similar variability in the estimates. To account for the fact that county-level crime data include a large number of observations for which the outcome variable equals zero, Plassmann and Tideman estimate a nonlinear count data model. Using data from all counties with reported crime figures, the resulting estimates on murder and rape are consistent with Lott’s findings, but the sign of the estimated effect of right-to carry laws on robbery is reversed. Furthermore, when the effects of right-to-carry laws are allowed to vary among states, Plassmann and Tideman found that adoption of a right-to-carry law may increase, decrease, or have no effect on the crime rate depending on the crime and state that are involved. Consider, for example, murder. Right-to-carry laws are estimated to have a statistically significant decrease in the murder rate in Florida, Georgia, and Oregon following adoption of a right-to-carry law. Virginia has a statistically significant increase in its murder rate. The changes in the murder rates of other states that adopted right-to-carry laws are not statistically significantly different from zero. Plassmann and Tideman conclude by noting the fragility in the estimated effects of right-to-carry laws: “While this ambiguous result is somewhat discouraging, it is not very surprising. Whenever the theoretically possible and in practice plausible effects of public policy are ambiguous, it can be expected that the effects of such a policy will differ across localities that are clearly different from each other” (p. 797).
Finally, the added flexibility of the hybrid model estimated by Ayres and Donohue (2003a) produces estimation results that are different from Lott’s.9 The results found when using the revised original data (1977-
|
|
and is undefined in counties that report no crimes of the types analyzed. Therefore, these counties are not included in Lott’s analysis. Because the denominator of the arrest rate variable contains the dependent variable in Lott’s models, it is possible that dropping no-crime counties biases the results of his analysis. Nearly all of the low-crime counties have populations below 100,000. Therefore, use of only counties with larger populations largely overcomes the problem of missing arrest rate data without creating a bias. Lott (1999:8-9; 2000:142-143), however, has argued that Black’s and Nagin’s results are unreliable because they eliminated 85 percent of the counties in the nation (all the counties with populations of less than 100,000). In particular, they used only one county in West Virginia. Lott (2000: Table 4.9) presents his own estimation results according to which his findings are largely unaffected by disaggregating the right-to-carry effect by state. However, Lott does not report the details of his analysis or the statistical significance levels of his estimates. Moreover, his response does not explain why Black and Nagin found statistically significant increases in some crime rates for some states following passage of right-to-carry laws. |
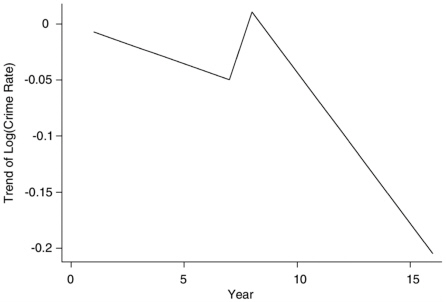
FIGURE 6-1 Trend in the logarithm of the violent crime rate.
1992) are illustrated in Figure 6-1, which shows the “relative trend” in the logarithm of the violent crime rate obtained from the Ayres and Donohue model for a hypothetical county in which a right-to-carry law is adopted in year 8. The relative trend is the difference between the crime trend in the adopting county and the trend in a nonadopting county with the same values of the explanatory variables X. According to the figure, adoption of the law increased the level of violent crime but accelerated a decreasing (relative) trend. Ayres and Donohue obtained similar results for rape and aggravated assault. For murder, the shift in the level is not statistically significant, but there is a statistically significant downward shift in the trend. There is no statistically significant effect on either the level or the trend for robbery and property crimes. Ayres and Donohue also report estimates from an expanded data set that includes the years 1977-1999. The results found using these data, which are reported in Table 6-4, are similar.
Updated Sample Endpoint
Several researchers, including Lott, have assessed whether the basic findings from Models 6.1 and 6.2 continue to hold when using more recent data. In the epilogue to the second edition of his book, Lott (2000: Table 9.1) analyzes data covering the period 1993-1996. Plassmann and Whitley (2003) use data through 2000. In addition to updating the data, these
researchers also change the model specification. In particular, these analyses include additional covariates (i.e., state poverty, unemployment and death penalty execution rates) and allow for region-interacted time patterns, as opposed to a common time trend used in the original Lott models (Lott 2000:170).
With these new models and the updated sample endpoints, Lott found that the basic conclusions from the trend model are robust to the additional years of data covering the periods 1977-1996. Likewise, Plassmann and Whitley (2003) found that when the data are updated to cover the period 1977-2000, the trend model estimates of the effects of right-to-carry laws on crime continue to be negative, but only the estimates for rape and robbery are statistically significant. In the dummy variable model, Plassmann and Whitley found negative coefficient estimates for the right-to-carry coefficient for each violent crime category and positive coefficients for each of the property categories.
Ayres and Donohue (2003b), however, document a number of errors in the data used by Plassmann and Whitley, and Lott’s revised new data correct these errors. Plassmann, in communications with the committee, has agreed that the changes to these data are appropriate. Using the revised new data, the committee exactly replicated the results reported by Ayres and Donohue (2003b).
In particular, Ayres and Donohue (2003b) found that rerunning the dummy variable model regressions using the corrected data reduced the magnitude of the estimated reduction in the rates of violent crime, murder, rape, and robbery, and it reversed the sign of the estimated effects of right-to-carry laws on aggravated assault. Moreover, none of the negative estimates is statistically significant, while effects for larceny, auto theft, and property crime overall are positive and significant. Likewise, the changes in the crime trends are generally small in absolute value, and none of the changes is significantly different from zero (see Table 6-4).10
Maltz and Targonski (2002) do not update the data but instead assess the quality of the county crime data used in the empirical research on right-to-carry laws. In particular, they note that not all police jurisdictions report their crime levels to the FBI and argue that there is systematic underreporting in the UCR. Maltz and Targonski (2002:298) conclude that “county-level crime data, as they are currently constituted, should not be used, especially in policy studies.” However, Maltz and Targonski do not estimate the magnitude of the effects of underreporting on the results obtained by Lott and others. Thus, it is not known whether correcting for underreporting, if it were possible, would change any of the results.
Lott and Whitley (2002: Figure 5) report estimates of the effects of right-to-carry laws that are obtained by dropping from the data counties with large fractions of missing UCR reports. Lott’s and Whitley’s figure shows estimated trends in crime levels before and after adoption of right-to-carry laws, and they claim that these trends support the conclusion that adoption of right-to-carry laws reduces crime. The committee disagrees. According to Figure 5b of Lott and Whitley (2002), the murder rate peaks and begins to decrease at an accelerating rate approximately 5 years before the adoption of right-to-carry laws. Aggravated assault decreases prior to adoption and then increases for approximately 3 years following adoption before starting to decrease again (Figure 5e). Adoption has no effect on rape (Figure 5c). The rate of violent crimes as a whole decreases up to the time of adoption and then remains unchanged until approximately 3 years after adoption before beginning a steeper decline (Figure 5a). Among violent crimes, only robbery displays a decrease immediately following adoption (Figure 5d). However, this followed a period during which the robbery rate first increased and then remained constant for approximately 5 years. In summary, the committee concludes that it is at least possible that errors in the UCR data may account for some of Lott’s results.
Standard Errors
A final point that has been argued in the literature is that conventional standard errors reported by Lott and others are not appropriate. The statistical analyses of dummy variable and trend models are conducted using a county-year pair as the unit of analysis. Right-to-carry laws, however, almost always vary only at the state level. Consequently, some investigators believe that treating the county-level observations as if they are statistically independent may lead to estimates of the standard errors that underestimate their true magnitude. These investigators make adjustments for state-level clustering that inflate their standard errors. For example, the standard error for the dummy variable model estimate of the effect of right-to-carry laws on violent crime increases from 0.98 when reporting the unadjusted standard error, to 2.31 when estimating clustered sampling standard errors (Duggan, 2001), to 4.9 when using the methods advocated by Helland and Tabarrok (2004) (see Table 6-3). The fact that the adjustments in most cases greatly increase the standard errors is a reason for concern. Once the standard errors have been adjusted for clustering, very few of the point estimates, in any of the models, using any of the data sets, are statistically different from zero.
However, investigators reporting cluster-adjusted standard errors do not formally explain the need for these adjustments. These adjustments, in fact, are not supported in the basic models specified in Equations 6.1 and
6.2. Instead, those who argue for presenting clustered standard errors often cite Moulton (1990) as the source of their belief that adjustments are needed. Moulton considered a model in which there is an additive source of variation (or additive effect) that is the same for all observations in the same cluster. He showed that ignoring this source of variation leads to standard errors that are too low. Investigators who make clustering corrections usually consider the counties in a state to constitute one of Moulton’s clusters and appear to believe that the absence of state-level additive effects in their models causes standard errors to be too low. The models estimated in this literature, including those of Lott and his critics, typically contain county-level fixed effects (the constants γi in equations 6.1 and 6.2). Every county is always in the same state, so, any state-level additive effect simply adds a constant to the γi’s of the counties in that state. The constant may vary among states but is the same for all counties in the same state. The combined county- and state-level effects are indistinguishable from what would happen if there were no state-level effects but each γi for the counties in the same state were shifted by the same amount. Therefore, state-level effects are indistinguishable from county-level effects. Any state-level effects are automatically included in the γi’s. There is no need for adjustments for state-level clustering.
Other observationally equivalent but different models can support the use of adjusted standard errors. If, for example, the effects of right-to-carry laws (or other explanatory variables) vary across states, then the assumption of independence across counties would be incorrect. Adjustments to the standard errors can allow for uncertainty arising from the possibility that the coefficients of variables in the model that are not allowed to vary across states, in fact, vary randomly across states. The adjustments made by Duggan and Plassmann and Whitley, for example, can be used to correct estimated standard errors for this possibility (see Wooldridge, 2003).
These alternative models have not been discussed in the literature or by the committee. Thus, it is not clear whether the models that would support using clustered-sampling-adjusted standard errors are appropriate to evaluate the effects of right-to-carry laws. At the most basic level, researchers need to assess whether models that support clustering are of interest.11 If, for example, coefficients can vary randomly among states, Models 6.1 and 6.2 reveal the mean coefficients. In other words, if different states have different coefficients, then researchers estimate an average over states. It is
not clear why anyone should care about this average, which is not related in any obvious way to (for example) nationwide benefits of right-to-carry laws. If coefficients vary among states, then it may be much more useful to estimate the coefficients for each state. It is entirely possible that the effects of right-to-carry laws vary among states, even after controlling everything else that is in the model. If they do, it may be much more useful to know which states have which coefficients, to see the magnitude of the variation, and to have a chance of finding out whether it is related to anything else that is observable. Of course, a number of the studies summarized above have varied Lott’s model by allowing the effect of right-to-carry laws to differ by states (see, for example, Black and Nagin, 1998, and Plassmann and Tideman, 2001). A model in which coefficients are estimated separately for each state does not require adjustment of standard errors.
In summary, whether adjustment of standard errors is needed depends on the details of the effects that are being estimated and the model that is used to estimate them. These issues have not been investigated in studies of right-to-carry laws to date. Adjusted standard errors are not needed for Models 6.1 and 6.2. The precision of estimates from these models should be evaluated using unadjusted standard errors.
COMMITTEE’S ANALYSIS: ARE THE ESTIMATES ROBUST?
This section presents the results of the committee’s own analysis of Lott’s revised new data covering the period 1977-2000. The purpose of the analysis is to clarify and illustrate some of the causes of the conflicting results. The committee has not attempted to form our own estimates of the effects of right-to-carry laws. Rather, our analysis is directed toward gaining a better understanding of the fragility of the estimates. We begin by illustrating the sensitivity of the findings to extending the sample period to cover the years 1993-2000. We then demonstrate that the basic qualitative results are sensitive to variations in the explanatory variables. In all cases, we use the revised new data set. There is a consensus that these revised data, covering the periods 1977-2000, are correct.
Horowitz discusses this problem in further detail and provides a statistical explanation for the fragility in the estimates in Appendix D. This appendix describes two fundamental sources of difficulty in causal inference that are especially relevant to studies of right-to-carry laws. One is the difficulty of choosing the right explanatory variables for a statistical model. The second is the difficulty of estimating the relation among crime rates, a large number of potential explanatory variables, and the adoption of right-to-carry laws. Even if the correct explanatory variables were known, it would be hard to specify a model correctly, especially in high dimensional settings with many explanatory variables. The committee drew on some of
TABLE 6-5 Dummy Variable Model with Common Time Pattern, 2000 Data
|
|
Years |
Controlsa |
Violent Crime |
Murder |
Rape |
|
0. Committee replication SE |
1992b |
Yes |
–1.76 (1.07) |
–9.01 (1.70)** |
–5.38 (1.33)** |
|
1. Comm estimate w/ covariates SE |
2000 |
Yes |
4.12 (0.71)** |
–8.33 (1.05)** |
–0.16 (0.83) |
|
2. Comm estimate w/o covariates SE |
1992b |
No |
–0.12 (1.29) |
–1.22 (2.65) |
1.39 (2.24) |
|
3. Comm estimate w/o covariates SE |
2000 |
No |
12.92 (0.78)** |
–1.95 (1.48) |
17.91 (1.39)** |
|
aThe regressions use the covariates and specification from the original Lott and Mustard (1997) models that do not control for state poverty, unemployment, death penalty execution rates, or regional time trends. The controls include the arrest rate for the crime category in question (AOVIOICP), population density in the county, real per capita income variables (RPCPI RPCUI RPCIM RPCRPO), county population (POPC), and variables for the percentage of the population that is in each of many race × age × gender categories (e.g., PBM1019 is the percentage of the population that is black, male, and between ages 10 and 19). The “no controls” specification includes county fixed effects, year dummies, and the dummy for whether the state has a right-to-carry law. |
|||||
these ideas in our deliberations but did not adopt them in total as part of our consensus report. This statistical argument is presented to stimulate further discussion and dialogue on these issues.
Extending the Baseline Specification to 2000
Extending the sample to cover the period 1977-2000 provides an important test of the robustness of the estimates for two reasons. First, the number of observations from states with right-to-carry laws in effect more than triples when the additional years are included. Second, 16 additional states enacted right-to-carry laws during the period 1993-1999, thereby providing additional data on the effects of these laws.
Another reason for the importance of the extended data is that aggregate crime trends differ greatly between the periods 1977-1992 and 1993-1997. The first period was one of rising crime, especially in large urban areas, which tend to be in states that did not adopt right-to-carry laws during 1977-1992. The period 1993-1997 was one of declining crime. Any differences in estimation results between the 1977-1992 and 1977-1997
data constitute evidence of model misspecification (e.g., because the model cannot account for the change in the aggregate crime trend) and raise the possibility (although do not prove) that the estimated effects of right-to-carry laws are artifacts of specification errors. This is a particularly important concern because states that pass right-to-carry laws are not representative of the nation as a whole on important dimensions (e.g., percentage rural) that are correlated with rising crime in the 1977-1992 period and falling crime in the years 1993-2000.
The first row of Table 6-5 reports the results of extending the dummy variable model (6.1) to the new data covering the period 1977-2000. The specifications estimated are identical to the original model, with the only difference being that the number of years has been expanded. Compared with the model estimated on the original (1977-1992) sample period (see Table 6-5, Row 0), the results have now changed rather substantially. Only the coefficient on murder is negative and significant, while seven coefficients are positive and significant (violent crime overall, aggravated assault, robbery, property crime overall, auto theft, burglary, and larceny). The dummy variable results that were apparent with the earlier data set and
TABLE 6-6 Trend Model with Common Time Pattern, 2000 Data
|
|
Years |
Controlsa |
Violent Crime |
Murder |
Rape |
|
0. Committee replication SE |
1992b |
Yes |
–2.15 (0.39)** |
–3.41 (0.62)** |
–3.37 (0.48)** |
|
1. Comm estimate w/ covariates SE |
2000 |
Yes |
–0.95 (0.18)** |
–2.03 (0.26)** |
–2.81 (0.20)** |
|
2. Comm estimate w/o covariates SE |
1992b |
No |
–1.41 (0.47)** |
–1.52 (0.97) |
–3.45 (0.82)** |
|
3. Comm estimate w/o covariates SE |
2000 |
No |
–0.62 (0.17)** |
0.12 (0.32) |
–2.17 (0.30)** |
|
aThe regressions use the covariates and specification from the original Lott and Mustard (1997) models that do not control for state poverty, unemployment, death penalty execution rates, or regional time trends. The controls include the arrest rate for the crime category in question (AOVIOICP), population density in the county, real per capita income variables (RPCPI RPCUI RPCIM RPCRPO), county population (POPC), and variables for the percentage of the population that is in each of many race x age x gender categories (e.g., PBM1019 is the percentage of the population that is black, male, and between ages 10 and 19). The “no controls” specification includes county fixed effects, year dummies, and th dummy for whether the state has a right-to-carry law. |
|||||
earlier sample periods almost completely disappear with the extension of the sample to 2000. The committee views the failure of the original dummy variable model to generate robust predictions outside the original sample as important evidence of fragility of the model’s findings.12
These results are also substantially different from those found when using the expanded set of control variables first adopted by Lott (2000: Table 9.1). As described above, Ayres and Donohue (2003b) estimate a dummy variable model using the revised new data (see Table 6-3). As in Lott (2000, Table 9.1) and Plassmann and Whitley (2003), they modify the original specification to include additional covariates (i.e., state poverty, unemployment, and death penalty execution rates) and region-interacted time patterns, as opposed to a common time trend used in the original Lott models (Lott 2000:170). These seemingly minor adjustments cause sub-
|
12 |
In light of the variability in the estimates, statistical tests might aid in determining whether particular specifications can be rejected by the data. It is not possible to test empirically whether a proposed set of explanatory variables is the correct one. It is possible to test for specification, given a set of controls (see Horowitz, Appendix D). None of the models examined by the committee passes a simple specification test (i.e., Ramsey’s 1969 RESET test). |
stantial changes to the results. For example, right-to-carry laws are estimated to decrease murder by about 4 percent using the revised specification, but about 8 percent using the original specification. The estimated effects for the eight other crime categories decrease between 2 and 6 points when moving from the original to the revised specification.
We also estimate the trend model extending the sample to 2000 (row 1, Table 6-6). Relative to the estimates in row 0 (using only data to 1992), the estimates are mostly smaller but remain negative and statistically significant. Thus, the trend specification continues to show reductions in the rate of growth of crime following right-to-carry passage.
To explore why the updated dummy variable and trend models give conflicting results, we do two things. First, we estimate a more flexible year-by-year specification, a variant of Model 6.1, the dummy variable model. Second, we reanalyze the trend model (Model 6.2) by varying the number of years after the law’s adoption to estimate its effects on crime. In each of these cases, we use the revised new Lott data through 2000 and we include the original controls used by Lott and Mustard (1997). In each of these cases, except for sampling variability, the changes should not affect the results if the trend model in equation 6.2 is properly specified.
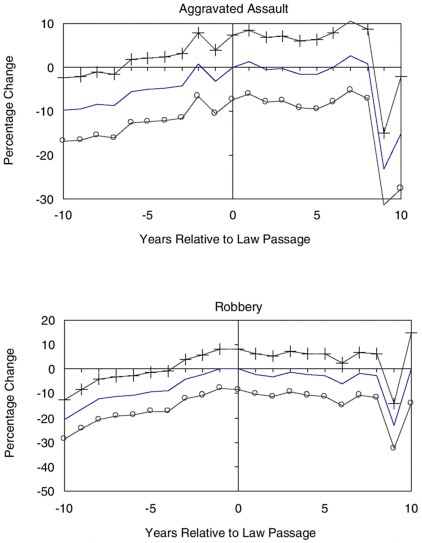
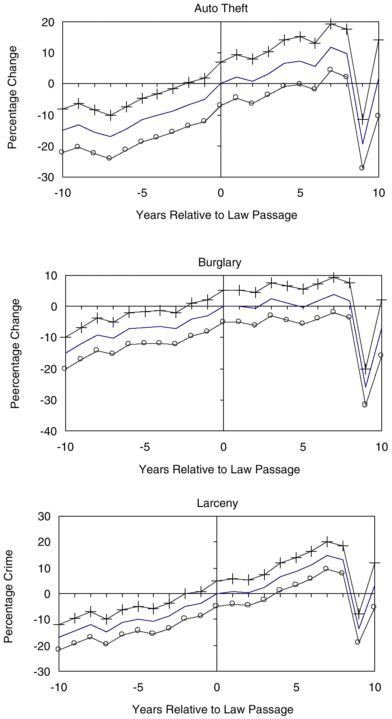
In the first exercise, we replace the right-to-carry dummy with a series of dummies for each of the possible numbers of years prior to—and following—adoption. We summarize the estimated coefficients in three figures. These figures show the estimated coefficients normalized on the year of adoption and multiplied by 100 (so the y-axis is a percentage), and the associated 95 percentage confidence intervals.13 The vertical line marks the adoption year, while the horizontal line marks 0.
Figure 6-2 shows the time pattern of coefficients from the violent crime model. For years preceding adoption, violent crime is increasing in ultimately adopting states (relative to the national time pattern). Following adoption, the increase relative to trend continues, reverses, then reverses twice again. For property crimes, in Figure 6-2, the upward trend for years prior to adoption continues following adoption.
Figure 6-3 and Figure 6-4 show graphs for individual violent and property crime categories, respectively. The obvious striking feature of these figures is that the big reductions in crime occur roughly 9 years after adoption. Otherwise, the postadoption estimates are generally small and sometimes positive and are, in general, both statistically insignificant and statistically indistinguishable from the preadoption estimates. The trend model essentially fits a line with constant slope through the postadoption portions of these graphs, and the line’s slope is affected by years long after adoption. These time patterns raise serious questions about whether the reductions in crime documented in the trend model are reasonably attributed to the change in the law.
In the second exercise, to further explore the sensitivity of the trend model estimates, we reestimate the baseline trend model (Model 6.2) using revised new Lott data on the period 1977-2000. Table 6-7, row 1, repeats the estimates from Table 6-6, row 1 which includes all years for all states, regardless of the amount of time elapsed since the law change. Subsequent rows include observations that occur certain numbers of years after the law change. (Row 2, labeled “6 years,” includes the year of the law change and the 5 following years, and so on.) These estimates show that including 5 years or fewer reverses the signs of the estimated effects of right-to-carry laws on murder and property crime (from negative to positive) and reduces the magnitude of the estimated reduction in the rates of rape, aggravated assault, robbery, and violent crime. Moreover, there are fewer statistically significant changes in crime trends. One needs to include at least 6 years following the prelaw-change period to find statistically significant reductions in the violent crime and murder trends.
The trend results rely on changes in crime trends occurring long after the law changes, again raising serious questions about whether one can
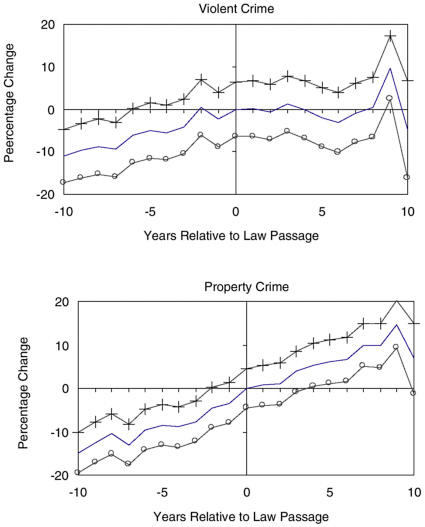
FIGURE 6-2 Year-by-year estimates of the percentage change in aggregate crime (normalized to adoption date of right-to-carry law, year 0).
——Estimate,——o——bottom of 95% confidence interval (CI),—|—Top of 95% CI
sensibly attribute the estimates from trend models in the literature to the adoption of right-to-carry laws.
Are the Results Sensitive to Controls?
The final two rows of Table 6-5 present two sets of results obtained by the committee when estimating models identical to those of Model 6.1, but excluding socioeconomic and demographic controls. We include only the
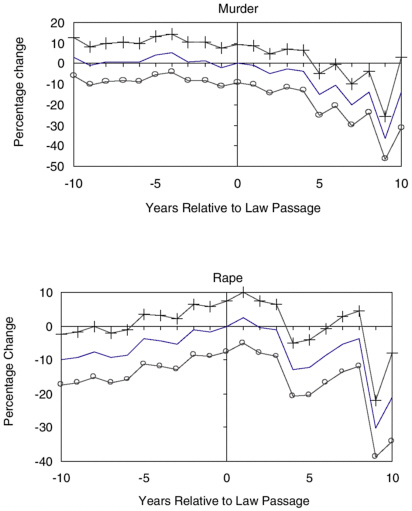
FIGURE 6-3 Year-by-year estimates of the percentage change in disaggregate violent crimes (normalized to adoption date of right-to-carry law, year 0).
——Estimate,——o——bottom of 95% confidence interval (CI),—|—Top of 95% CI
right-to-carry variable, year dummies, and county fixed effects. These estimates tell us how crime has changed in states that have adopted the right-to-carry laws before and after the law change, relative to national time patterns in crime. It is important to stress that the committee is not arguing that excluding all socioeconomic and demographic covariates is an appropriate method of identifying the effects of right-to-carry laws. Rather, we are simply assessing whether such laws are associated with a decline in the level of crime. If not, then detecting the effect, if any, of right-to-carry laws
requires controlling for appropriate confounding variables and thereby reliance on a model such as those used by Lott and others.
The results without controls are quite different. Using the earlier sample period and the new data, one finds three negative coefficients, only one of them statistically significant. When the sample is extended to 2000, only one of nine coefficients is negative, and it is insignificantly different from zero. For example, the violent crime coefficient with controls is 4.1 percent, while it is 12.9 percent without controls. These results show that states that
passed right-to-carry laws did not on average experience statistically significant crime declines relative to states that did not pass such laws.
There are two points to make about the no-controls results. First, the no-controls results provide a characterization of the data that shows that, if there is any effect, it is not obvious in the dummy variable model. What do estimates from that model mean? The model says that crime rates differ across counties and, moreover, that they change from one year to the next in the same proportionate way across all counties in the United States. Over and above this variation, there is a one-time change in the mean level of crime as states adopt right-to-carry laws. So these estimates indicate that, for the period 1977-1992, states adopting right-to-carry laws saw roughly no change in their violent crime rates and 8.5 percent increases in their property crime rates, relative to national time patterns. Estimating the model using data to 2000 shows that states adopting right-to-carry laws saw 12.9 percent increases in violent crime—and 21.2 percent increases in property crime—relative to national time patterns. The first-blush evidence provided by these no-controls models is thus not supportive of the theory that right-to-carry laws reduce crime.
A final lesson to draw from the no-controls dummy variable results is that the results are sensitive to the inclusion of controls. That is, whether one concludes that right-to-carry laws increase or decrease crime based on models of this sort depends on which control variables are included. Such laws have no obvious effect in the model without controls (and therefore no clear level effect in the raw data). Moreover, as demonstrated above, seemingly minor changes to the set of control variables substantially alter the estimated effects. Given that researchers might reasonably argue about which controls belong in the model and that the results are sensitive to the set of covariates, the committee is not sanguine about the prospects for measuring the effect of right-to-carry laws on crime. Note that this is distinct from whether such laws affect crime. Rather, in our view, any effect they have on crime is not likely to be detected in a convincing and robust fashion.
Estimates from the trend model are less sensitive to the inclusion of controls. While the no-control point estimates displayed in the third and fourth rows of Table 6-6 are smaller than in the model with controls, most of these estimates are negative and statistically significant. The trend model without controls shows reductions in violent and property crime trends following the passage of right-to-carry laws for both sample endpoints. For murder, however, the results are positive when using the 2000 endpoint, negative when using the 1992 endpoint, and statistically insignificant in both cases.
TABLE 6-7 Trend Model with Varying Postlaw Change Durations
|
|
Years |
Controlsa |
Violent Crime |
Murder |
Rape |
|
2000 |
Yes |
–0.95 (0.18)** |
–2.03 (0.26)** |
–2.81 (0.20)** |
|
|
2. 6 years SE |
2000 |
Yes |
–0.97 (0.29)** |
–1.11 (0.42)** |
–2.90 (0.33)** |
|
3. 5 years SE |
2000 |
Yes |
–0.65 (0.35) |
0.05 (0.50) |
–2.45 (0.40)** |
|
4. 4 years SE |
2000 |
Yes |
–0.27 (0.44) |
0.48 (0.63) |
–0.74 (0.50) |
|
aThe regressions use the covariates and specification from the original Lott and Mustard (1997) models that do not control for state poverty, unemployment, death penalty execution rates, or regional time trends. The controls include the arrest rate for the crime category in question (AOVIOICP), population density in the county, real per capita income variables (RPCPI RPCUI RPCIM RPCRPO), county population (POPC), and variables for the percentage of the population that is in each of many race × age × gender categories (e.g., PBM1019 is the percentage of the population that is black, male, and between ages 10 and 19). |
|||||
CONCLUSIONS
The literature on right-to-carry laws summarized in this chapter has obtained conflicting estimates of their effects on crime. Estimation results have proven to be very sensitive to the precise specification used and time period examined. The initial model specification, when extended to new data, does not show evidence that passage of right-to-carry laws reduces crime. The estimated effects are highly sensitive to seemingly minor changes in the model specification and control variables. No link between right-to-carry laws and changes in crime is apparent in the raw data, even in the initial sample; it is only once numerous covariates are included that the negative results in the early data emerge. While the trend models show a reduction in the crime growth rate following the adoption of right-to-carry laws, these trend reductions occur long after law adoption, casting serious doubt on the proposition that the trend models estimated in the literature reflect effects of the law change. Finally, some of the point estimates are imprecise. Thus, the committee concludes that with the current evidence it is not possible to determine that there is a causal link between the passage of right-to-carry laws and crime rates.
It is also the committee’s view that additional analysis along the lines of the current literature is unlikely to yield results that will persuasively demonstrate a causal link between right-to-carry laws and crime rates (unless substantial numbers of states were to adopt or repeal right-to-carry laws), because of the sensitivity of the results to model specification. Furthermore, the usefulness of future crime data for studying the effects of right-to-carry laws will decrease as the time elapsed since enactment of the laws increases.
If further headway is to be made on this question, new analytical approaches and data sets will need to be used. For example, studies that more carefully analyze changes in actual gun-carrying behavior at the county or even the local level in response to these laws may have greater power in identifying the impact of such laws. Surveys of criminals or quantitative measures of criminal behavior might also shed light on the extent to which crime is affected by such laws.


