Appendix E
Spreadsheet Data from Hydrogen Supply Chain Cost Analyses
INTRODUCTION
Following are the hydrogen production spreadsheets that are the basis for Chapter 5 in this report. As noted there, these charts are for different combinations of feedstock, status of technology (current versus possible future), and whether or not sequestration of carbon dioxide is required at facilities processing hydrocarbon feedstock. A modified version of Table 5-2, with additional pathways, is included here as Table E-1 for convenience in following the charts. This table lists the code for each pathway as used for identification in the charts.
The first spreadsheets are for the central station pathways, starting with a summary of the results in Table E-2. For each pathway, the hydrogen cost to the end user is listed as the sum of the production, distribution, and dispensing costs. The capital investment requirements and carbon dioxide emissions are also listed. Table E-3 is a summary of the design basis inputs for central plants. The central plants considered here can produce 1,200,000 kilograms of hydrogen per day (90 percent of the year), which will fuel more than 2 million fuel cell vehicles via four main transmission lines of 150 kilometers and 438 dispensing stations. The details for each pathway are then shown in Tables E-4 through E-12: first for natural gas, then coal, and nuclear. Finally, the associated transmission and dispensing analyses are shown in Tables E-13 through E-16.
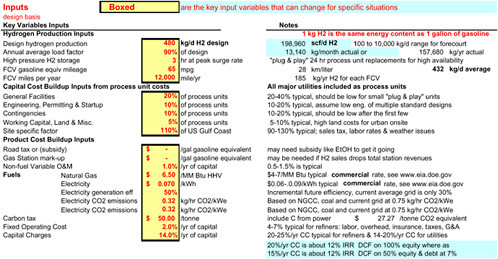
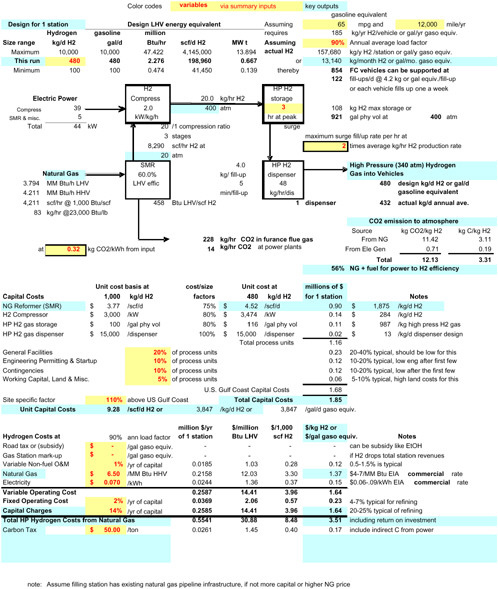
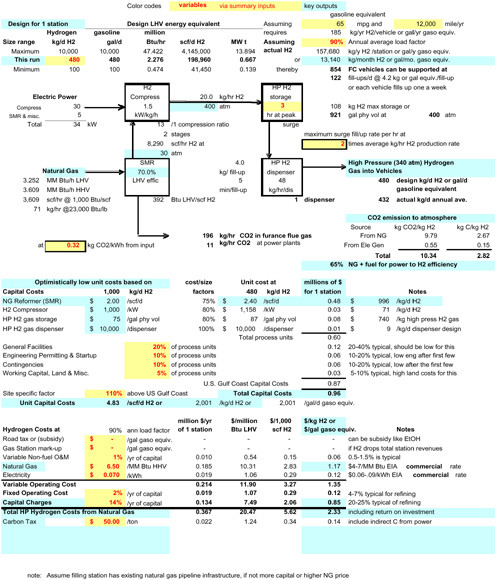
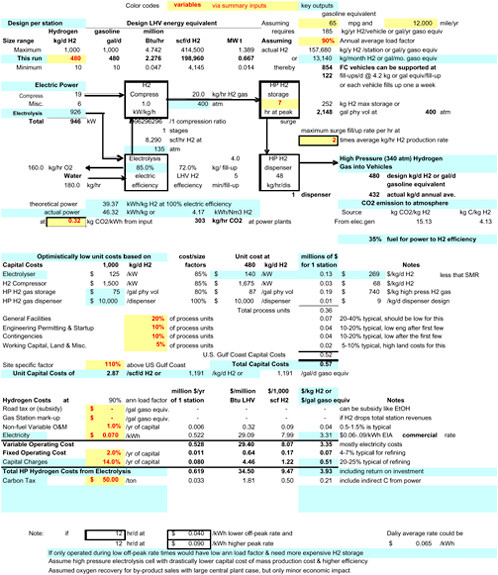
To illustrate the detailed production spreadsheets, take CS NG-C (Table E-4) as an example. The size of the plant (1,102,041 kg/day of hydrogen) and annual load factor (98 percent) are entered at the top. In the top right corner, the spreadsheet calculates the vehicles that this plant could fuel for the assumed fleet (2,135,250 vehicles equivalent to 65 miles-per-gallon hybrids). Then characteristics of the natural gas and electricity inputs are entered (the latter to calculate overall carbon dioxide emissions). Capital costs are calculated on a unit basis and then multiplied by the capacity assumed, for a total of $453 million. Finally, the hydrogen costs are calculated for the assumed fuel, other variable, and capital costs. The final figure is $1.03/kg at the plant, not including any charge for carbon emissions. Delivering the hydrogen to the filling station would add $0.42 (Table E-13), and the costs of the filling station itself would add another $0.54 (Table E-15) for a total of $1.99. The assumed charge for carbon emissions at the production plant and indirectly from electric power generation would add $0.13, for a grand total of $2.11 (“total H2 costs” for “CS NG-C” in Table E-2).
Midsize plants are next, starting with the summary and design basis inputs in Tables E-17 and E-18. Natural gas and electrolysis plants are included here, unlike in Chapter 5. The analyses are shown in Tables E-19 to E-28. Also included is the distribution cost via tanker truck and dispensing costs, in Tables E-29 to E-32.
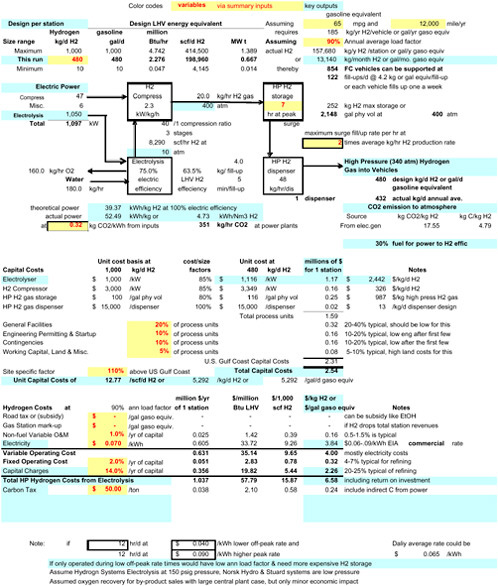
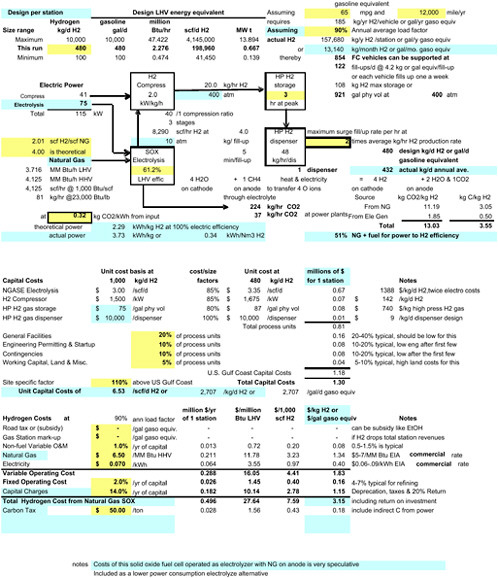
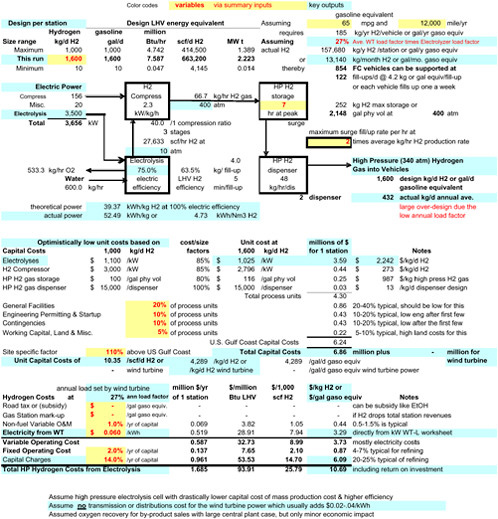
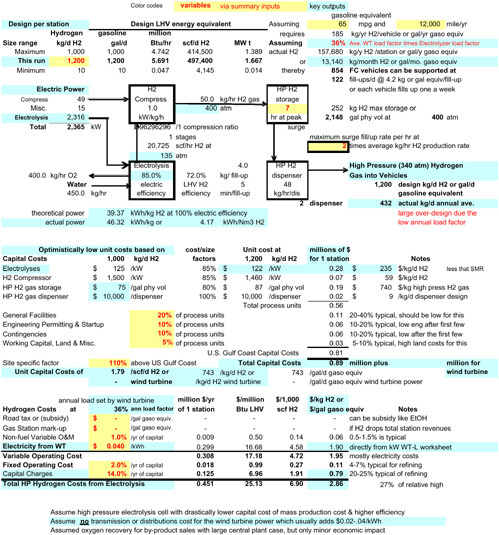
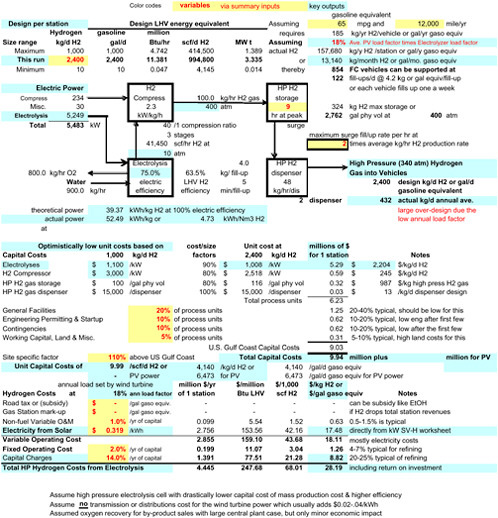
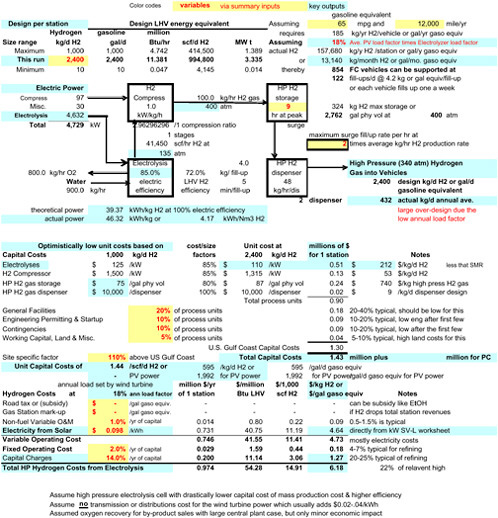
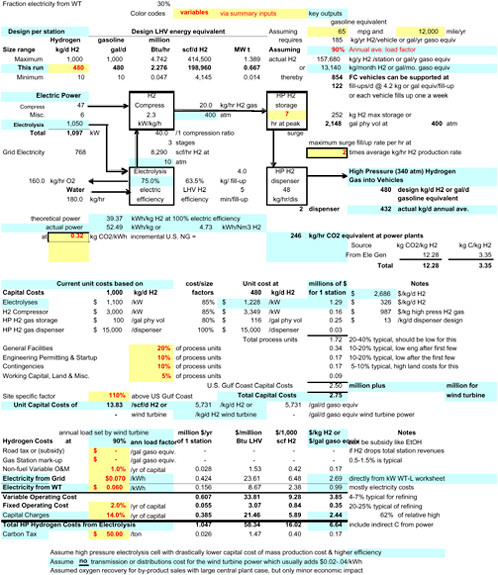
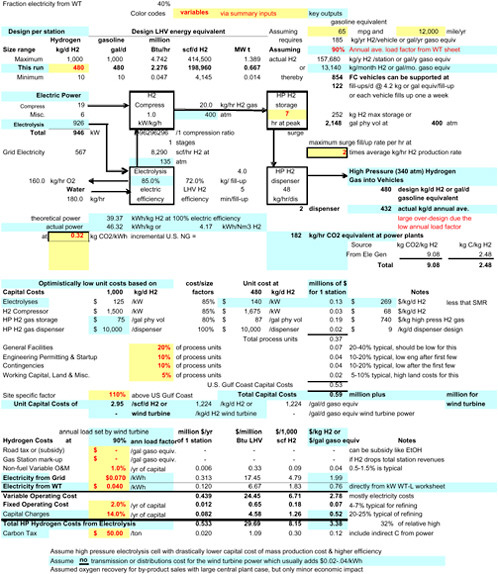
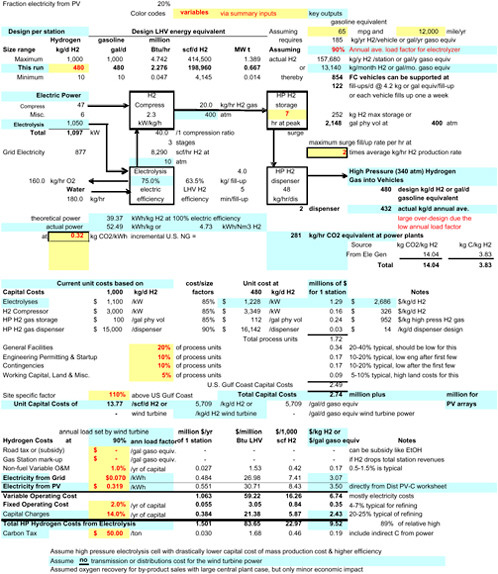
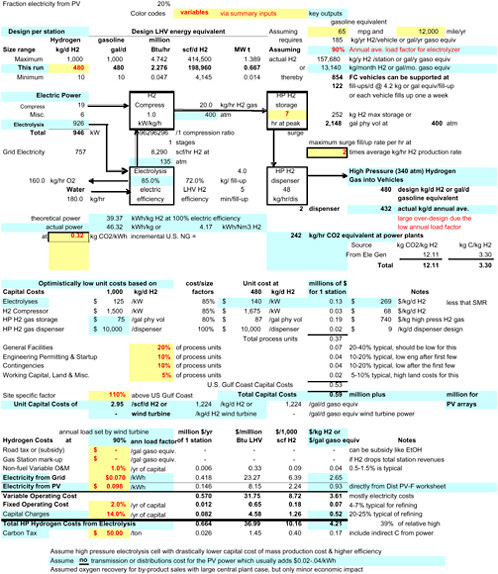
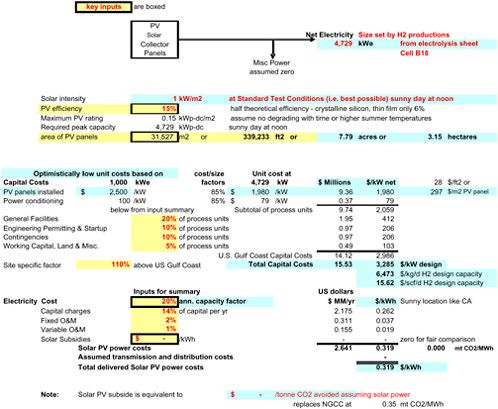
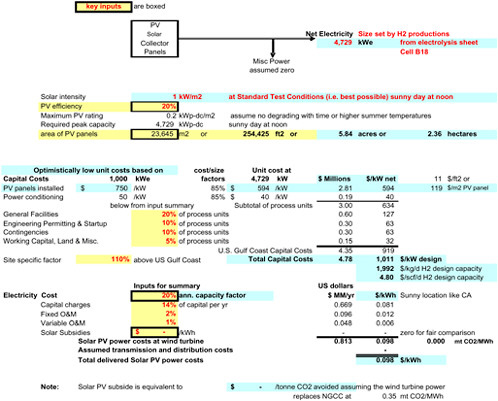
Distributed plants start with a summary and design basis inputs (Tables E-33 and E-34), then natural gas (Tables E-35 and E-36) and grid-based electrolysis (Tables E-37 to E-39) Included under the latter is a combination of natural-gas-assisted steam electrolysis case, for future technology only. Wind and photovoltaics are shown for both stand-alone units (Tables E-40 to E-43) and in combination with the power grid (Tables E-44 to E-47). Tables E-48 and E-49 show the detailed buildup of the cost of electricity from photovoltaics, which is an input to the electrolysis calculations.
TABLE E-1
Hydrogen Supply Chain Pathways Examined
TABLE E-2
Central Plant Summary of Results
|
Pathway |
CS NG-C |
CS NG-F |
CS NG-C-Seq |
CS NG-F- Seq |
CS Coal-C |
CS Coal-F |
CS Coal-C-Seq |
CS Coal-F-Seq |
CS Nu-F |
|
Table E- |
4 |
5 |
6 |
7 |
8 |
9 |
10 |
11 |
12 |
|
Capital investment, milion $ |
|
||||||||
|
H2 production |
453.39 |
326.85 |
623.75 |
425.54 |
1,151.92 |
868.18 |
1,177.33 |
889.97 |
2,468.19 |
|
Distribution |
724.75 |
532.98 |
724.75 |
532.98 |
724.75 |
532.98 |
724.75 |
532.98 |
532.98 |
|
Dispensing |
714.51 |
507.42 |
714.51 |
507.42 |
714.51 |
507.42 |
714.51 |
507.42 |
507.42 |
|
Total Capital Investment |
1,892.66 |
1,367.25 |
2,063.01 |
1,465.95 |
2,591.18 |
1,908.58 |
2,616.59 |
1,930.38 |
3,508.59 |
|
Production costs, $/kg H2 |
|
||||||||
|
Variable costs |
|
||||||||
|
Feed |
0.75 |
0.71 |
0.79 |
0.73 |
0.21 |
0.19 |
0.21 |
0.19 |
0.20 |
|
Electricity |
0.03 |
0.03 |
0.08 |
0.06 |
0.11 |
0.04 |
0.17 |
0.08 |
|
|
Decommission fund |
|
0.06 |
|||||||
|
Non-fuel O&M, 1%/yr of capital |
0.01 |
0.01 |
0.02 |
0.01 |
0.03 |
0.02 |
0.03 |
0.02 |
0.06 |
|
Total variable costs |
0.79 |
0.74 |
0.89 |
0.80 |
0.35 |
0.25 |
0.41 |
0.30 |
0.32 |
|
Fixed costs, 5%/yr of capital |
0.06 |
0.04 |
0.08 |
0.05 |
0.15 |
0.11 |
0.15 |
0.11 |
0.31 |
|
Capital charges, 18%/yr of capital |
0.18 |
0.13 |
0.25 |
0.17 |
0.46 |
0.35 |
0.47 |
0.36 |
1.00 |
|
Total Production Costs |
1.03 |
0.92 |
1.22 |
1.02 |
0.96 |
0.71 |
1.03 |
0.77 |
1.63 |
|
Distribution costs, $/kg H2 |
|
||||||||
|
Variable costs |
|
||||||||
|
Labor |
0 |
0 |
0 |
0 |
0 |
0 |
0 |
0 |
0 |
|
Fuel |
0 |
0 |
0 |
0 |
0 |
0 |
0 |
0 |
0 |
|
Electricity |
0.01 |
0.01 |
0.01 |
0.01 |
0.01 |
0.01 |
0.01 |
0.01 |
0.01 |
|
Non-fuel O&M, 1%/yr of capital |
0.02 |
0.01 |
0.02 |
0.01 |
0.02 |
0.01 |
0.02 |
0.01 |
0.01 |
|
Total variable costs |
0.03 |
0.02 |
0.03 |
0.02 |
0.03 |
0.02 |
0.03 |
0.02 |
0.02 |
|
Fixed costs, 5%/yr of capital |
0.09 |
0.07 |
0.09 |
0.07 |
0.09 |
0.07 |
0.09 |
0.07 |
0.07 |
|
Capital charges, 18%/yr of capital |
0.29 |
0.21 |
0.29 |
0.21 |
0.29 |
0.21 |
0.29 |
0.21 |
0.21 |
|
Total Distribution Costs |
0.42 |
0.31 |
0.42 |
0.31 |
0.42 |
0.31 |
0.42 |
0.31 |
0.31 |
|
Pathway |
CS NG-C |
CS NG-F |
CS NG-C-Seq |
CS NG-F- Seq |
CS Coal-C |
CS Coal-F |
CS Coal-C-Seq |
CS Coal-F-Seq |
CS Nu-F |
|
Table E- |
4 |
5 |
6 |
7 |
8 |
9 |
10 |
11 |
12 |
|
Dispensing costs, $/kg H2 |
|
||||||||
|
Variable costs |
|
||||||||
|
Electricity |
0.14 |
0.11 |
0.14 |
0.11 |
0.14 |
0.11 |
0.14 |
0.11 |
0.11 |
|
Non-fuel O&M, 1%/yr of capital |
0.09 |
0.06 |
0.09 |
0.06 |
0.09 |
0.06 |
0.09 |
0.06 |
0.06 |
|
Total variable costs |
0.23 |
0.17 |
0.23 |
0.17 |
0.23 |
0.17 |
0.23 |
0.17 |
0.17 |
|
Fixed costs, 5%/yr of capital |
0.05 |
0.04 |
0.05 |
0.04 |
0.05 |
0.04 |
0.05 |
0.04 |
0.04 |
|
Capital charges, 18%/yr of capital |
0.25 |
0.18 |
0.25 |
0.18 |
0.25 |
0.18 |
0.25 |
0.18 |
0.18 |
|
Total Dispensing Costs |
0.54 |
0.39 |
0.54 |
0.39 |
0.54 |
0.39 |
0.54 |
0.39 |
0.39 |
|
H2 costs, $/kg |
|
||||||||
|
Production |
1.03 |
0.92 |
1.22 |
1.02 |
0.96 |
0.71 |
1.03 |
0.77 |
1.63 |
|
Distribution |
0.42 |
0.31 |
0.42 |
0.31 |
0.42 |
0.31 |
0.42 |
0.31 |
0.31 |
|
Dispensing |
0.54 |
0.39 |
0.54 |
0.39 |
0.54 |
0.39 |
0.54 |
0.39 |
0.39 |
|
CO2 disposal |
0 |
0 |
0.09 |
0.08 |
0 |
0 |
0.16 |
0.15 |
|
|
Carbon tax |
0.13 |
0.12 |
0.02 |
0.02 |
0.26 |
0.23 |
0.04 |
0.03 |
|
|
Total H2 Costs |
2.11 |
1.73 |
2.28 |
1.82 |
2.17 |
1.63 |
2.19 |
1.64 |
2.33 |
|
Carbon dioxide vented to atmosphere |
|
||||||||
|
kg carbon/kg H2 |
2.51 |
2.39 |
0.42 |
0.35 |
5.12 |
4.56 |
0.82 |
0.60 |
|
|
Direct use |
2.45 |
2.34 |
0.26 |
0.24 |
4.90 |
4.50 |
0.49 |
0.45 |
|
|
Indirect use |
0.06 |
0.05 |
0.16 |
0.12 |
0.21 |
0.07 |
0.33 |
0.15 |
|
|
kg CO2/kg H2 |
9.22 |
8.75 |
1.53 |
1.30 |
18.76 |
16.73 |
3.00 |
2.21 |
|
|
Direct use |
8.99 |
8.56 |
0.95 |
0.88 |
17.98 |
16.49 |
1.80 |
1.65 |
|
|
Indirect use |
0.23 |
0.18 |
0.58 |
0.42 |
0.77 |
0.25 |
1.20 |
0.56 |
|
|
Carbon charge ($/kg) |
0.13 |
0.12 |
0.02 |
0.02 |
0.26 |
0.23 |
0.04 |
0.03 |
|
|
Carbon dioxide sequestered |
|
||||||||
|
Carbon dioxide (kg CO2/kg H2) |
|
|
8.56 |
7.91 |
|
|
16.19 |
14.84 |
|
|
Carbon |
|
|
2.34 |
2.16 |
|
|
4.41 |
4.05 |
|
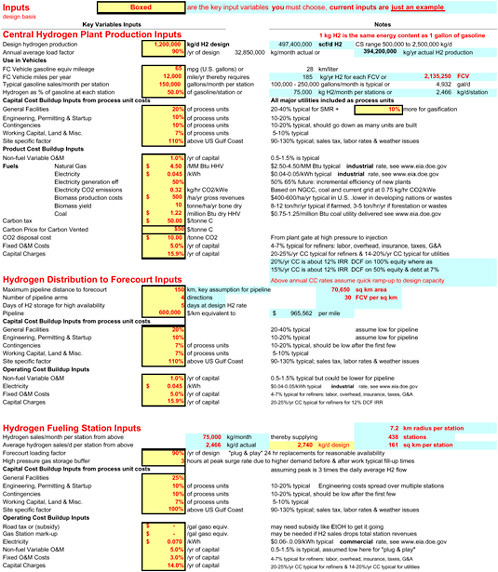
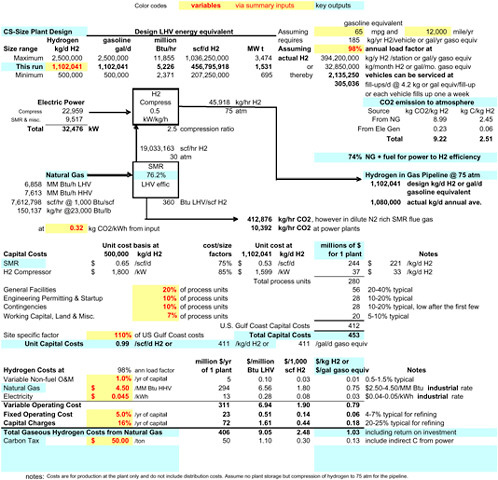
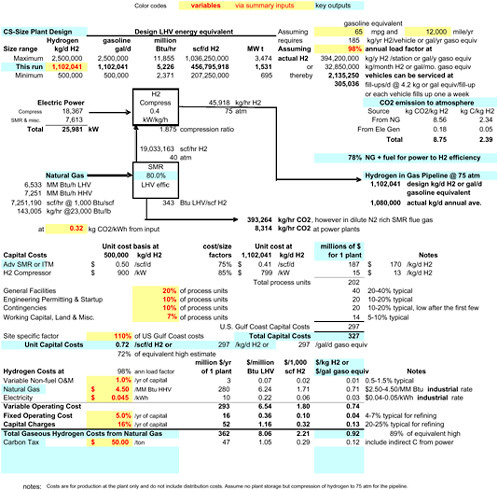
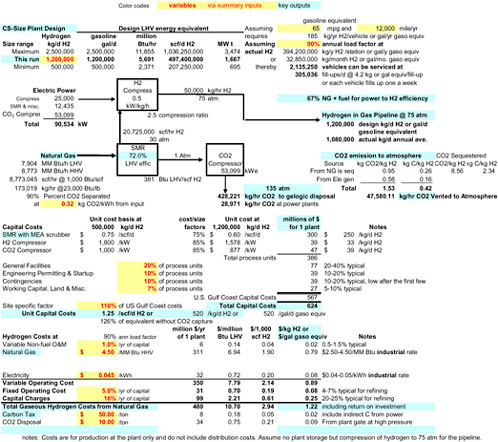
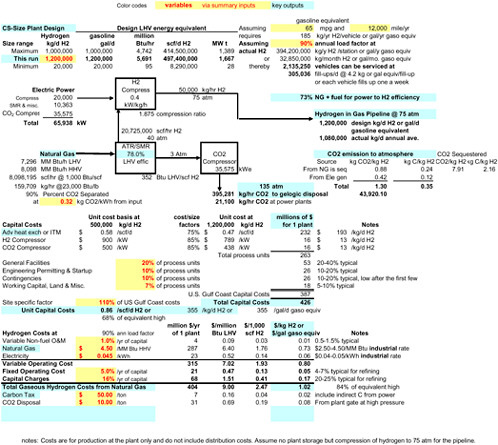
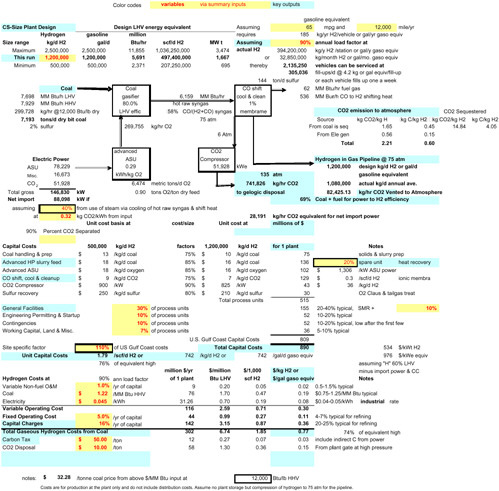
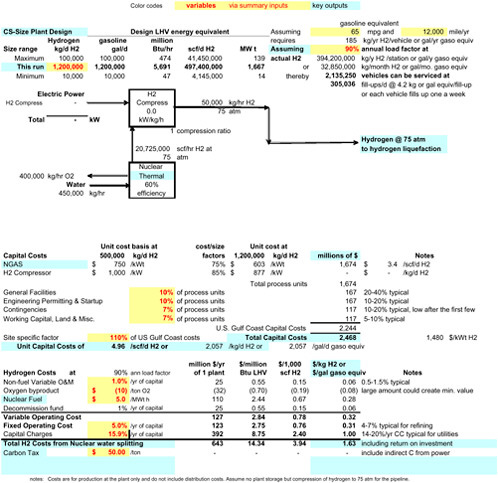
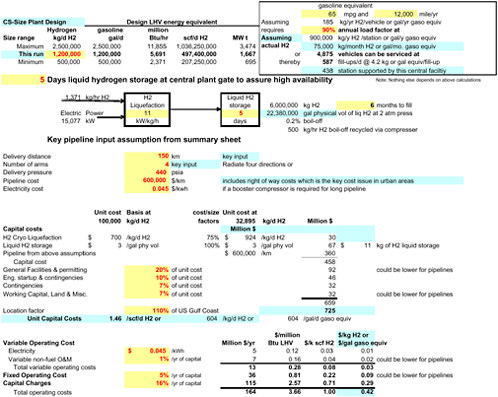
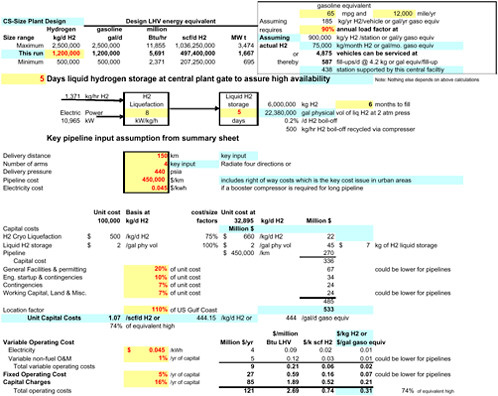
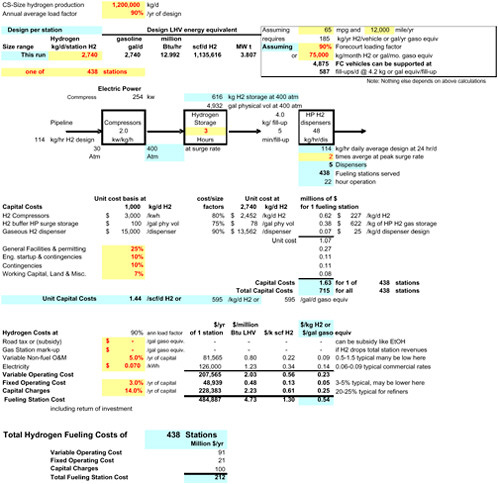
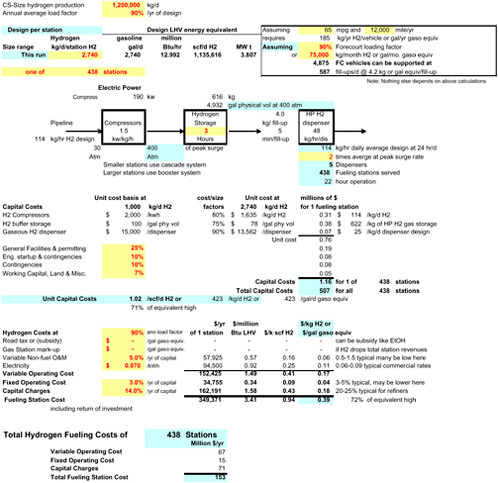
TABLE E-17
Midsize Plants Summary of Results
|
Pathway |
MS NG-C |
MS NG-FMS |
NG-C-SeMS |
NG-F-Se |
MS Bio-C |
MS Bio-F |
MS Bio-C-Se |
MS Bio-F-Se |
MS Ele-C |
MS Ele-F |
|
Table E- |
19 |
20 |
21 |
22 |
23 |
24 |
25 |
26 |
27 |
28 |
|
Capital investment, MM |
|
|||||||||
|
H2 production |
21.52 |
17.12 |
29.26 |
23.06 |
121.04 |
59.04 |
123.91 |
60.53 |
84.78 |
9.71 |
|
Distribution |
34.73 |
18.54 |
34.73 |
18.54 |
34.73 |
18.54 |
34.73 |
18.54 |
34.73 |
18.54 |
|
Dispensing |
20.70 |
9.01 |
20.70 |
9.01 |
20.70 |
9.01 |
20.70 |
9.01 |
20.70 |
9.01 |
|
Total Capital Investment |
76.95 |
44.67 |
84.69 |
50.61 |
176.46 |
86.59 |
179.33 |
88.08 |
140.20 |
37.26 |
|
Production costs, $/kg H2 |
|
|||||||||
|
Variable costs |
|
|||||||||
|
Feed |
0.79 |
0.74 |
0.82 |
0.79 |
0.98 |
0.42 |
0.98 |
0.42 |
(0.08) |
(0.08) |
|
Electricity |
0.04 |
0.03 |
0.10 |
0.08 |
0.29 |
0.14 |
0.41 |
0.21 |
2.43 |
2.11 |
|
Non-fuel O&M, 1%/yr of capital |
0.03 |
0.02 |
0.03 |
0.03 |
0.15 |
0.07 |
0.16 |
0.08 |
0.11 |
0.01 |
|
Total variable costs |
0.86 |
0.79 |
0.96 |
0.90 |
1.42 |
0.64 |
1.54 |
0.71 |
2.46 |
2.04 |
|
Fixed costs, 5%/yr of capital |
0.13 |
0.10 |
0.17 |
0.13 |
0.77 |
0.37 |
0.79 |
0.38 |
0.54 |
0.06 |
|
Capital charges, 18%/yr of capital |
0.40 |
0.32 |
0.54 |
0.43 |
2.44 |
1.19 |
2.50 |
1.22 |
1.71 |
0.20 |
|
Total Production Costs |
1.38 |
1.21 |
1.67 |
1.46 |
4.63 |
2.21 |
4.82 |
2.32 |
4.70 |
2.30 |
|
Distribution costs, $/kg H2 |
|
|||||||||
|
Variable costs |
|
|||||||||
|
Labor |
0.09 |
0.09 |
0.09 |
0.09 |
0.09 |
0.09 |
0.09 |
0.09 |
0.09 |
0.09 |
|
Fuel |
0.01 |
0.01 |
0.01 |
0.01 |
0.01 |
0.01 |
0.01 |
0.01 |
0.01 |
0.01 |
|
Electricity |
0.50 |
0.36 |
0.50 |
0.36 |
0.50 |
0.36 |
0.50 |
0.36 |
0.50 |
0.36 |
|
Non-fuel O&M, 1%/yr of capital |
0.06 |
0.03 |
0.06 |
0.03 |
0.06 |
0.03 |
0.06 |
0.03 |
0.06 |
0.03 |
|
Total variable costs |
0.65 |
0.49 |
0.65 |
0.49 |
0.65 |
0.49 |
0.65 |
0.49 |
0.65 |
0.49 |
|
Fixed costs, 5%/yr of capital |
0.28 |
0.15 |
0.28 |
0.15 |
0.28 |
0.15 |
0.28 |
0.15 |
0.28 |
0.15 |
|
Capital charges, 18%/yr of capital |
0.88 |
0.47 |
0.88 |
0.47 |
0.88 |
0.47 |
0.88 |
0.47 |
0.88 |
0.47 |
|
Total Distribution Costs |
1.80 |
1.10 |
1.80 |
1.10 |
1.80 |
1.10 |
1.80 |
1.10 |
1.80 |
1.10 |
|
Dispensing costs, $/kg H2 |
|
|||||||||
|
Variable costs |
|
|||||||||
|
Road tax |
- |
- |
- |
- |
- |
- |
- |
- |
- |
- |
|
Station markup |
- |
- |
- |
- |
- |
- |
- |
- |
- |
- |
|
Electricity |
0.06 |
0.06 |
0.06 |
0.06 |
0.06 |
0.06 |
0.06 |
0.06 |
0.06 |
0.06 |
|
Non-fuel O&M, 1%/yr of capital |
0.13 |
0.06 |
0.13 |
0.06 |
0.13 |
0.06 |
0.13 |
0.06 |
0.13 |
0.06 |
|
Total variable costs |
0.18 |
0.11 |
0.18 |
0.11 |
0.18 |
0.11 |
0.18 |
0.11 |
0.18 |
0.11 |
|
Fixed costs, 5%/yr of capital |
0.08 |
0.03 |
0.08 |
0.03 |
0.08 |
0.03 |
0.08 |
0.03 |
0.08 |
0.03 |
|
Capital charges, 18%/yr of capital |
0.36 |
0.16 |
0.36 |
0.16 |
0.36 |
0.16 |
0.36 |
0.16 |
0.36 |
0.16 |
|
Total Dispensing Costs |
0.62 |
0.30 |
0.62 |
0.30 |
0.62 |
0.30 |
0.62 |
0.30 |
0.62 |
0.30 |
|
H2 Costs, $/kg |
|
|||||||||
|
Production |
1.38 |
1.21 |
1.67 |
1.46 |
4.63 |
2.21 |
4.82 |
2.32 |
4.70 |
2.30 |
|
Distribution |
1.80 |
1.10 |
1.80 |
1.10 |
1.80 |
1.10 |
1.80 |
1.10 |
1.80 |
1.10 |
|
Dispensing |
0.62 |
0.30 |
0.62 |
0.30 |
0.62 |
0.30 |
0.62 |
0.30 |
0.62 |
0.30 |
|
CO2 disposal |
0 |
0 |
0.09 |
0.09 |
0 |
0 |
0.26 |
0.17 |
0 |
0 |
|
Carbon Tax |
0.13 |
0.12 |
0.02 |
0.02 |
0.03 |
0.01 |
(0.31) |
(0.21) |
0.24 |
0.20 |
|
Total H2 Costs |
3.94 |
2.74 |
4.20 |
2.97 |
7.07 |
3.63 |
7.19 |
3.68 |
7.36 |
3.91 |
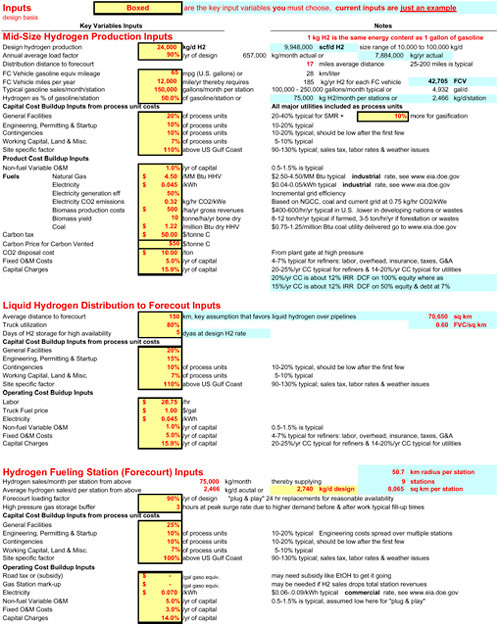
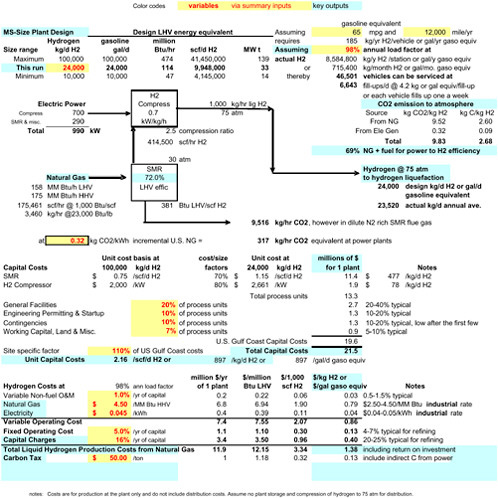
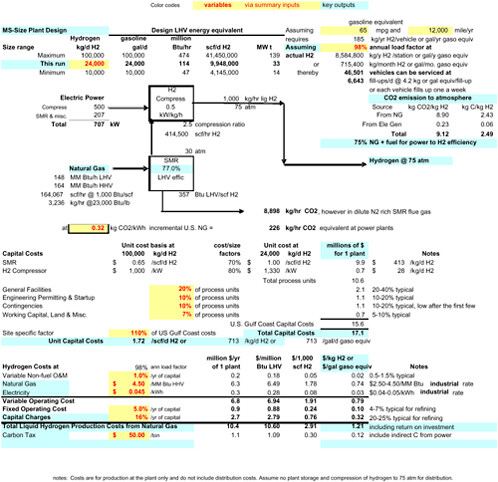
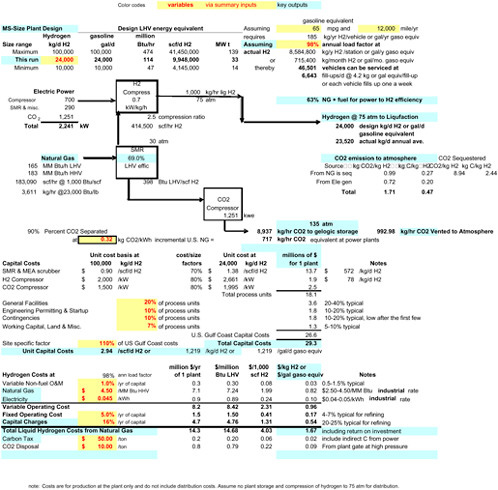
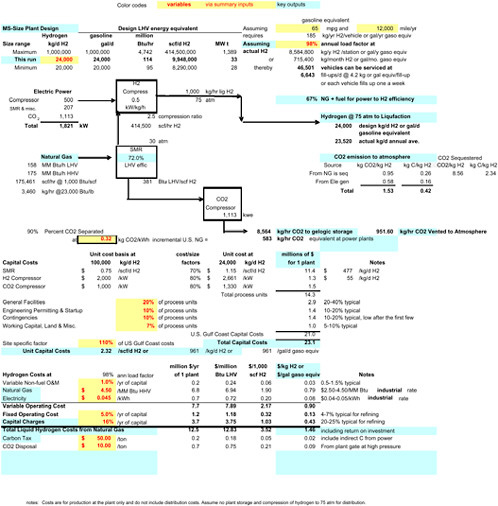
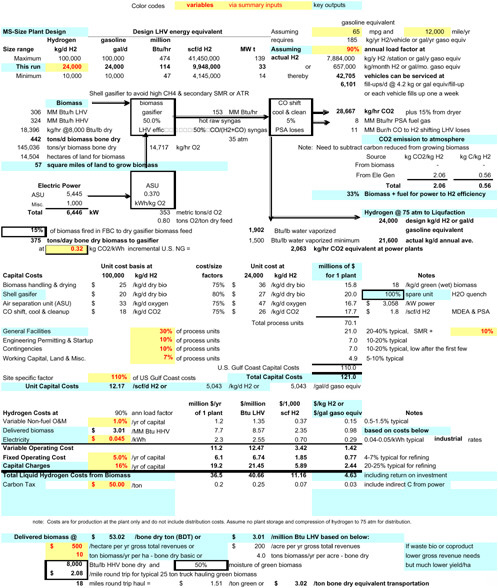
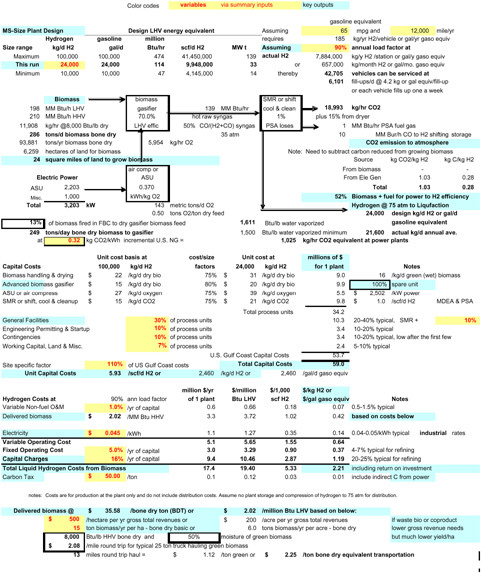
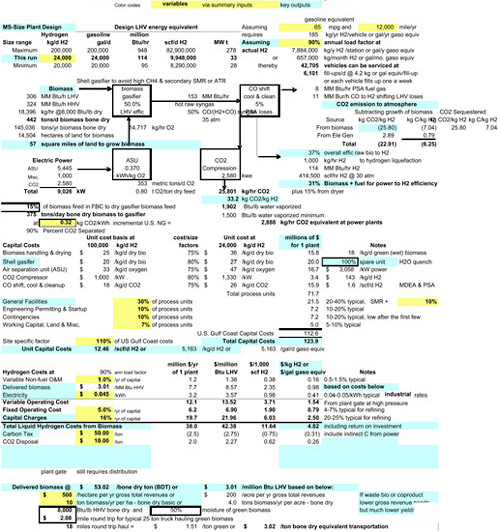
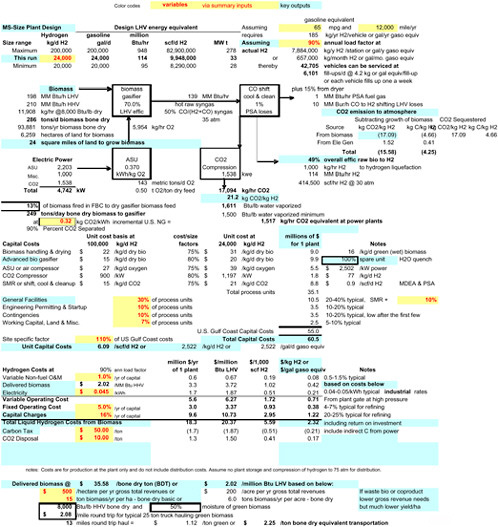
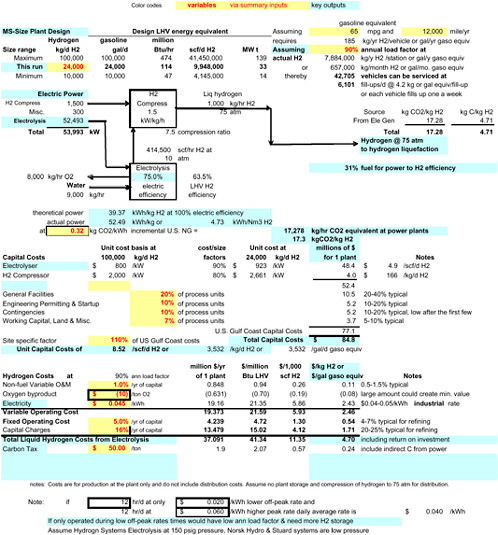
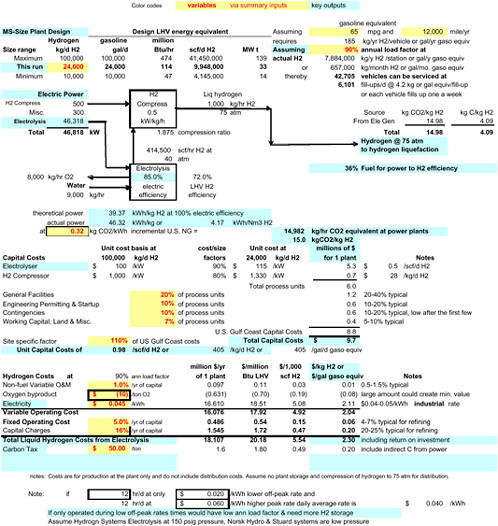
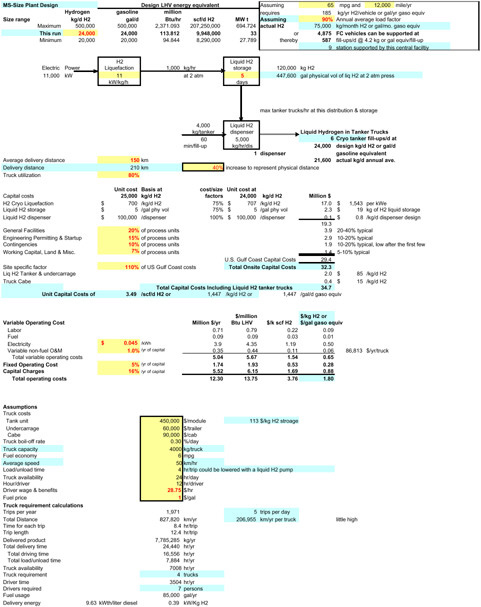
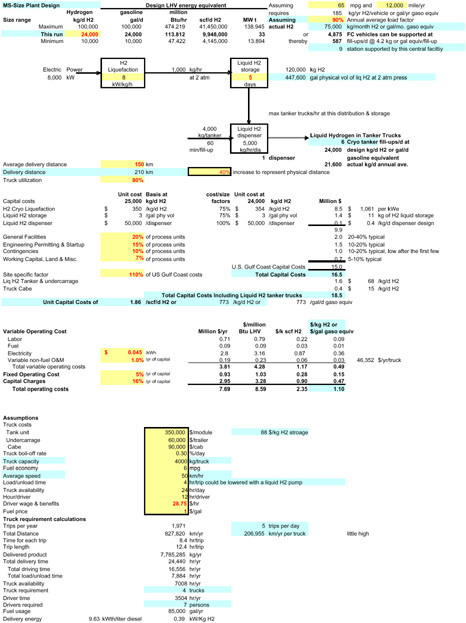
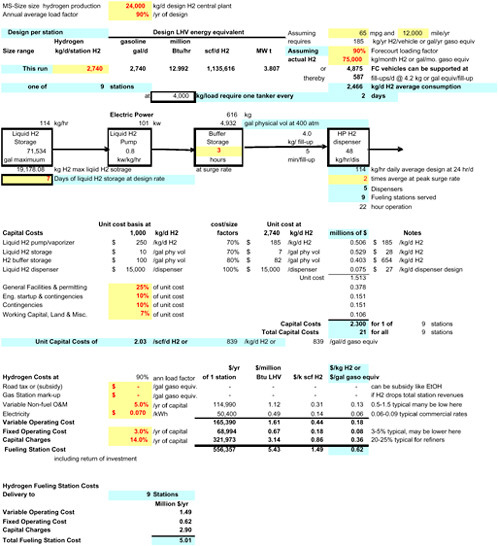
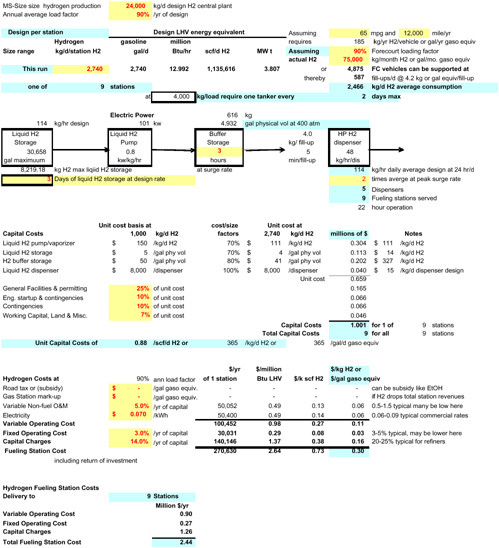
TABLE E-33
Distributed Plant Summary of Results
|
Pathway |
Dist NG-C |
Dist NG-F |
Dist Elec-C |
Dist Elec-F |
Dis NGASE |
|
Table E- |
35 |
36 |
37 |
38 |
39 |
|
Capital investment, MM |
1.85 |
0.96 |
2.54 |
0.57 |
1.30 |
|
Production costs s/kg H2 |
|
||||
|
Variable costs |
|
||||
|
Road tax or (subsidy) |
— |
— |
— |
— |
— |
|
Gas Station mark-up |
— |
— |
— |
— |
— |
|
Feed |
1.37 |
1.17 |
|
|
1.34 |
|
Electricity |
0.15 |
0.12 |
384 |
3.31 |
0.40 |
|
Non-fuel O&M, %/yr of capital |
0.12 |
0.06 |
0.16 |
0.04 |
0.08 |
|
Total variable costs |
1.64 |
1.35 |
4.00 |
3.35 |
1.83 |
|
Fixed costs, %/yr of capital |
0.23 |
0.12 |
0.32 |
0.07 |
0.16 |
|
Capital charges |
1.64 |
0.85 |
2.26 |
0.51 |
1.15 |
|
Total Production Costs |
3.51 |
2.33 |
6.58 |
3.93 |
3.15 |
|
Carbon Tax |
0.17 |
0.14 |
0.24 |
0.21 |
0.18 |
|
TOTAL H2 Costs |
3.68 |
2.47 |
6.82 |
4.13 |
3.32 |
|
Carbon Dioxide Vented to Atmosphere |
|
||||
|
KG Carbon/KG H2 |
3.31 |
2.82 |
4.79 |
4.13 |
355 |
|
Direct Use |
3.11 |
2.67 |
|
|
3.05 |
|
Indirect Use |
0.19 |
0.15 |
4.79 |
4.13 |
0.50 |
|
KG CO2/KG H2 |
12.13 |
10.34 |
15.13 |
15.13 |
13.03 |
|
Direct Use |
11.42 |
9.79 |
|
|
11.19 |
|
Indirect Use |
0.71 |
0.55 |
15.13 |
15.13 |
1.85 |
|
Dis WI EIe-C |
Dis WT El-F |
Di PV El-C |
Di PV El-F |
Di WI Gr C |
Di WT Gr F |
Di PV-Gr-C |
Di PV-Gr-F |
|
40 |
41 |
42 |
43 |
44 |
45 |
46 |
47 |
|
6.86 |
0.89 |
9.94 |
1.43 |
2.75 |
0.59 |
2.74 |
0.59 |
|
— |
— |
— |
— |
|
|
|
|
|
— |
— |
— |
— |
|
|
|
|
|
3.29 |
1.90 |
17.48 |
4.64 |
3.67 |
2.75 |
6.57 |
3.58 |
|
0.44 |
0.06 |
0.63 |
0.09 |
0.17 |
0.04 |
0.17 |
0.04 |
|
3.73 |
1.95 |
18.11 |
4.73 |
385 |
2.78 |
6.74 |
3.61 |
|
0.87 |
0.11 |
1.26 |
0.18 |
0.35 |
0.07 |
0.35 |
0.07 |
|
6.09 |
0.79 |
8.82 |
1.27 |
2.44 |
0.52 |
2.43 |
0.52 |
|
10.69 |
2.86 |
28.19 |
6.18 |
6.64 |
3.38 |
9.52 |
4.21 |
|
|
|
|
|
0.17 |
0.12 |
0.19 |
0.17 |
|
10.69 |
2.86 |
28.19 |
6.18 |
6.81 |
3.50 |
9.71 |
4.37 |
|
|
|
|
|
3.35 |
2.48 |
3.83 |
3.30 |
|
|
|
|
|
3.35 |
2.48 |
3.83 |
3.30 |
|
|
|
|
|
12.28 |
9.08 |
14.04 |
12.11 |
|
|
|
|
|
12.28 |
9.08 |
14.04 |
12.11 |