
Appendix F
U.S. Energy Systems
INTRODUCTION
This appendix briefly describes some of the major characteristics of the current and evolving energy system. These characteristics will be important factors in determining the competitiveness of hydrogen and the feasibility of introducing it without disrupting the system. For example, natural gas is the most likely feedstock for producing hydrogen, at least at first, but resource constraints may limit growth.
ENERGY SUPPLY SYSTEMS
Petroleum
Petroleum is used for a variety of purposes in the domestic economy, the most important being for transportation, especially automobiles, trucks, and airplanes. The United States was self-sufficient in petroleum roughly 50 years ago, after which demand outpaced domestic production and the United States began to import growing volumes of petroleum from abroad. Today, the United States depends on foreign sources for about 55 percent of its petroleum needs, and this fraction is continually increasing (EIA, 2003).
Petroleum is extracted from underground reservoirs via oil wells. It is then moved by pipeline or ship to a refinery where it is transformed into finished products, including various grades of gasoline, diesel fuels, jet fuels, home heating oil, bunker fuels, lubricants, and chemical feedstocks. Most finished fuels are moved by product pipelines to distribution terminals. From the terminals, fuels are moved to gasoline stations, truck stops, airports, and so on, where most end users obtain their fuels.
The U.S. petroleum system is massive. It includes 161 oil refineries; 2,000 oil storage terminals; approximately 220,000 miles of crude oil and oil products lines; and more than 175,000 gasoline service stations (NRC, 2002). The lifetimes of this capital stock vary considerably. Crude and product pipelines, refineries, and terminals have extremely long lifetimes (many decades), because they are in a constant state of repair, upgrade, and partial replacement.
In addition to the supply system, there is a vast array of end-use equipment dependent on petroleum products. Automobiles and light trucks, the end users most likely to be converted to hydrogen, have a lifetime of about 15 years. Thus, gasoline-burning vehicles produced in 2020 will still require a fuel supply in 2035 and later.
One of the materials extensively used in petroleum refining and chemical plants is hydrogen. A significant infrastructure currently exists for the manufacture, distribution, and use of hydrogen. Table F-1 provides information on the current U.S. hydrogen system and compares that system with the current U.S. gasoline system to provide some perspective on the challenge of substituting hydrogen for gasoline as an automobile fuel (EIA, 2003). Most hydrogen is produced onsite by the user. Nevertheless, this production (about 8 billion kg/yr) is equal to the hydrogen that would be required to fuel the light-duty vehicles postulated to be operating in 2028 (see Figure 6-3 in Chapter 6 of this report). Thus, the United States has substantial experience with producing and handling hydrogen.
Petroleum, natural gas, and coal are responsible for the vast majority of world energy production. These fuels are finite resources, and they are being depleted. Figure F-1 shows the world’s estimated remaining fossil fuel resources.
For decades, various analysts have predicted petroleum resource constraints. U.S. production peaked in the 1970s, but international production has so far shown no signs of faltering. At some point, resource constraints will prevent supply from keeping up with demand, and prices will increase. This report makes no attempt to determine when this might happen, and assumes a price of $30/bbl for petroleum from now until 2050 (see Chapters 4 and 5, and Appendix E). However, the committee notes that constraints might emerge within the time frame of this study. Two EIA production scenarios are shown in Figure F-2 (EIA, 2000). These projections include both conventional petroleum and unconventional petroleum resources, such as tar sands and heavy oils.
TABLE F-1 Some Perspective on the Size of the Current Hydrogen and Gasoline Production and Distribution Systems in the United States
|
Characteristic |
Hydrogen System |
Gasoline System |
|
Production |
9 million tons per year |
150 million tons per year of gasoline equivalent |
|
Pipeline capacity |
<700 miles |
~200,000 miles of petroleum and product |
|
Distribution stations |
<15 |
>175,000 |
|
Delivery trucks |
~19 2,600 psi hydrogen trucks to deliver the equivalent of one gasoline tank truck |
|
|
SOURCE: EIA (2002). |
||
Natural Gas
Approximately 24 percent of U.S. energy demand in 2001 was satisfied by natural gas. Over 90 percent was produced domestically, with almost all of the rest imported from Canada (EIA, 2003). Natural gas is found in underground reservoirs, often in combination with petroleum, and is accessed by wells similar to oil wells. Once it is brought to the surface, natural gas is processed to remove impurities, and a mercaptan is added to provide the “rotten egg” smell that facilitates easy detection of leaks. Natural gas is then compressed and transmitted to storage facilities and end users.
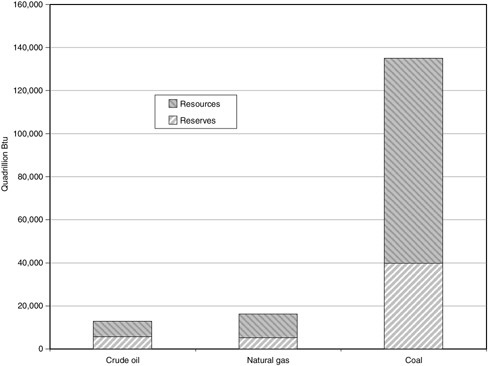
FIGURE F-1 World fossil energy resources. SOURCE: IPCC (2001b).
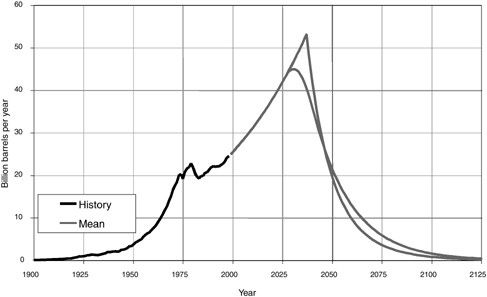
FIGURE F-2 Annual production scenarios for the mean resource estimate showing sharp and rounded peaks, 1900–2125. Growth rate leading to either peak is 2 percent. Sharp peak occurs in 2037 followed by decline at reserve to production ratio of 10. Rounded peak occurs in 2030 followed by decline at 5 percent. U.S. volumes were added to the USGS (2000) foreign volumes estimate to obtain a world total of 3,000 billion barrels (mean value) of ultimately recoverable resources. SOURCE: EIA (2000).
The U.S. natural gas system includes 726 natural-gas-processing plants; 410 underground gas storage fields; 254,000 miles of gas transmission lines; and 980,000 miles of local distribution pipelines (NPC, 2001). Natural gas is used extensively in homes and buildings for heating, and it is an important feedstock for chemical plants, fertilizer production, and industrial processes. Finally, its most rapidly growing use is in the production of electrical power, where it has become the fuel of choice for the majority of new electric power generation plants.
Natural gas resources are as much a cause of concern as petroleum. While much natural gas is still available in this country (especially in Alaska, if a pipeline can be built to access it), and significant new reserves may still be discovered, consumption already is rising rapidly. Furthermore, gas fields tend to deplete faster than oil fields, and advanced techniques such as enhanced oil recovery do not apply to gas. In addition, gas is more difficult to import from overseas. The main technique is liquefying it at very low temperatures, shipping it via insulated tanker ships, and reheating it at the port of entry, a technique which is also vulnerable to terrorism. Thus it is not clear that natural gas will be more than an interim source of hydrogen.
Coal
U.S. coal reserves total about 270 billion short tons, approximately 25 percent of total world reserves. Annual U.S. consumption is just over 1 billion short tons, giving a reserve life of approximately 275 years at today’s level of use. The reserves are sufficient to warrant consideration of coal as a primary feedstock for future hydrogen production.
In 2002, the top four coal-producing states were Wyoming (373 million short tons [st]), West Virginia (150 million st), Kentucky (124 million st) and Pennsylvania (68 million st) (National Mining Association, 2003). Many other states also have significant resources. Coal can be shipped long distances by train at low cost. Thus, coal can be considered as an option for primary feedstock in all regions of the United States.
In 2002, approximately 92 percent of all coal produced in the United States—that is, about 982 million st—was used
to generate electric power, representing about 50 percent of the total power produced (EIA, 2003). The remaining 8 percent of consumption occurs in coke plants, other industrial plants (including combined heat and power applications), and residential and commercial uses.
On a worldwide basis, approximately 34 percent of all power is generated with coal, which is expected to fall to 31 percent by 2025. Outside the United States and Europe, the most common use of coal is in the steel industry and for steam and direct heating in industrial applications (e.g., chemical, cement, and pulp and paper industries). China, India, and Russia are other large users of coal.
Nuclear Power
About 20 percent of the nation’s electricity is produced by nuclear power plants, which consume uranium. Low-cost uranium for nuclear reactors is currently very plentiful in the United States and elsewhere in the world. Very few nuclear reactors are being built these days, so little exploration for uranium has occurred in recent decades. However, a nuclear revival, whether for electricity or hydrogen, would spur uranium prospecting and might cause uranium prices to escalate in the long term.
Current known, recoverable world resources of uranium are approximately 3.1 million tons, estimated to be sufficient for about 50 years at current levels of consumption. A doubling of price from present levels is projected to create a 10-fold increase in these resources. Moving from current nuclear power technology to breeder reactors is estimated to increase uranium utilization another 60-fold (World Nuclear Association, 2002). Breeder reactors, however, would aggravate some of the issues now associated with the nuclear industry, including those surrounding safety and nuclear proliferation, while possibly reducing the waste disposal problem.
It is clear that there is an enormous supply of available fuel for use in nuclear power plants. However, the future of nuclear power in the United States is by no means clear. Current problems with the further use of nuclear power in the United States include economics—costs for new nuclear power plants are above current market acceptability—and public acceptance, which may have moderated in recent years but remains to be tested.
THE ELECTRIC POWER SYSTEM
Electric power is produced from a variety of fuels and energy sources. In 2001, coal was responsible for over 50 percent of U.S. electric power, nuclear for roughly 20 percent, natural gas for 17 percent, hydroelectric for 8 percent, and others for the remaining 5 percent (EIA, 2003). The electric power system includes approximately 10,400 generating stations, with a total installed capacity of 786 gigawatts (EIA, 2001). In addition, there is a significant distributed electric power generation capacity of about 70 GW from about 10 million generators, which operate for widely varying periods of time each year (see Chapter 3 in this report).
Nearly 160,000 miles of high-voltage electrical transmission lines in the United States carry power from power stations to load centers (Edison Electric Institute, 2002). In addition, distribution lines carry the power from substations to end users. The electrical power system is fundamentally different from the liquid or gaseous fuel supply systems, which involve fluid flows that are relatively easy to direct and control. Electric power flow, which is dictated by complex physics principles, can often be difficult to control.
New transmission lines are increasingly difficult to build, largely because of public opposition. This appears to have been a contributing factor behind the widespread blackout in August 2003. The transmission system is being used for purposes for which it was not originally designed, and upgrades are not keeping pace with the increasing loads on it. Unless this situation is corrected, it may hamper the use of electrolyzers in distributed hydrogen generation facilities. Building pipelines to carry hydrogen may encounter some of the same siting problems. Distributed power systems, using small generating plants (probably burning natural gas) close to hydrogen load centers may help to overcome transmission constraints but may also increase vulnerability to natural gas disruptions.
Electricity is very expensive to store, so it is generated as needed. Hydrogen is somewhat easier to store and, as discussed elsewhere in this report, hydrogen could be used in conjunction with the electric system as backup storage, so that hydrogen would be generated at times of ample power in a reversible fuel cell and reconverted as needed (see Chapter 8 and Appendix G in this report).


