
G
Data Analysis of Table 1, Randich et al.
The Randich et al. (Ref. 1) paper is based on an analysis of compositional data provided by two secondary lead smelters to bullet manufacturers on their lead alloy shipments. For each element, Randich et al. provide three measurements from each of 28 lead (melt) lots being poured into molds. The measurements were taken at the beginning (B), middle (M), and end (E) “position” of each pour. In this appendix, the variability in the measurements within a lot (due to position) is compared with the variability across lots. Consistent patterns in the lots and positions are also investigated.
Let uijk denote the logarithm of the reported value in position i (i = 1, 2, 3, for B, M, E) in lot j (j = 1, …, 28), on element k (k = 1, …, 6, for Sb, Sn, Cu, As, Bi, and Ag). A simple additive model for uijk in terms of the two factors position and lot is
where ![]() k denotes the typical value of uijk over all positions and lots (usually estimated as the mean over all positions and lots,
k denotes the typical value of uijk over all positions and lots (usually estimated as the mean over all positions and lots, ![]() ); ρik denotes the typical effect of position i for element k, above or below
); ρik denotes the typical effect of position i for element k, above or below ![]() k (usually estimated as the mean over all lots minus the overall mean,
k (usually estimated as the mean over all lots minus the overall mean, ![]() ); λjk denotes the typical effect of lot j for element k, above or below
); λjk denotes the typical effect of lot j for element k, above or below ![]() k (usually estimated as the mean over all positions minus the overall mean,
k (usually estimated as the mean over all positions minus the overall mean, ![]() ); and εijk is the error term that accounts for any difference that remains between uijk and the sum of the effects just defined (usually estimated as
); and εijk is the error term that accounts for any difference that remains between uijk and the sum of the effects just defined (usually estimated as
Because replicate measurements are not included in Table 1 of Randich et al., we are unable to assess the existence of an interaction term between position and lot; such an interaction, if it exists, must be incorporated into the error term, which also includes simple measurement error. The parameters of the model (![]() k, ρik, λjk) can also be estimated more robustly via median polish (Ref. 2), which uses medians rather than means and thus provides more robust estimates, particularly when the data include a few outliers or extreme values that will adversely affect sample means (but not sample medians). This additive model was verified for each element by using Tukey’s diagnostic plot for two-way tables (Ref. 2, 3).
k, ρik, λjk) can also be estimated more robustly via median polish (Ref. 2), which uses medians rather than means and thus provides more robust estimates, particularly when the data include a few outliers or extreme values that will adversely affect sample means (but not sample medians). This additive model was verified for each element by using Tukey’s diagnostic plot for two-way tables (Ref. 2, 3).
The conventional way to assess the signficance of the two factors is to compare the variance of the position effects, Var![]() and the variance of the lot effects, Var
and the variance of the lot effects, Var![]() scaled to the level of a single observation, with the variance of the estimated error term, Var(rijk). Under the null hypothesis that all ρik are zero (position has no particular effect on the measurements, beyond the anticipated measurement error), the ratio of 28·Var
scaled to the level of a single observation, with the variance of the estimated error term, Var(rijk). Under the null hypothesis that all ρik are zero (position has no particular effect on the measurements, beyond the anticipated measurement error), the ratio of 28·Var![]() to Var
to Var![]() should follow an F distribution with two and 54 degrees of freedom; ratios that exceed 3.168 would be evidence that position affects measurements more than could be expected from mere measurement error.
should follow an F distribution with two and 54 degrees of freedom; ratios that exceed 3.168 would be evidence that position affects measurements more than could be expected from mere measurement error.
Table G.1 below provides the results of the two-way analysis of variance with two factors, position and lot, for each element. The variances of the effects, scaled to the level of a single observation, are given in the column headed “Mean Sq”; the ratio of the mean squares is given under “F Value”; and the P value of
TABLE G.1 Analyses of Variance for Log(Measurement) Using Table 1 in Randich et al. (Ref. 1)
|
Sb |
Df |
Sum Sq |
Mean Sq |
F Value |
Pr (> F) |
MS (median polish) |
|
Position |
2 |
0.001806 |
0.000903 |
2.9449 |
0.06111 |
0.004 |
|
Lot |
27 |
0.111378 |
0.004125 |
13.4514 |
1.386e-15 |
0.0042 |
|
Residuals |
54 |
0.016560 |
0.000307 |
|
|
|
|
Sn |
Df |
Sum Sq |
Mean Sq |
F Value |
Pr (> F) |
MS (median polish) |
|
Position |
2 |
2.701 |
1.351 |
7.5676 |
0.001267 |
0.2345 |
|
Lot |
27 |
147.703 |
5.470 |
30.6527 |
<2.2e-16 |
6.0735 |
|
Residuals |
54 |
9.637 |
0.178 |
|
|
|
|
Cu |
Df |
Sum Sq |
Mean Sq |
F Value |
Pr (> F) |
MS (median polish) |
|
Position |
2 |
0.006 |
0.003 |
0.1462 |
0.8643 |
0.00003 |
|
Lot |
27 |
102.395 |
3.792 |
176.9645 |
<2e-16 |
4.1465 |
|
Residuals |
54 |
1.157 |
0.021 |
|
|
|
|
As |
Df |
Sum Sq |
Mean Sq |
F Value |
Pr (> F) |
MS (median polish) |
|
Position |
2 |
0.0127 |
0.0063 |
2.1046 |
0.1318 |
0.0036 |
|
Lot |
27 |
15.4211 |
0.5712 |
189.5335 |
<2e-16 |
.5579 |
|
Residuals |
54 |
0.1627 |
0.0030 |
|
|
|
|
Bi |
Df |
Sum Sq |
Mean Sq |
F Value |
Pr (> F) |
MS (median polish) |
|
Position |
2 |
0.000049 |
0.000024 |
0.3299 |
0.7204 |
0.0000 |
|
Lot |
27 |
0.163701 |
0.006063 |
81.9890 |
<2e-16 |
0.0061 |
|
Residuals |
54 |
0.003993 |
0.000074 |
|
|
|
|
Ag |
Df |
Sum Sq |
Mean Sq |
F Value |
Pr (> F) |
MS (median polish) |
|
Position |
2 |
0.00095 |
0.00047 |
1.6065 |
0.21 |
0.0000 |
|
Lot |
27 |
1.95592 |
0.07244 |
245.6707 |
<2e-16 |
0.0735 |
|
Residuals |
54 |
0.01592 |
0.00029 |
|
|
|
this statistic is listed under “Pr(> F)”. For comparison, the equivalent mean square under the median polish analysis is also given; notice that, for the most part, the values are consistent with the mean squares given by the conventional analysis of variance, except for Sn, for which the mean square for position is almost 6 times smaller under the median polish (1.351 versus 0.2345).
Only for Sn did the ratio of the mean square for position (B, M, E) to the residual mean square exceed 3.168 (1.351/0.178); for all other elements, this ratio was well below this critical point. (The significance for Sn may have come from the nonrobustness of the sample means caused by two unusually low values: Lot #424, E = 21 (B = 414, M = 414); and Lot #454, E = 45 (B = 377, M = 367). When using median polish as the analysis rather than conventional analysis of variance, the ratio is (0.2345/0.178) = 1.317 (not significant).) For all elements, the effect of lot is highly significant; differences among lots characterize nearly all the variability in these data for all elements.
Table G.2 provides the estimates of the position and lot effects in this format:
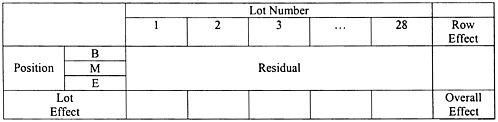
The analysis suggests that the variation observed in the measurements at different positions is not significantly larger than that observed from the analytical measurement error. All analyses were conducted with the statistics package R (Ref. 4).
TABLE G.2 Median Polish on Logarithms (Results Multiplied by 1,000 to Avoid Decimal Points)
|
Sb |
423 |
424 |
425 |
426 |
427 |
429 |
444 |
445 |
446 |
447 |
448 |
|
1 |
−7 |
0 |
−4 |
−10 |
6 |
0 |
19 |
7 |
1 |
−15 |
0 |
|
2 |
0 |
0 |
0 |
0 |
−3 |
−1 |
0 |
−3 |
0 |
1 |
3 |
|
3 |
9 |
−104 |
2 |
24 |
0 |
6 |
−5 |
0 |
−8 |
0 |
−5 |
|
Column Effect |
−40 |
6 |
12 |
27 |
−56 |
57 |
34 |
−53 |
1 |
13 |
38 |
|
|
450 |
451 |
452 |
453 |
454 |
455 |
456 |
457 |
458 |
459 |
460 |
|
1 |
−10 |
−1 |
−3 |
0 |
0 |
0 |
0 |
−2 |
0 |
−5 |
−4 |
|
2 |
0 |
0 |
0 |
1 |
8 |
−4 |
−9 |
2 |
3 |
0 |
0 |
|
3 |
3 |
11 |
8 |
−48 |
−33 |
12 |
5 |
0 |
−3 |
2 |
44 |
|
Column Effect |
−16 |
−35 |
−9 |
−1 |
57 |
−53 |
−34 |
47 |
−49 |
52 |
−12 |
|
|
461 |
463 |
464 |
465 |
466 |
467 |
Row Effect |
|
|
|
|
|
1 |
66 |
0 |
0 |
1 |
0 |
4 |
0 |
|
|
|
|
|
2 |
−5 |
−5 |
−4 |
0 |
−8 |
0 |
0 |
|
|
|
|
|
3 |
0 |
5 |
0 |
−21 |
10 |
−2 |
−6 |
|
|
|
|
|
Column Effect |
−32 |
53 |
−34 |
−37 |
23 |
1 |
6559 |
|
|
|
|
|
Sn |
423 |
424 |
425 |
426 |
427 |
429 |
444 |
445 |
446 |
447 |
448 |
|
1 |
0 |
0 |
0 |
−41 |
144 |
−45 |
271 |
0 |
0 |
0 |
−179 |
|
2 |
127 |
69 |
−27 |
0 |
−192 |
0 |
0 |
4 |
61 |
−55 |
0 |
|
3 |
−120 |
−2800 |
11 |
148 |
0 |
60 |
−53 |
−42 |
−15 |
168 |
9 |
|
Column Effect |
−1050 |
371 |
−625 |
672 |
−2909 |
1442 |
−659 |
−408 |
−884 |
−618 |
108 |
|
|
450 |
451 |
452 |
453 |
454 |
455 |
456 |
457 |
458 |
459 |
460 |
|
1 |
0 |
605 |
−22 |
1428 |
0 |
−45 |
−6 |
240 |
41 |
−77 |
−5 |
|
2 |
−9 |
0 |
0 |
−112 |
42 |
0 |
28 |
−30 |
0 |
0 |
0 |
|
3 |
201 |
−313 |
83 |
0 |
−1944 |
99 |
0 |
0 |
−176 |
88 |
139 |
|
Column Effect |
−122 |
−2328 |
−942 |
−5474 |
277 |
338 |
203 |
−1067 |
−349 |
849 |
787 |
|
|
461 |
463 |
464 |
465 |
466 |
467 |
Row Effect |
|
|
|
|
|
1 |
−22 |
−65 |
0 |
436 |
0 |
−54 |
69 |
|
|
|
|
|
2 |
0 |
0 |
53 |
−71 |
−4 |
0 |
0 |
|
|
|
|
|
3 |
118 |
112 |
−443 |
0 |
95 |
68 |
−112 |
|
|
|
|
|
Column Effect |
908 |
933 |
938 |
−117 |
846 |
560 |
5586 |
|
|
|
|
|
Two unusual residuals: Lot #424, “E” = 21 (B = 414, M = 414) Lot #454, “E” = 45 (B = 377, M = 367) |
|||||||||||
|
Cu |
423 |
424 |
425 |
426 |
427 |
429 |
444 |
445 |
446 |
447 |
448 |
|
1 |
−166 |
−19 |
−18 |
93 |
−2 |
−13 |
0 |
−8 |
0 |
0 |
106 |
|
2 |
0 |
0 |
0 |
0 |
0 |
0 |
2 |
0 |
35 |
34 |
−23 |
|
3 |
12 |
51 |
0 |
−121 |
0 |
0 |
−38 |
0 |
−43 |
−21 |
0 |
|
Column Effect |
607 |
258 |
−94 |
418 |
80 |
−424 |
436 |
269 |
441 |
307 |
−1106 |
|
|
450 |
451 |
452 |
453 |
454 |
455 |
456 |
457 |
458 |
459 |
460 |
|
1 |
−16 |
−27 |
−37 |
44 |
0 |
27 |
76 |
13 |
0 |
−53 |
−2 |
|
2 |
0 |
0 |
0 |
0 |
52 |
−5 |
0 |
0 |
2 |
0 |
0 |
|
3 |
0 |
24 |
0 |
0 |
−470 |
0 |
0 |
0 |
−5 |
49 |
288 |
|
Column Effect |
30 |
−495 |
−1523 |
−30 |
630 |
448 |
330 |
30 |
50 |
−1894 |
−2405 |
|
|
461 |
463 |
464 |
465 |
466 |
467 |
Row Effect |
|
|
|
|
|
1 |
−2 |
691 |
0 |
−242 |
13 |
−24 |
2 |
|
|
|
|
|
2 |
0 |
0 |
−28 |
10 |
−31 |
0 |
0 |
|
|
|
|
|
3 |
19 |
0 |
857 |
0 |
0 |
11 |
0 |
|
|
|
|
|
Column Effect |
−958 |
−4890 |
−1365 |
−255 |
−700 |
−357 |
|
|
|
|
|
|
As |
423 |
424 |
425 |
426 |
427 |
429 |
444 |
445 |
446 |
447 |
448 |
|
1 |
| −166 |
−19 |
−18 |
93 |
−2 |
−13 |
0 |
−8 |
0 |
0 |
106 |
|
2 |
0 |
0 |
0 |
0 |
0 |
0 |
2 |
0 |
35 |
34 |
−23 |
|
3 |
12 |
51 |
0 |
−121 |
0 |
0 |
−38 |
0 |
−43 |
−21 |
0 |
|
Column Effect |
607 |
258 |
−94 |
418 |
80 |
−424 |
436 |
269 |
441 |
307 |
−1106 |
|
|
450 |
451 |
452 |
453 |
454 |
455 |
456 |
457 |
458 |
459 |
460 |
|
1 |
−16 |
−27 |
−37 |
44 |
0 |
27 |
76 |
13 |
0 |
−53 |
−2 |
|
2 |
0 |
0 |
0 |
0 |
52 |
−5 |
0 |
0 |
2 |
0 |
0 |
|
3 |
0 |
24 |
0 |
0 |
−470 |
0 |
0 |
0 |
−5 |
49 |
288 |
|
Column Effect |
30 |
−495 |
−1523 |
−30 |
630 |
448 |
330 |
30 |
50 |
−1894 |
−2405 |
|
|
461 |
463 |
464 |
465 |
466 |
467 |
Row Effect |
|
|
|
|
|
1 |
−2 |
691 |
0 |
−242 |
13 |
−24 |
2 |
|
|
|
|
|
2 |
0 |
0 |
−28 |
10 |
−31 |
0 |
0 |
|
|
|
|
|
3 |
19 |
0 |
857 |
0 |
0 |
11 |
0 |
|
|
|
|
|
Column Effect |
−958 |
−4890 |
−1365 |
−255 |
−700 |
−357 |
4890 |
|
|
|
|
|
Bi |
423 |
424 |
425 |
426 |
427 |
429 |
444 |
445 |
446 |
447 |
448 |
|
1 |
0 |
−11 |
0 |
0 |
10 |
−10 |
0 |
10 |
0 |
0 |
0 |
|
2 |
−10 |
0 |
0 |
0 |
0 |
0 |
0 |
0 |
0 |
9 |
0 |
|
3 |
0 |
0 |
0 |
10 |
0 |
0 |
0 |
0 |
0 |
0 |
0 |
|
Column Effect |
−5 |
−78 |
−46 |
−25 |
−25 |
−35 |
15 |
15 |
63 |
90 |
15 |
|
|
450 |
451 |
452 |
453 |
454 |
455 |
456 |
457 |
458 |
459 |
460 |
|
1 |
0 |
−9 |
0 |
52 |
0 |
0 |
0 |
0 |
0 |
0 |
0 |
|
2 |
−9 |
0 |
10 |
0 |
0 |
−11 |
0 |
0 |
0 |
0 |
0 |
|
3 |
0 |
9 |
0 |
−11 |
−21 |
0 |
11 |
0 |
0 |
10 |
10 |
|
Column Effect |
53 |
90 |
−25 |
−67 |
−35 |
−67 |
−67 |
34 |
25 |
34 |
15 |
REFERENCES
1. Randich, E.; Duerfeldt, W.; McLendon, W.; and Tobin, W. Foren. Sci. Int. 2002,127, 174−191.
2. Tukey, J. W. Exploratory Data Analysis; Addison-Wesley: Reading, MA, 1977.
3. Mosteller, F. and Tukey, J. W. Data Analysis and Regression: A Second Course in Statistics; Addison-Wesley: Reading, MA, 1977, pp 192–199.
4. R. Copyright 2002, The R Development Core Team, Version 1.5.1 (2002-06-17), for the Linux operating system see <http://www.r-project.org>.


