
5
Potassium
SUMMARY
Potassium, the major intracellular cation in the body, is required for normal cellular function. Severe potassium deficiency is characterized by hypokalemia—a serum potassium concentration of less than 3.5 mmol/L. The adverse consequences of hypokalemia include cardiac arrhythmias, muscle weakness, and glucose intolerance. Moderate potassium deficiency, which typically occurs without hypokalemia, is characterized by increased blood pressure, increased salt sensitivity,1 an increased risk of kidney stones, and increased bone turnover (as indicated by greater urinary calcium excretion and biochemical evidence of reduced bone formation and increased bone resorption). An inadequate intake of dietary potassium may also increase the risk of cardiovascular disease, particularly stroke.
The adverse effects of inadequate potassium intake can result from a deficiency of potassium per se, a deficiency of its conjugate anion, or both. In unprocessed foods, the conjugate anions of potassium are mainly organic anions, such as citrate, that are converted in the body to bicarbonate. Hence an inadequate intake of potassium is also associated with reduced intake of bicarbonate precursors. Acting as a buffer, bicarbonate neutralizes diet-derived noncarbonic
|
1 |
In general terms, salt sensitivity is expressed as either the reduction in blood pressure in response to a lower salt intake or the rise in blood pressure in response to sodium loading. |
acids, such as sulfuric acid generated from sulfur-containing amino acids commonly found in meats and other high protein foods. In the setting of an inadequate intake of bicarbonate precursors, buffers in the bone matrix neutralize the excess diet-derived acid, and in the process, bone becomes demineralized. Excess diet-derived acid titrates bone and leads to increased urinary calcium and reduced urinary citrate excretion. The resultant adverse clinical consequences are possibly increased bone demineralization and increased risk of calcium-containing kidney stones. In processed foods to which potassium has been added and in supplements, the conjugate anion is typically chloride, which does not act as a buffer. Because the demonstrated effects of potassium often depend on the accompanying anion and because it is difficult to separate the effects of potassium from the effects of its accompanying anion, this report primarily focuses on research pertaining to nonchloride forms of potassium—the forms found naturally in fruits, vegetables, and other potassium-rich foods.
On the basis of available data, an Adequate Intake (AI) for potassium is set at 4.7 g (120 mmol)/day for all adults. This level of dietary intake (i.e., from foods) should maintain lower blood pressure levels, reduce the adverse effects of sodium chloride intake on blood pressure, reduce the risk of recurrent kidney stones, and possibly decrease bone loss. Because of insufficient data from dose-response trials demonstrating these effects, an Estimated Average Requirement (EAR) could not be established, and thus a Recommended Dietary Allowance (RDA) could not be derived.
At present, dietary intake of potassium by all groups in the United States and Canada is considerably lower than the AI. In recent surveys, the median intake of potassium by adults in the United States was approximately 2.8 to 3.3 g (72 to 84 mmol)/day2 for men and 2.2 to 2.4 g (56 to 61 mmol)/day for women; in Canada, the median intakes ranged from 3.2 to 3.4 g (82 to 87 mmol)/day for men and 2.4 to 2.6 g (62 to 67 mmol)/day for women (Appendix Tables D-5 and F-3). Because African Americans have a relatively low intake of potassium and a high prevalence of elevated blood pressure and salt sensitivity, this subgroup of the population would especially benefit from an increased intake of potassium.
In the generally healthy population with normal kidney function, a potassium intake from foods above the AI poses no potential for
|
2 |
To convert millimoles (mmol) of potassium to milligrams (mg) of potassium, multiply mmol by 39.1 (the molecular weight of potassium). |
increased risk because excess potassium is readily excreted in the urine. Therefore, a Tolerable Upper Intake Level (UL) was not set. However, in individuals in whom urinary excretion of potassium is impaired, a potassium intake below 4.7 g (120 mmol)/day is appropriate because of adverse cardiac effects (arrhythmias) from the resulting hyperkalemia (a markedly elevated serum potassium concentration). Such individuals are typically under medical supervision.
Common drugs that can substantially impair potassium excretion are angiotensin converting enzyme (ACE) inhibitors, angiotensin receptor blockers (ARB), and potassium-sparing diuretics. Medical conditions associated with impaired urinary potassium excretion include diabetes, chronic renal insufficiency, end-stage renal disease, severe heart failure, and adrenal insufficiency. Elderly individuals are at increased risk of hyperkalemia because they often have one or more of these conditions or are treated with one of these medications.
BACKGROUND INFORMATION
Function
The major intracellular cation in the body is potassium, which is maintained at a concentration of about 145 mmol/L of intracellular fluid, but at much lower concentrations in the plasma and interstitial fluid (3.8 to 5 mmol/L of extracellular fluid). Relatively small changes in the concentration of extracellular potassium greatly affect the extracellular:intracellular potassium ratio and thereby affect neural transmission, muscle contraction, and vascular tone.
Physiology of Absorption and Metabolism
In unprocessed foods, potassium occurs mainly in association with bicarbonate-generating precursors like citrate, and to a lesser extent with phosphate. In foods to which potassium is added in processing and in supplements, the form of potassium is potassium chloride. In healthy persons, approximately 85 percent of dietary potassium is absorbed (Holbrook et al., 1984). The high intracellular concentration of potassium is maintained via the activity of the Na+/K+-ATPase pump. Because this enzyme is stimulated by insulin, alterations in the plasma concentration of insulin can affect cellular influx of potassium and thus plasma concentration of potassium.
The preponderance of dietary potassium (approximately 77 to 90 percent) is excreted in urine, while the remainder is excreted mainly in feces, with much smaller amounts being lost in sweat (Agarwal et al., 1994; Holbrook et al., 1984; Pietinen, 1982). The correlation between dietary potassium intake and urinary potassium content is high (r = 0.82) (Holbrook et al., 1984). The great majority of potassium that is filtered by the glomerulus of the kidney is reabsorbed (70 to 80 percent) in the proximal tubule such that only a small amount of filtered potassium reaches the distal tubule. The majority of potassium in urine results from secretion of potassium into the cortical collecting duct, a secretion regulated by a number of factors, including the hormone aldosterone. An elevated plasma concentration of potassium stimulates the adrenal cortex to release aldosterone, which in turn increases secretion of potassium in the cortical collecting duct and hence into urine.
Potassium and Acid-Base Considerations
A diet rich in potassium from fruits and vegetables favorably affects acid-base metabolism because these foods are rich in precursors of bicarbonate, which neutralizes diet-induced acid in vivo (Sebastian et al., 1994, 2002). The net quantitative outcome of this acid-base interaction is termed “the net endogenous acid production” (NEAP). Because most endogenous noncarbonic acid is derived from protein, and because most endogenous bicarbonate (base) is derived from organic anions present in potassium-rich fruits and vegetables, the dietary protein-to-potassium ratio closely estimates NEAP and thus predicts urinary net acid excretion, which in turn predicts calcium excretion. For many years it has been hypothesized that the modern Western diet could induce a low-grade metabolic acidosis that in turn could induce bone demineralization, osteoporosis, and kidney stones (Barzel, 1995; Barzel and Jowsey, 1969; Lemann et al., 1966; Wachman and Bernstein, 1968). The results of several recent epidemiological (New et al., 1997, 2000; Tucker et al., 1999) and metabolic (Maurer et al., 2003; Morris RC et al., 2001; Sebastian et al., 1994) studies support this hypothesis.
Noncarbonic acids are generated from metabolism of both plant and animal proteins (e.g., in both, sulfuric acid is generated from the metabolism of sulfur-containing amino acids found in meats, fish, dairy products, grains, and to a lesser extent, in fruits and vegetables). Unlike fruits and vegetables, meats and other animal foods contain few precursors of bicarbonate. The only plant food group that consistently yields noncarbonic acid precursors in excess
of bicarbonate precursors is cereal grains (e.g., wheat, rice, and barley). Thus the typical Western diet is usually a net producer of noncarbonic acids not only because of its large content of acid-generating animal proteins, but also because of large amounts of cereal grain products and relatively lower amounts of bicarbonate-generating plant foods (Kurtz et al., 1983; Lemann et al., 1966; Lennon et al., 1966; Sebastian et al., 2002). Although the premodern diet contained considerable amounts of meat (Sebastian et al., 2002), it was a net producer of bicarbonate because it also contained large amounts of fruits and vegetables that generated substantial amounts of bicarbonate via metabolism (Eaton et al., 1999; Sebastian et al., 2002). Accordingly, humans evolved to excrete large loads of bicarbonate and potassium, not the large net acid loads chronically generated by the current Western dietary patterns.
The renal acidification process in humans does not completely excrete the modern acid load (Frassetto et al., 1996; Kurtz et al., 1983; Lennon et al., 1966; Sebastian et al., 1994). The unexcreted acid does not titrate plasma bicarbonate to ever lower concentrations, but rather to sustained concentrations only slightly lower than those that otherwise occur. This is because the unexcreted hydrogen ion not only exchanges with bone sodium and potassium, but also titrates and is neutralized by basic salts of bone (Bushinsky, 1998; Lemann et al., 1966, 2003). Although preventing the occurrence of frank metabolic acidosis, the acid titration of calciumcontaining carbonates and hydroxyapatite mobilizes bone calcium and over time dissolves bone matrix (Barzel, 1995; Bushinsky, 1998; Bushinsky and Frick, 2000; Lemann et al., 1966, 2003). The buffering by bone of diet-derived acid may be regarded as a biological tradeoff (Alpern, 1995; Morris RC et al., 2001). At the cost of bone demineralization, arterial pH and plasma bicarbonate concentration are only modestly reduced by an acidogenic diet, such as the Western-type diet (Morris RC et al., 2001), and not to values below their “normal” range. These normal reduced values, however, reflect a state of low-grade metabolic acidosis.
INDICATORS CONSIDERED FOR ESTIMATING THE REQUIREMENT FOR POTASSIUM
This section reviews potential physiological indices and pathologic endpoints for adverse effects of insufficient dietary intake of potassium in apparently healthy individuals. Because the demonstrated effects of potassium often depend on the accompanying anion and
because it is difficult to separate the effects of potassium from the effects of its accompanying anion, this report focuses primarily on research pertaining to nonchloride forms of potassium—the forms found naturally in foods.
Potassium Balance
As previously mentioned, urinary potassium excretion reflects dietary potassium intake. The effects on potassium balance of two levels of potassium intake (3.1 g [80 mmol]/day and 11.7 g [300 mmol]/day) were examined in six healthy men about 24 years of age (Hene et al., 1986). After 18 days on the high potassium diet, urinary potassium excretion increased from 2.0 to 9.1 g (50 to 233 mmol)/day. In a separate study, daily fecal potassium loss ranged from 0.11 to 0.85 g (2.8 to 22 mmol)/day on dietary intakes approximating 2.6 to 2.9 g (66 to 74 mmol)/day (Holbrook et al., 1984). Losses of potassium in sweat vary; under conditions in which sweat volume is minimal, the reported values range from 2.3 to 16 mmol (90 to 626 mg)/L (Consolazio et al., 1963).
A number of dietary factors, including dietary fiber and sodium, can affect potassium balance. The effects of increased wheat fiber intake on fecal potassium loss were examined in six healthy men, 21 to 25 years of age, who consumed 45 g/day of wheat fiber for 3 weeks; their previous average intake was 17 g/day. Potassium intake was held constant at 3.1 g (80 mmol)/day (Cummings et al., 1976). Fecal weight increased significantly from about 79 g/day to about 228 g/day with the increased fiber intake. Fecal potassium loss also significantly increased from a prestudy level of 0.3 g to a final value of 1.1 g (8.6 to 28.5 mmol)/day (Cummings et al., 1976).
The level of sodium intake does not appear to influence potassium excretion (Bruun et al., 1990; Castenmiller et al., 1985; Overlack et al., 1993; Sharma et al., 1990; Sullivan et al., 1980) except at levels of sodium intake above 6.9 g (300 mmol)/day, at which point net loss of potassium has been demonstrated (Kirkendall et al., 1976; Luft et al., 1982). At dietary sodium intakes greater than 6.9 g (300 mmol)/day, there was a net loss of potassium—urinary potassium excretion exceeded dietary intake, at least during the 3-day periods in this trial (Luft et al., 1982). Over the long term, net potassium losses do not occur at lower levels of sodium intake. At three levels of dietary sodium, 1.5, 2.4, and 3.2 g (65, 104, and 140 mmol)/day, each provided for 28 days, urinary potassium excretion did not exceed intake and urinary potassium excretion was similar at each sodium level (Sacks et al., 2001).
In nonhypertensive individuals who maintained potassium balance while consuming at least 1.6 g (40 mmol)/day of potassium, serum potassium concentrations were at the lower end of the clinically accepted normal range (Sebastian et al., 1971). As discussed subsequently, while potassium balance can be maintained at this lower level of dietary intake, if such levels are consumed chronically, clinically important adverse effects may result (Morris RC et al., 2001).
Serum Potassium Concentration
Serum potassium concentration, as well as body potassium content, is determined jointly by the amount of potassium consumed and the amount excreted since the gastrointestinal tract normally absorbs 85 percent of dietary intake and because the kidney excretes most of the potassium absorbed (Young, 1985, 2001; Young and McCabe, 2000).
Humans evolved from ancestors who habitually consumed large amounts of uncultivated plant foods that provided substantial amounts of potassium. In this setting, the human kidney developed a highly efficient capacity to excrete excess potassium. The normal human kidney efficiently excretes potassium when dietary intake is high enough to increase serum concentration even slightly, but inefficiently conserves potassium when dietary intake and thus serum concentration is reduced (Young, 2001). While normal renal function protects against the occurrence of hyperkalemia when dietary potassium is increased, it does not prevent the occurrence of potassium deficiency when dietary intake of potassium is reduced (Squires and Huth, 1959), even marginally, relative to the usual potassium intake in the Western diet. Based on recent diet surveys, the estimated median potassium intakes for adult age groups in the United States (Appendix Table D-5) ranged from 2.8 to 3.3 g (72 to 84 mmol)/day for men and 2.2 to 2.4 g (56 to 61 mmol)/day for women, while median intakes in Canada from surveys conducted between 1990 and 1999 ranged from 3.2 to 3.4 g (82 to 87 mmol)/day for men and 2.4 to 2.6 g (62 to 67 mmol)/day for women (Appendix Table F-2).
Signs and symptoms of potassium deficiency can occur without frank hypokalemia (i.e., they occur while the serum potassium concentration remains at or somewhat above 3.5 mmol/L, an accepted minimum of the range for normal serum potassium levels) (Table 5-1). In generally healthy people, frank hypokalemia is not a necessary or usual expression of a subtle dietary potassium deficiency. As
TABLE 5-1 Dietary Potassium and Serum Potassium Concentrations
|
Reference |
Subjects |
Dietary Potassium (K),a g/d (mmol/d) |
Serum Potassium (mmol/L) ± standard deviation |
|
Dluhy et al., 1972 |
8 women, 2 men, crossover 5 subjects, 6–7 d, 0.23 g (10 mmol) sodium (Na)/d 5 subjects, 3 d, 4.6 g (200 mmol) Na/d |
1.6 (40) 7.8 (200) 1.6 (40) 7.8 (200) |
4.1 ± 0.1b 4.3 ± 0.1b 4.0 ± 0.1b 4.2 ± 0.1b |
|
Zoccali et al., 1985 |
5-d crossover, 10 men |
3.0 (76) 6.9 (176) |
3.9 ± 0.1b 4.3 ± 0.1b |
|
Hene et al., 1986 |
18-d parallel, 6 men |
3.1 (80) 11.7 (300) |
4.26 ± 0.28b 4.39 ± 0.32b |
|
Witzgall and Behr, 1986 |
6 d on high K diet, 16 men |
2.3 g (60) 10.1 g (260) |
4.2 ± 0.3b 4.6 ± 0.3c |
|
Grimm et al., 1990 |
2.2 yr supplement/placebo intervention, 287 men, 45–68 yr, baseline urinary K = 2.2 g/d |
+ 3.8 (96) + 0 |
4.2b 4.5c The difference averaged 0.26 mmol/L over the 2-yr period |
|
Rabelink et al., 1990 |
20 d, 6 men |
3.9 (100) 15.6 (400) |
3.75 ± 0.16b 4.22 ± 0.12b |
|
Clinkingbeard et al., 1991 |
3-d crossover, 8 men |
0.39 (10) 7.8 (200) |
3.8 ± 0.1b 4.3 ± 0.2c |
|
Deriaz et al., 1991 |
5-d crossover, 8 men |
2.7 (69) 6.4 (163) |
4.1 ± 0.2b 3.8 ± 0.1c |
|
Valdes et al., 1991 |
4-wk crossover, 24 men and women, provided placebo or supplement |
+ 0 + 2.5 (64) |
3.8 ± 0.1b 4.1 ± 0.1c |
|
Smith et al., 1992 |
4-d crossover, 22 men and women |
2.7 (70) 4.7 (120) |
3.9 ± 0.1b 4.3 ± 0.1c |
|
Sebastian et al., 1994 |
18 d, 18 postmenopausal women |
2.3 (60) + 4.7 (120) |
3.9 ± 0.15b 4.0 ± 0.2b |
|
Morris et al., 1999b |
38 men, parallel |
+ 1.17 (30) 4.7 (120) |
3.7 ± 0.2b 4.0 ± 0.2c |
|
Coruzzi et al., 2001 |
10-d isocaloric crossover, 8 men, 3 women |
0.70 (18) 3.1 (80) |
3.2 ± 0.1 (standard error)b 4.1 ± 0.05c |
|
a “+” means amount of potassium provided as a supplement. b,c Values with different superscripts differed significantly at p < 0.05 or less. |
|||
will be discussed in subsequent sections, a typical dietary intake of potassium that gives rise to a serum potassium concentration somewhat greater than 3.5 mmol/L would still be considered inadequate if a higher intake of potassium prevents, reduces, or delays expression of certain chronic diseases or conditions, such as elevated blood pressure, salt sensitivity, kidney stones, bone loss, or stroke (Morris et al., 1999a, 1999b; Morris RC et al., 2001; Schmidlin et al., 1999; Sudhir et al., 1997).
The Western diet gives rise not only to low-grade potassium deficiency, but also to low-grade bicarbonate deficiency that is expressed as low-grade metabolic acidosis (Morris et al., 1999a, 1999b; Morris RC et al., 2001; Sebastian et al., 2002). Because plasma concentrations of potassium and other electrolytes (bicarbonate, sodium, and chloride) are highly regulated, their plasma concentrations remain normal or little changed despite substantial increases in dietary potassium intake (Lemann et al., 1989, 1991; Morris RC et al., 2001; Schmidlin et al., 1999). Thus serum potassium is not a sensitive indicator of potassium adequacy related to mitigating chronic disease.
Hypokalemia
Disordered potassium metabolism that is expressed as hypokalemia (that is, a serum potassium level below 3.5 mmol/L) can result in cardiac arrhythmias, muscle weakness, hypercalciuria, and glucose intolerance. Such disorders, which are correctable by potassium administration, can be induced by diuretics, chloride-depletion associated forms of metabolic alkalosis, and increased aldosterone production (Knochel, 1984).
Hypokalemia reduces the capacity of the pancreas to secrete insulin and therefore is a recognized reversible cause of glucose intolerance (Helderman et al., 1983). There is some limited evidence that hypokalemia can also confer insulin resistance (Helderman et al., 1983; Pollare et al., 1989). A low potassium diet (0.58 g [15 mmol]/day), which did not induce frank hypokalemia, resulted in a decrease in plasma insulin concentration and a resistance to insulin action, which were reversed when dietary potassium was supplemented with 4.8 g (64 mmol)/day of potassium chloride (Norbiato et al., 1984). Decreased erythrocyte and plasma potassium concentrations have been associated with glucose intolerance (Modan et al., 1987). Diuretic-induced hypokalemia leads to insulin resistance (hyperglycemia and hyperinsulinemia) and glucose intolerance (Helderman et al., 1983; Plavinik et al., 1992). In one trial, individu-
als with diuretic-induced hypokalemia did not achieve reduction in cardiovascular events compared with diuretic-treated individuals without hypokalemia (Franse et al., 2000).
Because moderate potassium deficiency and its adverse side effects occur without hypokalemia, hypokalemia is not a sensitive indicator appropriate for use to establish adequacy.
Salt-Sensitive Blood Pressure
The extent to which blood pressure responds to changes in sodium chloride intake varies among individuals. “Salt-sensitive” blood pressure is that which varies directly with the intake of sodium chloride (Morris et al., 1999b; Weinberger, 1996). Salt sensitivity, even in those who are nonhypertensive, has been found to confer its own cardiovascular risks, including incident hypertension and cardiovascular death (Morimoto et al., 1997; Weinberger et al., 2001). Salt sensitivity occurs with greater frequency and severity in nonhypertensive African Americans than in nonhypertensive whites (Morris et al., 1999b; Price et al., 2002; Weinberger, 1996).
The expression of salt sensitivity is strongly modulated by dietary potassium intake (Morris et al., 1999b; Schmidlin et al., 1999; Luft et al., 1979). In a metabolic study of 38 healthy, nonhypertensive men (24 African Americans and 14 whites) fed a basal diet with low levels of potassium (1.2 g [30 mmol]/day) and sodium (0.7 g [30 mmol]/day), the modulating effect of potassium supplementation on the pressor effect of dietary sodium chloride loading (14.6 g [250 mmol]/day) was investigated (Morris et al., 1999b) (Figure 5-1). Before potassium was supplemented, 79 percent of the African-American men and 26 percent of the white men were termed salt sensitive, as defined by a sodium chloride-induced increase in mean arterial pressure of at least 3 mm Hg. Salt sensitivity was defined as “severe” if sodium chloride induced an increase in mean arterial pressure of 10 mm Hg or more, an increase observed only in African-American men. When dietary potassium was increased with potassium bicarbonate from 1.2 g (30 mmol)/day to 2.7 g (70 mmol)/day, over half of the African-American men, but only one-fifth of the white men, remained salt sensitive. In the African Americans with severe salt sensitivity, increasing dietary potassium to a high-normal intake of 4.7 g (120 mmol)/day reduced the frequency of salt sensitivity to 20 percent, the same percentage as that observed in white subjects when their potassium intake was increased to only 2.7 g (70 mmol)/day. In another metabolic study of 16 mostly nonhypertensive African-American subjects loaded with 14.6 g (250 mmol) of
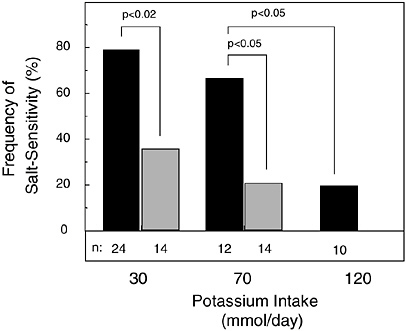
FIGURE 5-1 Effect of potassium intake on frequency of salt sensitivity in nonhypertensive African-American men (solid bar) and white men (gray bar). No white men were tested with 4.7 g (120 mmol)/day of potassium. Throughout an initial 7-day period of salt loading in all study subjects, potassium intake as potassium bicarbonate was set at 1.2 g (30 mmol)/day, then increased to a total of either 2.7 or 4.7 g (70 or 120 mmol)/day for a subsequent 7-day period of salt loading. Reprinted with permission from Morris et al. (1999b). Copyright 1999 by W.B. Saunders Co.
sodium chloride per day, increasing dietary potassium as potassium bicarbonate to an intake of 6.6 g (170 mmol)/day abolished the salt sensitivity of all subjects (Schmidlin et al., 1999).
In aggregate, these trials document that supplemental potassium bicarbonate mitigates the pressor effect of dietary sodium chloride in a dose-dependent fashion. Furthermore, these trials highlight the potential benefit of increased potassium intake in African Americans, who have a higher prevalence of hypertension and of salt sensitivity and a lower intake of potassium than non-African Americans. Survey data from the Third National Health and Nutrition Examination Survey (NHANES III) in the United States (Appendix Tables D-6 and D-7) estimated that the median intake of potassium of non-Hispanic African-American men (aged 19 to 30 years) was 3.0 g (78 mmol)/day, while that for non-Hispanic white men (aged 19 to 30 years) was 3.4 g (87 mmol)/day, approximately 10 percent lower than their white counterparts. Similar differences
are noted for women, with non-Hispanic white women aged 19 to 30 years having higher intakes than non-Hispanic African-American women of the same age group.
Predictably, over the range of dietary potassium evaluated in the study of salt sensitivity (Figure 5-1), the serum concentration of potassium remained well within the normal range, increasing only minimally (from ≈ 3.8 to 4.0 mmol/L) when potassium bicarbonate was supplemented (Morris et al., 1999b). It has been postulated that such dose-dependent suppression of salt sensitivity might prevent or delay the occurrence of hypertension (Berenson et al., 1979; Frisancho et al., 1984; Grim et al., 1980; Morris et al., 1999b). In hypertensive individuals, potassium supplementation can mitigate the pressor effect of sodium chloride (Iimura et al., 1981; Morgan et al., 1984).
The antipressor effect of dietary potassium may in part result from its natriuretic effects (Morris et al., 1999b; Schmidlin et al., 1999). As mentioned earlier, potassium acts directly on the renal tubule to increase the urinary excretion of sodium chloride (Brandis et al., 1972; Stokes et al., 1982), an action apparently unaffected by the anion accompanying ingested potassium (van Buren et al., 1992).
Blood Pressure
Epidemiological Evidence
Numerous observational studies (Table 5-2) have examined the relationship between blood pressure and dietary potassium intakes, or urinary potassium excretion, used as a proxy of intake (Ascherio et al., 1992; Dai et al., 1984; Dyer et al., 1994; Geleijnse et al., 1996; Hajjar et al., 2001; Khaw and Barrett-Connor, 1984; Langford, 1983; Liu et al., 1988, 1996; Rose et al., 1988; Takemori et al., 1989; Tunstall-Pedoe, 1999; Walker et al., 1979). Many, but not all, studies documented an inverse association—that is, a higher intake of potassium that was associated with lower blood pressure. In the Intersalt study, a 50-mmol (2.0-g) higher excretion of urinary potassium was associated with a 2.5- and 1.5-mm Hg lower level of systolic and diastolic blood pressure, respectively (Rose et al., 1988).
While blood pressure is inversely associated with potassium intake and directly associated with sodium intake and the sodium:potassium ratio, blood pressure is typically more closely associated with the sodium:potassium ratio than intake of either electrolyte alone. This pattern was evident in Intersalt and in other observational studies (Khaw and Barrett-Connor, 1988; Morris and Sebastian, 1995;
TABLE 5-2 Epidemiological Studies on Potassium Intake and Blood Pressure
|
Reference |
Study Design |
|
Walker et al., 1979 |
Cross-sectional, 574 men and women |
|
Khaw and Barrett-Connor, 1984 |
Cross-sectional, 685 men and women |
|
Kok et al., 1986 |
Cross-sectional, 2,291 men and women in the Netherlands, multivariate analysis |
|
Kesteloot and Joossens, 1988 |
Belgian Interuniversity Research on Nutrition and Health Study, cross-sectional, 8,058 men and women |
|
Khaw and Barrett-Connor, 1988 |
Cross-sectional, 1,302 men and women |
|
Liu et al., 1988 |
Cross-sectional, 3,248 men and women in China |
|
Rose et. al., 1988 |
Intersalt study, cross-sectional, 10,648 men and women |
|
Takemori et al., 1989 |
Cross-sectional, 7,441 women in Japan |
|
Witteman et al., 1989 |
Nurses Health Study, prospective, 4-yr follow up, 58,218 women, multivariate analysis |
|
Khaw and Barrett-Connor, 1990 |
Cross-sectional, 2,046 men and women |
|
Ascherio et al., 1992 |
Health Professionals Follow-Up Study, prospective 4-yr follow-up, 30,681 men, multivariate analysis |
|
Resultsa |
|
|
Urinary K was inversely correlated with DBP |
|
|
Dietary K intake inversely correlated with age-adjusted SBP in men and women and age-adjusted DBP in men |
|
|
No significant association between blood pressure and potassium intake |
|
|
No independent effects of dietary K intake on BP |
|
|
Blood pressure varied directly with dietary Na:K ratio, age-adjusted SBP and DBP significantly and inversely correlated with potassium intake |
|
|
Urinary potassium was inversely correlated with DBP and SBP only in the 20- to 29-yr-old age group |
|
|
Urinary K was inversely correlated with blood pressure |
|
|
Urinary potassium inversely correlated with blood pressure |
|
|
Potassium intake |
|
|
g/d (mmol/d) |
RR of hypertension |
|
Q1 < 2.0 (51) |
1.0 |
|
Q2 2.0–2.39 (51–61) |
0.93 |
|
Q3 2.4–2.79 (61–71) |
1.02 |
|
Q4 2.8–3.19 (72–82) |
1.05 |
|
Q5 > 3.2 (82) |
1.05 |
|
|
p = 0.26 |
|
No independent association with potassium intake and risk of hypertension |
|
|
Age-adjusted SBP and DBP correlated significantly and directly with Na:K ratio |
|
|
Potassium intake |
|
|
g/d (mmol/d) |
RR of hypertension |
|
Q1 < 2.4 (61) |
1.2 |
|
Q2 2.4–2.79 (61–71) |
1.1 |
|
Q3 2.8–3.19 (72–82) |
1.0 |
|
Q4 3.2–3.59 (82–92) |
1.1 |
|
Q5 > 3.6 (92) |
1.0 |
|
|
p = 0.41 |
|
No independent association with potassium intake and risk of hypertension |
|
Zhou et al., 1994). Still, because of high colinearity of nutrient intake (Rose et al., 1988), it is difficult to tease apart the effects of potassium from the effects of other nutrients closely associated with potassium in foods.
Evidence from Intervention Studies
Results from intervention studies demonstrate that potassium can reduce blood pressure in nonhypertensive (Tables 5-3 and 5-4) as well as hypertensive individuals (Tables 5-3 and 5-5). Table 5-3 provides corresponding results for studies in which potassium was increased through diet, while Tables 5-4 and 5-5 provide corresponding results for studies in which potassium was increased by use of potassium supplements. Although the trials in Tables 5-4 and 5-5 tested the effect of supplemental potassium, their findings are assumed to apply to potassium from foods as well. A few studies have tested the effects of diets rich in potassium (Appel et al., 1997; Sacks et al., 2001). One other trial documented that increased fruit and vegetable intake can reduce blood pressure, but it did not
|
Resultsa |
|
A 0.6 g (15 mmol) increase in potassium intake was associated with an estimated mean change in SBP of −1.0 mm Hg |
|
A positive association with SBP and sodium:potassium ratio in the setting of low calcium intakes |
|
An increase in K intake of 1 g/d (26 mmol/d) was associated with a 0.9 mm Hg lower SBP and 0.8 mm Hg lower DBP |
|
Potassium intake was significantly and inversely related to blood pressure in white women and African-American men |
|
Potassium excretion was significantly and inversely associated with blood pressure, especially SBP in men |
|
SBP and DBP were inversely associated with K intake |
specify the amount of dietary potassium provided by the increased fruit and vegetable diet (John et al., 2002). Because of the potential for confounding from concomitant changes in other nutrients (e.g., fiber and magnesium), evidence from Table 5-3 should be interpreted with caution.
A number of the supplemental studies gave potassium supplements (e.g., potassium chloride) without documenting the amount of potassium in the diet (Tables 5-4 and 5-5). Hence, total intake of potassium from diet and supplements in some of the studies is unknown. It should also be recognized that none of the studies listed in Tables 5-3, 5-4, or 5-5 provide more than two levels of potassium; thus a dose-response assessment within the same study is unavailable.
In the absence of large-scale trials, pooling of the results of small clinical trials provides a more statistically precise estimate of intervention effects and allows for the exploration of the basis for heterogeneity in outcome effects. At least three major meta-analyses of the effects of oral potassium in the treatment and prevention of human hypertension have been conducted (Cappuccio and MacGregor, 1991; Geleijnse et al., 2003; Whelton et al., 1997). The meta-
TABLE 5-3 Intervention Studies Evaluating the Effect of Changes in Dietary Potassium Intake from Foods on Blood Pressure
|
Reference |
Study Design |
Potassium Intake, g/d (mmol/d) by Group |
|
Nonhypertensive individuals |
|
|
|
Lawton et al., 1990b |
6-d crossover, 10 men; formula diet + foods |
1.2 (29) 3.9 (92) |
|
8-wk parallel, 326 men and women |
1.8 (45) = control diet 4.1 (105) = fruit/veg 4.4 (113) = DASH |
|
|
Hypertensive individuals |
|
|
|
Lawton et al., 1990 |
6-d crossover, 11 men; formula diet + foods |
1.2 (29) 3.9 (92) |
|
8-wk parallel, 133 men and women |
1.8 (45) = control diet 4.1 (105) = fruit/veg 4.4 (113) = DASH |
|
|
a At end of dietary period. b As determined by random analysis of sample diets. c Difference in response to diet intervention pre- and post- between control and experimental group; SBP = systolic blood pressure, DBP = diastolic blood pressure. |
||
analysis by Whelton and colleagues (1997) and the one by Geleijnse and coworkers (2003) were confined to randomized controlled trials in which the only difference between the intervention and control groups was potassium intake. Both assessed the potential input of confounders, while the analysis by Whelton presented data from individual trials, including estimates of potassium intake.
Of the 33 trials included in the meta-analysis by Whelton and coworkers (1997) (see studies marked in Tables 5-3 and 5-5), there were 2,609 African-American and white participants (18 to 79 years of age). Twelve trials were conducted in nonhypertensive individu-
|
Sodium Intake, g/d (mmol/d) |
Urinary Potassium,a mmol/d, During Follow-up |
Urinary Sodium,a mmol/d, During Follow-up |
Blood Pressure (mm Hg) Changes |
Statistical Significance |
|
|
|
n = 7 |
|
Δ SBP significant at p < 0.01 |
||
|
8.5 (371) |
27 |
302 |
123/69 |
||
|
8.5 (368) |
62 |
343 |
116/72 |
|
|
|
|
SBPc |
DBPc |
|||
|
3.0 (132) |
39 |
138 |
— |
— |
|
|
2.8 (122) |
71 |
130 |
↓ 0.8 |
↓ 0.3 |
|
|
2.9 (124) |
75 |
134 |
↓ 3.5 |
↓ 2.1 |
|
|
|
n = 8 |
|
|
Δ SBP significant at p < 0.001 |
|
|
8.5 (371) |
30 |
322 |
134/79 |
||
|
8.5 (368) |
76 |
324 |
124/76 |
|
|
|
|
SBPc |
DBPc |
|||
|
3.0 (132) |
39 |
138 |
— |
— |
|
|
2.8 (122) |
71 |
130 |
↓ 7.2 |
↓ 2.8 |
|
|
2.9 (124) |
75 |
134 |
↓ 11.4 |
↓ 5.5 |
|
|
d Estimate of nutrient intake based on chemical analysis of 2,100 kcal menu; three food-based diets: control diet, fruit/veg diet (higher in fruits and vegetables), and DASH diet (higher in fruits, vegetables, and dairy, lower in meats, fats, and sweets). e Urinary excretion averaged over both nonhypertensive and hypertensive subjects. NOTE: Difference in response to diet intervention significant at p ≤ 0.01. |
|||||
als (1,005 participants) and 21 trials were conducted in individuals with hypertension (1,560 participants). Hypertensive patients received antihypertensive medications concurrently in 4 of the 21 trials. All but six of the trials provided potassium in the form of potassium chloride. As such, there was little capacity to compare the efficacy of different potassium salts. Just one trial tested potassium citrate as well as potassium chloride (Mullen and O’Conner, 1990). In this small, placebo-controlled trial, neither form of potassium significantly affected blood pressure.
Average net change in urinary potassium excretion for the inter-
TABLE 5-4 Clinical Trials on the Effects of Potassium Supplements on Blood Pressure in Nonhypertensive Individuals in Order of Increasing Duration of Intervention
|
Reference |
Subjects |
Study Design |
Potassium Intake,b g/d (mmol/d) |
|
Barden et al., 1991a |
37 women |
4-d crossover |
Placebo 3.1 (80) KCl supplement |
|
Gallen et al., 1998 |
10 men, 11 women |
9-d crossover; K restriction; 4.1 g (180 mmol) Na |
0.78 (20) diet plus placebo 3.1 (80) KCl supplement |
|
Krishna et al., 1989a |
10 men |
10-d crossover; 2.8–4.6 (120–200 mmol) Na |
0.4 (10) diet plus placebo 3.5 (90) [80 KCl supplement] |
|
Skrabal et al., 1981a |
20 men |
2-wk crossover |
3.1 (80) KCl supplement [4.6 (200) Na] 3.1 (80) KCl supplement [1.2 (50) Na] 7.8 (200) KCl supplement [4.6 (200) Na] 7.8 (200) KCl supplement [1.2 (50) Na] |
|
Khaw and Thom, 1982a |
20 men |
2-wk crossover |
1.6 (41) diet 2.5 (64) KCl supplement |
|
Poulter and Sever, 1986a |
19 men |
2-wk crossover |
Placebo 2.5 (64) KCl supplement |
|
Mullen and O’Connor, 1990a |
24 men |
2-wk crossover |
Placebo 2.9 (75) KCl supplement 2.9 (75) K citrate supplement |
|
Brancati et al., 1996a |
31 men, 56 women |
3-wk parallel, 2.9–4.0g (127–175 mmol) Na |
Placebo plus 1.3-1.4 (32-35) K from diet 3.1 (80) KCl supplement plus 1.3-1.4 (32-35) K from diet |
|
Urinary Electrolytes,c g/d (mmol/d) During Follow-up |
Mean Blood Pressure (mm Hg) on Placebo or Control Dietd |
Mean Net Change in Blood Pressuree (mm Hg) |
Comments |
||
|
Potassium (K) |
Sodium (Na) |
SBP |
DBP |
||
|
2.1 (53) |
2.4 (105) |
105.9/64.1 |
— |
— |
|
|
4.9 (125) |
2.8 (120) |
|
−1.7 |
−0.6 |
|
|
2.5 (64) |
3.2 (140) |
MAP |
MAP |
|
No significant difference between African-American and white participants |
|
|
82.7 |
— |
|||
|
7.8 (20) |
2.5 (109) |
|
+3.7 |
||
|
1.1 (28) |
2.3 (100) |
120.0/73.1 |
— |
— |
|
|
2.9 (75) |
3.3 (144) |
|
−5.5 |
−7.4 |
|
|
2.8 (71) |
4.8 (210) |
125.0/73.1 |
— |
— |
|
|
2.5 (65) |
0.9 (40) |
|
−2.7 |
−3.0 |
|
|
4.5 (116) |
3.6 (155) |
−1.7 |
−4.5 |
||
|
6.7 (172) |
0.6 (28) |
−2.3 |
−3.5 |
||
|
3.0 (78) |
3.6 (155) |
155.7/72.1 |
— |
— |
|
|
5.1 (130) |
3.8 (164) |
|
−1.1 |
−2.4 |
|
|
1.6 (41) |
2.6 (113) |
109.6/64.6 |
— |
— |
|
|
3.1 (79) |
2.6 (114) |
|
−1.2 |
+2.0 |
|
|
3.0 (77) |
3.5 (153) |
117/69 |
— |
— |
|
|
3.9 (100) |
3.2 (141) |
|
0 |
+3.0 |
|
|
4.3 (111) |
3.2 (138) |
−2.0 |
+2.0 |
||
|
0.9 (25) |
2.9 (130) |
127/77 |
— |
— |
|
|
3.5 (89) |
3.3 (143) |
|
−6.9 |
−2.5 |
|
|
Reference |
Subjects |
Study Design |
Potassium Intake,b g/d (mmol/d) |
|
Barden et al., 1986a |
44 women |
4-wk crossover |
Placebo 3.1 (80) KCl supplement |
|
Naismith and Braschi, 2003 |
33 men, 26 women |
6-wk parallel |
Placebo plus 3.3 (84) diet 0.9 (24) KCl supplement plus 3.3 (84) diet |
|
Whelton et al., 1995a |
255 men, 98 women |
24-wk parallel |
Placebo 2.3 (60) KCl supplement |
|
Hypertension Prevention Trial Research Group, 1990a |
247 men, 144 women |
3-yr parallel |
3.9 (100) diet |
|
a Included in meta analysis by Whelton et al. (1997). b Potassium intake from diet unless otherwise indicated. c Surrogate marker for electrolyte intake. CI = confidence interval. |
|||
vention versus the control (21 trials) in the meta-analysis (Whelton et al., 1997) varied from 0 to 129 mmol (5.0 g)/24 hours (median = 50 mmol [1.9 g]/24 hours) and was greater than or equal to 40 mmol (1.6 g)/24 hours in 21 (68 percent) trials. The weighted net change in urinary potassium was 53 mmol (2.1 g)/24 hours. Average net change in urinary sodium excretion for the intervention versus control ranged from −55 to +44 mmol (−1.3 g to +1.0 g)/24 hours, with a median of 7 mmol (0.3g)/24 hours. There was an intervention-related trend toward a reduction in systolic blood pressure in 26 of the 32 trials (81 percent), and in 11 trials (34 percent) the reduction in blood pressure was statistically significant. For diastolic blood pressure, an intervention-related trend toward reduction in blood pressure was noted in 24 of 33 trials (73 percent), and in 11 trials (30 percent) the reduction was statistically significant. Overall pooled estimates of the effects of potassium supplementation on systolic and diastolic blood pressure were −4.4 and −2.4 mm Hg, respectively (p < 0.001 for both values). Exclusion of an outlier
|
Urinary Electrolytes,c g/d (mmol/d) During Follow-up |
Mean Blood Pressure (mm Hg) on Placebo or Control Dietd |
Mean Net Change in Blood Pressuree (mm Hg) |
Comments |
||
|
Potassium (K) |
Sodium (Na) |
SBP |
DBP |
||
|
1.9 (51) |
2.9 (126) |
118/71 |
— |
— |
|
|
4.6 (118) |
3.1 (136) |
|
−1.4 |
−1.4 |
|
|
|
3.5 (151) |
116/71 |
— |
— |
|
|
3.8 (166) |
|
−7.6 |
−6.5 |
||
|
2.1 (54) |
3.3 (144) |
121.6/81.1 |
— |
— |
|
|
3.8 (97) |
3.3 (144) |
|
−0.13 |
−0.26 |
|
|
2.5 (65) |
3.5 (154) |
124.1/82.3 |
−1.3 |
−0.9 |
|
|
d MAP = mean arterial pressure. e If potassium supplement, then change in blood pressure compared to placebo. SBP = systolic blood pressure, DBP = diastolic blood pressure. |
|||||
trial (Obel, 1989) reduced the overall pooled effect size estimates to −3.1 mm Hg for systolic blood pressure and −2.0 mm Hg for diastolic blood pressure (p < 0.001 for both values) (Whelton et al., 1997).
When the analysis was restricted to the 29 trials with a documented intervention-related net change in urinary potassium greater than or equal to 20 mmol (0.8 g)/24 hours, the effect size estimates were −4.9 mm Hg for systolic and −2.7 mm Hg for diastolic blood pressure. These effect size estimates were also higher when analyses were restricted to the 29 trials in nonhypertensive and hypertensive individuals in whom no antihypertensive medications were administered (Whelton et al., 1997).
In subgroup analyses, there was a trend toward greater treatment-related reductions in systolic and diastolic blood pressure at higher levels of urinary sodium excretion during follow-up (p < 0.001). Linear regression analysis also identified a significant, independent positive relationship between average 24-hour urinary sodium ex-
TABLE 5-5 Clinical Trials on the Effects of Potassium Supplements on Blood Pressure in Hypertensive Individuals in Order of Increasing Duration of Intervention
|
Reference |
Subjects |
Study Design |
Potassium Intake,b g/d (mmol/d) |
|
Smith et al., 1992a |
12 men 9 women |
4-d crossover 4.6 g (200 mmol) Na |
Placebo 4.7 (120) KCl |
|
Krishna and Kapoor, 1991 |
10 men 2 women |
10-d parallel; K restriction 2.8 g (120 mmol) Na |
3.8 (96) [80 mmol KCl supplement] 0.62 (16) diet |
|
Zoccali et al., 1985a |
10 men 9 women |
2-wk crossover |
Placebo 3.9 (100) KCl supplement |
|
MacGregor et al., 1982a |
12 men 11 women |
4-wk crossover |
Placebo 2.5 (64) KCl supplement |
|
Richards et al., 1984a |
8 men 4 women |
4- to 6-wk crossover; 4.1g (180 mmol) Na |
2.3 (60) 7.8 (200) |
|
Smith et al., 1985a |
11 men 9 women |
4-wk crossover; 1.6 g (70 mmol) Na |
Placebo 2.5 (64) KCl supplement |
|
Valdes et al., 1991a |
13 men 11 women |
4-wk crossover |
Placebo 2.5 (64) KCl supplement |
|
Fotherby and Potter, 1992a |
5 men 13 women |
4-wk crossover |
Placebo 2.3 (60) KCl supplement |
|
Kaplan et al., 1985a |
6 men 10 women |
6-wk crossover |
Placebo 2.3 (60) KCl supplement |
|
Matlou et al., 1986a |
32 women |
6-wk crossover |
Placebo 2.5 (65) KCl supplement |
|
Grobbee et al., 1987a |
34 men 6 women |
6-wk crossover |
Placebo 2.8 (72) KCl supplement |
|
Svetkey et al., 1987a |
75 men 26 women |
8-wk parallel |
Placebo 4.7 (120) KCl supplement |
|
Patki et al., 1990a |
8 men 29 women |
8-wk crossover |
Placebo 2.3 (60) KCl supplement |
|
Urinary Electrolytes,c g/d (mmol/d) |
Mean Blood Pressure (mm Hg) Placebo or Control Diet |
Mean Net Change in Blood Pressured (mm Hg) |
Comments |
||
|
Potassium (K) g (mmol) |
Sodium (Na) g (mmol) |
SBP |
DBP |
||
|
2.7 (70) |
4.4 (192) |
150.5/85.9 |
— |
— |
|
|
7.0 (179) |
5.1 (221) |
|
−4.3 |
−1.7 |
|
|
1.1 (27) |
1.9 (83) |
141/96 |
— |
— |
Isocaloric diets |
|
2.8 (72) |
2.5 (110) |
|
+7 |
+6 |
|
|
2.3 (58) |
4.2 (182) |
147/92 |
−1.0 |
−3.0 |
Lying BP |
|
5.4 (139) |
4.5 (195) |
|
|
||
|
2.4 (62) |
3.2 (140) |
155/99 |
— |
— |
|
|
4.6 (118) |
3.9 (169) |
|
−7.0 |
−4.0 |
|
|
2.4 (61) |
4.6 (200) |
149.9/92.4 |
— |
— |
|
|
7.4 (190) |
4.7 (205) |
|
−1.9 |
−1.0 |
|
|
2.6 (67) |
1.7 (73) |
162/103 |
— |
— |
|
|
4.6 (117) |
1.8 (80) |
|
−2.0 |
0 |
|
|
2.2 (55) |
3.4 (147) |
145/92 |
— |
— |
|
|
4.8 (123) |
3.8 (166) |
|
−7.0 |
−3.0 |
|
|
2.3 (60) |
2.8 (123) |
186/100 |
— |
— |
|
|
3.9 (99) |
3.1 (136) |
|
−10.0 |
−6.0 |
|
|
1.4 (36) |
3.9 (168) |
133.2/97.7 |
— |
— |
Subjects treated with antihypertensive medication |
|
3.2 (82) |
3.9 (169) |
|
−5.6 |
−5.8 |
|
|
2.0 (52) |
2.9 (130) |
151/103 |
— |
— |
|
|
4.5 (114) |
3.8 (165) |
|
−7.0 |
−3.0 |
|
|
2.9 (74) |
1.3 (57) |
135.7/72.5 |
— |
— |
|
|
5.1 (131) |
1.6 (69) |
|
−2.5 |
−0.6 |
|
|
Not given |
Not given |
142/92.4 |
— |
— |
|
|
|
−0.9 |
−1.3 |
|||
|
2.3 (60) |
4.6 (198) |
155.7/97.6 |
— |
— |
|
|
3.2 (82) |
4.2 (184) |
|
−12.1 |
−13.1 |
|
|
Reference |
Subjects |
Study Design |
Potassium Intake,b g/d (mmol/d) |
|
Overlack et al., 1991a |
8 men 4 women |
8-wk crossover |
Placebo 4.7 (120) K citrate and bicarbonate |
|
Cushman and Langford, 1988a |
58 men |
10-wk parallel |
Placebo 3.1 (80) KCl supplement |
|
Bulpitt et al., 1985a |
15 men 18 women |
12-wk parallel |
Placebo 2.5 (64) KCl supplement |
|
Chalmers et al., 1986a |
91 men 16 women |
12-wk parallel |
Normal diet High K 3.9 (100) |
|
|
90 men 15 women |
12-wk parallel |
Low Na 1.2–1.7 (50–75) High K 3.9 (100) |
|
Grimm et al., 1988a |
298 men |
12-wk parallel |
Placebo 3.8 (96) KCl supplement |
|
Gu et al., 2001 |
60 men 90 women |
12-wk parallel |
Placebo 2.3 (60) KCL supplement |
|
Siani et al., 1987a |
23 men 14 women |
15-wk parallel |
Placebo 1.9 (48) KCl supplement |
|
Obel, 1989a |
21 men 27 women |
16-wk parallel |
Placebo 2.5 (64) potassium supplement |
|
Peart et al., 1987a |
269 men 215 women |
24-wk parallel |
Placebo 0.7–1.3 (17–34) KCl supplement |
|
a Included in meta-analysis by Whelton et al. (1997). b Potassium intake from diet unless otherwise indicated. c Surrogate marker for electrolyte intake. d If potassium supplement, then change in blood pressure compared to placebo. SBP = systolic blood pressure, DBP = diastolic blood pressure. |
|||
|
Urinary Electrolytes,c g/d (mmol/d) |
Mean Blood Pressure (mm Hg) Placebo or Control Diet |
Mean Net Change in Blood Pressured (mm Hg) |
Comments |
||
|
Potassium (K) g (mmol) |
Sodium (Na) g (mmol) |
SBP |
DBP |
||
|
2.4 (62) |
3.9 (169) |
150/100 |
+2.8 |
+3.0 |
|
|
6.5 (167) |
3.6 (156) |
|
|||
|
1.9 (45) |
Not given |
Not given/91.2 |
Not given |
−0.1 |
|
|
4.4 (113) |
Not given |
|
|||
|
2.2 (55) |
3.2 (139) |
182/129 |
— |
— |
Subjects treated with antihypertensive medication |
|
3.7 (95) |
3.4 (149) |
|
+2.3 |
+4.8 |
|
|
2.9 (75) |
3.6 (156) |
146.2/93.4 |
— |
— |
|
|
3.8 (96) |
3.3 (145) |
|
−3.9 |
−3.1 |
|
|
2.9 (75) |
1.9 (86) |
143.1/89.2 |
— |
— |
|
|
3.4 (87) |
1.7 (72) |
|
+1.0 |
+1.6 |
|
|
2.9 (76) |
2.6 (114) |
121.8/79.5 |
−0.2 |
−0.6 |
Subjects treated with antihypertensive medication |
|
5.9 (150) |
2.7 (116) |
|
|||
|
1.3 (34) |
3.8 (164) |
134/83 |
— |
— |
|
|
2.1 (54) |
4.3 (185) |
|
−3.7 |
−0.16 |
|
|
2.2 (57) |
4.2 (183) |
145.8/92.5 |
— |
— |
|
|
3.4 (87) |
4.3 (189) |
|
−14.0 |
−10.5 |
|
|
2.4 (62) |
|
172/100 |
— |
— |
|
|
4.0 (102) |
Not given |
|
−39.0 |
−17.0 |
|
|
|
133.5/84.9 |
— |
— |
Subjects treated with antihypertensive medication |
|
|
Not given |
Not given |
|
−0.8 |
−0.7 |
|
cretion in each trial during follow-up and the corresponding net reduction in systolic (p = 0.004) and diastolic (p = 0.003) blood pressure. At higher levels of baseline 24-hour urinary sodium and of change in 24-hour urinary sodium, change in 24-hour urinary potassium showed a dose-response relationship with effect size for both systolic and diastolic blood pressure (p < 0.01). A similar graded response between change in 24-hour urinary potassium and effect size was observed at higher levels of 24-hour urinary sodium as follow-up for systolic (p < 0.01) but not for diastolic (p = 0.2) blood pressure (Whelton et al., 1997). This finding in the meta-analysis was evident in two 2 × 2 factorial trials (Chalmers et al., 1986; Skrabel et al., 1981). In both trials, supplemented potassium lowered blood pressure when sodium intake was high, but not when sodium intake was low.
The role of urinary sodium excretion as an effect modifier for the relationship between potassium consumption and blood pressure is consistent with results from observational investigations where blood pressure is more closely related to the ratio of urinary sodium:potassium excretion than to either urinary sodium or potassium excretion alone (Khaw and Barrett-Connor, 1988, 1990).
Treatment-related systolic blood pressure effect size estimates were significantly (p = 0.03) greater for the six trials with greater than 80 percent African-American participants compared with the 25 trials with greater than 80 percent white participants (Whelton et al., 1997). Also, there was some evidence for a dose-response relationship between potassium dose and blood pressure and some evidence for greater blood pressure reduction in African-American compared with white participants. In the two trials included that enrolled exclusively African-American individuals, potassium significantly lowered both systolic and diastolic blood pressure (Brancati et al., 1996; Obel, 1989). The blood pressure reductions in the study by Obel (1989) were particularly striking.
Overall, available evidence from observational studies, clinical trials, and meta-analyses of trials documents that higher intakes of potassium lower blood pressure. Blood pressure reductions from supplemental potassium occurred when baseline intake was low (e.g., 32 to 35 mmol/day in Brancati et al., 1996) and when baseline intake was much higher (> 80 mmol/day in Naismith and Braschi, 2003). Because virtually all trials used potassium chloride supplements, while observational studies assessed dietary potassium intake from foods (paired with nonchloride anions), the effects of potassium on blood pressure appear to result from potassium rather than its conjugate anion.
Prevention of Cardiovascular Disease
In addition to its blood pressure-reducing effects, increased potassium intake may have independent vascular protective properties. This possibility has been evaluated in experimental studies conducted in rodents over the last four decades. In a series of animal models, including both stroke-prone spontaneously hypertensive (SHRSP) and Dahl salt-sensitive rats, the addition of either potassium chloride or potassium citrate markedly reduced the mortality from stroke, a reduction that was unrelated to any measured attenuation of hypertension (Tobian, 1986; Tobian et al., 1984). In a more recent study with SHRSP rats in which aortic blood pressure was measured by continuous radiotelemetry, dietary potassium supplemented as either potassium bicarbonate or potassium citrate attenuated hypertension and prevented stroke (Tanaka et al., 1997). However, supplemental potassium chloride exacerbated hypertension, increased risk of stroke (Tanaka et al., 1997), and amplified renal microangiopathy (Tanaka et al., 2001), in comparison with potassium bicarbonate or citrate.
Hence, at least in this animal model, the anion accompanying potassium had a major qualitative effect on outcomes such that potassium citrate or bicarbonate was beneficial, while potassium chloride appeared to be harmful. Still, the discordant results between this study and the cited study of Tobian and coworkers (1984) are difficult to reconcile and therefore preclude firm conclusions.
An inverse relationship between dietary potassium intake at baseline and subsequent stroke-associated morbidity and mortality has also been noted in several, but not all, cross-sectional and cohort studies (Table 5-6). In a 12-year follow-up of 859 men and women enrolled in the Rancho Bernardo Study and who were 50 to 79 years of age at baseline, a significant (p = 0.01) inverse relationship between potassium intake and subsequent risk of stroke-related mortality was noted (Khaw and Barrett-Connor, 1987). Each standard deviation increase in potassium intake (0.4 g [10 mmol]/day) at baseline was associated with a 40 percent reduction in risk of stroke-related mortality relative risk (RR) = 0.6; 95 percent confidence interval (CI) = 0.44 to 0.81 after adjustment for age, gender, systolic blood pressure, caloric intake, and other potential confounders. Limitations of the study included the restricted characteristics of the cohort and the fact that the findings were based on only 24 stroke deaths. No significant relationship with coronary heart disease was detected.
Over a 16-year follow-up in the Honolulu Heart Study (n = 7,591
TABLE 5-6 Epidemiological Studies on Potassium Intake: Stroke and Heart Disease
|
Reference |
Study Design |
|
Stroke |
|
|
Khaw and Barrett-Connor, 1987 |
Rancho Bernardo Study, 12-yr follow-up n = 859 men and women, not energy adjusted |
|
Lee et al., 1988 |
Honolulu Heart Study, 16-yr follow-up n = 7,591 Japanese men |
|
Sasaki et al., 1995 |
Pearson correlation and multiple regression analysis n = 17 countries |
|
Ascherio et al., 1998 |
Health Professionals Follow-up Study n = 43,738 men, multivariate analysis |
|
Iso et al., 1999 |
Nurses’ Health Study, prospective cohort n = 85,764 women, multivariate analysis |
|
Potassium Intake,a g/d (mmol/d) |
Resultsb |
Other Results and Comments |
||
|
Men |
Rate of stroke/100 |
Multivariate regression analysis showed that a 0.39-g increase in daily potassium intake was associated with a 40 percent reduction in the risk of stroke-associated mortality. |
||
|
T1 |
< 2.3 (59) |
3.4 |
|
|
|
T2 |
2.3–2.96 (59–76) |
2.4 |
||
|
T3 |
> 2.96 (76) |
0.0 |
||
|
|
p trend = 0.16 RR T1 vs T3 = 2.6 |
|||
|
Women |
|
|||
|
T1 |
< 1.9 (49) |
5.3 |
|
|
|
T2 |
1.9–2.57 (49–66) |
2.1 |
||
|
T3 |
> 2.6 (67) |
0.0 |
||
|
|
p trend = 0.01 RR T1 vs T3 = 4.8 |
|||
|
|
Incidence rate of fatal thromboembolic stroke |
No significant correlation for nonfatal thromboembolic and fatal and nonfatal hemorrhagic |
||
|
Q1 |
< 1.47 (38) |
6.9 |
|
|
|
Q2 |
1.47–1.86 (38–48) |
5.3 |
||
|
Q3 |
1.86–2.27 (48–58) |
4.1 |
||
|
Q4 |
2.27–2.77 (58–71) |
2.4 |
||
|
Q5 |
> 2.77 (71) |
2.0 |
||
|
|
p = 0.002 strokes. |
|||
|
Potassium intake not reported |
Urinary potassium correlated inversely with incidence of stroke mortality (p < 0.05) |
|
||
|
|
RR of stroke |
Risk for ischemic stroke alone was similar to risk for total strokes. |
||
|
Q1 |
2.4 (61) |
1.0 |
|
|
|
Q2 |
3.0 (77) |
0.85 |
||
|
Q3 |
3.3 (85) |
0.78 |
||
|
Q4 |
3.6 (92) |
0.76 |
||
|
Q5 |
4.3 (110) |
0.62 |
||
|
|
p trend = 0.007 |
|||
|
|
RR of all strokes |
RR of ischemic stroke |
|
|
|
Q1 |
2.02 (52) |
1.0 |
1.0 |
|
|
Q2 |
2.41 (62) |
0.75 |
0.68 |
|
|
Q3 |
2.71 (69) |
0.90 |
0.85 |
|
|
Q4 |
3.03 (78) |
0.80 |
0.73 |
|
|
Q5 |
3.55 (91) |
0.83 |
0.71 |
|
|
|
p trend = 0.19 |
p trend = 0.07 |
||
|
Potassium Intake,a g/d (mmol/d) |
Resultsb |
Other Results and Comments |
||
|
|
RR of stroke mortality (T1 vs. T3) |
Only among African-American men was lower dietary potassium intake a predictor of stroke mortality. |
||
|
White men n = 3,169 |
|
|||
|
T1 |
< 2.0 (51) |
|||
|
T2 |
2.0–2.88 (51–74) |
|||
|
T3 |
> 2.88 (74) |
1.66, p = 0.42 |
||
|
African-American men n = 595 |
|
|||
|
T1 |
< 1.3 (33) |
|||
|
T2 |
1.3–2.2 (33–56) |
|||
|
T3 |
> 2.2 (56) |
4.27, p = 0.0016 |
||
|
African-American women n = 1,029 |
|
|
||
|
T1 |
< 1.0 (26) |
|||
|
T2 |
1.0–1.64 (26–42) |
|||
|
T3 |
> 1.64 (42) |
1.13, p = 0.53 |
||
|
Nonhypertensive n = 7,632 |
|
|||
|
Males |
1.23, p = 0.458 |
|||
|
Females |
1.11, p = 0.415 |
|||
|
|
HR of stroke |
HR of CHD |
||
|
Q1 |
< 1.35 (35) |
1.0 |
1.0 |
|
|
Q2 |
1.35–1.94 (35–50) |
0.75 |
1.04 |
|
|
Q3 |
1.94–2.67 (50–68) |
0.85 |
0.95 |
|
|
Q4 |
> 2.67 (68) |
0.76 |
1.01 |
|
|
|
p trend = 0.14 |
p trend = 0.93 |
||
|
|
HR = 1.28 when comparing Q1 to Q4, p < 0.0001 |
|||
|
|
RR for stroke |
|||
|
Q1 |
< 2.34 (59.8) |
1.76 |
|
|
|
Q2 |
2.35–2.92 (60–75) |
1.22 |
||
|
Q3 |
2.93–3.47 (75–89) |
1.11 |
||
|
Q4 |
3.48–4.16 (89–106) |
1.37 |
||
|
Q5 |
> 4.17 (107) |
1.0 |
||
|
Potassium intake not reported |
|
Potassium excretion was inversely correlated with incidence of CHD and all deaths |
||
Japanese-American participants), there was a significant inverse relationship (p = 0.002) between potassium intake and mortality from thromboembolic stroke (Lee et al., 1988). No significant association was noted for nonfatal thromboembolic stroke or for fatal or nonfatal hemorrhagic strokes. Additionally, inverse relationships between potassium intake and stroke mortality were noted in several cohort studies (Sasaki et al., 1995; Xie et al., 1992; Yamori et al., 1994) but these findings were not adjusted for caloric intake and/or were based on an ecologic analysis (Xie et al., 1992). In a 7-year follow-up report of 5,754 men and 5,875 women who were participants in the Scottish Heart Health Study, an inverse relationship between potassium intake and subsequent death, both from all causes and from coronary heart disease, was found (Tunstall-Pedoe et al., 1997).
Similarly, over the course of 8 years of follow-up in 43,738 U.S. men in the Health Professionals Study, there was a significant inverse relationship between baseline potassium intake and stroke (p = 0.007 for trend across quintiles of potassium intake) after adjustment for established cardiovascular disease risk factors, including blood pressure and caloric intake (Ascherio et al., 1998). The multivariate RR of stroke for men in the highest versus lowest quintile of potassium intake was 0.62 (95 percent CI = 0.43−0.88). The association was similar for both ischemic (n = 210) and all (n = 328) strokes. Use of potassium supplements was also inversely associated with the risk of stroke.
In a 14-year study of 85,764 U.S. women who participated in the Nurses Health Study, there was an inverse relationship between potassium intake and ischemic stroke (RR = 0.72; 95 percent CI = 0.51 to 1.01 for comparison of upper and lower quintiles of potassium intake; 347 strokes occurred during this time period), but much of the association was lost following adjustment for calcium intake (Iso et al., 1999). Two analyses of NHANES I follow-up study have been reported. In a 17-year analysis of subsequent stroke mortality in approximately 10,000 men and women (during which there were 304 strokes), there was a significant inverse relationship between potassium intake and stroke mortality in hypertensive and African-American men, but not in other subgroups (Fang et al., 2000). In a 19-year follow-up of the same cohort, the relationships of potassium intake with fatal and nonfatal strokes (total n = 927) and coronary heart disease (n = 1847) events were assessed (Bazzano et al., 2001). Overall, stroke hazard was significantly different among quartiles of potassium intake (p = 0.03), but the relationship was nonlinear. Participants in the lowest quartile of potassium intake at baseline
(< 1.4 g [34.6 mmol]/day) experienced a 28 percent higher risk of stroke (95 percent CI = 1.11 to 1.47; e.g., p < 0.0001) compared with the remainder of the cohort after adjustment for established cardiovascular disease risk factors.
Prevention of Bone Demineralization
Epidemiological Studies
Observational studies suggest that increased fruit and potassium consumption is associated with increased bone mineral density (BMD) (see Table 5-7). Pyridinoline excretion, a marker of bone resorption, was negatively associated with energy-adjusted potassium intakes (New et al., 2000). Longitudinal studies have documented that potassium intake was positively associated with BMD at various sites (Macdonald et al., 2004; Tucker et al., 1999).
Given that net endogenous acid production (NEAP) can be closely estimated by the dietary protein-to-potassium ratio (Frassetto et al., 1998), these observations are those predicted if sustained high rates of diet-induced endogenous acid act over time to demineralize bone. The association of NEAP with several indices of skeletal status in 1,056 pre- and perimenopausal women was recently reported (New et al., 2004). Lower estimates of energy-adjusted NEAP were correlated with higher BMD at the spine and hip, as assessed by dual X-ray absorptiometry. Hip and forearm bone mass decreased significantly across increasing quartiles of NEAP. These differences remained significant when adjusted for age, weight, height, and menstrual status. Lower estimates of NEAP were correlated with lower urinary excretion of deoxypyridinoline, a marker of bone resorption, and were significant predictors of spine and forearm bone mass (New et al., 2004).
Intervention Studies
Two studies have been reported in which supplemental potassium was provided and subsequent measures of calcium and phosphorus balance were evaluated. In a study of 18 healthy postmenopausal women (Sebastian et al., 1994), supplemental potassium bicarbonate provided for 18 days induced a slight but sustained and near immediate increase in the plasma bicarbonate concentration and blood pH and virtually abolished net renal acid excretion. Calcium and phosphorus balance improved (as measured by the difference between dietary intake and fecal/urine excretion). There was also
TABLE 5-7 Epidemiological Studies on the Effect of Potassium Intake on Bone Mineral Density (BMD)
|
Reference |
Study Design |
Effect |
Findings |
|
New et al., 1997 |
Cross-sectional 944 women |
+ |
Potassium intake was significantly (p < 0.05) correlated with BMD for lumbar spine, femoral neck, trochanter, and Ward’s area in premenopausal women |
|
Tucker et al., 1999 |
Cross-sectional and longitudinal 907 men and women |
+ |
Potassium intake was significantly (p < 0.05) associated with BMD for the femoral neck, trochanter, Ward’s area, and radius in men (cross-sectional) In women potassium intake was significantly (p < 0.05) associated with bone mineral density for the trochanter, Ward’s area, and radius (cross-sectional) In a 4-yr analysis of change in BMD, potassium intake was significantly (p < 0.05) associated with less decline in BMD for femoral neck and trochanter in men |
|
New et al., 2000 |
Cross-sectional 62 women |
+ |
Potassium intake was significantly (p < 0.01) associated with higher total bone mass (p < 0.05 to p < 0.005) Potassium intake was significantly (p < 0.02) and negatively associated with pyridinoline excretion and deoxypyridinoline excretion |
|
Jones et al., 2001 |
Cross-sectional 330 children |
+ |
Significant (p < 0.001) association between urinary potassium, femoral neck, lumbar spine, and total body BMD in prepubertal children |
|
Macdonald et al., 2004 |
Longitudinal 891 women |
+ |
Significant (p < 0.05) and positive correlation between potassium intake and femoral neck BMD in premenopausal and perimenopausal women |
a reduction in the urinary excretion of hydroxyproline, a marker of bone breakdown, and an increase in the serum concentration of osteocalcin, a marker of bone formation. When supplemental potassium bicarbonate was discontinued, the levels of plasma bicarbonate and arterial pH, like those of all other measured variables that had changed with the supplement, returned almost immediately to levels nearly identical to those occurring before the potassium bicarbonate was supplemented. This pattern of results suggests that a state of low-grade metabolic acidosis existed immediately before and after potassium bicarbonate was supplemented; that the acidosis resulted from the endogenous generation of noncarbonic acid at a rate greater than that at which the kidney could excrete it; that the acidosis induced increased bone resorption and reduced bone formation; that the acidosis induced increased renal loss of calcium and phosphate and thereby negative balances of both; and that supplemental potassium bicarbonate reversed each of these metabolic derangements by fully correcting the low-grade metabolic acidosis by titrating endogenously produced noncarbonic acid. Similar results were seen and conclusions drawn in metabolic studies of nonhypertensive young men and women in whom dietary potassium chloride was replaced with potassium bicarbonate, where-upon the urinary excretion of deoxypyridinoline, pyridinoline, and n-telopeptide (markers of bone resorption) promptly decreased (Maurer et al., 2003).
In a pre- and poststudy in which 21 adult patients with calcium urolithiasis were treated with potassium citrate for 11 to 120 months,
spinal BMD substantially increased over a period of time (which varied from approximately 1 to 10 years) in which an age-related decrease might otherwise have occurred (Pak et al., 2002). In normal adults, potassium bicarbonate has been demonstrated to be hypocalciuric, whereas potassium chloride has not (Lemann et al., 1991). This reflects not only the direct acidosis-countering effect of the bicarbonate component of potassium bicarbonate, but also the capacity of potassium (Brunette et al., 1992) and bicarbonate (Peraino and Suki, 1980) to jointly enhance the renal reclamation of calcium.
Relationship with Sodium
The dietary intake of sodium chloride is an important determinant of urinary calcium excretion and calcium balance. The urinary excretion of calcium is well documented to vary directly with that of sodium (see Table 6-19 in Chapter 6). There is evidence that reducing dietary sodium chloride can induce beneficial effects on bone by reducing the renal loss of calcium and increasing its retention (Devine et al., 1995; Matkovic et al., 1995). However, on a mole-for-mole basis, the hypocalciuric effect of orally administered potassium overrides the hypercalciuric effect of dietary sodium (Morris et al., 1999b; Sellmeyer et al., 2002). In a metabolically controlled outpatient study of normal men fed a diet deficient in potassium (1.2 g [30 mmol]/day), increasing dietary sodium chloride from 1.8 g (30 mmol)/day to 14.6 g (250 mmol)/day induced a 50 percent increase in urinary calcium that supplemental potassium bicarbonate either reversed or abolished, depending on whether dietary potassium was increased to 2.7 or 4.7 g (70 or 120 mmol)/day (Morris et al., 1999b). In an outpatient study of postmenopausal women, the hypercalciuric effects of sodium loading with 5.2 g (225 mmol)/day sodium and a concomitant increase in bone resorption, as indicated by biochemical markers, was abolished by supplying 3.5 g (90 mmol)/day of dietary potassium as potassium citrate, a supplement that increased urinary potassium to 141 mmol (5.5 g)/day (Sellmeyer et al., 2002).
Prevention of Kidney Stones
Epidemiological Evidence
In several studies, an increased dietary intake of potassium has been associated with a reduced risk of kidney stones. The occur-
rence of kidney stones in both sexes is directly related to the urinary sodium:potassium ratio (Cirillo et al., 1994). In a pre-post, uncontrolled study of children with idiopathic hypercalciuria, reducing the dietary sodium:potassium ratio greatly reduced urinary calcium excretion (Alon and Berenbom, 2000). Hypercalciuria is generally accepted as a major risk factor for calcium-containing kidney stones (Coe et al., 1992). The incidence of kidney stones has been shown to increase with an increased sodium:potassium ratio (Stamler and Cirillo, 1997).
In a longitudinal study of 51,529 men conducted prospectively over 4 years, the incidence of symptomatic kidney stones, while not correlating with dietary sodium, did correlate strongly and negatively with dietary potassium as measured by a food-frequency questionnaire over a broad range of intake (2.9 to 4.0 g [74 to 102 mmol]/day) (Curhan et al., 1993) (see Table 5-8). The absence of a relationship between dietary sodium and kidney stones should be
TABLE 5-8 Epidemiological Studies on Potassium Intake and Risk of Kidney Stone Formation
|
Reference |
Study Design |
Potassium Intake,a g/d (mmol/d) |
Relative Risk for Kidney Stones |
|
|
Curhan et al., 1993 |
Health Professionals Study, 45,619 men, 4-yr follow-up |
Q1 |
< 2.9 (74) |
1.0 |
|
Q2 |
3.1 (79) |
0.88 |
||
|
|
Q3 |
3.4 (87) |
0.74 |
|
|
Q4 |
3.8 (97) |
0.69 |
||
|
Q5 |
> 4.0 (102) |
0.49 |
||
|
|
p trend < 0.001 |
|||
|
Curhan et al., 1997 |
Nurses’ Health Study, 91,731 women, 12-yr follow-up |
Q1 |
2.0 (52) |
1.0 |
|
Q2 |
2.7 (69) |
0.86 |
||
|
|
Q3 |
3.2 (81) |
0.75 |
|
|
Q4 |
3.7 (95) |
0.67 |
||
|
Q5 |
4.7 (119) |
0.65 |
||
|
|
p trend < 0.001 |
|||
|
Hirvonen et al., 1999 |
Prospective cohort, n = 27,001 Finnish male smokers |
Q1 |
3.8 (97) |
1.0 |
|
Q2 |
4.6 (118) |
0.76 |
||
|
Q3 |
5.1 (131) |
0.85 |
||
|
|
Q4 |
5.7 (146) |
0.79 |
|
|
|
p trend = 0.34 |
|||
|
a Q = quartile or quintile of intake. |
||||
interpreted cautiously because the food-frequency questionnaire used in these studies did not measure sodium intake either accurately or precisely (Subar et al., 2001). In this study (Curhan et al., 1993), the incidence of kidney stones correlated directly with meat intake. In a 12-year prospective study of an even larger number of female nurses, the incidence of stone formation was inversely associated with dietary potassium (2.0 to 4.7 g [52 to 119 mmol]/day) (Curhan et al., 1997). In a study conducted in Finland where the dietary potassium intake is greater than in the United States, risk for kidney stones appeared to decrease with an increased intake of potassium (3.8 compared with 4.6 g [97 to 118 mmol]/day) (Hirvonen et al., 1999). However, higher intakes of potassium did not appear to further reduce risk, and the relationship between potassium intake and kidney stones, overall, was nonsignificant.
Role of Acid-Base Balance, Urinary Citrate, and Relationship with Sodium
An increased intake of meat has long been recognized as a risk factor for kidney stones, presumably because of the resultant acid load and the well-documented impact of that load on urinary calcium excretion (Lemann, 1999; Lemann et al., 2003). By increasing the acid load and slightly reducing the plasma bicarbonate concentration, an increased intake of animal protein also induces a decrease in the urinary excretion of citrate (Breslau et al., 1988), a major risk factor for the formation of kidney stones (Coe et al., 1992; Pak, 1987). Urinary citrate chelates urinary calcium in a soluble form (Bisaz et al., 1978; Meyer and Smith, 1975; Pak, 1987). Both hypocitraturia and hypercalciuria occur with even modest potassium deficiencies (Hamm, 1990; Simpson, 1983). Administration of either potassium bicarbonate or potassium citrate induces an increase in the urinary excretion of citrate (Pak, 1987; Sakhaee et al., 1991; Simpson, 1983), as well as a reduction in the urinary excretion of calcium (Lemann et al., 1989, 1991). Neither the citraturic effect of potassium citrate nor its hypocalciuric effect is greater than that of potassium bicarbonate, presumably because these salts induce similarly small increases in the plasma concentration of bicarbonate (Sakhaee et al., 1991).
One clinical trial tested the effects of potassium citrate in preventing recurrent kidney stones (Barcelo et al., 1993). In a double-blind, placebo-controlled trial of 57 patients (25 men and 32 women) with kidney stones and hypocitraturia conducted over 3 years, 1.2 to 2.3 g (30 to 60 mmol) of potassium citrate were administered in addition
to the usual diet. This regimen induced a highly significant reduction in the occurrence of kidney stones. The stone formation rate was significantly lower in the potassium citrate group than in the control group (0.1 stone/patient-year versus 1.1 stones/patient-year, p < 0.001). Total urinary excretion of potassium in the 18 subjects in the potassium citrate group averaged 105 mmol (4.1 g)/day after 36 months, compared with their baseline average of 61 mmol (2.4 g)/day (Barcelo et al., 1993). While not directly measured, it is thus assumed that 2.4 g (61 mmol) would have been present in the diets consumed, for a total intake with the supplement of around 3.6 to 4.7 g (90 to 120 mmol). Similar results have been recorded in uncontrolled studies of potassium citrate (Pak and Fuller, 1986; Pak et al., 1985, 1986; Preminger et al., 1985).
Overall, evidence from several prospective observational studies and one clinical trial supports the use of kidney stones as an outcome criterion to establish dietary adequacy of potassium. However, additional trials are clearly warranted.
Prevention of Impaired Pulmonary Function
Changes in the extracellular and intracellular concentration of electrolytes, including potassium, can influence the contraction and relaxation of bronchial smooth muscles (Souhrada and Souhrada, 1983, 1984). The limited studies on potassium intakes and pulmonary function in adults have yielded mixed results, with one study showing increased airway responsiveness to chemicals that induce constriction of the airways (e.g., histamine) with decreasing urinary potassium excretion (Tribe et al., 1994), while no relationship was found between potassium intake and bronchial responsiveness or respiratory symptoms in adults in a second study (Zoia et al., 1995).
As in adults, data on children are limited. Increased bronchial responsiveness with higher levels of potassium excretion was observed in the children studied (Pistelli et al., 1993), while in another study, low potassium intakes were associated in children with lower pulmonary function (e.g., expiratory volume, flow, and capacity) (Gilliland et al., 2002).
FACTORS AFFECTING POTASSIUM REQUIREMENTS
Climate and Physical Activity
Increased losses of potassium, primarily via sweat, can occur with heat exposure and exercise. Thus the requirement for potassium
will increase in both situations. The potassium concentration in sweat is approximately 4 to 5 mmol (0.2 g)/L. This concentration can increase up to 14 mmol (0.5 g)/L upon thermal exposure (Fukumoto et al., 1988). The sweat potassium concentration in heat-acclimatized individuals exposed to heat stress (40°C [104°F]) was approximately 5.4 mmol (0.2 g)/L, and total sweat loss was approximately 11 L/day, yielding a total potassium sweat loss of approximately 60 mmol (2.3 g)/day while consuming a diet providing 3.8 g (97 mmol)/day (Malhotra et al., 1976). When total estimated losses (sweat + urine) were summed (estimating sweat volume of 8 L/ day), the maximum loss was equivalent to 116 mmol (4.5 g)/day, which exceeded the potassium intake. Average sweat potassium daily losses of three men who were exposed to 37.8°C (100°F) heat for 7.5 hours per day for 16 days fell from 79 mmol (3.1 g) measured on day 2 to 14 mmol (0.55 g) by day 11. Hence, there was a decline in sweat loss over time, demonstrating that acclimation occurred and suggesting that potassium balance might be achieved over a short period of time.
The effects of 90 minutes of heat exposure (46°C [117°F]) without exercise during low (0.78 to 1.2 g [20 to 30 mmol]/day) and high (7.8 g [200 mmol]/day) sodium intakes on a number of parameters, including plasma potassium concentrations, were studied in eight healthy volunteers (20 to 28 years of age) (Follenius et al., 1979). There were significant changes in plasma potassium concentrations whether the subjects were on a low or high sodium diet. Plasma potassium concentrations ranged from about 3.97 to 4.15 mmol/L.
Seven healthy men, 18 to 23 years of age, were exposed to 40°C (104°F) heat in a controlled heat chamber and to exercise (Fukumoto et al., 1988). Sweat potassium concentration was 11.3 ± 3.1 mmol/L during the running exercise compared with 14.2 ± 4.6 mmol/L during thermal exposure (40°C). Conversely, sweat sodium losses were greater during the running exercise (123.1 ± 33.6 mmol/ L) compared with the heat exposure (84.3 ± 31.5 mmol/L).
Approximately 1.2 g (32 mmol)/day of potassium losses from sweat were observed during 6 hours of intermittent treadmill activity in a 40°C environment in 12 unacclimatized men (Armstrong et al., 1985). No significant changes in serum potassium concentrations in 10 experienced male marathon runners were seen after they completed three 20-mile runs under three different fluid replacement treatments (water, electrolyte-glucose solution, or a caffeine solution [5 mg of caffeine/kg of body weight]) (Wells et al., 1985). Pre-exercise serum potassium concentrations were about 4.4
mmol/L for all three trials, and averaged about 4.9 mmol/L for all three trials postexercise (Wells et al., 1985). Hence, under these three conditions, a potassium deficit was not evident.
The effects of two diets and exercise on potassium losses were evaluated in eight men during two 4-day exercise-dietary regimens (Costill et al., 1982). The control diet contained 3.1 g (80 mmol)/day of potassium, while the experimental diet contained only 0.98 g (25 mmol)/day of potassium. Urinary potassium excretion was significantly lower with the low potassium diet (2.6 versus 1.2 g [67 versus 31 mmol]/day) on day 5 of the study for each dietary period. Sweat potassium also significantly decreased from 12.3 to 10.9 mmol/day (measured on day 1 of the study for each dietary period). When fed 3.1 g (80 mmol)/day, the individuals were in balance, whereas a negative potassium balance was observed (−0.5 g [−14 mmol]/day) when fed the low potassium diet. Still, the authors did not detect diminished total body potassium content with a combination of heavy exercise and the lower potassium diet. However, this dietary and exercise regimen was brief; the long-term effects are uncertain.
Diuretics
Diuretics, which are often prescribed for the treatment of hypertension and congestive heart failure, result in increased urinary excretion of potassium and can lead to hypokalemia. However, the response is highly dose-dependent. Continual loss of potassium, if sustained, can result in clinical signs and symptoms of potassium deficiency, including arrhythmias (Robertson, 1984). For this reason, potassium supplements are often prescribed. In a recently completed trial (Furberg et al., 2002), approximately 8 percent of individuals assigned to the thiazide diuretic, chlorthalidone (12.5 to 25 mg/day), required a potassium supplement as treatment for diuretic-induced hypokalemia. Alternatively, potassium-sparing diuretics (e.g., amiloride, triamterene, and spirolactones) are frequently used concurrently with thiazide-type diuretics, which increase urinary potassium excretion. Triamterene has been shown to prevent diuretic-induced potassium loss comparable to 3.1 to 4.7 g (80 to 120 mmol)/day of supplemental potassium. While diuretics can cause hypokalemia, the amount of additional potassium required to prevent hypokalemia is uncertain and highly variable. Accordingly, in individuals taking diuretics, serum potassium should be regularly checked by their health care provider.
Forms of Potassium
The anions that accompany potassium have metabolic and physiologic properties that influence health. Plant foods rich in potassium, like fruits and nongrain vegetables, are also rich in bicarbonate-yielding precursors like citrate. In contrast, plants contain little chloride. In fact, chloride, like sodium, is ingested almost entirely as sodium chloride, primarily in processed foods and in discretionary use during cooking for seasoning. In the present Western diet, which dates from the Industrial Revolution some 200 years ago, the content of sodium and chloride is not only much higher than that of previous diets, but the contents of both potassium and bicarbonate-yielding substances are also much lower (Eaton et al., 1999; Morris RC et al., 2001; Sebastian et al., 2002). Thus most dietary deficiencies of potassium are accompanied by a relative lack of bicarbonate precursors. With the advent of the Western diet, both the potassium:sodium ratio and the bicarbonate:chloride ratio have become reversed.
Potassium is also consumed as potassium chloride as a food additive ingredient, a salt substitute, or as pills used therapeutically to treat diuretic-induced hypokalemia. While potassium chloride can correct hypokalemia and reduce blood pressure (see Tables 5-4 and 5-5), it cannot correct the low-grade metabolic acidosis induced by modern diets because chloride, in contrast to bicarbonate precursors, does not titrate diet-derived acids.
In healthy adults, potassium bicarbonate increased excretion of citrate and decreased calcium, whereas potassium chloride did not (Lemann et al., 1991; Sakhaee et al., 1991), suggesting that potassium bicarbonate or citrate is the form most conducive to a reduced risk of kidney stones. Because diet-derived acid can result in bone demineralization (Bushinsky and Frick, 2000; Lemann et al., 1966; New et al., 2000) as illustrated in Figure 5-2, the nonalkaline potassium chloride would not be expected to promote bone health as would be predicted with potassium bicarbonate (Lemann et al., 1991, 1993).
Interactions with Other Electrolytes
The effects of potassium intake depend, in part, on the level of sodium chloride intake (and vice versa). Previous sections have documented that potassium blunts the effect of sodium chloride on blood pressure—that an increased intake of potassium bicarbonate or other bicarbonate-yielding potassium salts mitigates salt sensitiv-
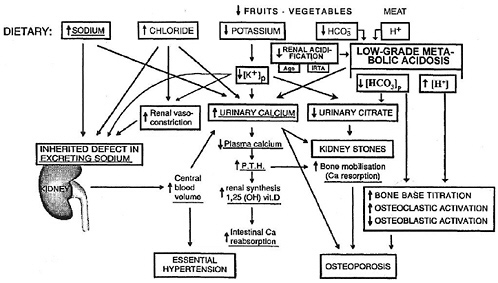
FIGURE 5-2 Hypothesized relationships between certain dietary inorganic electrolytes and bicarbonate, the kidney, essential hypertension, kidney stones, and osteoporosis: the modern diet’s excessive dietary sodium and chloride and deficient dietary potassium and bicarbonate precursors as determinants of both low-grade metabolic acidosis and hypercalciuria and thereby osteoporosis and kidney stones. As formulated, the acidosis can be amplified by impaired renal acidification that occurs as part of the “incomplete syndrome of renal tubular acidosis” (IRTA), an age-related decline in renal function (“age”), or both. The underlined dietary determinants and pathogenic events are those originally hypothesized and depicted. In this scheme, the word “osteoporosis” replaces the term “bone mineralization” specified in the depiction of the original formulation (Modified from MacGregor and Cappuccio [1993] by Morris RC et al. [2001]). Reprinted with permission from Morris RC et al. (2001). Copyright 2001 by Elsevier.
ity and lowers urinary calcium excretion. At higher levels of sodium chloride intake, potassium reduces blood pressure to a greater extent than at lower levels of sodium chloride intake (Whelton et al., 1997). While the relationship of kidney stones with urinary potassium excretion was weak and nonsignificant, the relationship of kidney stones to the urinary sodium: potassium ratio was direct and highly significant (Cirillo et al., 1994). Finally, the hypocalciuric effect of supplemental dietary potassium bicarbonate is also dampened by dietary sodium chloride (Sellmeyer et al., 2002).
Given the interrelatedness of sodium and potassium, the requirement for potassium may well depend on the level of dietary sodium, and the deleterious effects of sodium may be attenuated by higher dietary intakes of potassium. However, data are presently insufficient to set different potassium intake recommendations according to the level of sodium intake, and vice versa. Likewise, data are insufficient to set requirements based on the sodium: potassium ratio.
Race
As previously discussed, sodium chloride raises blood pressure to a greater extent in African-American men than in white men (Morris et al., 1999b; Weinberger, 1996) and the expression of salt sensitivity is modulated by dietary potassium (Morris et al., 1999b; Weinberger et al., 1982). In one trial (Morris et al., 1999b; Figure 5-1), salt sensitivity continued among some of the nonhypertensive African-American men who consumed a high-normal level of potassium (4.7 g [120 mmol]/day). In another study of African Americans, most of whom were nonhypertensive, a higher dietary intake of potassium (6.6 g [170 mmol]/day) as potassium bicarbonate abolished salt sensitivity (Schmidlin et al., 1999).
Available data also suggest that African Americans, compared with their white counterparts, are more sensitive to the blood pressure-reducing effects of increased dietary potassium. A significant reduction in systolic and diastolic blood pressure was seen when African-American individuals, most of whom were nonhypertensive, increased dietary potassium from a level of 1.3 to a level of 3.1 g (33 to 80 mmol)/day (Brancati et al., 1996). In another study that enrolled African-American hypertensive subjects, supplementation with 2.5 g (64 mmol)/day of potassium chloride significantly reduced systolic and diastolic blood pressure (Obel, 1989). However, neither of these trials enrolled white participants, so the extent of blood pressure reduction in African Americans from increased po-
tassium intake cannot be directly compared with that of non-African Americans. The Dietary Approaches to Stop Hypertension (DASH) trial tested the effects of a diet high in fruits and vegetables (and thus also higher levels of potassium, magnesium, and fiber) in both African Americans and non-African Americans (Appel et al., 1997; see Table 5-4). While blood pressure was reduced in both groups, only the reductions in African Americans achieved statistical significance. Such evidence must be interpreted cautiously because the diet emphasized several nutrients besides potassium. The potential for race or ethnicity to modify the effects of potassium on kidney stone formation and metabolic bone disease has not been well studied. Overall, there is insufficient evidence at this time to set different potassium recommendations based on race or ethnicity.
FINDINGS BY LIFE STAGE AND GENDER GROUP
Infants Ages 0 Through 12 Months
Evidence Considered in Setting the AI
The health effects of potassium intake in infants are uncertain. Thus recommended intakes of potassium are based on an Adequate Intake (AI) that reflects a calculated mean potassium intake of infants principally fed human milk, or a combination of human milk and complementary foods.
Ages 0 Through 6 Months. Using the method described in Chapter 2, the AI for potassium for infants ages 0 though 6 months is based on the average amount of potassium in human milk that is consumed. A mean intake of 0.39 g/day of potassium is estimated based on the average volume of milk intake of 0.78 L/day (see Chapter 2) and an average concentration of potassium in human milk of 0.5 g/L during the first 6 months of lactation (see Table 5-9). An AI of 0.4 g/day of potassium is set for infants 0 through 6 months of age, after rounding.
Ages 7 Through 12 Months. The potassium intake for older infants can be determined by estimating the intake from human milk (concentration × 0.6 L/day) and complementary foods (see Chapter 2). Potassium intake (n = 51) from complementary foods was estimated to average 0.44 g/day based on data from the Continuing Survey of Food Intakes of Individuals (CSFII) (see Appendix Table E-4). The average intake from human milk is approximately 0.3 g/
TABLE 5-9 Potassium Content in Human Milk
|
Reference |
Study |
Stage of Lactationa |
Potassium Concentration (g/L)b |
|
Gross et al., 1980 |
18 women |
1 mo pp |
0.59 |
|
Picciano et al., 1981 |
26 women |
1 mo pp 2 mo pp 3 mo pp |
0.46 0.42 0.41 |
|
Keenan et al., 1982 |
14 women |
3.5–6 wk pp 8.5–18 wk pp 20–32 wk pp |
0.59 0.54 0.52 |
|
Lemons et al., 1982 |
7 women |
1 mo pp 1.5 mo pp > 2 mo pp |
0.53 0.56 preterm 0.53 preterm |
|
Dewey and Lonnerdal, 1983 |
20 women |
1 mo pp 2 mo pp 3 mo pp 4 mo pp 5 mo pp 6 mo pp |
0.53 0.48 0.47 0.46 0.46 0.43 |
|
a pp = postpartum. b All values except those from mothers with preterm infants were averaged together to derive average potassium content of human milk = 0.5 g/L. |
|||
day (0.5 g/L × 0.6 L/day). Thus the total potassium intake is estimated to be 0.74 g/day (0.3 g/day + 0.44 g/day). Therefore, the AI is 0.7 g (18 mmol)/day of potassium, after rounding.
Potassium AI Summary, Ages 0 Through 12 Months
|
AI for Infants |
|
|
0–6 months |
0.4 g (10 mmol)/day of potassium |
|
7–12 months |
0.7 g (18 mmol)/day of potassium |
Children and Adolescents Ages 1 Through 18 Years
Evidence Considered in Setting the AI
Direct evidence on the potassium requirements of children is lacking. Blood pressure is one potential indicator; however, few studies
have assessed the relationship of potassium intake with blood pressure or its rise during childhood and adolescence. In one prospective observational study of 233 Dutch children aged 5 to 17 years, the rise in blood pressure over 7 years was significantly and inversely associated with dietary potassium intake and the dietary sodium:potassium ratio, as estimated from multiple overnight urine collections (Geleijnse et al., 1990). Two small trials tested the effects of potassium supplementation in children (Miller et al., 1987; Sinaiko et al., 1993). In both trials, potassium had no significant effect on blood pressure; however, statistical power may have been inadequate.
Because the conditions resulting from potassium deficiency (i.e., elevated blood pressure, bone demineralization, and kidney stones) are chronic and likely result from inadequate intake over an extended period of time, including childhood, it is appropriate to extrapolate recommended intakes of potassium in adults to children. However, the optimal approach to extrapolation is uncertain (e.g., adjustment based on weight, energy intake, or another method). Adjustment based on energy intake was deemed most appropriate because of concern that adjustment based on weight might lead to a relatively low and potentially inadequate intake of potassium. Furthermore, given the high energy intake of children relative to their weight and the potential for a high sodium intake as a result of their high energy intake, a greater intake of dietary potassium would be appropriate as a means to mitigate the adverse effects of sodium.
The AI is thus derived by extrapolating from the adult AI on the basis of the average of median energy intake levels. Based on data from CSFII, the median energy intake for 1- to 3- and 4- to 8-year-old children is 1,372 and 1,759 kcal/day, respectively (IOM, 2002). Median energy intakes for preadolescent (9 to 13 years of age) and adolescent (14 to 18) boys and girls range from 1,877 to 2,226 and 1,872 to 2,758 kcal/day, respectively.
Potassium AI Summary, Ages 1 Through 18 Years
|
AI for Children |
|
|
1–3 years |
3.0 g (77 mmol)/day of potassium |
|
4–8 years |
3.8 g (97 mmol)/day of potassium |
|
AI for Boys |
|
|
9–13 years |
4.5 g (115 mmol)/day of potassium |
|
14–18 years |
4.7 g (120 mmol)/day of potassium |
|
AI for Girls |
|
|
9–13 years |
4.5 g (115 mmol)/day of potassium |
|
14–18 years |
4.7 g (120 mmol)/day of potassium |
Adults Ages 19 Through 50 Years
Evidence Considered in Setting the AI
In clinical trials, potassium chloride has been shown to reduce blood pressure (Cappuccio and MacGregor, 1991; Geleijnse et al., 2003; Whelton et al., 1997); potassium bicarbonate has been shown to reduce the rise in blood pressure in response to increased sodium chloride intake (salt sensitivity) (Morris et al., 1999b); and potassium citrate has been shown to reduce the risk of kidney stones (Barcelo et al., 1993) (see earlier section, “Indicators Considered for Estimating the Requirement for Potassium”). Observational studies suggest that diets rich in potassium may also prevent bone disease and cardiovascular disease, particularly stroke.
Dose-response trials that test the effect of at least three levels of potassium are not available. While such studies would be useful in trying to estimate an average requirement (an EAR) based on blood pressure, substantial reductions in blood pressure in nonhypertensive individuals were observed at total dietary potassium intakes ranging from around 3.1 to 4.7 g (80 to 120 mmol)/day (Table 5-4). One dose-response trial tested the effect of potassium on salt sensitivity; in this study, an intake of 4.7 g (120 mmol)/day of potassium as potassium bicarbonate abolished severe sodium sensitivity in most nonhypertensive African-American men, a degree of salt sensitivity not observed in white men also tested (Morris et al., 1999b) (see Figure 5-1). In white men enrolled in this trial, salt sensitivity was reduced at a potassium intake of 2.7 g (70 mmol)/day compared with a potassium intake of 1.2 g (30 mmol)/day. Finally, three epidemiological studies suggest that increasing potassium intakes may reduce the risk of kidney stones (Table 5-8) (Curhan et al., 1993, 1997; Hirvonen et al., 1999). At the highest quintile of potassium intake in two studies conducted in the United States (4.0 and 4.7 g [102 and 120 mmol]/day), the lowest relative risk of kidney stones was observed (RR 0.49 and 0.65) (Curhan et al., 1993, 1997). In Finland where potassium intakes are greater than in the United States or Canada (Rose et al., 1988), at the second quartile of intake (4.6 g [118 mmol]/day), there was a reduced relative risk of kidney stones (0.76) that was not further reduced at higher potassium intakes (Hirvonen et al., 1999).
The trial data are nonetheless insufficient for setting an EAR, which would require data at multiple intake levels so that a level could be derived that would reduce blood pressure, mitigate salt sensitivity, or decrease the risk of kidney stones in 50 percent of individuals evaluated. Still, it is possible to set an AI at 4.7 g (120 mmol)/day using available data.
While the AI is set at the same intake level for men and women, it is recognized that differences in body size, body composition, and caloric intake may affect requirements. However, presently available data are insufficient to set gender-specific requirements. Since most of the studies used to derive the AI included both men and women and did not report findings on the basis of these characteristics, it is thus appropriate at this point to set the recommended intake at the same level of intake for both.
It should be recognized that the studies used to set the AI were conducted in the setting of a high sodium intake (2.7 to 5.7 g [117 to 13 mmol]/day), which greatly exceeds the AI of 1.5 g (65 mmol)/ day of sodium. While it is plausible that the AI for potassium might be lower in the setting of a reduced sodium intake, data are insufficient to set this level.
Summary. The AI for potassium is set at 4.7 g (120 mmol)/day based on blunting the severe salt sensitivity prevalent in African-American men and decreasing the risk of kidney stones, as demonstrated in a 3-year double-blind controlled study. Blood pressure studies in nonhypertensive individuals (Table 5-3) are supportive of this level of intake as a means to lower blood pressure. Epidemiological studies also suggest that higher levels of potassium intake from foods are associated with decreased bone loss. It is important to note that the beneficial effects of potassium in these studies appears to be mainly from the forms of potassium that are associated with bicarbonate precursors—the forms found naturally in foods such as fruits and vegetables.
Potassium AI Summary, Ages 19 Through 50 Years
|
AI for Men |
|
|
19–30 years |
4.7 g (120 mmol)/day of potassium |
|
31–50 years |
4.7 g (120 mmol)/day of potassium |
|
AI for Women |
|
|
19–30 years |
4.7 g (120 mmol)/day of potassium |
|
31–50 years |
4.7 g (120 mmol)/day of potassium |
Older Adults and the Elderly Ages 50+ Years
Evidence Considered in Setting the AI
Few humans studies are available that examine the effects of aging on renal and extrarenal adaptation to high potassium loads or dietary potassium deprivation. However, in two studies age-related decreases in both total body potassium and total exchangeable potassium, found in both men and women, were more evident in women (Davis et al., 1989; Rowe et al., 1992). Decreases in total body potassium may be due in part to the decrease in muscle mass that occurs with age (Rowe et al., 1992). In turn, the decrease in muscle mass with age may be, in part, a result of an inadequate intake of dietary potassium and its accompanying base (Frassetto et al., 1997).
In potassium adaptation studies in rats, the kaliuretic response to intravenous infusion of potassium chloride and the rise in plasma potassium have been shown not to be influenced by age (Friedman and Friedman, 1957; Rowe et al., 1992). However, when potassium intake was high, the efficiency of kaliuretic response to intravenous potassium chloride was impaired in the aging rat; a significantly greater plasma potassium concentration also occurred (Friedman and Friedman, 1957; Rowe et al., 1992). Following bilateral nephrectomy, the rise in plasma potassium concentration was also higher in the aged rats that were on a high potassium, but not normal potassium, intake. The renal and extrarenal impairment in potassium adaptation was associated with significant decreases in renal and colon Na+/K+-ATPase activity (Friedman and Friedman, 1957; Rowe et al., 1992). The applicablity of these findings to humans is still unclear.
Over the past several years there has been substantial attention paid to extrarenal potassium disposal. Beta-adrenergic mechanisms have been found to be responsible for potassium disposal during potassium infusion in healthy individuals across the adult age range (aged 23 to 85 years) (Rosa et al., 1980; Rowe et al., 1992). No observed effects of age on the extrarenal potassium disposal or the effect of β-adrenergic blockade was found. The effects of insulin concentration, β-adrenergic blockage, and age on potassium homeostasis during hyperinsulinemia was evaluated in 16 younger (22 to 37 years of age) and 10 older (63 to 77 years of age) men (Minaker and Rowe, 1982; Rowe et al., 1992). Increasing steady-state concentrations of insulin were associated with dose-dependent declines in plasma potassium concentration during the first hour of
insulin infusion, but during the second hour of insulin infusion, plasma potassium concentration continued to decline at the lowest insulin doses but began to rise at the highest insulin dose levels. This finding suggests the presence of a regulatory mechanism that influences insulin-mediated alterations in plasma potassium. The effect was not influenced by β-adrenergic blockade or aging (Minaker and Rowe, 1982; Rowe et al., 1992). These studies suggest that during aging, hormonal regulation of extrarenal potassium homeostasis remains normal.
Summary. In summary, for children, the AI was extrapolated from the adult AI based on energy intake. Older adults consume less energy than younger adults; however, because of the increased risk of elevated blood pressure with aging, the potassium need may be greater, and is thus not adjusted down for older adults. Because of the lack of evidence to suggest that the requirement for potassium differs in apparently normal, healthy older adults and the elderly compared with that of younger individuals, the AI is set at the same level of intake as for young adults.
Still, the AI does not apply to individuals with medical conditions or who are taking drugs that impair potassium excretion because of the potential for serious adverse effects on the heart from hyperkalemia (see later section, “Special Considerations”). Older individuals more commonly have such conditions or take such drugs and hence are at greater risk of hyperkalemia.
Potassium AI Summary, Ages 51+ Years
|
AI for Men |
|
|
51–70 years |
4.7 g (120 mmol) /day of potassium |
|
> 70 years |
4.7 g (120 mmol)/day of potassium |
|
AI for Women |
|
|
51–70 years |
4.7 g (120 mmol)/day of potassium |
|
> 70 years |
4.7 g (120 mmol)/day of potassium |
Pregnancy
Evidence Considered in Setting the AI
Accretion. There is little information on body potassium stores during pregnancy. The few available estimates range from cumula-
tive gains of 3.9 to 12.5 g (100 to 320 mmol), of which about 7.8 g (200 mmol) is destined for the products of conception (Forsum et al., 1988; Hytten and Leitch, 1971; Lindheimer and Katz, 2000). The latter value comes from a review of the literature by Hytten and Leitch (1971), including one serial study that measured total exchangeable potassium (MacGillivray and Buchanan, 1958). Additionally, one report provided estimates of potassium accretion as measured by the 40K naturally present in human tissues (Godfrey and Wordsworth, 1970). The accumulation at birth was 12 g of potassium (307 mmol), while at 1 month of age the total estimated potassium had decreased to 7 g (179 mmol) (Godfrey and Wordsworth, 1970).
A subsequent study, however, suggests that body potassium stores decrease early in gestation and then increase to only 3.9 g (100 mmol) above those present prior to conception (Forsum et al., 1988). Hormonal changes may affect potassium balance and deposition (Ehrlich and Lindheimer, 1972; Lindheimer and Katz, 1985). It has also been noted that pregnant women develop bicarbonaturia at substantially lower plasma bicarbonate levels than do nonpregnant women (Lindheimer and Katz, 2000).
Serum and Plasma Potassium Concentrations. Plasma and serum concentrations of potassium decrease about 0.2 to 0.3 mmol/L, which may not indicate hypokalemia until values decrease by 0.5 mmol, or to below 3 mmol/L. The reason for the decrement in circulating potassium concentrations during gestation is obscure, but could relate to the mild physiologic alkalemia of gestation in which blood concentrations of hydrogen ions have been shown to decrease about 2 to 4 nmol/L (Lindheimer and Katz, 1985).
Urinary Potassium Excretion. Of further interest and in striking contrast to nonpregnant women, pregnant women are resistant to the kaliuresis provoked by a combination of exogenous mineralocorticoids and a high sodium diet (Ehrlich and Lindheimer, 1972). This ability to conserve potassium in the face of high concentrations of potent mineralocorticoids, such as aldosterone or desoxycorticosterone, and the delivery to the distal nephron of substantial quantities of sodium, may be due to the increased concentrations of progesterone, also characteristic of gestation—a view supported by some (Ehrlich and Lindheimer, 1972; Lindheimer et al., 1987; Mujais et al., 1993), but not others (Brown et al., 1986). Of importance, this resistance to the kaliuretic effects may benefit women with certain potassium-losing diseases, such as primary aldoster-
onism and Bartter’s syndrome (August and Lindheimer, 1999; Lindheimer et al., 1987). On the other hand, if the kidneys of pregnant women resist kaliuretic stimuli, one might speculate that women with underlying disorders that impair their ability to excrete potassium may be jeopardized by gestation. In this respect, there have been isolated descriptions of abnormally high potassium concentrations in pregnant women with sickle cell anemia and normal serum creatinine concentrations (Lindheimer et al., 1987), and at least one instance where a woman believed to have renal tubular acidosis developed hyperkalemia when treated with a potassium sparing diuretic (Szwed and Clarke, 1982).
Blood Pressure. Intervention trials that tested the effects of potassium intake on blood pressure during pregnancy are lacking. In one observational study, maternal potassium intake was not associated with pregnancy-associated hypertension or pre-eclampsia (Morris CD et al., 2001). One observational study showed that maternal prenatal potassium intake was inversely related to the infant’s diastolic blood pressure at 6 and 12 months of age (McGarvey et al., 1991).
Summary. Overall, potassium accretion during pregnancy is very small and there is an absence of data to suggest that the requirement for potassium is different during pregnancy. Therefore, the AI is set at 4.7 g (120 mmol)/day, the same as for nonpregnant women.
Potassium AI Summary, Pregnancy
|
AI for Pregnancy |
|
|
14–18 years |
4.7 g (120 mmol)/day of potassium |
|
19–30 years |
4.7 g (120 mmol)/day of potassium |
|
31–50 years |
4.7 g (120 mmol)/day of potassium |
Lactation
Evidence Considered in Setting the AI
The potassium content of human milk averages around 0.5 g/L (13 mmol/L) during the first 6 months of lactation (see Table 5-9). Average milk production during the first 6 months of lactation is ≈ 0.78 L/d. Thus approximately 0.4 g (10 mmol)/day of potassium is needed for lactation during this period (0.5 g/L × 0.78 L/day =
0.4 g/day). In the absence of information to the contrary, it is assumed that the efficiency of conversion of dietary potassium to milk produced is almost 100 percent. Therefore, the AI for potassium during lactation is set at 5.1 g (130 mmol)/day (4.7 g + 0.4 g/day).
Potassium AI Summary, Lactation
|
14–18 years |
5.1 g (130 mmol)/day of potassium |
|
19–30 years |
5.1 g (130 mmol)/day of potassium |
|
31–50 years |
5.1 g (130 mmol)/day of potassium |
Special Considerations
Very Low Carbohydrate, High Protein Diets
Low-grade metabolic acidosis occurs with very low carbohydrate, high protein diets consumed by some individuals to promote and maintain weight loss. These diets, which may be adequate in potassium due to the high protein content, are inadequate as a source of alkali, because fruits are often excluded in these diets.
Over a 6-month period in which the metabolic consequences of such a diet were investigated in 51 overweight or obese volunteers, weight loss occurred, but the concomitant and intended ketosis led to an ongoing low-grade, metabolic acidosis, as judged by decreases in serum bicarbonate of 2 to 3 mmol/L (still in the normal range), as well as a persistent increase in urinary excretion of calcium of approximately 80 mg/day (Westman et al., 2002).
In a 6-week study of the metabolic effects of a low carbohydrate/high protein diet ingested by 10 adult subjects, a doubling of urinary net acid excretion was attended by a 50 percent increase in urinary excretion of calcium, which was not compensated by a commensurate increase in fractional intestinal calcium absorption (Reddy et al., 2002). Failure of intestinal compensation has been consistently demonstrated for acidosis-induced urine calcium losses (Breslau et al., 1988; Lemann et al., 1966).
Urinary excretion of citrate and serum osteocalcin also concurrently decreased with the increase in urinary excretion of calcium (Reddy et al., 2002). It was concluded that the diet delivered a marked acid load to the kidney, increased the risk of stone formation, led to negative calcium balance, and may have increased bone loss. Those diets that concomitantly restrict the intake of fruits like oranges, bananas, and grapes also restrict the intake of bicarbonate precursors like citrate, a restriction which would amplify the
acidogenic effect of the intended ketosis due to the lack of carbohydrate. There are no published studies of the long-term metabolic effects of this kind of diet in any group of individuals.
Replacement of Diuretic-Induced Potassium Losses
Substantial numbers of individuals receive treatment with diuretic therapies for medical conditions, primarily high blood pressure, but also congestive heart failure and chronic kidney disease. Thiazide diuretics (e.g., hydrochlorothiazide and chlorthalidone) and loop diuretics (e.g., furosemide) increase urinary potassium excretion, which in some instances leads to overt hypokalemia—that is, a serum potassium concentration of 3.5 mmol/L or less. Accordingly, many individuals on diuretic therapy are given a potassium supplement. In a recently completed trial (Furberg et al., 2002), approximately 8 percent of individuals assigned to low-dose chlorthalidone (12.5 to 25 mg/day) required a potassium supplement. Because of diuretic-induced urinary potassium losses, it is plausible that individuals on diuretic therapy should have an AI greater than 4.7 g (120 mmol)/day. However, available evidence is insufficient to confirm the need for a higher AI in such individuals.
Predisposition to Hyperkalemia
Several relatively common clinical conditions can predispose individuals to hyperkalemia, even at levels of potassium intake that are below the AI. The most common of these conditions are chronic kidney disease, heart failure, and type 1 diabetes, each of which can impair renal excretion of potassium. Angiotensin converting enzyme (ACE) inhibitor drug therapy, which is a recommended therapy for each of these conditions, increases the risk of hyperkalemia (Schoolwerth et al., 2001).
The risk for hyperkalemia during ACE inhibitor therapy increases as kidney function declines. The conclusion from a case series of 33 hypertensive patients in which serum potassium levels were measured before and after ACE inhibitor therapy was that serum potassium levels rarely rose to greater than 5.0 mmol/dL unless the estimated glomerular filtration rate (GFR) was less than 40 mL/minute (Textor et al., 1982). In this study, patients consumed between 2.7 and 3.1 g (70 and 80 mmol)/day of potassium. Whether a higher dietary intake of potassium would precipitate hyperkalemia is uncertain. In a case-control study of 1,818 medical outpatients on ACE inhibitor therapy, severe hyperkalemia (defined as serum potassium
> 6.0 mmol/day) was uncommon in patients less than 70 years old with normal renal function (Reardon and Macpherson, 1998); however, data on dietary potassium intake was not collected in this study. Since the 95th percentile estimates of potassium intake for men and women in the United States range from 4.3 to 5.1 g and 2.9 to 3.7 g/day, respectively (Appendix Table D-5), it can be assumed that many of these outpatients had intakes below the AI of 4.7 g (120 mmol)/day.
In case reports additional factors appear to precipitate hyperkalemia in ACE inhibitor-treated patients. These factors include use of potassium supplements, potassium-sparing diuretics, nonsteroidal anti-inflammatory agents, cyclo-oxygenase-2 (COX-2) inhibitors, and heparin (see Box 5-1). Although most case reports relating hyperkalemia and ACE inhibitor treatment occurred in individuals with diabetes, chronic kidney disease, and/or heart failure, there have been a few case reports in other settings. Two cases of hyperkalemia in older men were reported to be due to the use of a potassium-containing salt substitute while taking ACE inhibitor therapy (Ray et al., 1999). One case report documented fatal hyperkalemia in a 77-year-old woman after addition of COX-2 inhibitor therapy to a medical regimen that included an ACE inhibitor and a diet that included a banana each day (Hay et al., 2002). Her serum creatinine had been 0.9 mg/dL, which in retrospect might reflect subtle evidence of chronic kidney disease (Hay et al., 2002). This case illustrates the difficulty of using serum creatinine levels to diagnose early chronic kidney disease. Among older individuals, women who are non-African American often have serum creatinine values that appear to be “normal” (0.9 to 1.2 mg/dL) despite an underlying reduction in kidney function (Culleton et al., 1999).
Overall, because of the concern for hyperkalemia and resultant arrhythmias that might be life-threatening, the proposed AI should not be applied to individuals with chronic kidney disease, heart failure, or type 1 diabetes, especially those who concomitantly use ACE inhibitor therapy. Among otherwise healthy individuals with hypertension on ACE inhibitor therapy, the AI should apply as long as renal function is unimpaired.
INTAKE OF POTASSIUM
Sources
Good sources of potassium, as well as bicarbonate precursors, are fruits and vegetables (see Table 5-10). Foods that contain relatively
|
BOX 5-1 Clinical Circumstances That May Result in Hyperkalemia
Clinical conditions that commonly occur together and that amplify their hyperkalemic effects
SOURCE: Fisch et al. (1966); Gennari and Segal (2002); Kamel et al. (1996); Oster et al. (1995); Schoolwerth et al. (2001); Tannen (1986); Textor et al. (1982). |
TABLE 5-10 Comparative Amounts of Approximate Potassium Content in Various Food Groups
|
Food Group |
Potassium mg (mmol)/100 kcal |
Examples |
|
Leafy greens |
1,500 (38) |
Spinach, lettuce, romaine, cabbage, kale |
|
Fruit of vine-based plants |
1,200 (30) |
Tomatoes, cucumbers, zucchini, eggplant, pumpkin |
|
Root vegetables |
975 (25) |
Carrots, radishes, turnips, rutabaga, onions |
|
Beans and peas |
500 (13) |
Kidney beans, peas, green beans, chick peas, soybeans |
|
Tree fruits |
430 (11) |
Apples, oranges, bananas, apricots, grapes, strawberries |
|
Tubers |
400 (10) |
Potatoes, sweet potatoes, yams |
|
Milk and yogurt |
350 (9) |
Skimmed milk, whole milk, yogurt |
|
Meats |
230 (6) |
Beef, lamb, pork, poultry, fish, rabbit |
|
Nuts |
110 (3) |
Walnuts, cashews, almonds, brazil, hazelnuts |
|
Eggs |
90 (2.3) |
Chicken eggs |
|
Cereal grains |
90 (2.3) |
Wheat, rice, oats, rye |
|
Cheese |
150 (1.1) |
Edam, stilton, cottage, cheddar |
high amounts of potassium include spinach (≈ 840 mg [22 mmol] per cup), cantaloupe (315 mg [8 mmol] per 1/6 large), dry roasted almonds (210 [5 mmol] per oz.), brussels sprouts (250 mg [6 mmol] per 1/2 cup), mushrooms (550 mg [14 mmol] per 1 cup), bananas (470 mg [12 mmol] per 1 medium), oranges (200 mg [5 mmol] per 1 small), grapefruit (230 mg [6 mmol] per 1/2 large), and potatoes (600 mg [15 mmol] per potato without skin). The Adequate Intake (AI) for adults of 4.7 g (120 mmol)/day of potassium can be achieved by consuming a diet that contains generous amounts of potassium-rich fruits and vegetables.
While meat, milk, and cereal products contain potassium, their content of bicarbonate precursors does not sufficiently balance the amount of acid-forming precursors, such as sulfur amino acids, found in higher protein foods (Lemann et al., 2003). Tables of citrate and bicarbonate content of foods are lacking, making it difficult to estimate the amount consumed of these other food components.
On a calorie basis, the comparative amounts of potassium in various food groups, expressed in mg/100 kcal, are shown in Table 5-10. As for many other nutrients, from a nutrient density perspec
tive, the richest sources of potassium are leafy green vegetables, fruit from vines, and root vegetables.
Salt substitutes currently available in the marketplace range from 440 mg to 2,800 mg (11 to 72 mmol)/tsp of potassium, all as potassium chloride (Pennington, 1998; Riccardella and Dwyer, 1985). In the Third National Health and Nutrition Examination Survey (NHANES III), less than 10 percent of respondents reported that they used a reduced-sodium salt or a salt substitute (Loria et al., 2001). The maximum amount of potassium in over-the-counter supplements is 0.099 g (2.5 mmol) (Medical Economics, 2001).
Table 5-11 provides an estimate of the potassium intake from foods when consuming approximately 2,200 kcal/day, the combined average energy intake of young men and women (IOM, 2002), while meeting recommended intakes for other nutrients. This table illustrates that potassium intake at levels in the range of the AI (4.7 g/day or 120 mmol/day) can be achieved by consuming a diet rich in fruits and vegetables.
Intake
Based on intake data from the NHANES III (Appendix Table D-5), the median intake of potassium in the United States ranged from 2.8 to 3.3 g (72 to 84 mmol)/day for men and 2.2 to 2.4 g (56 to 61 mmol)/day for women. The median potassium intakes of white respondents exceeded that of African-American respondents. The median intakes of potassium by adults obtained from Canadian surveys conducted between 1990 and 1999 in 10 provinces ranged from 3.2 to 3.4 g (82 to 87 mmol)/day for men and 2.4 to 2.6 g (62 to 67 mmol)/day for women (Appendix Table F-2), indicating that on average, Canadian intake of potassium was somewhat greater than that of adults in the United States. The percentage of men and women who consumed equal to or greater than the AI was less than 10 and 1 percent, respectively, in the United States.
These dietary intake surveys do not include estimates of the usage of salt substitutes. Less than 10 percent of those surveyed in NHANES III reported using salt substitutes or a reduced-sodium salt (Loria et al., 2001). No other data were found that estimate the intake of potassium from various salt substitutes on the market.
While there are very few data regarding potassium intake during pregnancy, the Calcium for Prevention of Preeclampsia trial (CPEP) estimated intake using dietary recalls in 4,589 participants at recruitment, during weeks 13 to 20 of gestation (Morris CD et al., 2001). Daily potassium intake of the 3,125 women who remained
TABLE 5-11 Daily Potassium Intake from a Diet Providing 2,200 kcal
|
Meal |
Food/Beverage Consumed |
Calories (kcal) |
Potassium (mg) |
|
Breakfast |
Shredded wheat miniatures (1 cup) |
183 |
248 |
|
|
Cantaloupe, cubed (1/2 cup) |
27 |
214 |
|
Milk, 1% (8 oz) |
102 |
290 |
|
|
Orange juice (6 oz) |
82 |
355 |
|
|
White toast (1 slice) with unsalted margarine vegetable oil spread (1 tsp) |
89 |
30 |
|
|
Coffee, black, unsweetened (12 oz) |
13 |
171 |
|
|
Total for meal |
496 |
1,278 |
|
|
Snack |
Banana (1 medium) |
105 |
422 |
|
|
Water (1 cup) |
0 |
0 |
|
Total for meal |
105 |
422 |
|
|
Lunch |
Sandwich with turkey (2 oz), swiss cheese (1 oz), lettuce (2 leaves), tomato (1/4″ slice), mayonnaise (1 tbsp) and whole wheat bread (2 slices) |
395 |
499 |
|
|
Baby carrots (8) |
28 |
190 |
|
Fig bar cookies (2) |
111 |
66 |
|
|
Iced tea, brewed, decaffeinated (16 oz) |
5 |
176 |
|
|
Total for meal |
539 |
857 |
|
|
Snack |
Almonds, dry roasted, unsalted (1/4 cup) |
206 |
257 |
|
|
Raisins (1/4 cup) |
108 |
272 |
|
Milk, 1% (8 oz) |
102 |
290 |
|
|
Water (12 oz) |
0 |
0 |
|
|
Total for Meal |
416 |
819 |
|
|
Dinner |
Baked salmon (3 oz) |
151 |
257 |
|
|
Long-grain brown rice (1/2 cup cooked) |
108 |
42 |
|
Tossed salad (1 1/2 cups) with safflower oil and vinegar dressing (2 tbsp) |
155 |
371 |
|
|
Asparagus (6 spears) |
20 |
202 |
|
|
Wheat roll, (1 medium) with unsalted margarine vegetable oil spread (1 tsp) |
101 |
34 |
|
|
Angel food cake (1 slice) with sliced strawberries (1/2 cup) and whipped cream topping (2 tbsp) |
114 |
162 |
|
|
Iced tea, brewed, decaffeinated (16 oz) |
5 |
176 |
|
|
Coffee, black, unsweetened, decaffeinated (8 oz) |
9 |
114 |
|
|
Total for meal |
663 |
1,492 |
nonhypertensive throughout pregnancy averaged 3.1 g (79 mmol)/day. While this population group had over-representation by African-American and Hispanic pregnant women, in two other studies in which potassium excretion was measured serially throughout gestation, 24-hour urinary excretion averaged 2.0 to 2.3 g (50 to 60 mmol)/day of potassium (Brown and et al., 1986; Wilson et al., 1980). While there were few (n = 83) pregnant women in NHANES III, and even fewer (n = 19) lactating women (Appendix Table D-6), their intake of potassium intake was substantially greater than their nonpregnant counterparts, with median intakes of 2.8 g (72 mmol)/day and 3.8 g (97 mmol)/day, respectively.
ADVERSE EFFECTS OF OVERCONSUMPTION
Hazard Identification
Gastrointestinal Discomfort
Gastrointestinal discomfort has been reported with some forms of potassium supplements, but not with potassium from diet. When healthy individuals were provided 2.3 g (60 mmol)/day of potassium chloride for 18 days in the form of a wax/polymer matrix tablet, a powder-in-liquid formulation, or a microencapsulated gelatin capsule, there was a significant increase in gastrointestinal distress reported for the wax/polymer matrix as compared with the other two (Sinar et al., 1986). Gastrointestinal discomfort was also
reported by some patients receiving 0.8 to 1.6 g (20 to 40 mmol)/ day of potassium chloride either as a wax-matrix tablet (5 of the 17 receiving the treatment) or as a microencapsulated tablet (6 of the 17) (Pietro and Davidson, 1990).
Ulceration of gastrointestinal tract mucosa and perforation of the small bowel have been reported in patients using various potassium chloride supplements (Lambert and Newman, 1980; Leijonmarck and Raf, 1985). In a placebo-controlled trial that provided 2.3 g (60 mmol)/day of microencapsulated potassium to 175 prehypertensive subjects for 6 months, high pill compliance but no serious gastrointestinal effect was reported (Whelton et al., 1995). Overall, the specific product/vehicle appears to be a critical determinant of the risk of gastrointestinal side effects from supplemental potassium.
Arrhythmia from Hyperkalemia
Cardiac arrhythmias from hyperkalemia are the most serious consequence of excessive potassium intake. The typical sequence of findings is hyperkalemia, followed by conduction abnormalities on electrocardiogram (ECG) and then cardiac arrhythmias, which can be life-threatening. Such consequences result from either a high plasma concentration of potassium or from rapid and extreme changes in its concentration (Kallen et al., 1976). At typical dietary intakes of potassium, the normal range of plasma concentration of potassium is 3.5 to 5.0 mmol/L. The actual level at which hyperkalemia increases the risk of serious arrhythmias is uncertain, but is likely at a level greater than 5.5 mmol/L.
Acute toxicity from accidental or intentional consumption of large quantities of potassium chloride or potassium-containing salt substitutes by apparently healthy individuals has been reported (Kallen et al., 1976; Su et al., 2001; Wetli and Davis, 1978). However, such evidence of acute toxicity is of limited value in assessing the potential hazards from chronic ingestion of high levels of potassium. In clinical trials that assessed the effects of potassium supplementation as high as 15.6 g (400 mmol)/day over a period of at least 5 days in apparently healthy individuals, plasma levels of potassium increased but remained within the normal range (see Table 5-12). Importantly, there were no instances of hyperkalemia reported in these studies.
However, in individuals whose urinary potassium excretion is impaired by a medical condition, drug therapy, or both, instances of life-threatening hyperkalemia have been reported. There have been several case reports of hyperkalemia in individuals who reported
use of a potassium-containing salt substitute while under treatment for chronic diseases (Haddad and Strong, 1975; Ray et al., 1999; Snyder et al., 1975) (see Table 5-13). These individuals had some type of heart or renal disease and therefore were taking other medications, including ACE inhibitors. The potassium-containing salt substitute might have been prescribed to reduce sodium chloride intake, to replace diuretic-induced potassium losses, or both. Such patients are at risk both for hypokalemia and hyperkalemia and therefore require close medical supervision.
Dose-Response Assessment
In otherwise healthy individuals (that is, individuals without impaired urinary potassium excretion from a medical condition or drug therapy), there have been no reports of hyperkalemia resulting from acute or chronic ingestion of potassium naturally occurring in food. Hyperkalemia might theoretically occur if the capacity of the normal kidney to excrete a potassium load is exceeded. The maximum excretion rate of normal kidneys after adaptation to high levels of intake has been estimated to be approximately 31.3 g (800 mmol)/day for adults (Berliner, 1961), a level that would be difficult to achieve from food alone. Gastrointestinal discomfort has been reported with some forms of potassium supplements, but not with potassium from foods.
UL Summary
Adults. In otherwise healthy individuals (i.e., individuals without impaired urinary potassium excretion from a medical condition or drug therapy), there is no evidence that a high level of potassium from foods has adverse effects. Therefore, a Tolerable Upper Intake Level (UL) for potassium from foods is not set for healthy adults.
In contrast, supplemental potassium can lead to acute toxicity in healthy individuals. Also, chronic consumption of a high level of potassium can lead to hyperkalemia in individuals with impaired urinary potassium excretion (see later section, “Special Considerations”). Hence, supplemental potassium should only be provided under medical supervision because of the well-documented potential for toxicity.
Infants and Children. Almost all of the potassium that appears in urine is secreted by the last half of the distal tubule (Schultze, 1973).
TABLE 5-12 Effects of Chronic Intake of High Levels of Potassium
|
Urinary Potassium (mmol/24 h) |
Effectsa |
|
50 ± 12 233 ± 45 |
Serum K within normal limits but 10% higher (p < 0.05) with K load |
|
≈ 60 |
↑ Plasma K (p < 0.01) (from 4.3 to 4.6 mmol/L) ↓ SBP (p < 0.01); ↓ DBP (p < 0.01) |
|
≈ 220 |
↑ Plasma renin in 13 of 16 subjects; no adverse effects identified |
|
82 |
With high K diet, ↑ plasma K (p < 0.05); plasma renin and aldosterone, while increased significantly (p < 0.01) after |
|
385 |
2 d, were back to baseline levels by 20 d |
|
50 119 |
Serum K was within normal limits |
|
|
Fasting plasma aldosterone levels ↑ with increased K regardless of Na intake; no other effects noted |
|
59 |
Serum K was 10% higher (p < 0.05) on high K diet, but still within normal range |
|
161 |
No other changes noted |
|
58 139 |
4 patients withdrew from the study: 1 due to diarrhea from the K supplement; 1 due to ↑ BP when receiving placebo; 2 due to taste of K supplement |
TABLE 5-13 Studies and Case Reports of Adverse Effects Due to Chronic Intake of High Levels of Potassium
|
Case Report |
Description of Patient |
|
Haddad and Strong, 1975 |
39-yr-old woman, Lupus Erythematosus, w/chronic renal failure (creatinine clearance = 30 mL/min) |
|
Snyder et al., 1975 |
75-yr-old woman, history of myocardial infarction, on a low sodium diet |
|
Ray et al., 1999 |
67-yr-old man; hypertensive, previous coronary artery bypass surgery and left ventricular dysfunction |
|
Ray et al., 1999 |
64-yr-old man; 24-yr history of diabetes mellitus and recent systolic hypertension, retinopathy, and renal impairment; on a low sodium diet |
While an infant’s renal secreting capacity is initially less than adults, renal function rapidly reaches the normal adult level in early childhood, so little concern exists for consumption of high levels of potassium from foods. Because the renal secreting ability of normal infants is not fully developed, potassium intake should be limited to that contained in formula and complementary foods.
Pregnancy. Other than occasional gastrointestinal discomfort as noted above from the use of certain forms of supplemental potassium, adverse effects from high intakes of potassium have not been noted in apparently healthy individuals, which would include pregnant women who are not identified as having hypertension or preeclampsia. Therefore, a UL for potassium is not set for healthy women during normal pregnancy.
Lactation. As with other adults, there is little reason to restrict the potassium intake of healthy lactating women due solely to lac-
|
Potassium Amount Ingested |
Adverse Effect |
Medications |
|
Ad lib use of salt substitute |
Serum potassium = 7.4 mmol/L |
Spironolactone, a potassium-sparing diuretic |
|
Ad lib use of a “lite” salt substitute |
Edema, shortness of breath, right-sided and left-sided congestive heart failure |
None reported |
|
Estimate of 2.7 g (70 mmol)/d of potassium as “LoSalt” for previous week; diet high in fruits and vegetables |
Serum potassium = 7.6 mmol/L; loss of consciousness, dizziness, intermittent vomiting |
Atenolol, furosemide, aspirin, and lisinopril (an angiotensin converting enzyme inhibitor) |
|
Estimate of 5.2 g (133 mmol)/d of potassium as “Lo Salt” previously; diet estimated to also provide 2.7 g (70 mmol)/d |
Serum potassium = 7 mmol/L |
Enalapril (an angiotensin converting enzyme inhibitor) |
tation. Therefore, a UL is not set for healthy women during this period.
Special Considerations
Problem Pregnancy. It is suggested that high potassium levels be consumed with care in women with problem pregnancies, such as preeclampsia. High concentrations of the antikaliuretic hormone progesterone (which circulate during gestation) may make women with undetected renal dysfunction or with a sudden decrease in glomerular filtration rate (as occurs with preeclampsia) more likely to develop hyperkalemia when potassium intake is high.
Other Situations. Clinical settings in which high intakes of potassium could pose a serious risk include type 1 diabetes, chronic renal insufficiency (e.g., GFR < 40 mL/minute), end-stage renal disease, severe heart failure, and adrenal insufficiency (see Box 5-1). In these
situations, medical supervision is typically provided, including individualized diet instruction (IOM, 2000), and a potassium intake below the AI is often appropriate. For individuals with these diseases or clinical conditions, salt substitutes (containing potassium chloride) should be used cautiously. While adverse events following high potassium consumption usually do not occur in these special populations, there are case studies cited in the literature indicating that these groups are vulnerable (see Table 5-13).
RESEARCH RECOMMENDATIONS
-
Dose-response trials testing the effects of different levels of potassium intake on blood pressure at different levels of sodium intake.
-
Additional dose-response trials evaluating the effect of potassium on salt sensitivity in subgroups of the population that are salt sensitive (e.g., African Americans, older persons, and persons with hypertension, chronic kidney disease, or diabetes).
-
Randomized clinical trials to compare the effect of different potassium salts on blood pressure and other outcomes at different levels of sodium intake.
-
Development of improved measurements and instruments that assess total potassium intake and total body potassium.
-
Trials that test the efficacy of increased potassium intake on preventing stroke.
-
Trials that test the main and interactive effects of potassium and sodium intake on bone mineral density and, if feasible, bone fractures.
-
Trials testing the main and interactive effects of sodium and potassium intake on the risk of kidney stones.
-
Studies to assess the main and interactive effects of potassium and sodium intake on glucose intolerance and insulin resistance.
-
Studies on the role of potassium intake during infancy and childhood on blood pressure later in life.
-
Potassium balance studies during pregnancy.
-
Better estimates of potassium losses in sweat with various dietary, activity, and environmental conditions in diverse populations.
-
Development of food tables for citrate and bicarbonate.
-
Studies on the effects of chronic, low-grade metabolic acidosis on clinical outcomes, particularly kidney stones and osteoporosis.
-
Trials to assess the effects of high potassium intake on serum potassium levels and blood pressure in the setting of early stages of renal insufficiency (with and without ACE inhibitor therapy).
REFERENCES
Agarwal R, Afzalpurkur R, Fordtran JS. 1994. Pathophysiology of potassium absorption and secretion by the human intestine. Gastroenterol 107:548-571.
Alon US, Berenbom A. 2000. Idiopathic hypercalciuria of childhood: 4- to 11-year outcome. Pediatric Nephrol 14:1011–1015.
Alpern RJ. 1995. Trade-offs in the adaptation to acidosis. Kidney Int 47:1205–1215.
Appel LJ, Moore TJ, Obarzanek E, Vollmer WM, Svetkey LP, Sacks FM, Bray GA, Vogt TM, Cutler JA, Windhauser MM, Lin PH, Karanja N. 1997. A clinical trial of the effects of dietary patterns on blood pressure. N Engl J Med 336:1117–1124.
Armstrong LE, Hubbard RW, Szlyk PC, Matthew WT, Sils IV. 1985. Voluntary dehydration and electrolyte losses during prolonged exercise in the heat. Aviat Space Environ Med 56:765–770.
Ascherio A, Rimm EB, Giovannucci EL, Colditz GA, Rosner B, Willet WC, Sacks F, Stampfer MJ. 1992. A prospective study of nutritional factors and hypertension among US men. Circulation 86:1475–1484.
Ascherio A, Rimm EB, Hernan MA, Giovannucci EL, Kawachi I, Stampfer MJ, Willett WC. 1998. Intake of potassium, magnesium, calcium, and fiber and risk of stroke among US men. Circulation 98:1198–1204.
August P, Lindheimer MD. 1999. Chronic hypertension and pregnancy. In: Lindheimer MD, Roberts JM, Cunningham FG, eds. Hypertensive Disorders in Pregnancy, 2nd ed. Stamford, CT: Appleton & Lange. Pp. 605–633.
Barcelo P, Wuhl O, Servitge E, Rousaud A, Pak CY. 1993. Randomized double-blind study of potassium citrate in idiopathic hypocitraturic calcium nephrolithiasis. J Urol 150:1761–1764.
Barden AE, Vandongen R, Beilin LJ, Margetts B, Rogers P. 1986. Potassium supplementation does not lower blood pressure in normotensive women. J Hypertens 4:339–343.
Barden AE, Beilin LJ, Vandongen R, Puddey IB. 1991. A double-blind placebo-controlled trial of the effects of short-term potassium supplementation on blood pressure and atrial natriuretic peptide in normotensive women. Am J Hypertens 4:206–213.
Barzel US. 1995. The skeleton as an ion exchange system: Implications for the role of acid-base imbalance in the genesis of osteoporosis. J Bone Miner Res 10:1431–1436.
Barzel US, Jowsey J. 1969. The effects of chronic acid and alkali administration on bone turnover in adult rats. Clin Sci 36:517–524.
Bazzano LA, He J, Ogden LG, Loria C, Vupputuri S, Myers L, Whelton PK. 2001. Dietary potassium intake and risk of stroke in US men and women. Stroke 32:1473–1480.
Berenson GS, Voors AW, Dalferes ER, Webber LS, Shuler SE. 1979. Creatinine clearance, electrolytes, and plasma renin activity related to the blood pressure of white and black children—The Bogalusa Heart Study. J Lab Clin Med 93:535–548.
Berliner RW. 1961. Renal mechanisms for potassium excretion. In: Harvey Lectures Series 55. New York: Academic Press. Pp. 141–171.
Bisaz S, Feliz R, Neuman WF, Fleisch H. 1978. Quantitative determination of inhibitors of calcium phosphate precipitation in whole urine. Miner Electrolyte Metab 1:74–83.
Brancati FL, Appel LJ, Seidler AJ, Whelton PK. 1996. Effect of potassium supplementation on blood pressure in African Americans on a low-potassium diet. A
randomized, double-blind, placebo-controlled trial. Arch Intern Med 156:61–67.
Brandis M, Keyes J, Windhager EE. 1972. Potassium-induced inhibition of proximal tubular fluid reabsorption in rats. Am J Physiol 222:421–427.
Breslau NA, Brinkley L, Hill KD, Pak CYC. 1988. Relationship of animal protein-rich diet to kidney stone formation and calcium metabolism. J Clin Endocrinol Metab 66:140–146.
Brown MA, Sinosich MJ, Saunders DM, Gallery EDM. 1986. Potassium regulation and progesterone-aldosterone interrelationships in human pregnanacy: A prospective study. Am J Obstet Gynecol 155:349–353.
Brunette MG, Mailloux J, Lajeunesse D. 1992. Calcium transport through the luminal membrane of the distal tubule. I. Interrelationship with sodium. Kidney Int 41:281–288.
Bruun NE, Skott P, Damkjaer Nielsen M, Rasmussen S, Schutten HJ, Leth A, Pedersen EB, Giese J. 1990. Normal renal tubular response to changes of sodium intake in hypertensive man. J Hypertens 8:219–227.
Bulpitt CJ, Ferrier G, Lewis PJ, Daymond M, Bulpitt PF, Dollery CT. 1985. Potassium supplementation fails to lower blood pressure in hypertensive patients receiving a potassium lowering diuretic. Ann Clin Res 17:126–130.
Bushinsky DA. 1998. Acid-base imbalance and the skeleton. In: Burckhardt PB, Dawson-Hughes B, Heaney RP, eds. Nutritional Aspects of Osteoporosis. New York: Springer-Verlag. Pp. 208–217.
Bushinsky DA, Frick KK. 2000. The effects of acid on bone. Curr Opin Nephrol Hypertens 9:369–379.
Cappuccio FP, MacGregor GA. 1991. Does potassium supplementation lower blood pressure? A meta-analysis of published trials. J Hypertens 9:465–473.
Castenmiller JJM, Mensink RP, van der Heijden L, Kouwenhoven T, Hautvast J, de Leeuw PW, Schaafsma G. 1985. The effect of dietary sodium on urinary calcium and potassium excretion in normotensive men with different calcium intakes. Am J Clin Nutr 41:52–60.
Chalmers J, Morgan T, Doyle A, Dickson B, Hopper J, Mathews J, Matthews G, Moulds R, Myers J, Nowson C, Scoggins B, Stebbing M. 1986. Australian National Health and Medical Research Council dietary salt study in mild hypertension. J Hypertens 4:S629–S637.
Cirillo M, Laurenzi M, Panarelli W, Stamler J. 1994. Urinary sodium to potassium ratio and urinary stone disease. Kidney Int 46:1133–1139.
Clinkingbeard C, Lawrence D, Shenker Y. 1991. Effect of varying potassium intake on atrial natriuretic hormone-induced suppression of aldosterone. Am J Hypertens 4:456–459.
Coe FL, Parks JH, Asplin JR. 1992. The pathogenesis and treatment of kidney stones. N Engl J Med 327:1141–1152.
Consolazio CF, Matoushi LO, Nelsom RS, Harding RS, Canham JR. 1963. Excretion of sodium, potassium, magnesium and iron in human sweat and the relation of each to balance and requirements. J Nutr 79:407–415.
Coruzzi P, Brambilla L, Brambilla V, Gualerzi M, Rossi M, Parati G, Di Rienzo M, Tadonio J, Novarini A. 2001. Potassium depletion and salt sensitivity in essential hypertension. J Clin Endocrinol Metab 86:2857–2862.
Costill DL, Cote R, Fink W. 1982. Dietary potassium and heavy exercise: Effects of muscle water and electrolyte. Am J Clin Nutr 36:266–275.
Culleton BF, Larson MG, Evans JC, Wilson PWF, Barrett BJ, Parfrey P, Levy D. 1999. Prevalence and correlates of elevated serum creatinine levels. Arch Intern Med 159:1785–1790.
Cummings JH, Hill MJ, Jenkins DJA, Pearson JR, Wiggins HS. 1976. Changes in fecal composition and colonic function due to cereal fiber. Am J Clin Nutr 29:1468–1473.
Curhan GC, Willett WC, Rimm ER, Stampfer MJ. 1993. A prospective study of dietary calcium and other nutrients and the risk of symptomatic kidney stones. N Engl J Med 328:833–838.
Curhan GC, Willett WC, Speizer FE, Spiegelman D, Stampfer MJ. 1997. Comparison of dietary calcium with supplemental calcium and other nutrients as factors affecting the risk of kidney stones in women. Ann Intern Med 126:497–504.
Cushman WC, Langford HG. 1988. Randomized controlled trial of potassium chloride versus placebo in mildly hypertensive blacks and whites. Circulation 78:II-370.
Dai WS, Kuller LH, Miller G. 1984. Arterial blood pressure and urinary electrolytes. J Chron Dis 37:75–84.
Davis KM, Fish LC, Ten Cate AJ, Bonis P, Fields D, Clark BA, Elahi D, Minaker KL. 1989. Determinants of basal atrial natriuretic peptide (ANP) in the institutionalized elderly. Gerontologist 29:A6.
Deriaz O, Theriault G, Lavallee N, Fournier G, Nadeau A, Bouchard C. 1991. Human resting energy expenditure in relation to dietary potassium. Am J Clin Nutr 54:628–634.
Devine A, Criddle RA, Dick IM, Kerr DA, Prince RL. 1995. A longitudinal study of the effect of sodium and calcium intakes on regional bone density in postmenopausal women. Am J Clin Nutr 62:740–745.
Dewey KG, Lonnerdal B. 1983. Milk and nutrient intake of breast-fed infants from 1 to 6 months: Relation to growth and fatness. J Pediatr Gastroenterol Nutr 2:497–506.
Dluhy RG, Axelrod L, Underwood RH, Williams GH. 1972. Studies of the control of plasma aldosterone concentration in normal man. II. Effect of dietary potassium and acute potassium infusion. J Clin Invest 51:1950–1957.
Dyer AR, Elliott P, Shipley M. 1994. Urinary electrolyte excretion in 24 hours and blood pressure in the INTERSALT study. II. Estimates of electrolyte blood pressure associations corrected for regression dilution bias. Am J Epidemiol 139:941–951.
Eaton SB, Eaton SBI, Konner MJ. 1999. Paleolithic nutrition revisited. In: Trevathan WR, Smith EO, McKenna JJ, eds. Evolutionary Medicine. New York: Oxford University Press. Pp. 313–332.
Ehrlich EN, Lindheimer MD. 1972. Effects of administered mineralocorticoids or ACTH in pregnant women: Attenuation of the kaliuretic influence of mineralocorticoids during pregnancy. J Clin Invest 51:1301–1309.
Fang J, Madhavan S, Alderman MH. 2000. Dietary potassium intake and stroke mortality. Stroke 31:1532–1537.
Fisch C, Knoebel SB, Feigenbaum H, Greenspan K. 1966. Potassium and the monophasic action potential, electrocardiogram, conduction and arrhythmias. Prog Cardiovasc Dis 8:387–418.
Follenius M, Brandenberger G, Reinhardt B, Simeoni M. 1979. Plasma aldosterone, renin activity, and cortisol responses to heat exposure in sodium depleted and repleted subjects. Eur J Appl Physiol 41:41–50.
Forsum E, Sadurkis A, Wager J. 1988. Resting metabolic rate and body composition of healthy Swedish women during pregnancy. Am J Clin Nutr 47:942–947.
Fotherby MD, Potter JF. 1992. Potassium supplementation reduces clinic and ambulatory blood pressure in elderly hypertensive patients. J Hypertens 10:1403–1408.
Franse LV, Pahor M, Di Bari M, Somes GW, Cushman WC, Applegate WB. 2000. Hypokalemia associated with diuretic use and cardiovascular events in the Systolic Hypertension in the Elderly Program. Hypertension 35:1025–1030.
Frassetto LA, Morris RC Jr, Sebastian A. 1996. Effect of age on blood acid-base composition in adult humans: Role of age-related renal functional decline. Am J Physiol 271:F1114–F1122.
Frassetto LA, Morris RC Jr, Sebastian A. 1997. Potassium bicarbonate reduces urinary nitrogen excretion in postmenopausal women. J Clin Endocrinol Metab 82:254–259.
Frassetto LA, Todd KM, Morris RC, Sebastian A. 1998. Estimation of the net endogenous noncarbonic acid production in humans from diet potassium and protein contents. Am J Clin Nutr 68:576–583.
Friedman SA, Friedman CL. 1957. Salt and water balance in ageing rats. Gerontologia 1:107–121.
Frisancho AR, Leonard WR, Bollettino LA. 1984. Blood pressure in blacks and whites and its relationship to dietary sodium and potassium intake. J Chron Dis 37:515–519.
Fukumoto T, Tanaka T, Fujioka H, Yoshihara S, Ochi T, Kuroiwa A. 1988. Differences in composition of sweat induced by thermal exposure and by running exercise. Clin Cardiol 11:707–709.
Furberg CD, Wright JT Jr, Davis BR, Cutler JA, Alderman M, Black H, Cushman W, Grimm R, Haywood LJ, Leenen F, Oparil S, Probstfield J, Whelton P, Nwachuku C, Gordon D, Proschan M, Einhom P, Ford CE, Piller LB, Dunn IK, Goff D, Pressel S, Bettencourt J, DeLeon B, Simpson LM, Blanton J, Geraci T, Walsh SM, Nelson C, Rahman M, Juratovac A, Pospisil R, Carroll L, Sullivan S, Russo J, Barone G, Christian R, Feldman S, Lucente T, Calhoun D, Jenkins K, McDowell P, Johnson J, Kingry C, Alzate J, Margolis KL, Holland-Klemme LA, Jaeger B, Williamson J, Louis G, Ragusa P, Williard A, Ferguson RLS, Tanner J, Eckfeldt J, Crow R, Pelosi J. 2002. Major outcomes in high-risk hypertensive patients randomized to angiotensin-converting enzyme inhibitor or calcium channel blocker vs diuretic: The Antihypertensive and Lipid-Lowering Treatment to Prevent Heart Attack Trial (ALLHAT). J Am Med Assoc 288:2981–2997.
Gallen IW, Rosa RM, Esparaz DY, Young JB, Robertson GL, Batlle D, Epstein FH, Landsberg L. 1998. On the mechanism of the effects of potassium restriction on blood pressure and renal sodium retention. Am J Kidney Dis 31:19–27.
Geleijnse JM, Grobbee DE, Hofman A. 1990. Sodium and potassium intake and blood pressure change in childhood. Br Med J 300:899–902.
Geleijnse JM, Witteman J, den Breeijen JH, Hofman A, de Jong, TVM, Pols H, Grobbee DE. 1996. Dietary electrolyte intake and blood pressure in older subjects: The Rotterdam Study. J Hypertens 14:737–741.
Geleijnse JM, Kok FJ, Grobbee DE. 2003. Blood pressure response to changes in sodium and potassium intake: A metaregression analysis of randomised trials. J Hum Hypertens 17:471–480.
Gennari FJ, Segal AS. 2002. Hyperkalemia: An adaptive response in chronic renal insufficiency. Kidney Int 62:1–9.
Gilliland FD, Berhane KT, Li YF, Kim DH, Margolis HG. 2002. Dietary magnesium, potassium, sodium, and children’s lung function. Am J Epidemiol 155:125–131.
Godfrey BE, Wordsworth GR. 1970. Total body potassium in pregnant women. J Obstet Gynaecol Br Commw 77:244–246.
Green DM, Ropper AH, Kronmal RA, Psaty BM, Burke GL. 2002. Serum potassium
level and dietary potassium intake as risk factors for strok. Neurology 59:314–320.
Grim CE, Luft FC, Miller JZ, Meneely GR, Battarbee HD, Hames CG, Dahl LK. 1980. Racial differences in blood pressure in Evans County, Georgia: Relationship to sodium and potassium intake and plasma renin activity. J Chron Dis 33:87–94.
Grimm RH, Kofron PM, Neaton JD, Svendsen KH, Elmer PJ, Holland L, Witte L, Clearman D, Prineas RJ. 1988. Effect of potassium supplementation combined with dietary sodium reduction on blood pressure in men taking antihypertensive medication. J Hypertens 6:S591–S593.
Grimm RH, Neaton JD, Elmer PJ, Svendsen KH, Levin J, Segal M, Holland L, Witte LJ, Clearman DR, Kofron P, LaBounty RK, Crow R, Prineas RJ. 1990. The influence of oral potassium chloride on blood pressure in hypertensive men on a low-sodium diet. N Engl J Med 322:569–574.
Grobbee DE, Hofman A, Roelandt JT, Boomsma F, Schalekamp MA, Valkenburg HA. 1987. Sodium restriction and potassium supplementation in young people with mildly elevated blood pressure. J Hypertens 5:115–119.
Gross SJ, David RJ, Bauman L, Tomarelli RM. 1980. Nutritional composition of milk produced by mothers delivering preterm. J Pediatr 96:641–644.
Gu D, He J, Wu X, Duan X, Whelton PK. 2001. Effect of potassium supplementation on blood pressure in Chinese: A randomized, placebo-controlled trial. J Hypertens 19:1325–1331.
Haddad A, Strong E. 1975. Potassium in salt substitutes. N Engl J Med 292:1082.
Hajjar IM, Grim CE, George V, Kotchen TA. 2001. Impact of diet on blood pressure and age-related changes in blood pressure in the US population. Arch Intern Med 161:589–593.
Hamm LL. 1990. Renal handling of citrate. Kidney Int 38:728–735.
Hay E, Derazon H, Bukish N, Katz L, Kruglyakov I, Armoni M. 2002. Fatal hyperkalemia related to combined therapy with a cox-2 inhibitor, ace inhibitor and potassium rich diet. J Emerg Med 22:349–352.
Helderman JH, Elahi D, Andersen DK, Raizes GS, Tobin JD, Shocken D, Andres R. 1983. Prevention of the glucose intolerance of thiazide diuretics by maintenance of body potassium. Diabetes 32:106–111.
Hene RJ, Koomans HA, Boer P, Dorhout Mees EJ. 1986. Adaptation to chronic potassium loading in normal man. Miner Electrolyte Metab 12:165–172.
Hirvonen T, Pietinen P, Virtanen M, Albanes D, Virtamo J. 1999. Nutrient intake and use of beverages and the risk of kidney stones among male smokers. Am J Epidemiol 150:187–194.
Holbrook JT, Patterson KY, Bodner JE, Douglas LW, Veillon C, Kelsay JL, Mertz W, Smith JC. 1984. Sodium and potassium intake and balance in adults consuming self-selected diets. Am J Clin Nutr 40:786–793.
Hypertension Prevention Trial Research Group. 1990. The Hypertension Prevention Trial: Three-year effects of dietary changes on blood pressure. Arch Intern Med 150:153–162.
Hytten FE, Leitch I. 1971. The Physiology of Human Pregnancy, 2nd ed. Philadelphia: FA Davis.
Iimura O, Kijima T, Kikuchi K, Miyama A, Ando T, Nakao T, Takigami Y. 1981. Studies on the hypotensive effect of high potassium intake in patients with essential hypertension. Clin Sci 61:77S–80S.
IOM (Institute of Medicine). 2000. The Role of Nutrition in Maintaining Health in the Nation’s Elderly. Washington, DC: National Academy Press.
IOM. 2002/2005. Dietary Reference Intakes for Energy, Carbohydrate, Fiber, Fat, Fatty Acids, Cholesterol, Protein, and Amino Acids. Washington, DC: The National Academies Press.
Iso H, Stampfer MJ, Manson JE, Rexrode K, Hennekens CH, Colditz GA, Speizer FE, Willett WC. 1999. Prospective study of calcium, potassium, and magnesium intake and risk of stroke in women. Stroke 30:1772–1779.
John JH, Ziebland S, Yudkin P, Roe LS, Neil HA. 2002. Effects of fruit and vegetable consumption on plasma antioxidant concentration and blood pressure: A randomised controlled trial. Lancet 359:1969–1974.
Jones G, Riley MD, Whiting S. 2001. Association between urinary potassium, urinary sodium, current diet, and bone density in prepubertal children. Am J Clin Nutr 73:839–844.
Kallen RJ, Rieger CHL, Cohen HS, Suter MA, Ong RT. 1976. Near-fatal hyperkalemia due to ingestion of salt substitute by an infant. J Am Med Assoc 235:2125–2126.
Kamel KS, Halperin ML, Faber MD, Steigerwalt SP, Heilig CW, Narins RG. 1996. Disorders of potassium balance. In: Brenner BM, ed. Brenner and Rector’s The Kidney, 5th ed., vol. 1. Philadelphia: WB Saunders. Pp. 999–1037.
Kaplan NM, Carnegie A, Raskin P, Heller JA, Simmons M. 1985. Potassium supplementation in hypertensive patients with diuretic-induced hypokalemia. N Engl J Med 312:746–749.
Keenan BS, Buzek SW, Garza C, Potts E, Nichols BL. 1982. Diurnal and longitudinal variations in human milk sodium and potassium: Implication for nutrition and physiology. Am J Clin Nutr 35:527–534.
Kesteloot H, Joossens JV. 1988. Relationship of dietary sodium, potassium, calcium, and magnesium with blood pressure. Hypertension 12:594–599.
Khaw KT, Barrett-Connor E. 1984. Dietary potassium and blood pressure in a population. Am J Clin Nutr 39:963–968.
Khaw KT, Barrett-Connor E. 1987. Dietary potassium and stroke-associated mortality. N Engl J Med 316:235–240.
Khaw KT, Barrett-Connor E. 1988. The association between blood pressure, age, and dietary sodium and potassium: A population study. Circulation 77:53–61.
Khaw KT, Barrett-Connor E. 1990. Increasing sensitivity of blood pressure to dietary sodium and potassium with increasing age. A population study using casual urine specimens. Am J Hypertens 6:505–511.
Khaw KT, Thom S. 1982. Randomised double-blind cross-over trial of potassium on blood-pressure in normal subjects. Lancet 2:1127–1129.
Kirkendall WM, Conner EW, Abboud F, Rastogi SP, Anderson TA, Fry M. 1976. The effect of dietary sodium chloride on blood pressure, body fluids, electrolytes, renal function, and serum lipids of normotensive man. J Lab Clin Med 87:418–434.
Knochel JP. 1984. Diuretic-induced hypokalemia. Am J Med 77:18–27.
Kok FJ, Vandenbroucke JP, van der Heide-Wessel C, van der Heide RM. 1986. Dietary sodium, calcium, and potassium, and blood pressure. Am J Epidemiol 123:1043–1048.
Krishna GG, Kapoor SC. 1991. Potassium depletion exacerbates essential hypertension. Ann Intern Med 115:77–83.
Krishna GG, Miller E, Kapoor S. 1989. Increased blood pressure during potassium depletion in normotensive men. N Engl J Med 320:1177–1182.
Kurtz I, Maher T, Hulter HN, Schambelan M, Sebastian A. 1983. Effect of diet on plasma acid-base composition in normal humans. Kidney Int 24:570–580.
Lambert JR, Newman A. 1980. Ulceration and stricture of the esophagus due to oral potassium chloride (slow release tablet) therapy. Am J Gastroenterol 73:508–511.
Langford HG. 1983. Dietary potassium and hypertension: Epidemiologic data. Ann Intern Med 98:770–772.
Lawton WJ, Fitz AE, Anderson EA, Sinkey CA, Coleman RA. 1990. Effect of dietary potassium on blood pressure, renal function, muscle sympathetic nerve activity, and forearm vascular resistance and flow in normotensive and borderline hypertensive humans. Circulation 81:173–184.
Lee CN, Reed DM, MacLean CJ, Yano K, Chiu D. 1988. Dietary potassium and stroke. N Engl J Med 318:995–996.
Leijonmarck CE, Raf L. 1985. Gastrointestinal lesions and potassium chloride supplements. Lancet 1:56–57.
Lemann J. 1999. Relationship between urinary calcium and net acid excretion as determined by dietary protein and potassium: A review. Nephron 81:18S–25S.
Lemann J, Litzow JR, Lennon EJ. 1966. The effects of chronic acid loads in normal man: Further evidence for participation of bone mineral in the defense against chronic metabolic acidosis. J Clin Invest 45:1608–1614.
Lemann J, Pleuss JA, Gray RW. 1989. Potassium bicarbonate, but not sodium bicarbonate, reduces urinary calcium excretion and improves calcium balances in healthy men. Kidney Int 35:688–695.
Lemann J, Pleuss JA, Gray RW, Hoffmann RG. 1991. Potassium administration reduces and potassium deprivation increases urinary calcium excretion in healthy adults. Kidney Int 39: 973–983.
Lemann J, Pleuss JA, Gray RW. 1993. Potassium causes calcium retention in healthy adults. J Nutr 123:1623–1626.
Lemann J, Bushinsky DA, Hamm LL. 2003. Bone buffering of acid and base in humans. Am J Physiol 285:F811–F832.
Lemons JA, Moye L, Hall D, Simmons M. 1982. Differences in the composition of preterm and term human milk during early lactation. Pediatr Res 16:113–117.
Lennon EJ, Lemann J Jr, Litzow JR. 1966. The effects of diet and stool composition on the net external acid balance of normal subjects. J Clin Invest 45:1601–1607.
Lindheimer MD, Katz AI. 1985. Fluid and electrolyte metabolism in normal and abnormal pregnancy. In: Arieff AI, DeFronzo RA, eds. Fluid, Electrolyte, and Acid-Base Disorders. New York: Churchill Livingstone. Pp. 1041–1086.
Lindheimer MD, Katz AI. 2000. Renal physiology and disease in pregnancy. In: Seldin DW, Geibisch G, eds. The Kidney: Physiology and Pathophysiology, 3rd ed. New York: Lippincott Williams & Wilkins. Pp. 2597–2644.
Lindheimer MD, Richardson DA, Ehrlich EN, Katz AI. 1987. Potassium homeostasis in pregnancy. J Reprod Med 32:517–522.
Liu K, Ruth KJ, Flack JM, Jones-Webb R, Burke G, Savage PJ, Hulley SB. 1996. Blood pressure in young blacks and whites: Relevance of obesity and lifestyle factors in determining differences. Circulation 93:60–66.
Liu LS, Xie J, Fang WQ. 1988. Urinary cations and blood pressure: A collaborative study of 16 districts in China. J Hypertens 6:587S–590S.
Loria CM, Obarzanek E, Ernst ND. 2001. Choose and prepare foods with less salt: Dietary advice for all Americans. J Nutr 131:536S–551S.
Luft FC, Rankin LI, Bloch R, Weyman AE, Willis LR, Murray RH, Grim CE, Weinberger MH. 1979. Cardiovascular and humoral responses to extremes of sodium intake in normal black and white men. Circulation 60:697–706.
Luft FC, Weinberger MH, Grim CE. 1982. Sodium sensitivity and resistance in normotensive humans. Am J Med 72:726–736.
Macdonald HM, New SA, Golden MH, Campbell MK, Reid DM. 2004. Nutritional associations with bone loss during the menopausal transition: Evidence of a beneficial effect of calcium, alcohol, and fruit and vegetable nutrients and of a detrimental effect of fatty acids. Am J Clin Nutr 79:155–165.
MacGillivray L, Buchanan TJ. 1958. Total exchangeable sodium and potassium in non-pregnant women and in normal and preeclamptic pregnancy. Lancet 2:1090–1093.
MacGregor GA, Cappuccio FP. 1993. The kidney and essential hypertension: A link to osteoporosis? J Hypertens 11:781–785.
MacGregor GA, Smith SJ, Markandu ND, Banks RA, Sagnella GA. 1982. Moderate potassium supplementation in essential hypertension. Lancet 2:567–570.
Malhotra MS, Sridharan K, Venkataswamy Y. 1976. Potassium losses in sweat under heat stress. Aviat Space Environ Med 47:503–504.
Matkovic V, Ilich JZ, Andon MB, Hsieh LC, Tzagournis MA, Lagger BJ, Goel PK. 1995. Urinary calcium, sodium and bone mass of young females. Am J Clin Nutr 62:417–425.
Matlou SM, Isles CG, Higgs A, Milne FJ, Murray GD, Schultz E, Starke IF. 1986. Potassium supplementation in blacks with mild to moderate essential hypertension. J Hypertens 4:61–64.
Maurer M, Riesen W, Muser J, Hulter HN, Krapf R. 2003. Neutralization of Western diet inhibits bone resorption independently of K intake and reduces cortisol secretion in humans. Am J Physiol 284:F32–F40.
McGarvey ST, Zinner SH, Willett WC, Rosner B. 1991. Maternal prenatal dietary potassium, calcium magnesium, and infant blood pressure. Hypertension 17:218–224.
Medical Economics. 2001. Physicians’ Desk Reference for Nutritional Supplements, 1st ed. Montvale, NJ: Medical Economics.
Meyer JL, Smith LH. 1975. Growth of calcium oxalate monohydrate. J Cryst Growth 21:267–276.
Miller JZ, Weinberger MH, Christian JC. 1987. Blood pressure response to potassium supplementation in normotensive adults and children. Hypertension 10:437–442.
Minaker KL, Rowe JW. 1982. Potassium homeostasis during hyperinsulinemia: Effect of insulin level, β-blockade, and age. Am J Physiol E373–E377.
Modan M, Halkin H, Fuch Z, Lusky A, Cherit A, Segal P, Eshkol A, Almog S, Shefi M. 1987. Hyperinsulinemia: A link between glucose intolerance, obesity, hypertension, dyslipoproteinemia, elevated serum uric acid and internal cation imbalance. Diabete Metab 13:375–380.
Morgan T, Myers J, Teow B. 1984. The role of sodium and potassium in the control of blood pressure. Aust N Z J Med 14:458–462.
Morimoto A, Uzu T, Fujii T, Nishimura M, Kuroda S, Nakamura S, Inenaga T, Kimura G. 1997. Sodium sensitivity and cardiovascular events in patients with essential hypertension. Lancet 350:1734–1737.
Morris CD, Jacobson SL, Anand R, Ewell MG, Hauth JC, Curet LB, Catalano PM, Sibai BM, Levine RJ. 2001. Nutrient intake and hypertensive disorders of pregnancy: Evidence from a large prospective cohort. Am J Obstet Gynecol 184:643–651.
Morris RC, Sebastian A. 1995. Potassium-responsive hypertension. In: Laragh J, Brenner B, eds. Hypertension: Pathophysiology, Diagnosis, and Management, 2nd ed. New York: Raven Press. Pp. 2715–2726.
Morris RC Jr, Schmidlin O, Tanaka M, Forman A, Frassetto L, Sebastian A. 1999a. Differing effects of supplemental KCl and KHCO3: Pathophysiological and clinical implications. Sem Nephrol 19:487–493.
Morris RC Jr, Sebastian A, Forman A, Tanaka M, Schmidlin O. 1999b. Normotensive salt-sensitivity: Effects of race and dietary potassium. Hypertension 33:18–23.
Morris RC Jr, Frassetto LA, Schmidlin O, Forman A, Sebastian A. 2001. Expression of osteoporosis as determined by diet-disordered electrolyte and acid-base metabolism. In: Burckhardt PB, Dawson-Hughes B, Heaney RP, eds. Nutritional Aspects of Osteoporosis. San Diego: Academic Press. Pp. 357–378.
Mujais SK, Nora NA, Chen Y. 1993. Regulation of the renal Na:K pump: Role of progesterone. J Am Soc Nephrol 3:1488–1495.
Mullen JT, O’Connor DT. 1990. Potassium effects on blood pressure: Is the conjugate anion important? J Hum Hypertens 4:589–596.
Naismith DJ, Braschi A. 2003. The effect of low-dose potassium supplementation on blood pressure in apparently healthy volunteers. Br J Nutr 90:53–60.
New SA, Bolton-Smith C, Grubb DA, Reid DM. 1997. Nutritional influences on bone mineral density: A cross-sectional study in premenopausal women. Am J Clin Nutr 65:1831–1839.
New SA, Robins SP, Campbell MK, Martin JC, Garton MJ, Bolton-Smith C, Grubb DA, Lee SJ, Reid DM. 2000. Dietary influences on bone mass and bone metabolism: Further evidence of a positive link between fruit and vegetable consumption and bone health. Am J Clin Nutr 71:142–151.
New SA, MacDonald HM, Campbell MK, Martin JC, Garton MJ, Robins SP, Reid DM. 2004. Lower estimates of net endogenous noncarbonic acid production are positively associated with indexes of bone health in premenopausal and perimenopausal women. Am J Clin Nutr 79:131–138.
Norbiato G, Bevilacqua M, Meroni R, Raggi U, Dagani R, Scorza D, Frigeni G, Vago T. 1984. Effects of potassium supplementation on insulin binding and insulin action in human obesity: Protein-modified fast and refeeding. Eur J Clin Invest 14:414–419.
Obel AO. 1989. Placebo-controlled trial of potassium supplements in black patients with mild essential hypertension. J Cardiovasc Pharmacol 14:294–296.
Oster JR, Singer I, Fishman LM. 1995. Heparin-induced aldosterone suppression and hyperkalemia. Am J Med 98:575–586.
Overlack A, Conrad H, Stumpe KO. 1991. The influence of oral potassium citrate/bicarbonate on blood pressure in essential hypertension during unrestricted salt intake. Klin Wochenschr 69:79–83.
Overlack A, Ruppert M, Kolloch R, Gobel B, Kraft K, Diehl J, Schmitt W, Stumpe K. 1993. Divergent hemodynamic and hormonal responses to varying salt intake in normotensive subjects. Hypertension 22:331–338.
Pak CY. 1987. Citrate and renal calculi. Miner Electrolyte Metab 13:257–266.
Pak CY, Fuller C. 1986. Idiopathic hypocitraturic calcium-oxalate nephrolithiasis successfully treated with potassium citrate. Ann Intern Med 104:33–37.
Pak CY, Fuller C, Sakhaee K, Preminger GM, Britton F. 1985. Long-term treatment of calcium nephrolithiasis wih potassium citrate. J Urol 134:11–19.
Pak CY, Sakhaee K, Fuller C. 1986. Successful management of uric acid nephrolithiasis with potassium citrate. Kidney Int 30:422–428.
Pak CY, Peterson RD, Poindexter J. 2002. Prevention of spinal bone loss by potassium citrate in cases of calcium urolithiasis. J Urol 168:31–34.
Patki PS, Singh J, Gokhale SV, Bulakh PM, Shrotri DS, Patwardhan B. 1990. Efficacy of potassium and magnesium in essential hypertension: A double blind, placebo controlled, crossover study. Br Med J 301:521–523.
Peart S, Barnes GR, Broughton PMG, Dollery CT, Green KG, Hudson MF, Lever AF, Meade TW, Miall WE, Rose GA, Greenberg G. 1987. Comparison of the antihypertensive efficacy and adverse reactions to two doses of bendrofluazide and hydrochlorothiazide and the effect of potassium supplementation on the hypotensive action of bendrofluazide: Substudies of the Medical Research Council’s Trials of Treatment of Mild Hypertension: Medical Research Council Working Party. J Clin Pharmacol 27:271–277.
Pennington JAT. 1998. Bowes and Church’s Food Values of Portions Commonly Used, 17th ed. Philadelphia: Lippincott.
Peraino RA, Suki WN. 1980. Urine HCO 3 augments renal Ca2+ absorption independent of systemic acid-base changes. Am J Physiol 238:F394–F398.
Picciano MF, Calkins EJ, Garrick JR, Deering RH. 1981. Milk and mineral intakes of breastfed infants. Acta Paediatr Scand 70:189–194.
Pietinen P. 1982. Estimating sodium intake from food consumption data. Ann Nutr Metab 26: 90–99.
Pietro DA, Davidson L. 1990. Evaluation of patients’ preference of two potassium chloride supplements: Slow-K and K-Dur. Clin Ther 12:431–435.
Pistelli R, Forastiere F, Corbo GM, Dell’Orco V, Brancato G, Agabiti N, Pizzablocca A, Perucci CA. 1993. Respiratory symptoms and bronchial responsiveness are related to dietary salt intake and urinary potassium excretion in male children. Eur Respir J 6:517–522.
Plavinik FL, Rodrigues CIS, Zanella MT, Ribeiro AB. 1992. Hypokalemia, glucose intolerance, and hyperinsulinemia during diuretic therapy. Hypertension 19:II26S–II29S.
Pollare T, Lithell H, Berne C. 1989. A comparison of the effects of hydrochlorothiazide and captopril on glucose and lipid metabolism in patients with hypertension. N Engl J Med 321: 868–873.
Poulter NR, Sever PS. 1986. Moderate potassium supplementation: Ineffective in black normotensives. East Afr Med J 63:798–802.
Preminger GM, Sakhaee K, Skurla C, Pak CY. 1985. Prevention of recurrent calcium stone formation with potassium citrate therapy in patients with distal renal tubular acidosis. J Urol 134:20–23.
Price DA, Fisher NDL, Lansang MC, Stevanovic R, Williams GH, Hollenberg NK. 2002. Renal perfusion in blacks. Alterations caused by insuppressibility of intrarenal renin with salt. Hypertension 40:186–189.
Rabelink TJ, Koomans HA, Hene RJ, Dorhout Mees EJ. 1990. Early and late adjustment to potassium loading in humans. Kidney Int 38:942–947.
Ray KK, Dorman S, Watson RDS. 1999. Severe hyperkalemia due to the concomitant use of salt substitutes and ACE inhibitors in hypertension: A potentially life threatening interaction. J Hum Hypertens 13:717–720.
Reardon LC, Macpherson DS. 1998. Hyperkalemia in outpatients using angiotensin-converting enzyme inhibitors. How much should we worry? Arch Intern Med 158:26–32.
Reddy ST, Wang C-Y, Sakhaee K, Brinkley L, Pak CYC. 2002. Effect of low-carbohydrate high-protein diets on acid-base balance, stone-forming propensity, and calcium metabolism. Am J Kidney Dis 40:265–274.
Riccardella D, Dwyer J. 1985. Salt substitutes and medicinal potassium sources: Risks and benefits. J Am Diet Assoc 85:471–474.
Richards AM, Nicholls MG, Espiner EA, Akram H, Maslowski AH, Hamilton EJ, Wells JE. 1984. Blood-pressure response to moderate sodium restriction and to potassium supplementation in mild essential hypertension. Lancet 1:757–761.
Robertson JI. 1984. Diuretics, potassium depletion and the risk of arrhythmias. Eur Heart J 5:25S–28S.
Rosa RM, Silva P, Young JB, Landsberg L, Brown RS, Rowe JW, Epstein FH. 1980. Adrenergic modulation of extrarenal potassium disposal. N Engl J Med 302:431–433.
Rose G, Stamler J, Stamler R, Elliott P, Marmot M, Pyorala K, Kesteloot H, Joossens J, Hansson L, Mancia G, Dyer A, Kromhout D, Laaser U, Sans S. 1988. Intersalt: An international study of electrolyte excretion and blood pressure. Results for 24 hour urinary sodium and potassium excretion. Br Med J 297:319–328.
Rowe JW, Minaker KL, Levi M. 1992. Pathophysiology and management of electrolyte disturbances in the elderly. In: Martinez-Maldonado M, ed. Hypertension and Renal Disease in the Elderly. Boston: Blackwell Scientific Publications. Pp. 170–184.
Sacks FM, Svetkey LP, Vollmer WM, Appel LJ, Bray GA, Harsha D, Obarzanek E, Conlin PR, Miller ER, Simons-Morton DG, Karanja N, Lin PH. 2001. Effects of blood pressure of reduced dietary sodium and the Dietary Approaches to Stop Hypertension (DASH) diet. N Engl J Med 344:3–10.
Sakhaee K, Alpern R, Jacobson HR, Pak CYC. 1991. Contrasting effects of various potassium salts on renal citrate excretion. J Clin Endocrinol Metab 72:396–400.
Sasaki S, Zhang X, Kesteloot H. 1995. Dietary sodium, potassium, saturated fat, alcohol, and stroke mortality. Stroke 26:783–789.
Schmidlin O, Forman A, Tanaka M, Sebastian A, Morris RC. 1999. NaCl-induced renal vasoconstriction in salt-sensitive African-Americans: Antipressor and hemodynamic effects of potassium bicarbonate. Hypertension 33:633–639.
Schoolwerth AC, Sica DA, Ballermann BJ, Wilcox CS. 2001. Renal considerations in angiotensin converting enzyme inhibitor therapy: A statement for healthcare professionals from the Council on the Kidney in Cardiovascular Disease and the Council for High Blood Pressure Research of the American Heart Association. Circulation 104:1985–1991.
Schultze RG. 1973. Recent advances in the physiology and pathophysiology of potassium excretion. Arch Intern Med 131:885–897.
Sebastian A, McSherry E, Morris RC Jr. 1971. Renal potassium wasting in renal tubular acidosis (RTA): Its occurrence in types 1 and 2 RTA despite sustained correction of systemic acidosis. J Clin Invest 50:667–678.
Sebastian A, Harris ST, Ottaway JH, Todd KM, Morris RC Jr. 1994. Improved mineral balance and skeletal metabolism in postmenopausal women treated with potassium bicarbonate. N Engl J Med 330:1776–1781.
Sebastian A, Frassetto LA, Sellmeyer DE, Merriam RL, Morris RC Jr. 2002. Estimation of the net acid load of the diet ancestral preagricultural Homo sapiens and their hominid ancestors. Am J Clin Nutr 76:1308–1316.
Sellmeyer DE, Schlotter M, Sebastian A. 2002. Potassium citrate prevents increased urine calcium excretion and bone resorption induced by high sodium chloride diet. J Clin Endocrinol Metab 87:2008–2012.
Sharma AM, Arntz HR, Kribben A, Schattenfroh S, Distler A. 1990. Dietary sodium restriction: Adverse effect on plasma lipids. Klin Wochenschr 68:664–668.
Siani A, Strazzullo P, Russo L, Guglielmi S, Iacoviello L, Ferrara LA, Mancini M. 1987. Controlled trial of long term oral potassium supplements in patients with mild hypertension. Br Med J 294:1453–1456.
Simpson DP. 1983. Citrate excretion: A window on renal metabolism. Am J Physiol 244:F223–F234.
Sinaiko AR, Gomez-Marin O, Prineas RJ. 1993. Effect of low sodium diet or potassium supplementation on adolescent blood pressure. Hypertension 21:989–994.
Sinar DR, Bozymski EM, Blackshear JL. 1986. Effects of oral potassium supplements on upper gastrointestinal mucosa: A multicenter clinical comparison of three formulations and placebo. Clin Ther 8:157–163.
Skrabal F, Aubock J, Hortnagl H. 1981. Low sodium/high potassium diet for prevention of hypertension: Probable mechanisms of action. Lancet 2:895–900.
Smith SJ, Markandu ND, Sagnella GA, MacGregor GA. 1985. Moderate potassium chloride supplementation in essential hypertension: Is it additive to moderate sodium restriction? Br Med J 290:110–113.
Smith SR, Klotman PE, Svetkey LP. 1992. Potassium chloride lowers blood pressure and causes natriuresis in older patients with hypertension. J Am Soc Nephrol 2:1302–1309.
Snyder EL, Dixon T, Bresnitz E. 1975. Abuse of salt “substitute”. New Engl J Med 292:320.
Souhrada JF, Souhrada M. 1983. Significance of the sodium pump for airway smooth muscle. Eur J Respir Dis Suppl 128:196–205.
Souhrada M, Souhrada JF. 1984. Immunologically induced alterations of airway smooth muscle cell membrane. Science 225:723–725.
Squires RD, Huth EJ. 1959. Experimental potassium depletion in normal human subjects. I. Relation of ionic intakes to the renal conservation of potassium. J Clin Invest 38:1134–1148.
Stamler J, Cirillo M. 1997. Dietary salt and renal stone disease. Lancet 349:506–507.
Stokes JBI, Lee I, Williams A. 1982. Consequences of potassium recycling in the renal medulla: Effects on ion transport by the medullary thick ascending limb of Henle’s loop. J Clin Invest 70:219–229.
Su M, Stork C, Ravuri S, Lavoie T, Anguish D, Nelson LS, Hoffman RS. 2001. Sustained-release potassium chloride overdose. J Toxicol Clin Toxicol 39:641–648.
Subar AF, Thompson FE, Kipnis V, Midthune D, Hurwitz P, McNutt S, McIntosh A, Rosenfeld S. 2001. Comparative validation of the Block, Willett, and National Cancer Institute food frequency questionnaires. Am J Epidemiol 154:1089–1099.
Sudhir K, Forman A, Yi S-L, Sorof J, Schmidlin O, Sebastian A, Morris RC Jr. 1997. Reduced dietary potassium reversibly enhances vasopressor response to stress in African-Americans. Hypertension 29:1083–1090.
Sullivan JM, Ratts TE, Taylor JC, Kraus DH, Barton BR, Patrick DR, Reed SW. 1980. Hemodynamic effects of dietary sodium in man. Hypertension 2:506–514.
Svetkey LP, Yarger WE, Feussner JR, DeLong E, Klotman PE. 1987. Double-blind, placebo-controlled trial of potassium chloride in the treatment of mild hypertension. Hypertension 9:444–450.
Szwed JJ, Clarke M. 1982. Renal tubular acidosis in pregnancy. Am J Med Sci 384:32–36.
Takemori K, Mikami S, Nihira S, Sasaki N. 1989. Relationship of blood pressure to sodium and potassium excretion in Japanese women. Tohoku J Exp Med 158:269–281.
Tanaka M, Schmidlin O, Yi S-L, Bollen AW, Morris RC Jr. 1997. Genetically determined chloride-sensitive hypertension and stroke. Proc Natl Acad Sci USA 94:14748–14752.
Tanaka M, Schmidlin O, Olson JL, Yi S-L, Morris RC Jr. 2001. Chloride-sensitive renal microangiopathy in the stroke-prone spontaneously hypertensive rat. Kidney Int 59:1066–1076.
Tannen RL. 1986. Drug interactions causing hyperkalemia. In: Whelton P, Whelton A, Walker WG, eds. Potassium in Cardiovascular and Renal Medicine. New York: Marcel Dekker. Pp. 467–476.
Textor SC, Bravo EL, Fouad FM, Tarazi RC. 1982. Hyperkalemia in azotemic patients during angiotensin-converting enzyme inhibition and aldosterone reduction with captopril. Am J Med 73:719–725.
Tobian L. 1986. High-potassium diets markedly protect against stroke deaths and kidney disease in hypertensive rats, an echo from prehistoric days. J Hypertens Suppl 4:S67–S76.
Tobian L, Lange JM, Ulm KM, Wold LJ, Iwai J. 1984. Potassium prevents death from strokes in hypertensive rats without lowering blood pressure. J Hypertens 2:363S–366S.
Tribe RM, Barton JR, Poston L, Burney PGJ. 1994. Dietary sodium intake, airway responsiveness, and cellular sodium transport. Am J Respir Crit Care Med 149: 1426–1433.
Tucker KL, Hannan MT, Chen H, Cupples LA, Wilson PWF, Kiel DP. 1999. Potassium, magnesium, and fruit and vegetable intakes are associated with greater bone mineral density in elderly men and women. Am J Clin Nutr 69:727–736.
Tunstall-Pedoe H. 1999. Does dietary potassium lower blood pressure and protect against coronary heart disease and death? Findings from the Scottish Heart Health Study. Semin Nephrol 19:500–502.
Tunstall-Pedoe H, Woodward M, Tavendale R, Brook RA, McCluskey MK. 1997. Comparison of the prediction of 27 different factors of coronary heart disease and death in men and women of Scottish heart health study: Cohort study. Br Med J 315:722–729.
Valdes G, Vio CP, Montero J, Avendano R. 1991. Potassium supplementation lowers blood pressure and increases urinary kallikrein in essential hypertensives. J Hum Hypertens 5:91–96.
van Buren M, Rabelink TJ, Van Rijn HJM, Koomans HA. 1992. Effects of acute NaCl, KCl and KHCO3 loads on renal electrolyte excretion in humans. Clin Sci 83:567–574.
Wachman A, Bernstein DS. 1968. Diet and osteoporosis. Lancet 2:958–959.
Walker WG, Whelton PK, Saito H, Russell RP, Hermann J. 1979. Relation between blood pressure and renin, renin substrate, angiotensin II, aldosterone and urinary sodium and potassium in 574 ambulatory subjects. Hypertension 1:287–291.
Weinberger MH. 1996. Salt sensitivity of blood pressure in humans. Hypertension 27:481–490.
Weinberger MH, Luft FC, Bloch R, Henry DP, Pratt JH, Weyman AE, Rankin LI, Murray RH, Willis LR, Grim CE. 1982. The blood pressure-raising effects of high dietary sodium intake: Racial differences and the role of potassium. J Am Coll Nutr 1:139–148.
Weinberger MH, Fineberg NS, Fineberg SE, Weinberger M. 2001. Salt sensitivity, pulse pressure, and death in normal and hypertensive humans. Hypertension 37:429–432.
Wells CL, Schrader TA, Stern JR, Krahenbuhl GS. 1985. Physiological responses to a 20-mile run under three fluid replacement treatments. Med Sci Sports Exerc 17:364–369.
Westman EC, Yancy WS, Edman JS, Tomlin KF, Perkins CE. 2002. Effect of 6-month adherence to a very low carbohydrate diet program. Am J Med 113:30–36.
Wetli CV, Davis JH. 1978. Fatal hyperkalemia from accidental overdose of potassium chloride. J Am Med Assoc 240:1339.
Whelton PK, Buring J, Borhani NO, Cohen JD, Cook N, Cutler JA, Kiley JE, Kuller LH, Satterfield S, Sacks FM, Taylor JO. 1995. The effect of potassium supplementation in persons with a high-normal blood pressure. Results from phase I of the Trials of Hypertension Prevention (TOHP). Ann Epidemiol 5:85–95.
Whelton PK, He J, Cutler JA, Brancati FL, Appel LJ, Follmann D, Klag MJ. 1997. Effects of oral potassium on blood pressure. Meta-analysis of randomized controlled clinical trials. J Am Med Assoc 277:1624–1632.
Wilson M, Morganti AA, Zervoudakis I, Letcher RL, Romney BM, Von Oeyon P, Papera S, Sealey JE, Laragh JH. 1980. Blood pressure, the renin-aldosterone system and sex steroids throughout normal pregnancy. Am J Med 68:97–104.
Witteman JC, Willett WC, Stampfer MJ, Colditz GA, Sacks FM, Speizer FE, Rosner B, Hennekens CH. 1989. A prospective study of nutritional factors and hypertension among US women. Circulation 80:1320–1327.
Witzgall H, Behr J. 1986. Effects of potassium loading in normal man on dopaminergic control of mineralocorticoids and renin release. J Hypertens 4:201–205.
Xie JX, Sasaki S, Joossens JV, Kesteloot H. 1992. The relationship between urinary anions obtained from the INTERSALT study and cerebrovascular mortality. J Hum Hypertens 6:17–21.
Yamori Y, Nara Y, Misushima S, Sawamura M, Horie R. 1994. Nutritional factors for stroke and major cardiovascular diseases: International epidemiological comparison of dietary prevention. Health Prev 6:22–27.
Young DB. 1985. Analysis of long-term potassium regulation. Endocr Rev 6:24–44.
Young DB. 2001. Role of Potassium in Preventive Cardiovascular Medicine. Boston: Kluwer Academic Publishers.
Young DB, McCabe RD. 2000. Endocrine control of potassium balance. In: Fray JCS, Goodman HM, eds. Handbook of Physiology: Section 7, The Endocrine System. New York: Oxford University Press. Pp. 306–330.
Zhou B, Zhang X, Zhu A, Zhao L, Ruan L, Zhu L, Liang S. 1994. The relationship of dietary animal protein and electrolytes to blood pressure: A study on three Chinese populations. Int J Epidemiol 23:716–722.
Zoccali C, Cumming AMM, Hutcheson MJ, Barnett P, Semple PF. 1985. Effects of potassium on sodium balance, renin, noradrenaline and arterial pressure. J Hypertens 3:67–72.
Zoia MC, Fanfulla F, Bruschi C, Basso O, De Marco R, Casali L, Cerveri I. 1995. Chronic respiratory symptoms, bronchial responsiveness and dietary sodium and potassium: A population based study. Monaldi Arch Chest Dis 50:104–108.


