
1
Introduction to Dietary Reference Intakes
Dietary Reference Intakes (DRIs) comprise a set of nutrient-based reference values, each of which has special uses. The development of DRIs expands on two series of reports, the Recommended Dietary Allowances, which have been published since 1941 by the National Academy of Sciences, and the Recommended Nutrient Intakes of Canada. This comprehensive effort is being undertaken by the Standing Committee on the Scientific Evaluation of Dietary Reference Intakes of the Food and Nutrition Board, Institute of Medicine of the National Academies, with the active involvement of Health Canada. See Appendix B for a description of the overall process and its origins.
WHAT ARE DIETARY REFERENCE INTAKES?
The reference values, collectively called the Dietary Reference Intakes (DRIs), include the Estimated Average Requirement (EAR), the Recommended Dietary Allowance (RDA), the Adequate Intake (AI), and the Tolerable Upper Intake Level (UL).
A requirement is defined as the lowest continuing intake level of a nutrient that will maintain a defined level of nutriture in an individual. The chosen criteria of nutritional adequacy are identified in each chapter; note that the criterion used may differ for individuals at different life stages. Hence, particular attention is given throughout this report to the choice and justification of each criterion used to establish requirement values.
This approach differs somewhat from that used by the Expert Consultation on Trace Elements in Human Nutrition and Health (WHO, 1996) of the World Health Organization (WHO), Food and Agriculture Organization (FAO), and International Atomic Energy Agency (IAEA). That report uses the term basal requirement to indicate the level of intake needed to prevent pathologically relevant and clinically detectable signs of a dietary inadequacy. The term normative requirement in that report indicates the level of intake sufficient to maintain a desirable body store or reserve. In this report, in developing RDAs and AIs, emphasis is placed instead on the reasons underlying the choice of the criteria of nutritional adequacy used to establish requirements. They are not designated as basal or normative.
Unless otherwise stated, all values given for EARs, RDAs, and AIs represent the quantity of the nutrient or food component to be supplied by foods from diets similar to those consumed in Canada and the United States. If the food source of a nutrient is very different (as in diets of some ethnic groups) or if the source is supplements, adjustments may have to be made for differences in nutrient bioavailability. When this is an issue, it is discussed for the specific nutrient in the section “Special Considerations.”
RDAs and AIs are levels of intake recommended for individuals. They should reduce the risk of developing a condition that is associated with the nutrient in question and that has a negative functional outcome. The DRIs apply to the apparently healthy general population. Meeting the recommended intakes for the nutrients would not necessarily provide enough for individuals who are already malnourished, nor would they be adequate for certain disease states marked by increased nutritional requirements. Qualified medical and nutrition personnel must tailor recommendations for individuals who are known to have diseases that greatly increase nutritional requirements or who are at risk for developing adverse effects associated with higher intakes. Although the RDA or AI may serve as the basis for such guidance, qualified personnel should make necessary adaptations for specific situations
CATEGORIES OF DIETARY REFERENCE INTAKES
Each type of Dietary Reference Intake (DRI) refers to average daily nutrient intake of individuals over time. In most cases, the amount taken from day to day may vary substantially without ill effect.
Recommended Dietary Allowance
The Recommended Dietary Allowance (RDA) is the average daily dietary intake level that is sufficient to meet the nutrient requirement of nearly all (97 to 98 percent) healthy individuals in a particular life stage and gender group (see Figure 1-1). The RDA is intended to be used as a goal for daily intake by individuals. The process for setting the RDA is described below; it depends on being able to set an Estimated Average Requirement (EAR). That is, if an EAR cannot be set, no RDA will be set.
Estimated Average Requirement
The Estimated Average Requirement (EAR) is the daily intake value that is estimated to meet the requirement, as defined by the specified indicator or criterion of adequacy, of half of the apparently healthy individuals in a life stage or gender group (see Figure 1-1). A normal or symmetrical distribution (median and mean are simi-
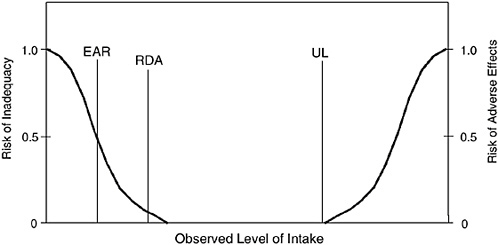
FIGURE 1-1 Dietary reference intakes. This figure shows that the Estimated Average Requirement (EAR) is the intake at which the risk of inadequacy is 0.5 (50 percent) to an individual. The Recommended Dietary Allowance (RDA) is the intake at which the risk of inadequacy is very small—only 0.02 to 0.03 (2 to 3 percent). The Adequate Intake (AI) does not bear a consistent relationship to the EAR or the RDA because it is set without the estimate of the requirement. At intakes between the RDA and the Tolerable Upper Intake Level (UL), the risks of inadequacy and of excess are both close to 0. At intakes above the UL, the risk of adverse effects may increase.
lar) is usually assumed for nutrient requirements. At this level of intake, half of the members of a specified group would not have their nutritional needs met. The general method used to set the EAR is the same for all the nutrients. For many of the nutrients, including those in this report, there are few direct data on the requirements of children. Thus, for such nutrients, EARs and RDAs for children are based on extrapolations from adult values. The methods used for extrapolation are described in Chapter 2.
Method for Setting the RDA When Nutrient Requirements Are Normally Distributed
If the requirement for the nutrient is normally distributed, and the standard deviation (SD) of the EAR is available, the RDA is defined as equal to the EAR plus 2 SDs of the EAR:
If data about variability in requirements are insufficient to calculate an SD, a coefficient of variation (CVEAR) of 10 percent will be ordinarily assumed and used to estimate the SD:
and
The resulting equation for the RDA is
or
The assumption of a 10 percent CV is based on extensive data on the variation in basal metabolic rate (FAO/WHO/UNA, 1985; Garby and Lammert, 1984), which contributes about two-thirds of the daily energy needs of many individuals residing in Canada and the United States (Elia, 1992), and on the similar CV of 12.5 percent estimated for the protein requirements in adults (FAO/WHO/ UNA, 1985).
Method for Setting the RDA When Nutrient Requirements Are Not Normally Distributed
When factorial modeling is used to estimate the distribution of requirements from the distributions of the individual components of requirement (e.g., losses, accretion), it is necessary to add the individual distributions. For normal component distributions, this is straightforward since the resultant distribution is also normal, with a mean that is the sum of the component means and a variance (the square of the SD) that is the sum of the individual variances. The ninety-seventh and one-half percentile is then estimated as the mean value plus two SDs.
If the requirement of a nutrient is not normally distributed but can be transformed to normality, its EAR and RDA can be estimated by transforming the data, calculating a fiftieth and a ninety-seventh and one-half percentile, and transforming these percentiles back into the original units. In this case, the difference between the EAR and the RDA cannot be used to obtain an estimate of the CV because skewing is usually present.
If normality cannot be assumed for all of the components of requirement, then Monte Carlo simulation is used for the summation of the components. This approach involves simulation of a large population of individuals (e.g., 100,000) each with his or her own requirement for a particular nutrient. To accomplish this, the component parts of nutrient needs (the factorial components) are treated as coming from independent random distributions.
For example, for basal losses of a nutrient, a distribution of expected losses can be generated. For each individual in the simulated population, a randomly selected basal loss value was drawn from that distribution of nutrient losses. This is done for each component of nutrient need and then these components are summed for each individual yielding the simulated nutrient needs. The total requirement is then calculated for each individual and the median and the ninety-seventh and one-half percentile calculated directly.
Information about the distribution of values for the requirement components is modeled on the basis of known physiology. Monte Carlo approaches may be used in the simulation of the distribution of components; or, where large data sets exist for similar populations (such as growth rates in infants), estimates of relative variability may be transferred to the component in the simulated population (Gentle, 1998). At each step, the goal is to achieve distribution values for the component that reflect not only known physiology or known direct observations, but also values that can be transformed
into a distribution that can be modeled and used in selecting random members to contribute to the final requirement distribution. When the final distribution representing the convolution of components has been derived, then the median and ninety-seventh and one-half percentile of the distribution can be directly estimated. It is recognized that, in its simplest form, the Monte Carlo approach ignores possible correlation among components. In the case of iron, however, expected correlation is built into the modeling of the requirement where components are linked to a common variable, such as growth rate, so that not all sources of correlation are neglected. These methods and their statistical basis are described in detail in the DRI report Dietary Reference Intakes: Applications in Dietary Assessment (IOM, 2000a).
Other Uses of the EAR
The EAR may also be used in the assessment of the intake of groups (IOM, 2000a) or, together with an estimate of the variance of intake, be used in planning for the intake of groups (IOM, 2003) (see Chapter 8).
Adequate Intake
If sufficient scientific evidence is not available to calculate an EAR, a reference intake called an Adequate Intake (AI) is provided instead of an RDA. The AI is a value based on experimentally derived intake levels or approximations of observed mean nutrient intakes by a group (or groups) of healthy people. The AIs for children and adults are expected to meet or exceed the amount needed to maintain a defined nutritional state or criterion of adequacy in essentially all members of a specific apparently healthy population. Examples of defined nutritional states include normal growth, maintenance of normal circulating nutrient values, or other aspects of nutritional well-being or general health.
As is the case in this report for determining the recommended intakes of water, potassium, sodium, and chloride, the AI is set when data are considered to be insufficient or inadequate to establish an EAR on which to base an RDA. For example, for young infants for whom human milk is the recommended sole source of food for almost all nutrients for the first 4 to 6 months, the AI is based on the daily mean nutrient intake supplied by human milk for healthy full-term infants who are exclusively fed human milk. For adults, the AI may be based on data from a single experiment, on esti-
mated dietary intakes in apparently healthy population groups, or on a review of data from different approaches that considered alone do not permit a reasonably confident estimate of an EAR.
Similarities Between the AI and the RDA
Both the AI and RDA are to be used as a goal for individual intake and thus both represent recommended levels of intake for individuals. In general, the values are intended to cover the needs of nearly all persons in a life stage group. (For infants, the AI is the mean intake when infants in the age group are consuming human milk. Larger infants may have greater needs, which they meet by consuming more milk.) As with RDAs, AIs for children and adolescents may be extrapolated from adult values if no other usable data are available.
Differences Between the AI and the RDA
There is much less certainty about the AI value than about the RDA value. Because AIs depend on a greater degree of judgment than is applied in estimating the EAR and subsequently the RDA, the AI may deviate significantly from and be numerically higher than the RDA. For this reason, AIs must be used with greater care than is the case for RDAs (see IOM, 2003). Also, the RDA is usually calculated from the EAR by using a formula that takes into account the expected variation in the requirement for the nutrient, which is not the case for some AIs (see previous section, “Estimated Average Requirement”).
For some nutrients and food components, data are not sufficient for developing either an AI or an RDA for apparently healthy individuals. This is the case for sulfate (Chapter 7), as its requirement appears to be met by consumption of the sulfur-containing amino acids methionine and cysteine, and adequate data are lacking to determine the extent to which inclusion of sulfate in the diet can decrease the requirements for these indispensable amino acids.
Tolerable Upper Intake Level
The Tolerable Upper Intake Level (UL) is the highest level of daily nutrient intake that is likely to pose no risk of adverse health effects for almost all apparently healthy individuals in the specified life stage group (see Figure 1-1). As intake increases above the UL, the potential risk of adverse effects may increase. The term tolerable in-
take was chosen to avoid implying a possible beneficial effect. Instead, the term is intended to connote a level of intake that can, with high probability, be tolerated biologically. The UL is not intended to be a recommended level of intake, and there is no established benefit to healthy individuals if they consume a nutrient in amounts exceeding the recommended intake (the RDA or AI).
The UL is based on an evaluation conducted by using the methodology for risk assessment of nutrients (see Chapter 3). The need for setting ULs grew out of the increased fortification of foods with nutrients and the use of dietary supplements by more people and in larger doses. The UL applies to chronic daily use. As in the case of applying AIs, professionals should avoid very rigid application of ULs and first assess the characteristics of the individual and group of concern, such as the source of the nutrient, the physiological state of the individual, the length of sustained high intakes, and so forth.
For some nutrients, data are not sufficient for developing a UL for apparently healthy individuals. This indicates the need for caution in consuming amounts greater than the recommended intakes; it does not mean that high intakes pose no risk of adverse effects.
The safety of routine, long-term intake above the UL is not well documented. Although members of the general population should be advised not to routinely exceed the UL, intake above the UL may be appropriate for investigation within well-controlled clinical trials. Clinical trials of doses above the UL should not be discouraged as long as subjects participating in these trials have signed informed consent documents regarding possible toxicity and as long as these trials employ appropriate safe monitoring of trial subjects.
Determination of Adequacy
In the derivation of the AIs in this report, close attention has been paid to the determination of the most appropriate indicators of adequacy. A key question is: Adequate for what? In many cases, a continuum of benefits may be ascribed to various levels of intake of the same nutrient. One criterion may be deemed the most appropriate to determine the risk that an individual will become deficient in the nutrient whereas another criterion chosen may relate to reducing the risk of chronic degenerative disease, such as blood pressure in relation to hypertension.
In other reports providing DRIs for nutrients (IOM, 1997, 1998, 2000b, 2001, 2002/2005), as for those included in this report, each EAR or AI is described in terms of the selected criterion. The po-
tential role of the nutrient in the reduction of disease risk was considered in developing the EARs and AIs. With the acquisition of additional data relating intake to chronic disease or disability, the choice of the criteria used for setting these DRIs may change.
PARAMETERS FOR DIETARY REFERENCE INTAKES
Life Stage Groups
The life stage groups described below were chosen by keeping in mind all of the nutrients to be reviewed, not only those included in this report (see IOM, 1997). Additional subdivisions within these groups may be added in later reports. If data are too sparse to distinguish differences in requirements by life stage or gender group, the analysis may be presented for a larger grouping.
Infancy
Infancy covers the period from birth through 12 months of age and is divided into two 6-month intervals. The first 6-month interval was not subdivided further because intake is relatively constant during this time. That is, as infants grow, they ingest more food; however, on a body weight basis their intake remains the same. During the second 6 months of life, growth velocity slows, and thus total daily nutrient needs on a body weight basis may be less than those during the first 6 months of life.
For a particular nutrient, the average intake by full-term infants who are born to healthy, well-nourished mothers and exclusively fed human milk has been adopted as the primary basis for deriving the AI for nutrients during the first 6 months of life. The value used is thus not an EAR, and it is not assumed that such data will become available. The extent to which intake of human milk in the amounts recommended may result in exceeding the actual requirements of the infant is not known, and ethics of experimentation preclude testing levels known to be potentially inadequate.
Using the infant that is fed human milk as a model is in keeping with the basis for estimating nutrient allowances of infants as was developed in the last Recommended Dietary Allowances (RDA) (NRC, 1989) and Recommended Nutrient Intakes (RNI) (Health Canada, 1990) reports. It also supports the recommendation that exclusive human milk feeding is the preferred method of feeding for normal full-term infants for the first 4 to 6 months of life. This recommendation has also been made by the Canadian Paediatric
Society (Health Canada, 1990), by the American Academy of Pediatrics (AAP, 1997), and in the Food and Nutrition Board report Nutrition During Lactation (IOM, 1991).
In general, special consideration was not given to possible variations in physiological need during the first month after birth or to the variations in intake of nutrients from human milk that result from differences in milk volume and nutrient concentration during early lactation. Specific recommended intakes to meet the needs of formula-fed infants are not proposed in this report. The previously published RDAs and RNIs for infants have led to much misinterpretation of the adequacy of human milk because of a lack of understanding about their derivation for young infants. Although they were based on human milk composition and volume of intake, the previous RDA and RNI values allowed for lower bioavailability of nutrients from nonhuman milk.
Ages 0 Through 6 Months. To derive the AI value for infants ages 0 through 6 months, the mean intake of a nutrient was calculated on the basis of the average concentration of the nutrient from 2 through 6 months of lactation with use of consensus values for the nutrient from several reported studies (Atkinson et al., 1995), and an estimated average volume of milk intake of 0.78 L/day as reported from studies of full-term infants by test weighing, a procedure in which the infant is weighed before and after each feeding (Butte et al., 1984; Chandra, 1984; Hofvander et al., 1982; Neville et al., 1988). Because there is variation in both of these measures, the computed value represents the mean. It is expected that infants will consume increased volumes of human milk as they grow.
Ages 7 Through 12 Months. Except for some nutrients such as iron and zinc, for which infants have relatively high requirements, there is no evidence for markedly different nutrient needs during the period of infants’ slower growth and gradual weaning to a mixed diet of human milk and solid foods from ages 7 through 12 months. The basis of the AI values derived for this age category was the sum of the specific nutrient provided by 0.6 L/day of human milk, which is the average volume of milk reported from studies in this age category (Heinig et al., 1993), and those provided by the usual intakes of complementary weaning foods consumed by infants of this age (Specker et al., 1997). This approach is in keeping with the current recommendations of the Canadian Paediatric Society (Health Canada, 1990), the American Academy of Pediatrics (AAP, 1997), and Nutrition During Lactation (IOM,
1991) for continued feeding of human milk to infants through 9 to 12 months of age with appropriate introduction of solid foods.
One problem that occurs in estimating intake data in infants is the lack of available data on total nutrient intake from a combination of human milk and solid foods in the second 6 months of life. Most intake survey data do not identify the milk source, but the published values for total intake indicate that cow milk or formula based on cow milk was most likely consumed along with weaning foods (Specker et al., 1997).
Toddlers: Ages 1 Through 3 Years
The greater velocity of growth in height during ages 1 through 3 years compared with ages 4 through 5 years provides a biological basis for dividing this period of life. Because children in the United States and Canada from age 4 years onwards begin to enter the public school system, ending this life stage prior to age 4 years seemed appropriate. Data are sparse for indicators of nutrient adequacy on which to derive DRIs for these early years of life. In some cases, DRIs for this age group were derived from data extrapolated from studies of infants or of adults ages 19 years and older.
Early Childhood: Ages 4 Through 8 Years
Because major biological changes in velocity of growth and changing endocrine status occur during ages 4 through 8 or 9 years (the latter depending on onset of puberty in each gender), the category of 4 through 8 years is appropriate. For many nutrients, but not those covered in this report, a reasonable amount of data is available on nutrient intake and various criteria for adequacy (such as nutrient balance measured in young children aged 5 through 7 years) that can be used as the basis for the EARs and AIs for this life stage group.
Puberty/Adolescence: Ages 9 Through 13 Years and 14 Through 18 Years
Because current data support younger ages for pubertal development, it was determined that the adolescent age group should begin at 9 years. The mean age of onset of breast development (Tanner Stage 2) for white girls in the United States is 10.0 ± 1.8 (standard deviation) years; this is a physical marker for the beginning of increased estrogen secretion (Herman-Giddens et al., 1997).
In African-American girls, onset of breast development is earlier (mean 8.9 years ± 1.9). The reason for the observed racial differences in the age at which girls enter puberty is unknown. The onset of the growth spurt in girls begins before the onset of breast development (Tanner, 1990). The age group of 9 through 13 years allows for this early growth spurt of females.
For boys, the mean age of initiation of testicular development is 10.5 to 11 years, and their growth spurt begins 2 years later (Tanner, 1990). Thus, to begin the second age category at 14 years and to have different EARs and AIs for girls and boys for some nutrients at this age seems biologically appropriate. All children continue to grow to some extent until as late as age 20 years; therefore, having these two age categories span the period 9 through 18 years of age seems justified.
Young Adulthood and Middle Ages: Ages 19 Through 30 Years and 31 Through 50 Years
The recognition of the possible value of higher nutrient intakes during early adulthood on achieving optimal genetic potential for peak bone mass was the reason for dividing adulthood into ages 19 through 30 years and 31 through 50 years. Moreover, mean energy expenditure decreases from 19 through 50 years, and needs for nutrients related to energy metabolism may also decrease. For some nutrients, such as sodium and potassium in this report, the DRIs may be the same for the two age groups. However, for other nutrients, especially those related to energy metabolism, EARs (and thus RDAs) and AIs are likely to differ for these two age groups.
Adulthood and Older Adults: Ages 51 Through 70 Years and Over 70 Years
The age period of 51 through 70 years spans active work years for most adults. After age 70 years, people of the same age increasingly display variability in physiological functioning and physical activity. A comparison of people over age 70 years who are the same chronological age may demonstrate as much as a 15- to 20-year age-related difference in level of reserve capacity and functioning. This is demonstrated by age-related declines in nutrient absorption and renal function. Because of the high variability in functional capacity of older adults, the EARs and AIs for this age group may reflect a greater variability in requirements for the older age categories. This
variability may be most applicable to nutrients for which requirements are related to energy expenditure.
Pregnancy and Lactation
Recommendations for pregnancy and lactation may be subdivided because of the many physiological changes and changes in nutrient needs that occur during these life stages. In setting EARs and AIs for these life stages, however, consideration is given to adaptations to increased nutrient demand, such as increased absorption and greater conservation of many nutrients. Moreover, nutrients may undergo net losses due to physiological mechanisms regardless of the nutrient intake such as seen with calcium in lactation (IOM, 1997). Thus, for some nutrients, there may not be a basis for EAR or AI values that are different during these life stages than they are for other women of comparable age.
Reference Heights and Weights
Use of Reference Heights and Weights
Reference heights and weights are useful when more specificity about body size and nutrient requirements are needed than that provided by life stage categories. For example, while the EAR may be developed for the 4- to 8-year-old age group, a small 4-year-old child may be assumed to require less than the EAR for that age group, whereas a large 8-year-old may require more than the EAR. Based on the model for establishing RDAs, however, the RDA (and an AI) should meet the needs of both.
In some cases, where data regarding nutrient requirements are reported on a body-weight basis, it is necessary to have reference heights and weights to transform the data for comparison purposes. Frequently, where data regarding adult requirements represent the only available data (e.g., on adverse effects of chronic high intakes for establishing Tolerable Upper Intake Levels [ULs]), extrapolating on the basis of body weight or size becomes a possible option to providing ULs for other age groups. Thus, for this and other reports, when data are not available, the EAR or UL for children or for pregnant women may be established by extrapolation from adult values on the basis of body weight. It should be noted that, depending on the nutrient, the value may also be extrapolated based on relative energy expenditure.
New Reference Heights and Weights
As is described in Appendix B, the DRI framework is an iterative process that was initiated in 1994. Thus reference heights and weights used in some of the earlier DRI reports for the U.S. and Canadian populations (IOM, 1997, 1998, 2000b, 2001) were developed based on data from the Third National Health and Nutrition Examination Survey on body mass index (BMI) for children and young adults (IOM, 1997). With the recent publication of new U.S.-based growth charts for infants and children and the introduction of BMI recommendations for adults (Kuczmarski et al., 2000), reference heights and weights for adults and children have been updated and are now used in more recent DRI reports (IOM, 2002/2005). Besides being more current, these new reference heights and weights are more representative of the U.S. and Canadian populations. Table 1-1 provides these updated values. Appendix B includes information about the reference values that were used in the earlier DRI reports.
TABLE 1-1 Current Reference Heights and Weights for Children and Adults in the United States
|
Sex |
Age |
Median Body Mass Indexa (kg/m2) |
Median Reference Heighta cm (in) |
Reference Weightb kg (lb) |
|
Male, female |
2–6 mo |
— |
62 (24) |
6 (13) |
|
|
7–12 mo |
— |
71 (28) |
9 (20) |
|
1–3 y |
— |
86 (34) |
12 (27) |
|
|
4–8 y |
15.3 |
115 (45) |
20 (44) |
|
|
Male |
9–13 y |
17.2 |
144 (57) |
36 (79) |
|
|
14–18 y |
20.5 |
174 (68) |
61 (134) |
|
19–30 y |
22.5 |
177 (70) |
70 (154) |
|
|
Female |
9–13 y |
17.4 |
144 (57) |
37 (81) |
|
|
14–18 y |
20.4 |
163 (64) |
54 (119) |
|
19–30 y |
21.5 |
163 (64) |
57 (126) |
|
|
aTaken from data on male and female median body mass index and height-for-age data from the Centers for Disease Control and Prevention (CDC)/National Center for Health Statistics (NCHS) Growth Charts (Kuczmarski et al., 2000). bCalculated from CDC/NCHS Growth Charts (Kuczmarski et al., 2000); median body mass index and median height for ages 4 through 19 years. |
||||
SUMMARY
Dietary Reference Intakes (DRIs) is a generic term for a set of nutrient reference values that includes the Estimated Average Requirement, the Recommended Dietary Allowance, the Adequate Intake, and the Tolerable Upper Intake Level. These reference values are being developed for specific life stage and gender groups in a joint U.S. and Canadian activity. This report—one volume in a series—covers the DRIs for water and the electrolytes potassium, sodium, chloride, and sulfate.
REFERENCES
AAP (American Academy of Pediatrics). 1997. Breastfeeding and the use of human milk. Pediatrics 100:1035–1039.
Atkinson SA, Alston-Mills BP, Lonnerdal B, Neville MC, Thompson M. 1995. Major minerals and ionic constituents of human and bovine milk. In: Jensen RJ, ed. Handbook of Milk Composition. San Diego, California: Academic Press. Pp. 593–619.
Butte NF, Garza C, Smith EO, Nichols BL. 1984. Human milk intake and growth in exclusively breast-fed infants. J Pediatr 104:187–195.
Chandra RK. 1984. Physical growth of exclusively breast-fed infants. Nutr Res 2:275–276.
Elia M. 1992. Energy expenditure and the whole body. In: Kenney JM, Tucker HN, eds. Energy Metabolism: Tissue Determinants and Cellular Corollaries. New York: Raven Press. Pp. 19–59.
FAO/WHO/UNA (Food and Agriculture Organization of the United Nations/World Health Organization/United Nations Association). 1985. Energy and Protein Requirements. Report of a Joint FAO/WHO/UNA Expert Consultation. Technical Report Series. No. 724. Geneva: WHO.
Garby L, Lammert O. 1984. Within-subjects between-days-and-weeks variation in energy expenditure at rest. Hum Nutr Clin Nutr 38:395–397.
Gentle JE. 1998. Random Number Generation and Monte Carlo Methods. New York: Springer-Verlag.
Health Canada. 1990. Nutrition Recommendations. The Report of the Scientific Review Committee 1990. Ottawa: Canadian Government Publishing Centre.
Heinig MJ, Nommsen LA, Peerson JM, Lonnerdal B, Dewey KG. 1993. Energy and protein intakes of breast-fed and formula-fed infants during the first year of life and their association with growth velocity: The DARLING Study. Am J Clin Nutr 58:152–161.
Herman-Giddens ME, Slora EJ, Wasserman RC, Bourdony CJ, Bhapkar MV, Koch GG, Hasemeier CM. 1997. Secondary sexual characteristics and menses in young girls seen in office practice: A study from the Pediatric Research in Office Settings Network. Pediatrics 99:505–512.
Hofvander Y, Hagman U, Hillervik C, Sjolin S. 1982. The amount of milk consumed by 1–3 months old breast- or bottle-fed infants. Acta Paediatr Scand 71:953–958.
IOM (Institute of Medicine). 1991. Nutrition During Lactation. Washington, DC: National Academy Press.
IOM. 1997. Dietary Reference Intakes for Calcium, Phosphorus, Magnesium, Vitamin D, and Fluoride. Washington, DC: National Academy Press.
IOM. 1998. Dietary Reference Intakes for Thiamin, Riboflavin, Niacin, Vitamin B6, Folate, Vitamin B12, Pantothenic Acid, Biotin, and Choline. Washington, DC: National Academy Press.
IOM. 2000a. Dietary Reference Intakes: Applications in Dietary Assessment. Washington, DC: National Academy Press.
IOM. 2000b. Dietary Reference Intakes for Vitamin C, Vitamin E, Selenium, and Carotenoids. Washington, DC: National Academy Press.
IOM. 2001. Dietary Reference Intakes for Vitamin A, Vitamin K, Arsenic, Boron, Chromium, Copper, Iodine, Iron, Manganese, Molybdenum, Nickel, Silicon, Vanadium, and Zinc. Washington, DC: National Academy Press.
IOM. 2002/2005. Dietary Reference Intakes for Energy, Carbohydrate, Fiber, Fat, Fatty Acids, Cholesterol, Protein, and Amino Acids. Washington, DC: The National Academies Press.
IOM. 2003. Dietary Reference Intakes: Applications in Dietary Planning. Washington, DC: The National Academies Press.
Kuczmarski RJ, Ogden CL, Grummer-Strawn LM, Flegal KM, Guo SS, Wei R, Mei Z, Curtin LR, Roche AF, Johnson CL. 2000. CDC growth charts: United States. Advance Data from Vital and Health Statistics 314:1–28. Hyattsville, MD: National Center for Health Statistics.
Neville MC, Keller R, Seacat J, Lutes V, Neifert M, Casey C, Allen J, Archer P. 1988. Studies in human lactation: Milk volumes in lactating women during the onset of lactation and full lactation. Am J Clin Nutr 48:1375–1386.
NRC (National Research Council). 1989. Recommended Dietary Allowances, 10th ed. Washington, DC: National Academy Press.
Specker BL, Beck A, Kalkwarf H, Ho M. 1997. Randomized trial of varying mineral intake on total body bone mineral accretion during the first year of life. Pediatrics 99:E12.
Tanner JM. 1990. Growth at Adolescence. Oxford: Oxford University Press.
WHO (World Health Organization). 1996. Trace Elements in Human Nutrition and Health. Geneva: WHO.


