
C
Predictions of Daily Water and Sodium Requirements
To generate estimates of water and sodium losses at different energy expenditure levels and thus work rates, the U.S. Army Research Institute of Environmental Medicine (USARIEM) model was adapted for the four levels of energy expenditure identified in the Dietary Reference Intakes report on energy expenditure (IOM, 2002/2005). The USARIEM Heat Strain model is an empirical model that includes an equation to predict sweating rate during work (Moran et al., 1995, Shapiro et al., 1995). This algorithm has been used in the past to prepare military guidance for water needs during training and deployment.
The following is a description of the application of the model:
-
Variables
-
Water requirements (L/d)
-
Sodium requirements (g/d)
-
-
Prediction ranges
-
Four energy expenditure levels (1,900; 2,400; 2,900; and 3,600 kcal/d)
-
Temperature ranges (15°–40°C)
ANALYSIS
As shown in the example, the environmental, physiological, and individual information was inputted into the model. For any given individual, physiological, or environmental condition, the model predicted expected water losses. These data were then put into an
Excel 4.0 spreadsheet and used to generate the dataset of estimated water and sodium requirements at varying energy expenditure levels and temperatures. Environmental and individual assumptions are listed below. These data were then plotted using Sigma Plot 9.0 to generate a graphical display.
ASSUMPTIONS
-
Individual
-
70-kg person
-
Height = 170 cm
-
Walking velocity = 5 km/h
-
0% grade
-
Clothing = 1.0 (cotton)
-
-
Environmental
-
Partly cloudy day
-
Wind speed = 1 m/sec
-
Relative humidity = 50%
-
Outdoor
-
Water vapor pressure = 19.094 mm Hg
-
Load = 0 kg
-
Dry bulb temperature = 30°C
-
Black globe temperature = 45°C
-
-
Physiological
-
Skin body temperature = 35.0°C
-
Rectal body temperature = 36.5°C
-
Initial heart rate = 60 bpm
-
Rest (N)
-
Exposure I = 720 min (= 12 h)
-
Exposure II = 720 min (= 12 h)
-
Exposure III (min) = 0
-
Exposure IV (min) = 0
-
-
1.0 L/d minimal requirements for survival:
-
Sodium concentration of sweat (≈ 35 mmol/L), that of a partially acclimated person
Example (not used in this analysis):
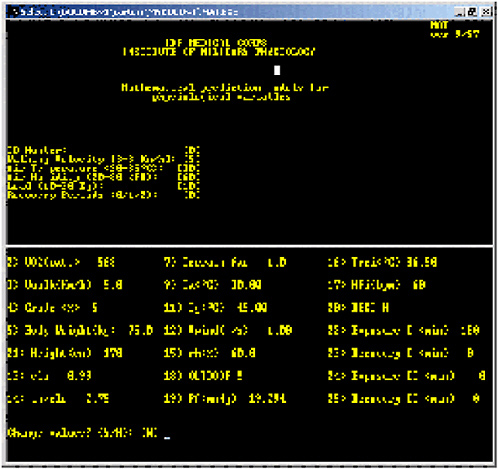
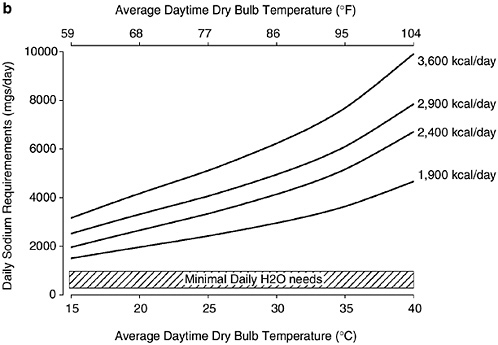
The version of the program used was MAT version 9/97. Figures C-1a and C-1b describe the approximate daily water (Figure C-1a) and sodium (Figure C-1b) lost due to sweating as a function of dry bulb temperature and level of physical activity derived from modeling data (Table C-1).
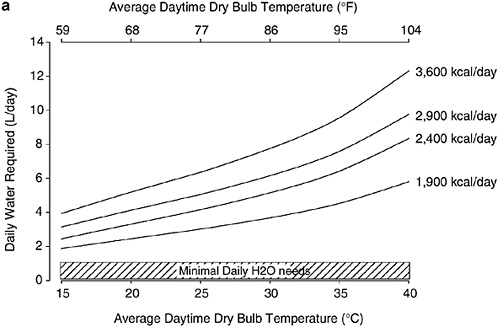
FIGURE C-1 Approximate daily water (Figure C-1a) and sodium (Figure C-1b) lost due to sweating as a function of dry bulb temperature and level of physical activity derived from modeling data (Table C-1). The hatched area indicates ≈ 1 L minimal water requirements. The y-axis represents the predicted water requirements that increase because of increased sweat losses to enable thermoregulation. The x-axis is the average daytime dry bulb temperature. The four lines represent the four levels of energy (in kcal/day) used in the model (1,900 kcal; 2,400 kcal; 2,900 kcal; and 3,600 kcal).
REFERENCES
IOM (Institute of Medicine). 2002/2005. Dietary Reference Intakes for Energy, Carbohydrate, Fiber, Fat, Fatty Acids, Cholesterol, Protein, and Amino Acids. Washington, DC: The National Academies Press.
Moran D, Shapiro Y, Epstein Y, Burstein R, Stroschein L, Pandolf KB. 1995. Validation and adjustment of the mathematical prediction model for human rectal temperature responses to outdoor environmental conditions. Ergonomics 38:1011–1018.
Shapiro Y, Moran D, Epstein Y, Stroschein L, Pandolf KB. 1995. Validation and adjustment of the mathematical prediction model for human sweat rate responses to outdoor environmental conditions. Ergonomics 38:981–986.
TABLE C-1 Generated Database from the USARIEM Prediction Model
|
Given: |
kcal/h |
watts |
per 12 h (kcal) |
|
Rest |
76 |
88 |
912 |
|
Light |
234 |
273 |
2,808 |
|
Mod |
382 |
444 |
4,582 |
|
Hard |
531 |
618 |
6,372 |
|
Assumption: 1.0 liter water essential (daily resp water loss and kidney loss) |
|||||
|
Predicted Sweating Rates (mL/h) |
|||||
|
Air Tdb |
Rh |
Rest |
Light |
Mod |
Hard |
|
10 |
50 |
32 |
100 |
355 |
628 |
|
15 |
50 |
65 |
204 |
456 |
722 |
|
20 |
50 |
108 |
339 |
618 |
911 |
|
25 |
50 |
151 |
473 |
763 |
1,069 |
|
30 |
50 |
201 |
629 |
938 |
1,263 |
|
35 |
50 |
265 |
829 |
1,168 |
1,524 |
|
40 |
50 |
361 |
1,129 |
1,524 |
1,934 |
|
12 h Air |
Scenario |
|||||
|
Rest |
Light |
Mod |
Hard |
Kcal |
Water Loss |
|
|
10 |
0.95 |
0.05 |
0 |
0 |
1,006.8 |
425 |
|
15 |
0.95 |
0.05 |
0 |
0 |
1,006.8 |
867 |
|
20 |
0.95 |
0.05 |
0 |
0 |
1,006.8 |
1,440 |
|
25 |
0.95 |
0.05 |
0 |
0 |
1,006.8 |
2,009 |
|
30 |
0.95 |
0.05 |
0 |
0 |
1,006.8 |
2,672 |
|
35 |
0.95 |
0.05 |
0 |
0 |
1,006.8 |
3,522 |
|
40 |
0.95 |
0.05 |
0 |
0 |
1,006.8 |
4,796 |
|
WBGT |
Rest |
Light |
Mod |
Hard |
Kcal |
Water Loss |
|
9.9 |
0.7 |
0.25 |
0.05 |
0 |
1,570 |
782 |
|
14.2 |
0.7 |
0.25 |
0.05 |
0 |
1,570 |
1,434 |
|
18.8 |
0.7 |
0.25 |
0.05 |
0 |
1,570 |
2,299 |
|
23.1 |
0.7 |
0.25 |
0.05 |
0 |
1,570 |
3,148 |
|
27.4 |
0.7 |
0.25 |
0.05 |
0 |
1,570 |
4,141 |
|
31.7 |
0.7 |
0.25 |
0.05 |
0 |
1,570 |
5,416 |
|
36.2 |
0.7 |
0.25 |
0.05 |
0 |
1,570 |
7,336 |
|
Hard |
A:J13 |
|
khard |
A:E7 |
|
klight |
A:E5 |
|
kmod |
A:E6 |
|
krest |
A:E4 |
|
light |
A:H13 |
|
mod |
A:I13 |
|
Rest |
A:G13 |
|
sr |
A:E13.I20 |
|
WBGT |
A:F13 |
|
ttl kcal |
ttl water loss |
|
||
|
1,918.8 |
1.4 |
35 |
23 |
1,147 |
|
1,918.8 |
2.4 |
35 |
23 |
1,905 |
|
1,918.8 |
2.9 |
35 |
23 |
2,367 |
|
1,918.8 |
3.5 |
35 |
23 |
2,825 |
|
1,918.8 |
4.2 |
35 |
23 |
3,358 |
|
1,918.8 |
5.0 |
35 |
23 |
4,042 |
|
1,918.8 |
6.3 |
35 |
23 |
5,068 |
|
ttl kcal |
ttl water loss |
|
||
|
2,481.5 |
2.3 |
35 |
23 |
1,837 |
|
2,481.5 |
2.9 |
35 |
23 |
2,362 |
|
2,481.5 |
3.8 |
35 |
23 |
3,058 |
|
2,481.5 |
4.6 |
35 |
23 |
3,742 |
|
2,481.5 |
5.6 |
35 |
23 |
4,541 |
|
2,481.5 |
6.9 |
35 |
23 |
5,568 |
|
2,481.5 |
8.8 |
35 |
23 |
7,113 |
|
WBGT |
Rest |
Light |
Mod |
Hard |
Kcal |
Water Loss |
|
9.9 |
0.65 |
0.15 |
0.15 |
0.05 |
2,020 |
1,445 |
|
14.2 |
0.65 |
0.15 |
0.15 |
0.05 |
2,020 |
2,130 |
|
18.8 |
0.65 |
0.15 |
0.15 |
0.05 |
2,020 |
3,115 |
|
23.1 |
0.65 |
0.15 |
0.15 |
0.05 |
2,020 |
4,047 |
|
27.4 |
0.65 |
0.15 |
0.15 |
0.05 |
2,020 |
5,148 |
|
31.7 |
0.65 |
0.15 |
0.15 |
0.05 |
2,020 |
6,578 |
|
36.2 |
0.65 |
0.15 |
0.15 |
0.05 |
2,020 |
8,754 |
|
WBGT |
Rest |
Light |
Mod |
Hard |
Kcal |
Water Loss |
|
9.9 |
0.45 |
0.25 |
0.2 |
0.1 |
2,666 |
2,078 |
|
14.2 |
0.45 |
0.25 |
0.2 |
0.1 |
2,666 |
2,925 |
|
18.8 |
0.45 |
0.25 |
0.2 |
0.1 |
2,666 |
4,179 |
|
23.1 |
0.45 |
0.25 |
0.2 |
0.1 |
2,666 |
5,350 |
|
27.4 |
0.45 |
0.25 |
0.2 |
0.1 |
2,666 |
6,741 |
|
31.7 |
0.45 |
0.25 |
0.2 |
0.1 |
2,666 |
8,552 |
|
36.2 |
0.45 |
0.25 |
0.2 |
0.1 |
2,666 |
11,316 |
|
ttl kcal |
ttl water loss |
|
||
|
2,931.9 |
2.9 |
35 |
23 |
2,371 |
|
2,931.9 |
3.6 |
35 |
23 |
2,922 |
|
2,931.9 |
4.6 |
35 |
23 |
3,715 |
|
2,931.9 |
5.5 |
35 |
23 |
4,465 |
|
2,931.9 |
6.6 |
35 |
23 |
5,352 |
|
2,931.9 |
8.1 |
35 |
23 |
6,503 |
|
2,931.9 |
10.3 |
35 |
23 |
8,254 |
|
ttl kcal |
ttl water loss |
|
||
|
3,578 |
3.6 |
35 |
23 |
2,881 |
|
3,578 |
4.4 |
35 |
23 |
3,562 |
|
3,578 |
5.7 |
35 |
23 |
4,572 |
|
3,578 |
6.9 |
35 |
23 |
5,515 |
|
3,578 |
8.2 |
35 |
23 |
6,634 |
|
3,578 |
10.1 |
35 |
23 |
8,091 |
|
3,578 |
12.8 |
35 |
23 |
10,317 |


