
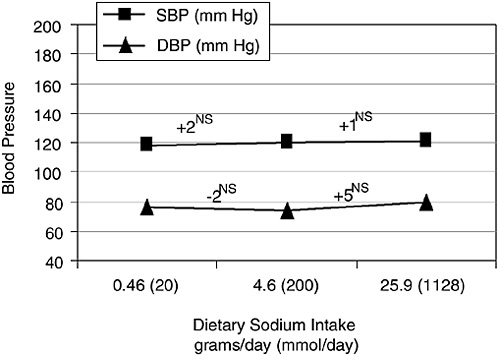
FIGURE I-2 Blood pressure (mm Hg) according to dietary sodium intake in g/d (mmol/d) among 6 normotensive subjects at risk of hypertension. Each sodium level was provided for 4 d. Systolic blood pressures were calculated from the formula mean blood pressure = 2/3 diastolic blood pressure + 1/3 systolic blood pressure. NS = not significantly different; *p < 0.001; **p < 0.05. Data from Sullivan et al. (1980).
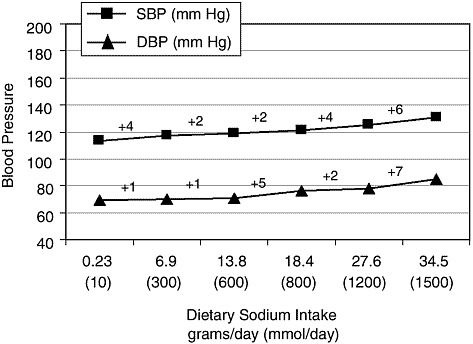
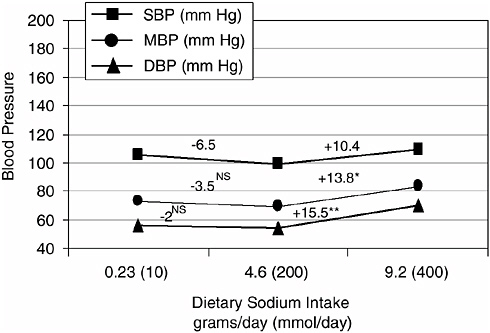
FIGURE I-3 Blood pressure (mm Hg) according to dietary sodium intake in g/d (mmol/d) among 14 normotensive men. Each sodium level was provided for 3–7 d. Significant difference between 10 and 800 mmol/d (p < 0.05). Data from Luft et al. (1979).
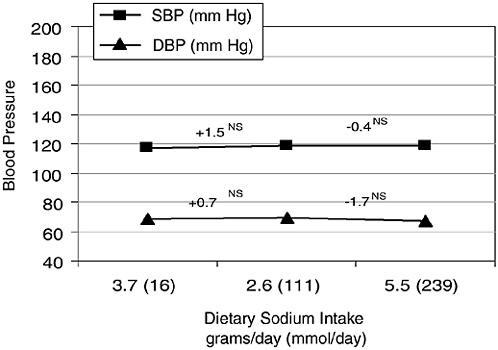
FIGURE I-4 Blood pressure (mm Hg) according to dietary sodium intake in g/d (mmol/d) among 11 normotensive men and women with a family history of hypertension. Each sodium level was provided for 9 d. NS = not significantly different. Data from Fuchs et al. (1987).
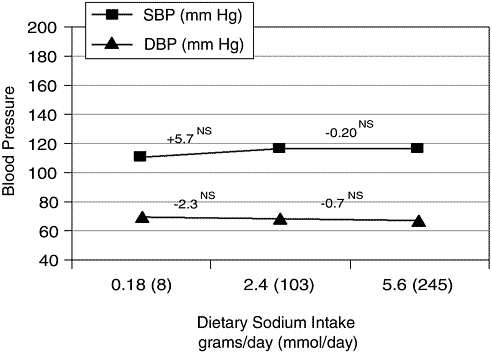
FIGURE I-5 Blood pressure (mm Hg) according to dietary sodium intake in g/d (mmol/d) among 6 normotensive men and women without family history of hypertension. Each sodium level was provided for 9 d. NS = not significantly different. Data from Fuchs et al. (1987).
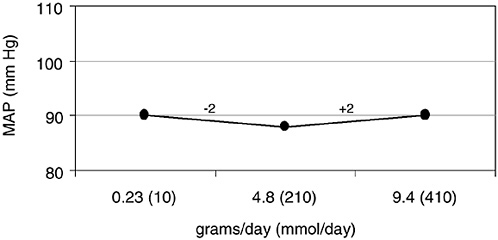
FIGURE I-6 Mean supine blood pressure (mm Hg) according to dietary sodium intake in g/d (mmol/d) among 8 normotensive men. Each sodium level was provided for 4 wk. NS = not significantly different. Data from Kirkendall et al. (1976).
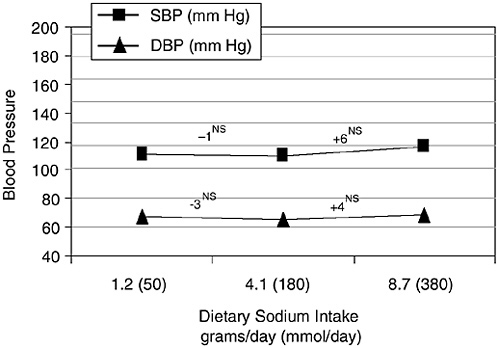
FIGURE I-7 Blood pressure (mm Hg) according to dietary sodium intake in g/d (mmol/d) among 10 normotensive men and women. Each sodium level was provided for 4 d. NS = not significantly different. Data from Bruun et al. (1990).
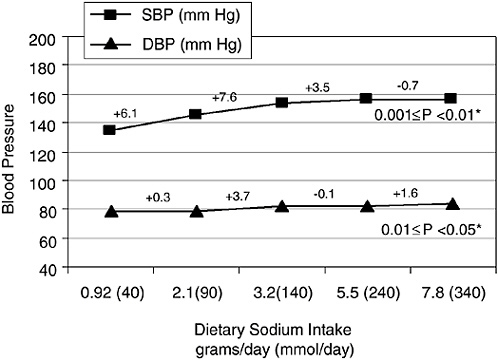
FIGURE I-8 Blood pressure (mm Hg) according to sodium intake in g/d (mmol/d) among 17 normotensive elderly subjects. Each sodium level was provided for 2 wk. *P-ANOVA simultaneously comparing the four pair-wise blood pressure differences between the lowest sodium level (baseline) and each of the four higher sodium levels. Data from Johnson et al. (2001).
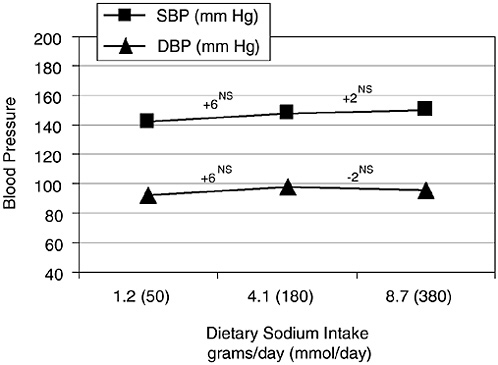
FIGURE I-9 Blood pressure (mm Hg) according to dietary sodium intake in g/d (mmol/d) among 12 hypertensive men and women. Each sodium level was provided for 4 d. NS = not significantly different. Data from Bruun et al. (1990).
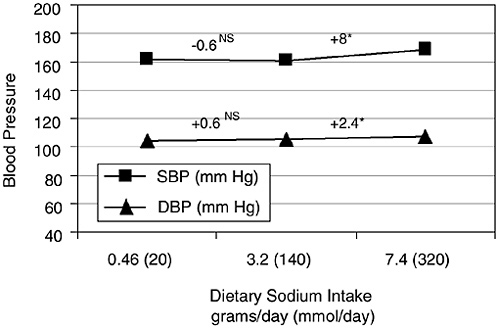
FIGURE I-10 Blood pressure (mm Hg) according to dietary sodium intake in g/d (mmol/d) among 61 hypertensive men. Each sodium level was provided for 2 wk. NS = not significantly different; *p < 0.05. Data from Ferri et al. (1996).
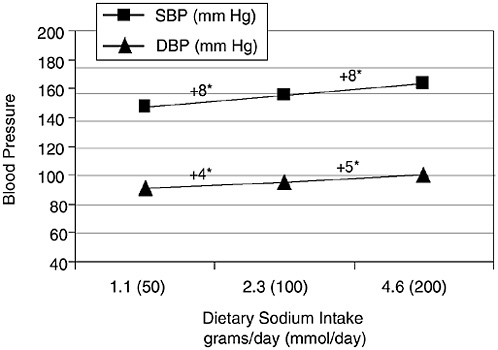
FIGURE I-11 Blood pressure (mm Hg) according to dietary sodium intake in g/d (mmol/d) among 20 hypertensive men and women. Each sodium level was provided for 4 wk. *p < 0.01. Data from MacGregor et al. (1989).
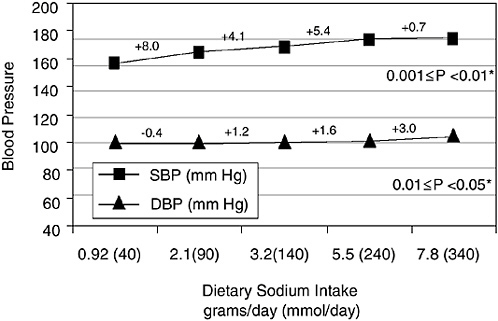
FIGURE I-12 Blood pressure (mm Hg) according to sodium intake in g/d (mmol/ d) among 8 systolic diastolic hypertensive elderly subjects. Each sodium level was provided for 2 wk. *P-ANOVA simultaneously comparing the four pair-wise blood pressure differences between the lowest sodium level (baseline) and each of the four higher sodium levels. Data from Johnson et al. (2001).
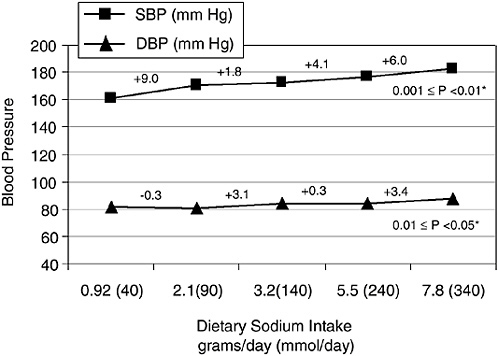
FIGURE I-13 Blood pressure (mm Hg) according to sodium dose in g/d (mmol/ d) among 15 isolated systolic hypertensive elderly subjects. Each sodium dose was provided for 2 wk. *P-ANOVA simultaneously comparing the four pair-wise blood pressure differences between the lowest sodium level (baseline) and each of the four higher sodium levels. Data from Johnson et al. (2001).
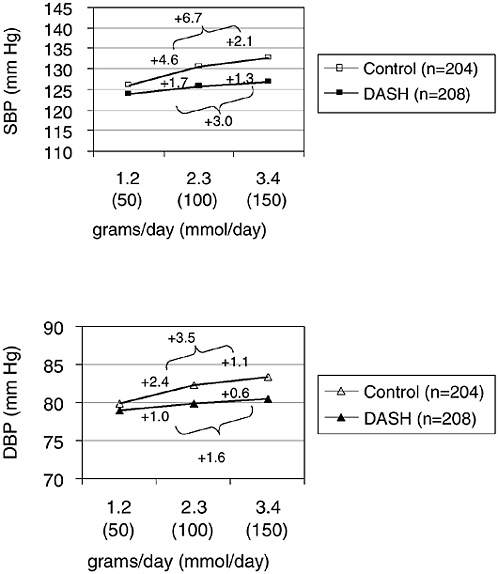
FIGURE I-14 Analyses from the Dietary Approaches to Stop Hypertension (DASH)-Sodium Trial: Effect of sodium level on systolic and diastolic blood pressure in 412 normotensives and hypertensive participants. Sodium levels defined as higher = 3.5 g/d/2,000 kcal (150 mmol/d), intermediate = 2.3 g/d/2,000 kcal (100 mmol/d), and lower = 1.2 g/d/2,000 kcal (50 mmol/d). Adapted with permission from Sacks et al. (2001). Copyright 2001 by the Massachusetts Medical Society.
TABLE I-1a Mean Blood Pressure by Diet and by Sodium Level, Dietary Approaches to Stop Hypertension (DASH)-Sodium Trial
|
Diet |
Systolic |
Diastolic |
||||
|
Higher |
Intermediate |
Lower |
Higher |
Intermediate |
Lower |
|
|
Control diet (n = 204) |
132.8 |
130.7 |
126.1 |
83.4 |
82.3 |
79.9 |
|
DASH diet (n = 208) |
126.9 |
125.6 |
123.9 |
80.5 |
79.9 |
78.9 |
|
SOURCE: Sacks et al. (2001). |
||||||
TABLE I-1b Effect of Decreased Sodium on Systolic and Diastolic Blood Pressure, Control Diet (n = 204) in DASH-Sodium Trial
|
|
Systolic |
Diastolic |
||||
|
Mean Change |
Standard Error |
P-value |
Mean Change |
Standard Error |
P-value |
|
|
Higher to lower |
−6.7 |
0.58 |
< 0.0001 |
−3.5 |
0.38 |
< 0.0001 |
|
Higher to intermediate |
−2.1 |
0.58 |
0.0003 |
−1.1 |
0.38 |
0.0044 |
|
Intermediate to lower |
−4.6 |
0.60 |
< 0.0001 |
−2.4 |
0.39 |
< 0.0001 |
|
SOURCE: Sacks et al. (2001). |
||||||
TABLE I-1c Effect of Decreased Sodium on Systolic and Diastolic Blood Pressure, DASH Diet (n = 208), in DASH-Sodium Trial
|
|
Systolic |
Diastolic |
||||
|
Mean Change |
Standard Error |
P-value |
Mean Change |
Standard Error |
P-value |
|
|
Higher to lower |
−3.0 |
0.58 |
< 0.0001 |
−1.6 |
0.37 |
< 0.0001 |
|
Higher to intermediate |
−1.3 |
0.58 |
0.03 |
−0.6 |
0.37 |
0.09 |
|
Intermediate to lower |
−1.7 |
0.59 |
0.003 |
−1.0 |
0.38 |
0.01 |
|
SOURCE: Sacks et al. (2001). |
||||||
TABLE I-2 Design Features of Dose-Response Trials that Tested the Effects of Sodium Intake on Blood Pressure
|
Study |
Figure (Appendix I) |
Reference |
N |
|
Nonhypertensive |
|||
|
1 |
1 |
Roos et al. (1985) |
8 |
|
2 |
2 |
Sullivan et al. (1980) |
6 |
|
3 |
3 |
Luft et al. (1979) |
14 |
|
4 |
4 |
Fuchs et al. (1987), at risk of hypertension |
17 |
|
|
5 |
Fuchs et al. (1987), not at risk of hypertension |
17 |
|
5 |
6 |
Kirkendall et al. (1976) |
8 |
|
6 |
7 |
Bruun et al. (1990) |
10 |
|
7 |
8 |
Johnson et al. (2001) |
17 |
|
Hypertensive |
|||
|
|
9 |
Bruun et al. (1990) |
12 |
|
8 |
10 |
Ferri et al. (1996) |
61 |
|
9 |
11 |
MacGregor et al. (1989) |
20 |
|
|
12 |
Johnson et al. (2001), systolic-diastolic hypertension |
8 |
|
|
13 |
Johnson et al. (2001), isolated systolic hypertension |
15 |
|
Both nonhypertensive and hypertensive |
|||
|
10 |
14 |
Sacks et al. (2001) DASHc diet Control diet 204 |
208 |
|
a Urinary sodium. b Urinary potassium. c DASH = Dietary Approaches to Stop Hypertension. |
|||
REFERENCES
Bruun NE, Skott P, Nielsen MD, Rasmussen S, Schutten HJ, Leth A, Pedersen EB, Giese J. 1990. Normal renal tubular response to changes of sodium intake in hypertensive man. J Hypertens 8:219–227.
Ferri C, Bellini C, Carlomagno A, Desideri G, Santucci A. 1996. Active kallikrein response to changes in sodium-chloride intake in essential hypertensive patients. J Am Soc Nephrol 7:443–453.
Fuchs FD, Wannmacher CM, Wannmacher L, Guimaraes FS, Rosito GA, Gastaldo G, Hoeffel CP, Wagner EM. 1987. Effect of sodium intake on blood pressure, serum levels and renal excretion of sodium and potassium in normotensives with and without familial predisposition to hypertension. Braz J Med Biol Res 20:25–34.
Johnson AG, Nguyen TV, Davis D. 2001. Blood pressure is linked to salt intake and modulated by the angiotensinogen gene in normotensive and hypertensive elderly subjects. J Hypertens 19:1053–1060.
Kirkendall WM, Conner EW, Abboud F, Rastogi SP, Anderson TA, Fry M. 1976. The effect of dietary sodium chloride on blood pressure, body fluids, electro-
|
Duration (days) |
Feeding Study |
Design |
Range of Sodium g/d (mmol/d) |
Potassium Level g/d (mmol/d) |
|
|
Lowest |
Highest |
||||
|
5 |
Yes |
Dose-escalation |
0.46 (20) |
25.9 (1,128) |
3.1 (80) |
|
4 |
Yes |
Crossover |
0.23 (10) |
9.2 (400) |
2.3 (60) |
|
3–7 |
Yes |
Dose-escalation |
0.23 (10) |
34.5 (1,500) |
3.1 (80) |
|
9 |
No |
Crossover |
3.7 (16)a |
5.5 (239)a |
≈ 1.9 (50)b |
|
9 |
No |
Crossover |
0.18 (8)a |
5.6 (245)a |
≈ 1.9 (50)b |
|
28 |
Yes |
Crossover |
0.23 (10) |
9.4 (410) |
3.9 (100) |
|
4 |
Yes |
Crossover |
1.2 (50) |
8.7 (380) |
3.1 (80) |
|
14 |
Yes |
Crossover |
0.92 (40) |
7.8 (340) |
≈ 1.2 (30)b |
|
4 |
Yes |
Crossover |
1.2 (50) |
8.7 (380) |
3.1 (80) |
|
14 |
Yes |
Crossover |
0.46 (20) |
7.4 (320) |
2.7 (70) |
|
28 |
No |
Crossover |
1.2 (50) |
4.6 (200) |
2.7 (70) |
|
14 |
Yes |
Crossover |
0.92 (40) |
7.8 (340) |
≈ 1.2 (30)b |
|
14 |
Yes |
Crossover |
0.92 (40) |
7.8 (340) |
≈ 1.2 (30)b |
|
28 |
Yes |
Crossover |
1.5 (67)a |
3.3 (144) |
3.1 (79)b |
|
28 |
Yes |
Crossover |
1.5 (64)a |
3.2 (141)a |
1.6 (41)b |
lytes, renal function, and serum lipids of normotensive man. J Lab Clin Med 87:418–434.
Luft FC, Rankin LI, Bloch R, Weyman AE, Willis LR, Murray RH, Grim CE, Weinberger MH. 1979. Cardiovascular and humoral responses to extremes of sodium intake in normal black and white men. Circulation 60:697–706.
MacGregor GA, Markandu ND, Sagnella GA, Singer DRJ, Cappuccio FP. 1989. Double-blind study of three sodium intakes and long-term effects of sodium restriction in essential hypertension. Lancet 2:1244–1247.
Roos JC, Koomans HA, Dorhout-Mees EJ, Delawi IMK 1985. Renal sodium handling in normal humans subjected to low, normal, and extremely high sodium supplies. Am J Physiol 249:F941–F947.
Sacks FM, Svetkey LP, Vollmer WM, Appel LJ, Bray GA, Harsha D, Obarzanek E, Conlin PR, Miller ER, Simons-Morton DG, Karanja N, Lin PH. 2001. Effects of blood pressure of reduced dietary sodium and the Dietary Approaches to Stop Hypertension (DASH) diet. N Engl J Med 344:3–10.
Sullivan JM, Ratts TE, Taylor JC, Kraus DH, Barton BR, Patrick DR, Reed SW. 1980. Hemodynamic effects of dietary sodium in man. Hypertension 2:506–514.


