
3
Selection of NSIP Base Gage Locations
Chapter 2 showed that the U.S. Geological Survey (USGS) has a long history of gaging streams to meet national needs such as water supply, food supply, power supply, public safety, defense, and many others. Due to finite resources, the USGS has had to prioritize these many needs. This chapter discusses the criteria that the USGS used for locating National Streamflow Information Program (NSIP) base gaging sites to meet what it believed were the five most important national needs, or goals:
-
Meeting Legal and Treaty Obligations on Interstate and International Waters (to monitor legal requirements for deliveries of water at state and national borders; presently 515 gage sites according to http://water.usgs.gov/nsip/nsipmaps/federalgoals.html)
-
Flow Forecasting (sites needed for validation and improvement of forecasts where the National Weather Service and other federal agencies carry out flood or water supply forecasts; 3,244 gage sites)
-
Measuring River Basin Outflows (for calculating regional water balances over the nation; 450 gage sites)
-
Monitoring Sentinel Watersheds (for determining long-term trends in streamflow across the country; 874 gage sites)
-
Measuring Flow for Water Quality Needs (for characterizing the quality of surface waters; 210 gage sites)
A total of 5,293 gage sites are listed under the five criteria but some gage sites serve more than one criterion, so the actual number of gage sites presently identified as NSIP base gages is 4,424 (Figure 3-1). This NSIP base gage network is proposed to be funded 100 percent by the federal government.
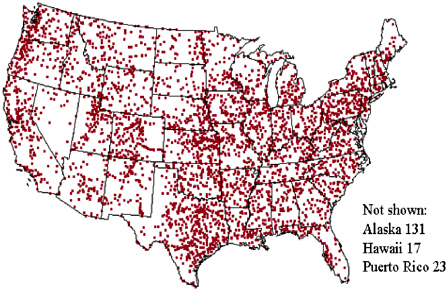
FIGURE 3-1 Locations of the 4,424 gage sites presently identified as NSIP base gages. SOURCE: Based on USGS data (http://water.usgs.gov/nsip).
Of the 4,424 base NSIP gage sites, 2,796 or 63 percent are active USGS gaging locations; 307, or 7 percent, are active gage sites operated by other agencies for which the USGS wants to assume the full costs of operation; 837, or 19 percent, are inactive gages (sites where a gage once operated but no longer does); and 484, or 11 percent, are new gage sites (Figure 3-2). Thus, 3,103, or 70 percent, of all gages presently envisaged for the NSIP are existing gages operated by the USGS or other agencies, and 1,321, or 30 percent, are inactive or proposed new gage sites.
In addition to these 3,103 currently operational gages that comprise the base network and would be 100 percent federally funded, the NSIP includes all of the other currently active, USGS-operated gages. Presently, active USGS-operated gages total about 7,300. Thus, there are many thousands of USGS gages that, although included in NSIP, do not form part of the base gage network. This does not mean that these other gages are not fulfilling important purposes, but simply that those purposes may be primarily local in scale or otherwise not of highest national priority as defined by the five federal goals noted above.
Each of the five gage siting criteria is now examined in more detail.
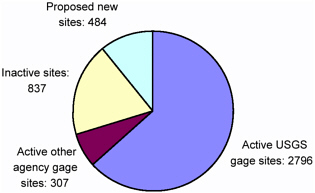
FIGURE 3-2 Status of NSIP gage sites. SOURCE: Based on USGS data (http://water.usgs.gov/nsip/nsipmaps/usa_sum.html).
Many additional criteria beyond these five were thoroughly evaluated by the Interstate Council on Water Policy; these are examined in Chapter 4.
THE FIVE CRITERIA FOR SITING NSIP STREAMGAGES
Goal 1. Meeting Legal and Treaty Obligations on Interstate and International Waters
Provide river discharge information to meet the operational requirements of river basin compacts and Supreme Court decrees at each point where major rivers cross international or state boundaries. This goal addresses the need to record the flow of water as an economic commodity across borders and to provide accepted, neutral data for states to use in the allocation of interstate waters.
Metric: Operate a discharge station at rivers
-
on or near crossings of state and international borders where the drainage area of the river reach is greater than 500 square miles, or
-
where the location is mandated by a treaty, compact, or decree.
A total of 515 gage sites are selected to support this criterion. Of these, 322 serve as border sites, 236 are compact sites, and 43 sites serve both purposes (Figure 3-3). Monitoring streamflow quantity and quality between the United States and adjacent countries is an important mission of the NSIP.
It is prudent to carefully evaluate the status of the ungaged reaches at state boundaries with respect to resource evaluation and environmental needs. Future extraction of water from streams—either direct or induced by enhanced irrigation and other pumping—is difficult to predict, as are future water rights disputes over regional or locally depleting surface water supplies. Where water rights are paramount, as in the Southwest, gaging the volume of water passing by state lines may be increasingly important in the future. The Interstate Council on Water Policy (ICWP, 2002, pp. 6-7) recommended that the NSIP provide streamflow data for rivers governed by compacts between states, tribes, or nations or as dictated under Supreme Court decree but not including waters crossing jurisdictional boundaries with no legal agreements (a summary of all of the ICWP’s recommendations is given in Chapter 4). Since water allocation policies and laws differ between states and only states have legal jurisdiction over water originating within the state, it is important to measure all significant interstate flows even if legal agreements or compacts do not yet exist, in anticipation of the data being required for adjudication of future interstate water allocation questions. In contrast to the view of the ICWP, the committee believes that the border gage sites proposed by the USGS should be retained as part of the NSIP base gage network.
Goal 2. Flow Forecasting
Provide real-time data for each of the service locations at which the National Weather Service (NWS) and Natural Resources Conservation Service (NRCS) need streamflow data to calibrate and operate forecast models. Service (NRCS) need streamflow data to calibrate and operate forecast models.
Metric: Operate a streamgaging station at each NWS and NRCS service location that is not located on a reservoir (reservoir locations were excluded because it was presumed that they record water level alone and not discharge).
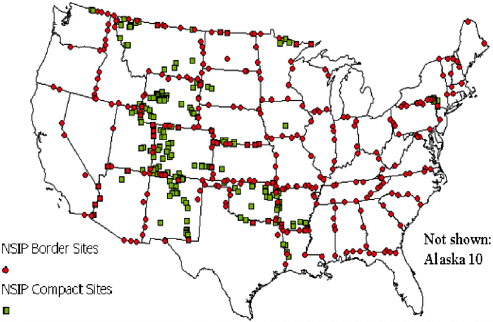
FIGURE 3-3 NSIP border and compact sites (515 gages of which 36 percent are solely for border and compact sites and 64 percent also meet other NSIP goals). SOURCE: Based on USGS data (http://water.usgs.gov/nsip).
The NSIP goal was initially stated only in terms of supporting the NWS flood forecasting program. During the course of the study, the USGS requested that the committee title this goal “Flow Forecasting” rather than “Flood Forecasting” in order to be more inclusive of other needs, such as water supply forecasts, navigation, agriculture, recreation, and drought response. This change is appropriate. In meeting this broader goal the USGS should include appropriate NRCS gages used in support of water supply forecasting. The locations of the gage sites identified under this goal (without NRCS gages) are shown in Figure 3-4. Currently, 3,244 gage sites are included in the NSIP by the flow forecasting criterion, which is 76 percent of the total number of gages in the NSIP (4,424).
The principal sources of gage sites for the NSIP are the National Weather Service’s river forecasting points (Box 3-1). In many cases, these locations were originally determined because a USGS gage existed there. In other cases, the forecast point locations are determined by local needs for
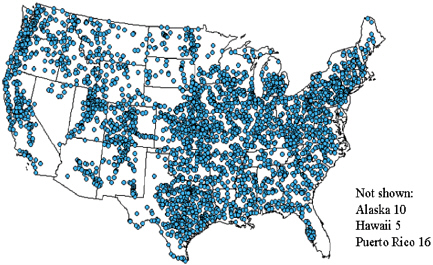
FIGURE 3-4 NSIP gage sites for flow forecasting (3,244 gages of which 80 percent are solely for flow forecasting and 20 percent also serve other NSIP goals). SOURCE: Based on USGS data (http://water.usgs.gov/nsip).
forecast information or by a reasonable subdivision of the landscape into forecast watersheds. Decisions about these forecast point locations are made in the 13 River Forecast Centers. The NRCS also carries out long-term (a few months in advance) forecasts for water supply in the western states using remote sensing and ground-based measurements of snow as an input variable.
Figure 3-5 shows NRCS water supply forecast gage sites. These locations are all USGS gage locations in the western United States where water supply forecast needs are most critical. Of the 576 NRCS gage sites, 321 are already in the NSIP base gage network, so the addition of the NRCS sites would add 255 sites to the 3,244 NWS sites currently identified for the flow forecasting goal, an increase of 8 percent. This is a modest increase in the total number of sites in this category and is well justified in support of the broader goal of flow forecasting, as distinct from flood forecasting.
The USGS streamgaging network is an integral part of the forecasting process. Mason and Weiger (1995) reported that in 1995, the NWS utilized real-time data from 3,971 USGS streamgages to make forecasts at 4,017 forecast points (the total number of forecast points at that time). Furthermore, USGS accounted for 98 percent of the stations used by the NWS for
|
BOX 3-1 Forecasts of river conditions provide vital information for flood warning, water management, navigation, and recreation. Although many federal, state, and local agencies engage in streamflow forecasting to meet operational objectives, the NWS is the agency responsible for issuing river forecasts and flood warnings to the public, as mandated by the National Weather Bureau Organic Act of 1890 (U.S. Code title 15, section 311). River forecasts issued by the NWS provide site-specific information on river conditions at more than 4,000 and “forecast points” across the country. The nature of the forecasts can vary, depending on the concerns at a forecast point. At some locations, forecasts are issued on a daily basis. The forecasts often consist of river stage hydrographs (water level versus time) for the next few days. At other locations, forecasts are issued only during floods. These flood-warning forecasts consist of the expected time and river stage of the flood crest, as well as the period during which the river stage is expected to be above flood stage. The numerical guidance used to issue the forecasts is produced at one of 13 NWS River Forecast Centers (RFCs). However, the forecasts themselves are issued by a service hydrologist at one of the 121 NWS Weather Forecast Offices (WFOs). The WFOs can also issue general flood watches and warnings for areas within their region. When weather conditions warrant, flood warnings are issued for rivers and streams within designated areas where flooding may occur (rather than at specific forecast points). The guidance that hydrologists use to issue flood warnings can include forecast products generated at the RFCs or products generated locally at the WFOs. The forecasting techniques used by the NWS have evolved over the years. Early forecasting techniques combined observations of river and weather conditions, simple hydraulic and hydrologic methods, and a forecaster’s experience and judgment. Today’s forecasting technologies are a product of recent advances in computer power and data telemetry. For instance, real-time data on river discharge and stages, precipitation from raingages and NEXRAD weather radars, and other weather observations, are transmitted via satellite for access by the RFCs. These data are then fed into computer models that simulate watershed processes and river hydraulics. The suite of hydrologic and hydraulic models used in river forecasting at the RFCs is known collectively as the NWS River Forecasting System (NWSRFS). In the past decade, NWS has begun using forecasts of future precipitation (known as quantitative precipitation forecasts) to improve short-range streamflow forecasts. Hydrologists at the RFCs produce the numerical guidance for issuing river forecasts and flood warnings by running NWSRFS models for river basins within their area. A river basin is represented in an NWSRFS model as a set of subcatchments or subbasins. The hydrologic response of the subcatchment to rainfall and snowmelt is simulated with observed weather and streamflow data and forecast information. Streamflow is predicted at the subcatchment outlet. To ensure that river forecast guidance is available at each forecast point, each forecast point corresponds |
|
to one of the subcatchment outlets. The remaining outlets (which are not forecast points) are known as data points. The passage of upstream outlet flows through downstream subcatchments is simulated using hydraulic routing models. Where river flows enter a reservoir, future reservoir releases are needed to forecast downstream flows. In some locations, the NWS contacts the agencies responsible for reservoir operations to obtain this information. In other locations, the NWS sends its reservoir inflow forecasts directly to the operational agency. These agencies then utilize the streamflow forecasts in their operational model to plan future releases and report their plans back to the NWS. As part of the modernization of weather and hydrologic services, the NWS has begun implementation of Advanced Hydrologic Predictions Services (AHPS). These services include new forecast products and web-based visual displays of forecast information at forecast points. Some of the new products are long-range probabilistic streamflow forecasts. Probabilistic forecasts of river stages and discharges, flood stages and discharges, and river flow volumes are made or 90 days. Examples of the AHPS products are available on-line for portions of the Upper Mississippi River (http://www.crh.noaa.gov/dmx/ahps/) and the Ohio River (http://www.erh.noaa.gov/er/ohrfc/ahps.htm). In addition to river forecasting and flood warning, the NWS also issues flash flood watches and warnings. Unlike river forecasts, flash flood forecasts are issued for counties or areas rather than specific forecast points. The forecasting process often involves real-time comparisons of observed rainfall from gages or NEXRAD weather radar with estimated flood-producing rainfall amounts, known as flash flood guidance. The flash flood guidance depends on the soil moisture state of the drainage area and is updated daily by the RFCs with information from the NWSRFS models used in river forecasting. Another approach to flash flood warning is the NWS Integrated Flood Observing and Warning System (IFLOWS) in the Appalachian Region. This system continuously monitors rainfall and water levels on streams, and automatically sends out warnings to emergency managers. Similar systems, called Automated Local Evaluation in Real-Time (ALERT) systems, have been implemented by state and local agencies for flash flood warning in other parts of the United States. |
real time river observations. River forecasting is a data-driven process, and streamflow information is the most important data source. NWS forecast points and USGS streamgages are collocated so that measured streamflow data can be used to calibrate and initialize forecast models. Accurate and reliable forecasts require both real-time streamflow information for model initialization and a historical record of streamflow information over many years (or decades) for calibration (streamgaging data in catchments under going land-use change can also be used to update model parameterization). Often, knowing the river flows at upstream locations is the most critical component in making an accurate forecast at downstream forecast points.
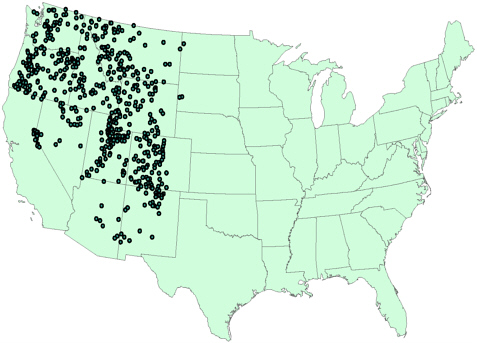
FIGURE 3-5 NRCS gage sites used for water supply forecasting (576 gages). SOURCE: Data provided by David Stewart, USGS, written communication, 2003).
Observations are also used by service hydrologists to adjust model predictions in real time to make better river forecasts. Despite the complexity of forecast models, model predictions diverge from actual conditions due to uncertainties in the measurement of precipitation and other weather input variables or the inherent simplifications associated with computational modeling of watershed and river processes. Real-time observations provide the “ground-truth” needed to continuously make reliable forecasts for rapidly changing river conditions. Even though improvements in hydrologic forecast models are expected in the future, real-time observations will always be necessary for model calibration.
Historical information is also essential for development of accurate streamflow prediction models. Due to the complex processes controlling runoff and river flows, it is not possible to accurately predict river flows without first comparing model predictions to observations and then making adjustments to the model parameters to improve predictions—a process known as calibration. In operational forecasting, flow extremes (both floods and drought conditions) are generally when the need for accurate
forecasts is most critical. Flow extremes are also rare events. As a result, an extended record with both dry and wet extremes is necessary for model calibration. Additional flow information (not used in model calibration) is also needed to evaluate the model’s predictive ability.
In times of flood, the public is most interested in the height to which the river will rise, not its discharge rate. At each USGS streamgage station, hydrologists develop and maintain a rating curve, which relates discharge to river stage (and vice versa). However, rating curves are dynamic, changing with changes in channel shape (which often occur from the erosion and deposition associated with floods). The NWS includes these rating curves directly in its forecast models to make river stage forecasts.
Since USGS gage sites were selected as forecast points early on in the river forecasting process at the NWS, the hydrologic models used by the NWS have been designed around the long-term streamgage network. For example, the delineation of model elements (subcatchments) is driven in large part by the location of long-term gages. Matching the outlets of model subcatchments to locations with long-term streamflow records facilitates the forecast model calibration step. From the perspective of an operational forecaster, the historical streamflow record at a site can do more to improve forecasting than new observations from a previously ungaged site. This occurs because a revised forecast model can be reliably calibrated to make predictions at a point with historical information. Hence, given a choice, many operational forecasters would choose to restore discontinued gages (for their historical record) rather than establish new streamgage sites.
Continued operation of long-term streamgaging stations is also vital to the NWS river forecasting mission. A chief concern for operational forecasters is the loss of existing streamgages. Although a forecast model can continue to make predictions at the site, the loss of real-time observations needed to adjust model predictions degrades the accuracy of forecasts. As time passes, rating curves will shift, further reducing forecast quality. As a matter of procedure, forecast points are not eliminated when a streamgage is discontinued, but service hydrologists are instructed that forecast guidance is to be interpreted qualitatively, rather than quantitatively, in issuing forecasts (NWS, 2003).
Goal 3. Measuring River Basin Outflows
Provide representative data for each of the major river basins in the nation.
Metric: Operate streamgaging stations near the terminus of each of the 352 hydrologic accounting units (also called six-digit hydrologic unit code basins, or HUC-6) in the nation (see Figure 3-6). The intent of the metric is to gage as much of each unit as possible. For accounting units drained by a single major river, a streamgage should be located near the outlet of the accounting unit so that the drainage area to the streamgage is 90 to 110 percent of the accounting unit drainage area. For a coastal unit or area of internal drainage, the farthest downstream station or gage location on the largest river is selected, and if this location drains less than 50 percent of the accounting unit area, then the location with the next-largest drainage area on a different river within the accounting unit is selected.
One of the key goals of water resources planning for the United States is to be able to perform a water balance of the flow of water through the nation. Such a balance, in which a budget is constructed of all the inputs and outputs of water in each river basin or water planning region, is required for a myriad of applications. These include national assessments of water availability and water use and their change over time, effects of major changes in basin management (e.g., dam construction or removal) or water supply (e.g., conversion from groundwater to surface water or vice versa) on streamflow and biota, and others. To support such an accounting the USGS has identified the six-digit hydrologic cataloging units as the regional water planning units that such a water balance will require and has located an NSIP gage site near the outlet of each of these six-digit hydrologic regions. A total of 450 gages are located by this criterion (Figure 3-6).
Goal 4. Monitoring Sentinel Watersheds
Provide data from stations that are minimally affected by human activity for regionalization of streamflow characteristics and assessments of trends in streamflow due to factors such as changes in climate, land use, and water use.
Metric: For the conterminous United States, a set of 802 eco-accounting units was defined by intersecting the 352 accounting units with the 76 ecoregions of United States defined by Omernik (1987) and selecting all the resulting areas greater than 100 square miles. The result is presented in Figure 3-7.
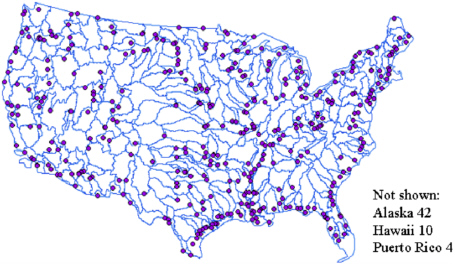
FIGURE 3-6 Gage locations at river basin outflows (450 gage sites of which 36 percent are solely for river basin outflows and 64 percent also serve other purposes). Lines shown are boundaries of hydrologic accounting units. SOURCE: Based on USGS data (http://water.usgs.gov/nsip).
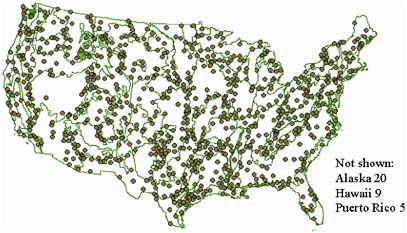
FIGURE 3-7 Gage locations for sentinel watersheds (874 gage sites of which 71 percent are solely for sentinel watersheds and 29 percent also serve other purposes). Lines shown are boundaries of ecoregions. SOURCE: Based on USGS data (http://water.usgs.gov/nsip).
Gage sites were selected to be relatively free from human influence (no large reservoirs upstream) and have 80 percent of their drainage area within a single ecohydrologic unit. For Alaska, one station was selected for each ecological region rather than for each ecohydrologic region because the cost of operating a gage station in Alaska is about $50,000 a year, as compared to $10,000 per year in the conterminous United States. For Hawaii and Puerto Rico, a windward and leeward station was selected for each major island. Preference was given to selection of stations in the Hydroclimatic Data Network (HCDN) (Slack et al., 1993) where possible, because the records at these stations have been carefully checked for accuracy and consistency.
One of the key goals of a national streamflow program is to monitor long-term trends of streamflow in the nation. This is particularly important in relation to climate change, which could influence the frequency and severity of floods and droughts. To meet this criterion, the USGS has constructed a set of hydro-eco regions by intersecting the Omernik ecological regions, adopted by the U.S. Environmental Protection Agency (EPA) as a good description of ecological variation over the United States, with the six-digit HUC basins and has identified a nearby gage site where flow is minimally impacted by upstream storage or diversions. A total of 874 gage sites are identified in the NSIP by this process. These gages are viewed as critical for developing the emerging river science program (see Chapter 6). One consideration in evaluating the NSIP base gage network and sentinel gage subset is the coverage in terms of spanning a representative range of basin sizes. This is illustrated in Figure 3-8, which shows, in aggregate, that sentinel gages are well distributed over drainage areas and reasonably that both the sentinel gaging and the overall USGS gaging networks have a reasonable distribution of basin sizes, with the sentinel gages placing slightly more emphasis on smaller watersheds.
Goal 5. Measuring Flow for Water Quality Needs
Provide streamflow information for a national network of water quality (concentration and loading) monitoring points.
Metric: There are three national water quality networks: Hydrologic Benchmark (HBM) (63 stations), National Stream Water Quality Accounting Network (NASQAN) (40 stations), and National Water Quality Assessment Low-Intensity Phase (NAWQA-LIP) (107 stations). Active streamgaging stations were required to be on the same river reach as the water quality monitoring site. The location of these gages is shown in Figure 3-9.
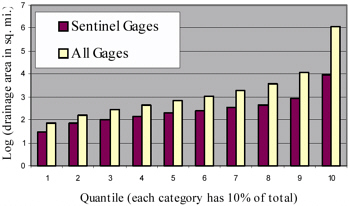
FIGURE 3-8 Drainage area represented by all USGS gages and by sentinel gages. Explanation: 10 percent of all USGS gages monitor drainage areas of 104-106 (10,000-1,000,000) square miles, 10 percent monitor areas of 103.5-104 (3,200-10,000) square miles, and so on. The distribution shows that sentinel gages are well distributed over drainage areas and reasonably reflect the overall gage distribution. SOURCE: Data provided by J. Michael Norris, USGS, personal communication, June 2003.
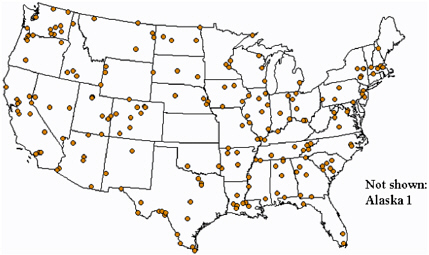
FIGURE 3-9 Gage locations for water quality (210 gage sites of which 58 percent are solely for water quality and 42 percent also serve other purposes). SOURCE: Based on USGS data (http://water.usgs.gov/nsip).
Proper interpretation of water quality data requires knowledge of stream discharge. Gages for this coverage were selected primarily to meet NAWQA needs. In the past, funds from the NASQAN program also supported a small number of streamgages, and in some cases funding support for these gages has been transferred to the NSIP. The NASQAN program itself has been reduced in scope in recent years as the focus on water quality assessment has shifted to the NAWQA program. The HBN stations are part of the Hydroclimatic Data Network set of gages and are already receiving federal support independently of the cycles of funding for the NASQAN and NAWQA programs.
The NSIP also supports other water quality needs. For example, EPA’s Total Maximum Daily Load (TMDL) program requires estimates of flow to determine chemical loads and transport. According to the USGS, based on concentrations of a range of water quality pollution indicators, 677 out of a total of 2,079 possible watersheds in the conterminous United States were identified as degraded. Of these degraded watersheds, 85 percent are adequately gaged, which indicates that NSIP gaging is supporting water quality needs beyond the minimal set of sites designated under this specific goal.
However, additional gaging to support the TMDL program on a site-specific basis would be overwhelming in cost and manpower because there are about 21,000 polluted river segments, lakes, and estuaries making up more than 300,000 river and shore miles and 5 million lake acres (NRC, 2001). There is a pressing need to be able to estimate historical and real-time streamflow at any point on a river network. This goal can be met only by new scientific research, based on existing streamflow data, to develop accurate regionalization methods. The USGS is well positioned in terms of expertise to do this research.
ASSESSMENT OF THE DISTRIBUTION OF GAGE SITE LOCATIONS
The selection of gage sites using the five NSIP criteria reflects a process of assessment within the USGS as to which goals out of all those used to justify installing a gage site are appropriately national or federal goals and which goals are better left for state and local interests. Among the five criteria, the flow forecasting criterion to support the river forecast operations of the NWS results in many more site locations than any other criterion (Figure 3-10). Of the 5,293 sites selected, 3,244, or 61 percent, support the forecast goal; 874, or 16 percent, support the sentinel watershed goal; 515, or 10 percent, support the border or compact goal; 450, or 9 percent, sup-
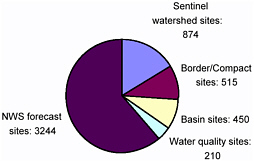
FIGURE 3-10 Distribution of NSIP gage site locations by goal. SOURCE: Based on USGS data (http://water.usgs.gov/nsip).
port the basin accounting goal; and 210, or 4 percent, support the water quality goal. Of course, some site locations support more than one goal; only 4,424 site locations are needed to support the 5,293 locations selected independently by the five criteria.
One way of assessing the result of this selection process is to examine the distribution of gage sites across the country. Figure 3-11 shows the distribution of gages by state, with the largest numbers of gages being located in Texas (416), followed by California (201), Colorado (171), Kansas (166), Oregon (136), and Alaska (131). The states or commonwealths with the smallest number of NSIP site locations are Rhode Island (2), Delaware (4), Vermont (15), Connecticut (16), Puerto Rico (17), and Maryland (18).
A key criterion typically used to measure the adequacy of streamgage networks is gage density, measured as the number of gages per square kilometer of land area. Figure 3-12 shows the gage density in the 48 conterminous states. The states with the greatest gage site density are Puerto Rico, New Jersey, Massachusetts, Connecticut, Pennsylvania, and Hawaii, which all have more than one gage per 1000 km2. The states with the lowest gage density are Alaska, Nevada, South Dakota, Arizona, Maine, New Mexico, Montana, and North Dakota, which all have less than one gage per 2500 km2.
There is a significant discrepancy between the lowest two states in gage density—Alaska with one gage per 11,700 km2 and Nevada with one gage per 9650 km2—and the next four states—Arizona, South Dakota, Maine, and New Mexico, which each have about one gage per 3000-3500 km2.
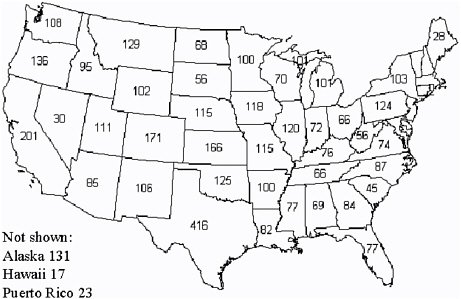
FIGURE 3-11 Number of NSIP gage sites by state. Totals for northeastern states: Connecticut, 16; Delaware, 4; Maryland, 18; Massachusetts, 23; New Hampshire, 20; New Jersey, 29; Rhode Island, 2; and Vermont, 15. SOURCE: Based on USGS data (http://water.usgs.gov/nsip).
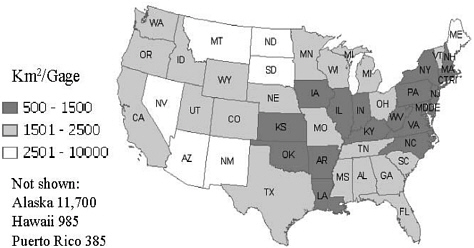
FIGURE 3-12 Density of NSIP gage locations measured in square kilometers of land area per gage. SOURCE: Based on USGS data (http://water.usgs.gov/nsip).
Alaska is a special case because of the very large land area of the state and the high cost of operating gaging stations there, but the low density of gages in Nevada cannot be justified in that way. Figure 3-11 shows that there are only 30 NSIP gage site locations in Nevada, while its neighboring states—Arizona, Utah, Idaho, and Oregon—have 85, 111, 95, and 136 sites, respectively. Apart from Arizona, which is slightly larger, these neighboring states are all smaller than Nevada.
There are several reasons for the anomalously low gage density in Nevada. One contributor is that in the interstate boundary category, most ofthe gages near the Nevada border happen to be in the adjacent state. Another is that there are only 10 National Weather Service river forecast points in Nevada, compared to 34 in Arizona, 89 in Utah, 62 in Idaho, and 109 in Oregon. This variation in NWS forecast points among the states closely matches the variation in NSIP gage distribution in those states and reaffirms the importance of the existence of NWS forecast points in siting NSIP gages. The low number of NWS river forecast points is due in part to the nature of Nevada's hydrology. Streamgaging is difficult and ineffective for flood forecasting in ephemeral streams. In particular, the NWS continuous simulation model time step is too long to be effective for the rapid forecasts necessary for flood forecasting in ephemeral streams. In such circumstances, raingages are more effective for flood warning, exemplified by Las Vegas' local alert service.
There are 28 NRCS water supply forecast sites in Nevada, and of these, 11 are already in the NSIP base gage network. Thus, the addition of the NRCS forecast points to the NSIP base gage network would add 17 sites to the 30 currently in network in Nevada, making a total of 47 sites. Therefore, adding the NRCS forecast sites would not eliminate the discrepancy for Nevada, but it would ameliorate that discrepancy somewhat.
Another reasonable way of assessing network adequacy is to determine the number of gage sites per person in each state (Figure 3-13). While this is not a standard method, public safety, in the form of the supporting NWS flood forecasting, generates far more NSIP sites than any other criterion. It follows that if public safety is implicitly a goal, then more measurement may be needed where more people are threatened by floods. Alaska has the lowest number of people per gage (4,200), while Rhode Island (494,000), Maryland (289,000), New Jersey (282,000), and Massachusetts (269,000) have the highest. Rhode Island’s anomalously high ratio is probably not significant; there only two NSIP gage sites in Rhode Island and the addition of only two more sites there would bring it into line with the other states just listed. It can be seen by comparing Figures 3-12 and 3-13 that although Montana, North and South Dakota, Maine and New Mexico all have a low
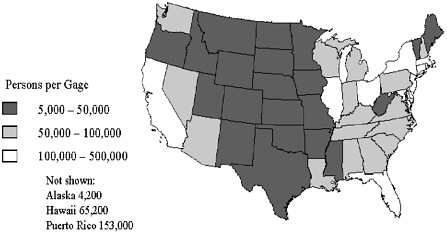
FIGURE 3-13 Number of persons per NSIP gage site in each state. SOURCE: Based on USGS data (http://water.usgs.gov/nsip).
gage density per unit area, these states all have a high gage density per person, so the number of NSIP gage sites assigned to these states seems reasonable. Nevada has 60,600 persons per gage, which ranks about in the middle of the states in this criterion.
These examples highlight not only a specific shortcoming of the NSIP with respect to ephemeral streams, but the general principle that certain locations may have greater value in the future than is presently perceived. The principle of adaptive management should be incorporated explicitly into the NSIP to periodically reevaluate the network goals and criteria to ensure that the network meets present and anticipated future needs for streamflow information. This periodic reassessment of emerging needs may also support gaging of streams in small watersheds or coastal plains where there is a perception of insufficient coverage and common sense dictates the inclusion of gage sites that may not be included by rigidly applying the five current criteria.
In addition, the USGS should consider how the public, the scientific community, and water management agencies will be included in the adaptive management of this national network. At present, much of the public input on prioritizing streamflow gaging comes in the form of having paying state and local customers through the Cooperative Water (Coop) Program. If the NSIP fully funds its base network independent of cost matching, other mechanisms for public consultation at various levels (e.g., an advisory board, surveys) will have to be found.
SUMMARY
The five criteria that the USGS has used to prioritize gages for the NSIP seem reasonable. The distribution of gages by state across the nation produced by the NSIP criteria also appears reasonable when measured on metrics of number of gages per unit of land area and number of persons per gage, with the possible exception of Nevada, which has only 30 NSIP base gage sites. Nevada has about one-third the number of NSIP base gage sites of its neighbor states, due to the National Weather Service having only 10 flow forecast points in Nevada. Bearing in mind the rapid growth of Nevada and its critical dependence on water resources, reexamination of the number of NSIP gage sites there may be warranted. The overall distribution of sentinel gages with respect to watershed size is also reasonable.
The principle of adaptive management should be incorporated explicitly into the NSIP. This periodic reevaluation of network goals and criteria will ensure that future needs for streamflow information, including ephemeral streams and possibly small watersheds and coastal plains, are met by the network.
The NSIP gage site program is very much attuned to the site locations of National Weather Service river forecast points, and vice versa. Although there are five gage siting criteria, more than 60 percent of the sites selected for NSIP gages are determined by the locations of NWS forecast points. The USGS deals with streamflow information in the past and the present. The National Weather Service is responsible for taking current streamflow information and forecasting future flows. It appears that in the past there has been limited coordination between the USGS and flow forecasting agencies (NWS and NRCS) in the location of gages to meet the flow forecasting goal. The NWS opportunistically locates a forecast point where there is a USGS streamgage. The USGS justifies the presence of the majority of the NSIP base streamgages as supporting flow forecasting by the NWS or NRCS.
This raises the question of whether the flow forecasting gages are optimally located to support forecasting needs. Decisions regarding the location of flow forecast points are made regionally within the 13 River Forecast Centers and NRCS offices responsible for water supply forecasts. It appears that a greater degree of cohesion between the USGS and the NWS in planning and locating future gage sites and forecast points would be beneficial, especially in western states such as Nevada. New NSIP gages are sited in consultation with USGS district offices, which in turn are charged with taking account of user needs in their districts. In addition, a formal


