
D
Workshop Manuscripts
PREDICTING AND PROTECTING PERFORMANCE USING METABOLIC MONITORING STRATEGIES: IT’S ALL WET STUFF ANYWAY, ISN’T IT?
COL Karl E.Friedl, U.S. Army Research Institute of Environmental Medicine
The ultimate reductionistic view of the Military Operational Medicine Research Program (MOMRP) centers on metabolism as the answer to all questions. For every problem we are trying to solve in the MOMRP, we will someday complete the connection to a metabolic basis. This includes soldier performance problems that range from extended physical stamina to sustaining optimal mood and behavior. While this first-principles approach is not likely to provide many near-term solutions to MOMRP problems, we can exploit the emerging physiology to develop monitoring technologies. Insight into this metabolic activity should help predict individual status and physiological reserve. This is based on the premise that these metabolic processes are the basis of the responses that allow organisms to survive in the face of environmental challenges and are the earliest indicators of a change in physiological status. This calls for a thoughtful review of currently known regulatory mechanisms that suggest promising predictive markers of status and impending failure of adaptive response capabilities. We should also consider applications of the most promising monitoring technologies that are currently available. The focus of this workshop is to address: what are the best metabolic targets for monitoring and what are the most promising monitoring technologies?
This information is needed for predictions about the readiness status of individuals in training and in operational settings where human performance is important. We have formidable monitoring capabilities on military systems, but lack real-time information on the status of our own troops. This serves U.S. de-
fense priorities to “assure readiness of the Armed Forces” and to “transform the Department of Defense” (including experimenting with new approaches to warfare).
RESEARCH REQUIREMENTS FOR PHYSIOLOGICAL MONITORING
Monitoring soldier status has become increasingly important because of new lethal and complex technologies that require high reliability of the human operator and new tactics that reduce line-of-sight contact with team members and increase geographical distance and isolation. No longer is soldier monitoring just a nice-to-have technological replacement for common sense or for good leadership that includes understanding the signs of soldier limits. Soldiers may not know they are reaching dangerous levels of overheating and dehydration and, if they are fully encapsulated in protective suits and operating in a remote site, their team leaders also may not know they are heading for trouble. An alert to the individual on their future helmet visor display and/or an automatic “911” message to their squad leader can provoke a prompt intervention and save a mission.
The Navy is designing ships with substantially reduced crew sizes, which calls for greater reliance on each individual. Monitoring the status of these sailors becomes especially important if they are incapacitated in an isolated crew compartment during high-risk damage control operations, such as fighting fires or flooding. The concept of the Reduced Ships-Crew by Virtual Presence is for smart ships to continuously receive data on the status of the ship, as well as on the crew within the ship (Street et al., 2002).
Today’s high performance aircraft can easily exceed the limits of human physiological tolerances, and one concept for physiological monitoring includes detection of an approaching loss of consciousness to trigger an automatic take over of the controls (Forster et al., 1994). This calls for a rapidly responsive system that, with high reliability, identifies a major lapse in pilot capabilities.
Monitoring in training is at least as important as in operational environments. It may be most useful for leaders to use physiological monitoring to learn the limits of their own soldiers during training operations. Then, during an actual operational mission, they might use monitoring only for specific warnings about real-time status. Other aspects of metabolic monitoring may not require a wearable system, but simply periodic testing to determine, for example, if individuals have reached a high state of bone and muscle remodeling during their training and can reduce a high probability of injury by resting the next day. This kind of feedback will be broadly useful to learning limits of individuals and units.
Physiological monitoring is being explored for a wide variety of other military applications, including the forensic “black box” flight recorder-type of analysis of a pilot’s mental state after a class A accident, in order to prevent future accidents (Forster, 2002). There is also a need for overall “whole body”
health markers for easy assessment of global indices of service members’ health at regular intervals throughout their career. This could eventually represent some combination of psychological and physiological health, using markers such as brain metabolites monitored via magnetic resonance spectroscopy (MRS) scans, whole-body oxidative stress load assessments, and mitochondrial redox potential of critical brain cells.
RECENT EVOLUTION OF MONITORING RESEARCH
Physiological monitoring concepts are not new, but the measurement technologies have advanced more rapidly than our understanding of what the measurements mean to health and performance. Fifty years ago, the Office of Naval Research and the Army Surgeon General cooperatively studied infantrymen in combat to identify metabolic predictors of mental status (Davis et al., 1952). Using neuropsychological testing (including visual flicker fusion and auditory flutter fusion tests) and blood and urine testing, they assessed hydration status, adrenal stress markers, and corresponding changes in cognitive functioning. Studies by the Air Force explored the use of an electroencephalogram (EEG) to monitor pilot performance as early as the 1950s (Sem-Jacobsen, 1959). Current studies are examining many of the same factors and relationships that were tested in the studies 50 years ago. Although these newer empirical studies have some technological advantages, most notably electronic computing power, the studies have largely relied on available technologies instead of exploring the most suitable measurement targets and developing specifically needed monitoring technology. Many of the available technologies are simply telemetered applications of clinical monitoring systems, limiting advances to spin offs from standards of medical care. We have spent too much time trying to find uses for new measurement technologies instead of pushing the development of technology to systematically test what we understand about physiology and to predict outcomes of greatest importance.
The greatest barrier to advances in performance monitoring has been the lack of suitably defined performance outcome measures. Until recently, aviator performance has been the most extensively studied model for physiological monitoring. Military aviators have been a logical focus because of the need (i.e., the high costs associated with catastrophic performance failures) and because of the experimental advantages. Performance outcome measures are better defined for aviator tasks, especially the ultimate outcome of successful landing versus disaster. The cockpit also provides a friendly setting for clunky prototype monitoring systems that are power hungry and tethered to heavy equipment. Aviator studies can provide early proof of concept for systems that are later reduced in size, weight, power, and invasiveness for untethered applications in soldiers, marines, and sailors. Nevertheless, the aviator monitoring studies are not generalizable without the further development of performance assessment methods and metrics.
Without suitable performance measures, results from lab-based studies cannot be translated into militarily relevant outcomes. These measures are also needed for field studies that are otherwise forced to rely on simple dichotomies of “no bad outcome” or catastrophic failure (e.g., heat stroke, serious injury, or mission failure). The MOMRP has invested heavily in the development and standardization of practical neuropsychological tests (e.g., the Automated Neuropsychological Assessment Metric) (Kane and Kay, 1992), and current field studies are attempting to link these test results with military performance. For example, simple reaction time remained impaired following sports concussions in military cadets even after they were cleared for return to duty by clinical criteria; the significance of this finding to other performance measures is being further investigated. Cold water immersion reliably affected the matching-to-sample test; what this means to Navy diver performance capabilities is also being further investigated (Thomas et al., 1989). One eventual monitoring application would be to embed informative tests into common military tasks that could be monitored in order to obtain unobtrusive periodic assessments of an individual’s performance status. We are currently sponsoring a Department of Defense (DOD) review of methods and metrics for performance assessment that synthesizes the current state of the knowledge on militarily relevant performance assessments and models (Ness et al., In preparation). We have also launched a new research initiative on the development of military performance assessment methods based on measures of neurological function, such as voice stress analysis and eye saccades (Science Technology Evaluation Package 3.C).
Physiological monitoring moved from a research sidelight to a central objective in the Army research program under the guidance of Dr. Fred Hegge in 1996. The goal of the Warfighter Physiological Status Monitoring (WPSM) initiative is to make real-time performance predictions that leaders can use to assess the readiness status of their forces. The concept is to develop a soldier-acceptable, minimally invasive sensor set with on-the-soldier analysis. The output (which can be queried for further information) will be a simple “green” (within normal limits), “amber” (physiological challenges are present), or “red” (systems have failed and the soldier is a casualty). This relies on the vast trove of environmental physiology and psychological data collected and modeled in DOD research programs for many years. A key feature of the approach is that these systems must also learn the usual range of responses for its soldier, accounting for individual variability. Currently, WPSM is a research “tool kit” to learn more about normal and abnormal physiological signals encountered in real soldier environments; these include a range of responses that routinely exceed those that can be obtained in an ethically developed experimental laboratory setting. WPSM will ultimately be reduced to the minimal sensor set needed for highly reliable and important predictions. Reed Hoyt currently leads this program with the development of experimental signal acquisition and data handling systems and data collection studies with marines and soldiers in challenging training environments (Hoyt et al., 1997a, 2001). The immediate requirements
for WPSM are to provide status for thermal strain, live-dead detection, sleep history, and energy expenditure for the Land Warrior system. In later iterations of this system (e.g., the Objective Force Warrior), more sophisticated monitoring capabilities and performance predictions are planned that will also include early casualty triage capabilities.
EXAMPLES OF CURRENT RESEARCH EFFORTS, AND LEVERAGING FROM RELATED PROGRAMS
We have chosen several critical areas for review: hydration and heat production, substrate utilization and energy metabolism, muscle and bone remodeling, and brain function. These traditionally separate research areas are interrelated through metabolic processes. For example, exertional rhabdomyolysis has elements of hydration and heat exposure, energy flux, and muscle remodeling, with early effects on mental status (Gardner and Kark, 1994). The topics are also closely interrelated through common measures that might signal changes in one or more of these physiological categories. For example, shivering may indicate a variety of threats that, when combined with one or two other measurements, can unambiguously distinguish impending hypothermia risk, exposure to a neurotoxic chemical, or intense psychological fear. Brain function reflected in cognitive, mood, or psychomotor measures (e.g., speed of mental processing, irritability, and marksmanship) may be a common and sensitive marker of deficits of all the other stressors and functional deficits of interest. These may include each of the topics in this workshop, including carbohydrate metabolism in physical exhaustion (Frier, 2001), dehydration or significant fluid shifts such as those observed in the brain with acute mountain sickness (Singh et al., 1990), and perhaps even cytokine-mediated changes in brain function following intense muscular exertion (Febbraio and Pedersen, 2002). Brain function is both an early indicator of many stressors of concern and a direct reflection of specific performance capabilities.
Early changes to defend critical functions are likely to be more promising prognostic indicators than awaiting change in the critical function itself (e.g., blood glucose, serum osmolality, core body temperature). The critical function may be so well defended, such as serum osmolality and sodium concentration, that when a significant change is detected, homeostatic mechanisms have failed and the individual is already a casualty. Earlier changes in interstitial fluid or osmoregulatory hormones may signal a heroic defense against a threat to intravascular volume, even while other measures appear to indicate that all is still well. There are also conditions under which the critical function measurement, such as body temperature, may have a wider range of “normal” at performance extremes in healthy individuals than previously recognized. This reflects highly appropriate compensation to sustain peak performance, defying definitive classification of an impending performance failure until regulatory mechanisms fail. For example, core body temperature may be as low as 35°C at the circadian
TABLE D-1 Technology Forecast for Practical Metabolic Assessment Measures (Measured Endpoints and Conceivable Technologies)
|
Past |
Presenta |
|
Energy balance and fuel availability |
|
|
|
|
|
Brain metabolic function |
|
|
|
|
|
Hydration and water balance |
|
|
|
|
|
Bone and muscle turnover |
|
|
|
|
|
a EEG=electroencephalogram, CPK=creatine phosphokinase, IGF-1=insulin-like growth factor-1. |
|
nadir in Ranger students who have lost most of their insulative fat and have metabolically adjusted to a reduced energy intake (Hoyt et al., 1997b), and it may be sustained at 40°C for several hours in marathoners during their race (Maron et al., 1977). Monitoring the signs of compensation (e.g., changes in heat flux, activation of sweating or shivering mechanisms, cardiac responses, and mental functioning) may predict a trajectory to danger (amber) well in advance of the unambiguous changes in core body temperature (red).
Bone and muscle turnover studies are important to the military to solve near-term problems of high rates of injury during physical training, most importantly during the rapid train-up phase of the 8- to 12-week initial entry training course conducted in every service (half of all female soldiers incur musculoskeletal injury during basic training). A peak incidence of stress fractures by about the third week of training was hypothesized to be associated with high rates of bone remodeling stimulated by the training. This led to a major Army
|
Near Futureb |
Far Futurec |
|
|
|
|
|
|
|
|
|
|
|
|
|
b BIA=bioelectrical impedance analysis. c EMG=electromyogram. |
|
study that examined the benefits of a physical training rest period in the third week of training (Popovich et al., 2000). Unfortunately, this did not modify the injury profile, suggesting a more complicated pathogenesis, including individual variability. The development of specific markers of susceptibility and impending injury in individuals is still urgently needed.
Table D-1 suggests some of the outcomes that might be logical targets for monitoring within the next decade and some of the technologies that exist or could be developed for such monitoring. The boundary between current and near-term approaches is slightly blurred by the overlap of current technologies that require far more validation and projected near-term technologies that are just beginning to demonstrate promise. For example, fitness for duty based on various peripheral indicators of brain function is an important but elusive goal. In the past, there was a hope that performance could be predicted from recent sleep history measured by wrist-worn actigraphy (Redmond and Hegge, 1985); the current status of fatigue-performance models is too immature and individual
responses to this single measure are too variable to make this useful by itself (Friedl et al., In press). Potentially noninvasive measurement methods that could be mounted in a helmet, such as pupillometry and saccadic eye movements, are being explored but have so far not held up well compared with lab measures such as the psychomotor vigilance task (Russo et al., 2003). A method developed by the National Aeronautics and Space Administration (NASA) that follows slow eye closure (“droopy” eyelids) shows great promise, but will have to be proven in a helmet-type platform that keeps the monitor in line with the subject’s eyes (Dinges et al., 1998). Voice analysis is specifically affected by emotional load in soldiers, returning to normal with psychological adaptation even while general activation (e.g., accelerated heart rate) continues (Wittels et al., 2002); however, this measure has not yet been demonstrated to correspond to specific performance decrements. EEG analyses in fatigued subjects or during sustained vigilance tasks have been studied in at least three military laboratories and show promise, but they remain to be demonstrated as strong predictors of impending deficits (Caldwell et al., 2002).
Far-future technologies are concepts that might be achievable but have not been seriously explored and remain “marks on the wall.” Mitochondrial redox state in specific brain tissues has been suggested as the key marker of brain function status, based on the importance of neural cell bioenergetics. Perhaps the far-future final common pathway to monitor would be something like this and everyone will submit to a minor transsphenoidal surgical procedure for a rice grain-sized monitor of brain status! Intracerebral monitoring of energy-related metabolites is being done with neurosurgical patients now to follow acute conditions involving hypoxia and ischemia. As we learn more about what we need to measure, the technologists may be able to develop the noninvasive monitoring devices to our emerging specifications. For example, with the higher powered magnets, researchers are now detecting glutamate peaks in MRS brain pixels. An elevated frontal lobe glutamate might signify a range of acute metabolic insults that would be very important to detect and countermand. We now have transcranial magnetic stimulation systems that operate with very low power; why not a technology for brain spectroscopy built into a helmet in the future? Nearer term approaches to monitoring brain metabolic activity includes applications of existing near infrared and Doppler probes to estimate fron lobe activity and monitor middle cerebral artery blood flow (Hitchcock et al., 2003).
The current military research programs are leveraged with special Congressional appropriations that accelerate basic metabolic research in specific topic areas. The Bone Health and Military Medical Readiness research program (supported by the National Osteoporosis and Related Bone Disorders Coalition) is focused on the improved understanding of bone remodeling processes and includes projects that are exploring markers of impending stress fracture injury. The Technologies for Metabolic Monitoring research program (supported by the Juvenile Diabetes Research Foundation) is testing novel approaches to measure functional outcomes related to biochemical status and energy metabolism, nota-
bly glucose regulation, but including also the development of lactate sensors and the exploration of physiological indicators of metabolic status. Projects supported by the Force Health Protection research program examine methods to monitor global health status in soldiers, including the use of breath condensates to measure cytokines and other markers of lung function following blast or toxic inhalation exposures. Two large projects are assessing the association of brain magnetic resonance spectroscopy measures (Schuff et al., 1999) and symptom reporting in chronic multisymptom illnesses to determine objective markers of well-being. Another program is dedicated to the investigation of eye saccades and pupil responses as indices of fatigue and fitness for duty, as described in a recent review by Major General (ret.) Gary Rapmund (2002). The Neurotoxin Exposure Treatment Research Program (sponsored by the Parkinson’s Action Network) includes exploration of voice analysis and neuropsychological testing methods for early detection of neurological changes.
Disclaimer: The opinions and assertions expressed in this paper are those of the author and do not necessarily express the official views of the Department of the Army or other Services.
REFERENCES
Caldwell JA, Hall KC, Erickson BS. 2002. EEG data collected from helicopter pilots in flight are sufficiently sensitive to detect increased fatigue from sleep deprivation. Int J Aviation Psychol 12:19–32.
Davis SW, Elmadjian F, Hanson LF, Liddell HS, Zilinsky AA, Johnston ME, Killbuck JH, Pace N, Schaffer FL, Walker EL, Minard D, Kolovos ER, Longley GH. 1952. A Study of Combat Stress, Korea 1952. Technical Memorandum ORO-T-41(FEC). Chevy Chase, MD: Operations Research Office, The Johns Hopkins University.
Dinges DF, Mallis MM, Maislin G, Powell JW. 1998. Evaluation of Techniques for Ocular Measurement as an Index of Fatigue and the Basis for Alertness Management. Technical Report DOT-HS-808–762. Washington, DC: National Highway Traffic Safety Administration.
Febbraio MA, Pedersen BK. 2002. Muscle-derived interleukin-6: Mechanisms for activation and possible biological roles. FASEB J 16:1335–1347.
Forster EM. 2002. Safety of Flight: The Physiologic Aspect of the Weapon System. Patuxent River, MD: Naval Air Warfare Center Aircraft Division.
Forster EM, Morrison JG, Hitchcock EM, Scerbo MW. 1994. Physiologic Instrumentation in the Naval Air Warfare Center Human-use Centrifuge to Determine the Effects of Cumulative +Gz on Cognitive Performance. Technical Report NAWCADWAR-956006–4.6. Warminster, PA: Naval Air Warfare Center Aircraft Division.
Friedl KE, Mallis MM, Ahlers ST, Popkin SM, Larkin W. In press. Research requirements for operational decision making using fatigue and performance. Aviat Space Environ Med.
Frier BM. 2001. Hypoglycaemia and cognitive function in diabetes. UCP Suppl 123:30–37.
Gardner JW, Kark JA. 1994. Fatal rhabdomyolysis presenting as mild heat illness in military training. Mil Med 159:160–163.
Hitchcock EM, Warm JS, Matthews G, Dember WN, Shear PK, Tripp LD, Mayleben DW, Parasuraman R. 2003. Automation cueing modulates cerebral blood flow and vigilance in a simulated air traffic control task. Theor Issues Ergon Sci 4:89–112.
Hoyt RW, Buller M, Redin MS, Poor RD, Oliver SR. 1997a. Soldier Physiological Monitoring—Results of Dismounted Battlespace Battle Lab Concept Experimentation Program Field Study. Natick, MA: U.S. Army Research Institute of Environmental Medicine.
Hoyt RW, Young AJ, Matthew WT, Kain JE, Buller M. 1997b. Warfighter Physiological Status Monitoring (WPSM): Body Core Temperatures During 96 h of Swamp Phase Ranger Training. Natick, MA: U.S. Army Research Institute of Environmental Medicine.
Hoyt RW, Buller MJ, DeLany JP, Stultz D, Warren K. 2001. Warfighter Physiological Status Monitoring (WPSM): Energy Balance and Thermal Status During a 10-day Cold Weather U.S. Marine Corps Infantry Officer Course Field Exercise. Technical Note. Natick, MA: U.S. Army Research Institute of Environmental Medicine.
Kane RL, Kay GG. 1992. Computerized assessment in neuropsychology: A review of tests and test batteries. Neuropsychol Rev 3:1–117.
Maron MB, Wagner JA, Horvath SM. 1977. Thermoregulatory responses during competitive marathon running. J Appl Physiol 42:909–914.
Popovich RM, Gardner JW, Potter R, Knapik JJ, Jones BH. 2000. Effect of rest from running on overuse injuries in army basic training. Am J Prev Med 18:147–155.
Rapmund G. 2002. The limits of human performance: A point of view. Aviat Space Environ Med 73:508–514.
Redmond DP, Hegge FW. 1985. Observations on the design and specification of a wrist-worn human activity monitoring system. Behav Res Methods Instrum Comput 17:659–669.
Russo M, Thomas M, Thorne D, Sing H, Redmond D, Rowland L, Johnson D, Hall S, Krichmar J, Balkin T. 2003. Oculomotor impairment during chronic partial sleep deprivation. Clin Neurophysiol 114:723–736.
Schuff N, Amend DL, Knowlton R, Norman D, Fein G, Weiner MW. 1999. Age-related metabolite changes and volume loss in the hippocampus by magnetic resonance spectroscopy and imaging. Neurobiol Aging 20:279–285.
Sem-Jacobsen CW. 1959. Electroencephalographic study of pilot stresses in flight. J Aviat Med 30:787–801.
Singh MV, Rawal SB, Tyagi AK. 1990. Body fluid status on induction, reinduction and prolonged stay at high altitude of human volunteers. Int J Biometeorol 34:93–97.
Street TT, Nguyen X, Williams FW. 2002. Wireless Communication Technologies on Ex-USS Shadwell. Technical Report NRL/MR/6180–02–8631. Washington, DC: Naval Research Laboratory.
Thomas JR, Ahlers ST, House JF, Schrot J. 1989. Repeated exposure to moderate cold impairs matching-to-sample performance. Aviat Space Environ Med 60:1063–1067.
Wittels P, Johannes B, Enne R, Kirsch K, Gunga HC. 2002. Voice monitoring to measure emotional load during short-term stress. Eur J Appl Physiol 87:278–282.
CURRENT STATUS OF FIELD APPLICATIONS OF PHYSIOLOGICAL MONITORING FOR THE DISMOUNTED SOLDIER
Reed W.Hoyt, COL Karl E.Friedl, U.S. Army Research Institute of Environmental Medicine
The dismounted warfighter’s workplace is fairly unique within the variety of occupational challenges encountered by the American population. Modern foot soldiers commonly engage in intense, mentally and physically demanding 3- to 10-day missions, often in rugged terrain or complex urban settings. These warriors carry heavy loads (35–65 kg) and are often food and sleep restricted. Environmental conditions—ambient temperature, humidity, wind speed, solar load, and barometric pressure—can vary widely. Consider as recent examples of the operational environment the desert heat conditions of the Persian Gulf, the cold, wet weather in Bosnia, and the cold and high altitude challenges in the mountains of Afghanistan.
WARFIGHTER PHYSIOLOGICAL STATUS MONITORING CONCEPT
Why is physiological monitoring in the field needed? Wearable metabolic and physiological status monitoring can play important roles in: (a) sustaining physical and mental performance, (b) reducing the likelihood of nonbattle injuries, such as heat stroke, frostbite, and acute mountain sickness, and (c) improving casualty management in remote situations.
Ambulatory warfighter physiological status monitoring (WPSM) technologies are being developed to provide useful performance and health status indicators for warfighters, medics, commanders, and logisticians. The goal is to
maximize the operational effectiveness of soldiers, to reduce the occurrence of non-battle casualties, and to improve remote casualty management. Currently, the WPSM program is using a novel research “tool kit” to collect ambulatory physiological data from soldiers operating in stressful field environments. Analysis of these data sets is providing a better understanding of the physiological strains associated with operations in a multi-stressor environment. The data are also guiding the development a soldier-acceptable WSPM system for advanced combat systems for dismounted warfighters, including land warriors and objective force warriors.
The WPSM effort risks being driven by technology rather than the biological needs of the warfighter, resulting in inappropriate technologies lack scalability, adaptability, reliability, and ease of use. Indeed, sensor hardware often first comes to mind when thinking about ambulatory metabolic and physiological monitoring. In practice, however, sensor development is one of a series of steps needed to reliably generate a useful flow of health-state information in a harsh and highly constrained wearable environment. These steps include: reliable sensor data collection, data cleaning, data reduction and interpretation, and the communication, synthesis, interpretation, and presentation of the data. Key technologies that support this process, including posthoc time-series data management and the medical Personal Area Network, are reviewed elsewhere (Hoyt et al., 2002).
Power, weight, and volume constraints, and the need for truly “wear-and-forget” comfort, limit the functionality of wearable sensors. What can be sensed may be unconventional. For example, estimating sleep by monitoring activity is practical, but it is not currently practical to do so by electroencephalogram. Furthermore, wearable sensors are usually less reliable than their laboratory counterparts due to factors such as motion artifact and environmental effects (water, temperature, pressure). An intelligent sensor network that reliably generates useful information from a number of disparate sources is needed to provide a holistic, rather than a “keyhole,” view of the physiological status of the individual.
CURRENT COMPONENTS OF PHYSIOLOGICAL STATUS
A prototype WPSM user interface (display) for the medic or field commander (Figure D-1) illustrates relevant types of contextual and physiological information. This heuristic display shows: (1) thermal/work strain as the physiological strain index (PSI) (Moran et al., 1998), (2) hydration state or water balance (water intake relative to water requirements), (3) metabolic rate, (4) environmental conditions, (5) cognitive/sleep status (hours of sleep, etc.), and (6) clinical status and location information. This knowledge display requires data from multiple sources, including a baseline characterization of the individual,
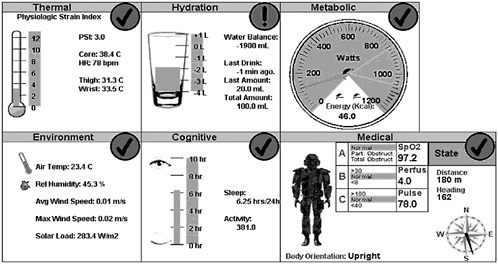
FIGURE D-1 Prototype warfighter physiological status monitoring user interface (display) for the medic or field commander illustrating contextual and physiological information. This heuristic display shows: (1) thermal/work strain as physiological strain index (PSI), (2) hydration state or water balance, (3) metabolic rate, (4) environmental conditions, (5) cognitive/sleep status (hours of sleep, etc.), and (6) clinical status and location information. HR=heart rate.
real-time soldier and environmental sensor input, and historical and group mean data.
Warfighter Characteristics
Warfighter characteristics, along with clothing, diet, load, geolocation, and meteorological conditions (air temperature, solar load, wind speed, humidity), are important determinants of the individual’s physiological and pathophysiological responses to environmental stresses and trauma. Relevant warfighter characteristics include: job type (military occupational specialty), gender, ethnicity, age, height, body weight, percent body fat, thermal and altitude acclimation history, and aerobic fitness. These factors change slowly, if at all, and can be recorded well before any training or combat mission. Body fat percent can be estimated simply from waist circumference (Wright and Wilmore, 1974). Simple field techniques for characterizing thermal and altitude acclimation states are currently not well defined. Aerobic fitness can be estimated from the Army Physical Fitness Test 2-mile run for time score (Mello et al., 1988), or from foot-ground contact time and heart rate using the method of Weyand and colleagues (2001).
Heat Strain
Understanding why hot weather injuries occur and developing ways to prevent these injuries are important concerns given the approximately 120 heat stroke/sun stroke injuries that occur per year and the associated $10 million cost per year (Sawka et al., 1996; http://amsa.army.mil). The graphical display in Figure D-2 shows core temperature, measured by an ingested thermometer pill (O’Brien et al., 1998) and heart rate, typically derived from an electrocardiogram. The PSI, a lumped core temperature/heart rate index that reflects thermal/work strain on a scale of 0 to 10 (Moran et al., 1998), is currently used to generate green/amber/red alerts as thresholds are passed. PSI values may prove useful in assessing acclimation status, guiding heat acclimation routines, and in setting the timing and duration of work/rest cycles. A first-principles thermal strain model, called Scenario, estimates core temperature from work rate, clothing characteristics, and ambient meteorological conditions (Kraning and Gonzalez, 1997). This and other surrogate measures of core temperature may be appropriate when risk of hypo- or hyperthermia is moderate and more precise core temperature measurements, such as those provided by an ingested radio thermometer pill, are not needed. The core temperature requirement is likely to be replaced by improvements in heat flux modeling from measures of cutaneous responses and temperatures; combined with other sensor measurements, this may provide strong inferences not only about thermal status, but also about shock and hemorrhage.
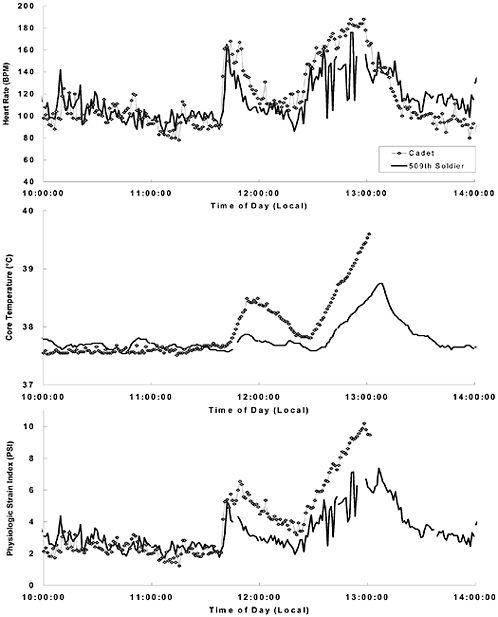
FIGURE D-2 Heart rate, core temperature, and physiological strain index (Moran et al., 1998) in two soldiers engaged in similar training activities during a hot-weather field exercise at the Joint Readiness Training Center, Fort Polk, Louisiana. The thermal/work strain levels associated with two bouts of marching (1145–1200 h and 1230–1300 h) were more pronounced in the heat exhaustion casualty (cadet) than in the less-affected 509th soldier. The heat casualty had a higher body fat percent, carried a heavier load, was less physically fit, and was not heat acclimated, as compared with his 509th cohort.
Cold Strain
Cold injuries, that is, hypothermia and peripheral cold injuries, are also a major concern for soldiers (King and Lum, 2002). Temperature pills can be used to monitor for hypothermia (O’Brien et al., 1998). Peripheral temperature and heat flux sensors can be used to assess the risk of peripheral cold injury and to guide improvements in clothing, boots, and gloves. The Cold Strain Index (Moran et al., 1999) uses core and peripheral temperatures to track cold strain. However, this algorithm needs to be modified to account for altered thermoregulation during underfeeding and sleep. (See Toner and McArdle [1988] for a discussion of the physiological adjustment of humans to the cold.)
Hydration
Under- or overhydration can lead to decrements in physical and cognitive performance, increased risk of heat injury, hyponatremia, or death (Montain et al., 2001; Pandolf et al., 1988). Mission water requirements, which are largely driven by basal water needs and sweat losses, can be predicted based on the anticipated weather, clothing, load weight, and metabolic rate during the mission (Kraning and Gonzalez, 1997). Technologies to monitor water intake from bladder-type canteens, the “drink-o-meter” concept, can help ensure adequate water intake (water discipline). However, practical field methods to assess overall hydration (total body water content), or to monitor chronic hydration state through adequacy of hourly urine output, have yet to be developed. Tests of the use of body resistance measurements have consistently failed to demonstrate accurate tracking of water changes, perhaps in part because of the inability to control for variability in electrolyte concentrations during various types of dehydration (Berneis and Keller, 2000; Koulmann et al., 2000). It may be possible in the future to improve electrical resistance-derived estimates of hydration with minimally invasive subdermal electrolyte sensors. Alternatively, future automatic monitoring of urinary excretion rates and solute concentrations may provide valuable insight into hydration status and other aspects of acute soldier health.
Metabolic Status/Energy Reserve—Modeling the Metabolic Fuel Requirements of Soldiers
Field rations may not always meet the nutritional needs of soldiers (Friedl and Hoyt, 1997). Negative fat balance, commonly associated with undereating in the field, can usually be managed with little consequence by drawing on substantial body-fat reserves. Body-fat energy reserves can be calculated from percent body fat, as estimated from waist circumference less the 5 percent absolute minimum body-fat levels attainable in underfed healthy male soldiers (Friedl et al., 1994). However, negative carbohydrate balance, which is common in the field and associated with decreased endurance capacity and loss of lean mass, is
more difficult to manage due to the body’s limited carbohydrate reserves. Can monitoring technologies help ensure that field rations meet the fuel requirements of physically active soldiers?
Carbohydrate requirements of soldiers can be estimated from aerobic fitness, daily activity patterns, and the metabolic cost of locomotion (Hoyt et al., 1997). Maximum aerobic capacity can be derived from the Army’s Annual Physical Fitness Test 2-mile run for time results (Mello et al., 1988). Daily activity patterns can be derived from heart rate or actigraphy (Redmond and Hegge, 1985). The metabolic cost of locomotion can be derived from total weight and foot-ground contact times (pedometry) (Hoyt and Weyand, 1996; Kram and Taylor, 1990) or from the Pandolf equation and body weight, load weight, and geolocation (including velocity of movement, grade, and footing) (Pandolf et al., 1977). Knowing the metabolic rate and the maximum aerobic capacity for each individual, an exercise intensity profile can be generated (i.e., percent of maximum aerobic capacity over time). Oxygen consumption can be partitioned into carbohydrate and fat combustion by assuming a given relationship between resting or exercise intensity and the nonprotein respiratory exchange ratio (RER=carbon dioxide production/oxygen consumption) and using standard conversion factors. The exercise intensity-RER relationship chosen might be more fat-predominant than that of fully fed individuals (Åstrand and Rodahl, 1986) due to practical limits on the amount of food soldiers can carry.
Remote Trauma Triage
Warfighters are expected to be widely dispersed on the battlefield and minimal medical care will be available to combat casualties. To help improve remote casualty management, a remote trauma triage system is being developed. This remote triage system, part of the WPSM system, will contain sensors and algorithms that allow medics to remotely detect ballistic wounding events and to determine casualty life signs and the need for a major surgical life-saving intervention (Holcomb et al., In press). Parameters important in life-sign detection after wounding include responsiveness to radio contact, motion, body position, cardiac activity, and systolic blood pressure. Distilled health-state information will help the medic use medical resources (time, equipment, supplies) effectively.
Altitude Acclimatization
Soldiers deploying to elevations above 2,800 m (~ 8,000 ft) may experience Acute Mountain Sickness (AMS) (Pandolf et al., 1988). AMS is characterized by headache, nausea, fatigue, decreased appetite, and poor sleep, often with signs of poor balance and mild swelling of the face, hands, and feet. Without special preparation, a large proportion of a military unit rapidly inserted at high altitude is likely to develop acutely debilitating symptoms. Normally, AMS is
TABLE D-2 Age, Physical Characteristics, Total Load Carried, and Maximal Aerobic Capacity of Two Soldiers—A Heat Exhaustion Casualty (Cadet), and an Unaffected 509th Soldier from the 1/509th Infantry Brigade (Airborne)
either absent or resolves within 3 to 4 days following ascent. However, maladaptation can lead to life-threatening, high-altitude pulmonary or cerebral edema. Individual acclimatization state can be assessed by comparing blood-oxygen saturation for a given ascent profile (i.e., SaO2 for the reported or measured exposure to hypobaric hypoxia), with that expected with normal acclimatization. An ability to monitor and model acclimatization status will make it easier to plan high-altitude missions and minimize altitude illnesses.
AN EXAMPLE APPLICATION—CHARACTERISTICS OF A HEAT CASUALTY
Heat strain provides a demonstration of nascent capabilities for physiological monitoring. Reliable predictions of soldier mental status and performance capabilities are not yet available, while the assessment of frank casualties has been possible for some time through the use of clinical monitoring technologies. Progressive heat strain moves on a continuum from impaired cognitive function to frank casualty and presents one of the first opportunities to provide commanders with useful predictions of failing performance before a soldier becomes an environmental stress casualty. Collection of field data that includes clear medical outcomes makes it possible to backtrack to earlier indicators of the impending health risk and develop more precise predictive thresholds of individual risk.
A pair of soldiers was engaged in similar training activities during a hot-weather field exercise at the Joint Readiness Training Center, Fort Polk, Louisiana. Although the two soldiers performed similar activities from about 1130 to 1400 h (ambient temperature=32°–34°C; relative humidity=46–55 percent; solar load=800–875 W/m2; wind speed=1–2 ms−1), and both were fed and hydrated, only one became a heat casualty. Soldier characteristics, including maximal aerobic capacity determined using the method of Weyand and colleagues (2001), are shown in Table D-2. Geolocation data (not shown) was collected using a Global Positioning System and Dead Reckoning Module (Model
DRM III, Point Research Corp., Fountain Valley, California). Ambulatory heart-rate data, from an electrocardiography, and core temperature data, via an ingested temperature radio telemetry pill (Human Technologies Inc., St. Petersburg, Florida), were also collected. PSI was calculated (Moran et al., 1998). Posthoc data analysis showed that the difference in response to heat stress was due to a number of factors. The heat casualty had a higher body-fat percent, carried a heavier load, was less physically fit, and was not heat acclimated (by interview) as compared with his unaffected cohort. In this instance, integrating multiple data streams was essential to the process of understanding a multistressor physiological events. In contrast, experiences in the intensive care unit (ICU), where equally or more complex biological challenges present themselves, suggests multiple data streams may not always be necessary. For example, decades ago Dr. Hans Weil introduced the great toe temperature as an effective integrator of many complex physiologic variables (Joly and Weil, 1969; Vincent et al., 1988). This has resulted in more explicit ICU protocols that have favorably changed both clinician compliance and patient outcome. The minimum number and type of data streams needed for useful physiological status monitoring in the field, where noise, sensor failure, and changeable biophysical conditions are common, deserves further investigation.
In conclusion, physiological and metabolic monitoring offers a number of potential benefits for dismounted warfighters. However, achieving these benefits is scientifically and technically challenging.
Acknowledgments: The authors express their gratitude to Drs. S.R.Muza and W.R.Santee for useful discussions and to Mr. Mark Buller for preparing the innovative data displays. The authors are also indebted to Mr. Tom Theaux, Captain William P.Gaffney, and the soldier test volunteers from the 1/509th Infantry Battalion (Airborne), Fort Polk, Louisiana, for making the hot weather study possible.
Disclaimer: The opinions and assertions expressed in this paper are those of the authors and do not necessarily express the official views of the Department of the Army. The study data presented is from volunteers who gave their free and informed consent. Investigators adhered to AR 70–25 and USAMRMC Regulation 70–25 on Use of Volunteers in Research.
REFERENCES
Åstrand PO, Rodahl K. 1986. Textbook of Work Physiology, Physiological Bases of Exercise. 3rd ed. New York: McGraw-Hill.
Berneis K, Keller U. 2000. Bioelectrical impedance analysis during acute changes of extracellular osmolality in man. Clin Nutr 19:361–366.
Friedl KE, Hoyt RW. 1997. Development and biomedical testing of military operational rations. Ann Rev Nutr 17:51–75.
Friedl KE, Moore RJ, Martinez-Lopez LE, Vogel JA, Askew EW, Marchitelli LJ, Hoyt RW, Gordon CC. 1994. Lower limit of body fat in healthy active men. J Appl Physiol 77:933–940.
Holcomb JB, Niles SE, Hinds D, Aoki N, Salinas J, Flannigan TJ, Macaitis JM, Duke JH, Moore FA. In press. Prehospital physiologic data and life saving interventions in trauma patients. J Trauma.
Hoyt RW, Weyand PG. 1996. Advances in ambulatory monitoring: Using foot contact time to estimate the metabolic cost of locomotion. In: Marriott BM, Carlson SJ, eds. Emerging Technologies for Nutrition Research: Potential for Assessing Military Performance Capability. Washington, DC: National Academy Press. Pp. 1–29.
Hoyt RW, Young AJ, Matthew WT, Kain JE, Buller M. 1997. Warfighter Physiological Status Monitoring (WPSM): Body Core Temperatures During 96 H of Swamp Phase Ranger Training. Natick, MA: U.S. Army Research Institute of Environmental Medicine.
Hoyt RW, Reifman J, Coster TS, Buller MJ. 2002. Combat medical informatics: Present and future. In: Kohane IS, ed. Biomedical Informatics: One Discipline. Proceedings of the 2002 AMIA Annual Symposium. Bethesda, MD: American Medical Informatics Association.
Joly HR, Weil MH. 1969. Temperature of the great toe as an indication of the severity of shock. Circulation 39:131–138.
King CN, Lum G. 2002. Cold weather injuries among active duty Soldiers, US Army, January 1997-July 2002. Med Surveill Mon Rep 7:2–5.
Koulmann N, Jimenez C, Regal D, Bolliet P, Launay JC, Savourey G, Melin B. 2000. Use of bioelectrical impedance analysis to estimate body fluid compartments after acute variations of the body hydration level. Med Sci Sports Exerc 32:857–864.
Kram R, Taylor CR. 1990. Energetics of running: A new perspective. Nature 346:265–267.
Kraning KK, Gonzalez RR. 1997. A mechanistic computer simulation of human work in heat that accounts for physical and physiological effects of clothing, aerobic fitness, and progressive dehydration. J Therm Biol 22:331–342.
Mello RP, Murphy MM, Vogel JA. 1988. Relationship between a two mile run for time and maximal oxygen uptake. J Appl Sports Sci Res 2:9–12.
Montain SJ, Sawka MN, Wenger CB. 2001. Hyponatremia associated with exercise: Risk and pathogenesis. Exerc Sports Sci Rev 29:113–117.
Moran DS, Shitzer A, Pandolf KB. 1998. A physiological strain index to evaluate heat stress. Am J Physiol 275:R129-R134.
Moran DS, Castellani JW, O’Brien C, Young AJ, Pandolf KB. 1999. Evaluating physiological strain during cold exposure using a new cold strain index. Am J Physiol 277:R556-R564.
O’Brien C, Hoyt RW, Buller MJ, Castellani JW, Young AJ. 1998. Telemetry pill measurement of core temperature in humans during active heating and cooling. Med Sci Sports Exer 30:468–472.
Pandolf KB, Givoni B, Goldman RF. 1977. Predicting energy expenditure with loads while standing and walking very slowly. J Appl Physiol 43:577–581.
Pandolf KB, Sawka MN, Gonzalez RR, eds. 1988. Human Performance Physiology and Environmental Medicine at Environmental Extremes. Traverse City, MI: Cooper Publishing Group.
Redmond DP, Hegge FW. 1985. Observations on the design and specification of a wrist-worn human activity monitoring system. Behav Res Methods Instrum Comput 17:659–669.
Sawka MN, Wenger CB, Pandolf KB. 1996. Thermoregulatory responses to acute exercise-heat stress acclimation. In: Fregley MJ, Blatteis CM, eds. Handbook of Physiology, Section 4: Environmental Physiology. New York: Oxford University Press. Pp. 157–185.
Toner MM, McArdle WD. 1988. Physiological adjustments of man to the cold. In: Pandolf KB, Sawka MN, Gonzalez RR, eds. Human Performance Physiology and Environmental Medicine at Environmental Extremes. Traverse City, MI: Cooper Publishing Group.
Vincent JL, Moraine JJ, van der Linden P. 1988. Toe temperature versus transcutaneous oxygen tension monitoring during acute circulatory failure. Intensive Care Med. 14:64–68.
Weyand PG, Kelly M, Blackadar T, Darley JC, Oliver SR, Ohlenbusch NE, Joffe SW, Hoyt RW. 2001. Ambulatory estimates of maximal aerobic power from foot-ground contact times and heart rates in running humans. J Appl Physiol 91:451–458.
Wright HF, Wilmore JH. 1974. Estimation of relative body fat and lean body weight in a United States Marine Corps population. Aerospace Med 45:301–306.
BIOMARKERS OF PHYSIOLOGICAL STRAIN DURING EXPOSURE TO HOT AND COLD ENVIRONMENTS
Andrew J.Young, Michael N.Sawka, Kent B.Pandolf U.S. Army Research Institute of Environmental Medicine
Soldiers experience thermal (heat and cold) stress arising from the combined effects of environment, clothing insulation, and body heat production. Alterations in body temperatures (core, skin, and muscle) above and below normal levels can lead to thermal illness and injury and also degrade performance. Humans regulate core temperature within a narrow range (35°–41°C) through both behavioral and physiological responses to thermal stress. When conscious actions to minimize or avoid thermal stress by modifying activity levels, changing clothes, and seeking shelter do not completely negate thermal stress,
TABLE D-3 Core Temperature Measures
|
Site |
Advantage |
Disadvantage |
|
Esophageal |
Accurate, rapid response |
Uncomfortable, affected by swallowing |
|
Rectal |
Accurate, measurement ease |
Slow response, uncomfortable, cultural objections |
|
Auditory canal—tympanic membrane |
Measurement ease |
Inaccurate (biased by skin and ambient temperature), uncomfortable |
|
Oral |
Measurement ease |
Inaccurate (affected by mouth breathing) |
|
“Pill” |
Accurate, measurement ease |
Pill movement influences measurement, signal “cross talk” between subjects in close proximity |
physiological responses are activated that enhance dissipation or conservation of body heat stores, as appropriate, through alterations in metabolic rate, blood flow between the core and the skin, and sweating. Activation of these responses works to maintain temperature homeostasis, but it also results in physiological strain. In this brief review, human physiological responses elicited in response to exposure to extremes of hot and cold will be summarized with a view to identifying potential biomarkers of physiological strain. Further, an example of how such biomarkers can be used collectively to assess physiological strain and warn of impending health and performance degradation during exposure to heat and cold will be presented.
CORE TEMPERATURE
Thermal strain is most commonly assessed by the measurement of body core temperature. There is no one “true” core temperature because of temperature differences among different sites in the core. Core temperature is often measured at the esophagus, rectum, mouth, tympanum, and auditory meatus. Measurement methods employed for each of these sites and the relative advantages and disadvantages of each are discussed in detail by Sawka and colleagues (1996) and summarized in Table D-3. In brief, most thermal physiologists consider esophageal temperature to be the most accurate and reliable noninvasive index of core temperature for humans, followed in preference by rectal temperature and gastrointestinal tract temperature measured using ingestible temperature sensor pills, the latter of which is ideally suited for ambulatory monitoring outside of laboratories (O’Brien et al., 1998). Oral (sublingual), tympanic, and auditory meatus temperatures are widely used as reflections of core temperature, but all are influenced to some degree by head and face skin temperatures, as well as by ambient temperature, and are sensitive to inaccuracies related to proper placement of the sensor.
HEAT STRAIN
Heat Stress
Heat stress increases the requirements for sweating and circulatory responses to dissipate body heat. When the ambient temperature is warmer than skin, the body gains heat from the climate, which increases the heat the body must dissipate. In addition, exercise increases metabolic rate and thus increases the rate that heat must be dissipated to keep core temperature from increasing to dangerous levels. Climatic heat stress and exercise interact synergistically.
The Wet Bulb Globe Temperature (WBGT) is widely used as a quantitative index of climatic heat stress for use in regulating permitted physical activity level and strategies to minimize the risk of heat injury. WBGT is an empirical index of climatic heat stress but does not quantify physiological strain. It is calculated as outdoor WBGT=0.7 natural wet bulb+0.2 black globe+0.1 dry bulb, or as indoor WBGT=0.7 natural wet bulb+0.3 black globe. High WBGT values can be achieved either through high humidity, as reflected in high wet bulb temperature, or through high air (dry bulb) temperature and solar load, as reflected in black globe temperature. While useful, WBGT underestimates the risk of heat injury for humid conditions, and the index was originally developed for predicting resting comfort conditions and does not consider clothing or exercise intensity (metabolic rate), so it cannot predict heat exchange between a person and the climate or the physiological strain of thermoregulation (Sawka and Young, 2000). The National Weather Service uses a similar index, referred to as the Heat Index, which, in theory, provides the temperature sensed by the body when the ambient temperature and humidity are combined (NWS, 2003). This index, like the WBGT, does not consider the level of physical activity or clothing in estimating strain.
Thermoregulatory Responses to Heat Stress
During exercise, core temperature initially increases rapidly and subsequently increases at a reduced rate until heat loss equals heat production and steady-state values are achieved. The core temperature increase represents the storage of metabolic heat that is produced as a by-product of skeletal muscle contraction. At the beginning of exercise, the metabolic rate increases immediately, while thermoregulatory effector responses that enable heat dissipation respond more slowly, but eventually heat loss increases sufficiently to balance metabolic heat production, allowing a new steady-state core temperature to be achieved. Within a range of conditions known as the “prescriptive zone,” the magnitude of the increase in core temperature is independent of climatic conditions and proportional to the metabolic rate (Sawka et al., 1996).
Outside the prescriptive zone, the increase in core temperature is no longer independent of ambient conditions (Sawka and Young, 2000). During compensable heat stress, thermoregulatory responses may still dissipate heat at a rate allowing a steady-state core temperature to be maintained, albeit at a higher
level than within the prescriptive zone. However, there are biophysical limits to heat exchange between the climate and the body, and the relative contributions of dry and evaporative heat exchange to total heat loss varies with climatic conditions. As ambient temperature increases, the gradient for dry heat exchange diminishes and evaporative heat exchange becomes more important. When the ambient temperature equals or exceeds skin temperature, evaporative heat exchange will account for virtually all heat loss. Evaporation is limited by the vapor pressure of water in air, thus, increasing humidity constrains evaporative heat loss. Uncompensable heat stress occurs when the maximal evaporative cooling capacity of the ambient environment exceeds the amount of evaporative cooling required to dissipate metabolic heat production, and a steady-state core temperature cannot be achieved.
Core temperature provides a reliable physiological index to predict the incidence of exhaustion from heat strain (Sawka and Young, 2000). Figure D-3 presents the relationships between core temperature and incidence of exhaustion from heat strain for heat-acclimated persons exercising in uncompensable or compensable heat stress. During uncompensable heat stress, exhaustion was rarely associated with a core temperature below 38°C, and exhaustion always occurred before a temperature of 40°C was achieved, whereas during compensable heat stress, there are many reports of individuals whose core temperatures exceed 40°C at exhaustion (Sawka and Young, 2000). For example, Joy and Goldman (1968) reported that 35 of 63 (56 percent) elite soldiers were still performing military tasks when core temperature reached 39.5°C, and Pugh and colleagues (1967) observed that the core temperature of 7 out of 47 marathon runners exhibited core temperatures > 40°C (highest value was 41°C) immediately upon completion of the race. Thus, increasing core temperatures may be useful for predicting onset of heat exhaustion within a group of individuals, but the relationship between core temperature and time to exhaustion is greatly influenced by the environment (compensable versus uncompensable heat stress) and individual variability due to fitness and other factors.
Other commonly measured physiological responses indicative of thermal strain during heat stress include skin temperature, sweating rate, and heat rate. Increases in both skin temperature and sweat rate do occur with increasing heat strain, but both skin temperature and sweat rate vary considerably depending on the site of the body where the measurements are made. Further, the ambient air/water temperature surrounding the body can influence temperature measured at the skin unless steps are taken to carefully insulate the sensor from the environment. Similarly, sweating rate at a given metabolic rate varies with environmental conditions, fitness, hydration, and acclimatization status of the individual. Therefore, while skin temperature and sweat rate are useful measurements for laboratory studies of thermoregulation, these variables are probably of limited value for use as generalized biomarkers for monitoring an individual’s heat strain.
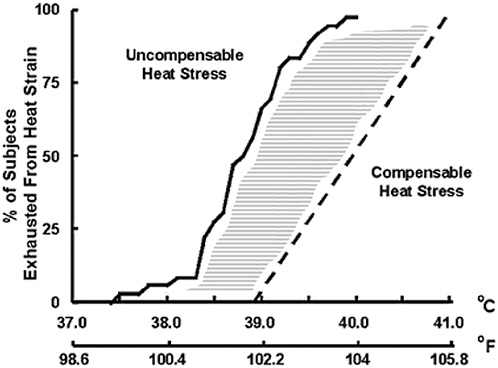
FIGURE D-3 Relationships between core temperature and incidence of exhaustion from heat strain.
SOURCE: Reprinted, with permission Sawka and Young (2000), Exercise and Sport Science, Lippincott Williams & Wilkins©.
Heart rate, on the other hand, is easy to measure and is a useful index of thermal strain. During exercise, metabolic rate and heat production may be ten times their levels at rest, and delivery of heat to the skin to achieve core-to-skin heat transfer sufficient for thermal balance must increase proportionately in order to reestablish thermal balance. Since skin temperature increases in warmer environments, the core-to-skin temperature gradient becomes relatively narrow in hot environments, and skin blood flow must be rather high to achieve sufficient heat transfer to maintain thermal balance during exercise. During exercise in the heat, the primary cardiovascular challenge is to provide simultaneously enough blood flow to exercising skeletal muscle to support its metabolism and enough blood flow to the skin to dissipate heat. High skin blood flow often is associated with reduced cardiac filling and with stroke volume, which require a higher heart rate to maintain cardiac output. Therefore, elevation of the heart rate response to exercise is an index of the increased cardiovascular strain required for thermoregulation during heat stress. The ease of measuring heart rate
makes it a good candidate for monitoring thermal strain during exercise heat stress.
Metabolic Responses to Heat Stress
Exercise in the heat also reportedly increases plasma or muscle lactate levels, and accelerated muscle glycogenolysis during exercise is sometimes observed, suggesting that glycolytic metabolism has been increased (Young, 1990). Whether this metabolic effect reflects Q10 effects, reduced oxygenation due to reduced perfusion of metabolically active tissue, reduced hepatic removal of plasma lactate, or some combination of those effects remains contentious. However, changes in blood lactate levels are too nonspecific to be useful as indexes of thermal strain.
There is growing evidence in both humans and animals of a role for serotonin (5-HT) accumulation in the brain for the genesis of fatigue from exercise hyperthermia (Cheuvront and Sawka, 2001). Monitoring changes in brain 5-HT levels is not feasible, but peripheral measurements of prolactin (PRL) concentrations are an accepted marker for brain serotonergic activity. The most recent findings indicate that an increase in PRL in response to exercise heat strain is only observed above a core temperature threshold of 38°C. Thus, while PRL release may provide useful information regarding the development of serotonergic fatigue, the apparent existence of a 38°C temperature threshold for PRL suggests that PRL may be a useful metabolic marker to denote early thermal strain in the heat.
COLD STRAIN
Cold Stress
Humans usually rely on behavioral strategies like wearing clothing or remaining in shelters to protect themselves against the cold. However, the nature of most outdoor winter-time military activities limits the efficacy of behavioral strategies. When behavioral thermoregulation provides inadequate protection from the cold, physiological responses are elicited.
When ambient temperature is colder than body temperature, the resulting thermal gradient favors body heat loss. Besides ambient temperature, wind speed, solar radiation, and humidity also influence the heat loss potential. No single cold-stress index integrates all these effects with respect to the heat loss potential of the environment, but one, the Wind Chill Index (WCI), has achieved widespread acceptance and use. The WCI estimates the environmental cooling rate from the combined effects of the wind and air temperature. Lacking any better tool for quantifying cold stress, these tables are useful to help guide decisions concerning the conduct or cancellation of outdoor activities, but the computational formula for the WCI probably overestimates the risk of tissue freezing as wind speed increases, while underestimating the effect of decreasing air
temperature. Further, the WCI estimates the risk of tissue freezing only for the exposed skin of sedentary persons, and wearing windproof clothing greatly reduces wind chill effects.
Water has a much higher thermal capacity than air, and the cooling power of the ambient environment is greatly enhanced under cold-wet conditions. During water immersion, conductive and convective heat transfer can be 70-fold greater than in air of the same temperature, depending on the water depth or body surface immersed in the water and the individual’s metabolic rate. Thus, even when water temperatures are relatively mild, persons swimming, wading streams, swamps, or through surf can lose considerable amounts of body heat. Furthermore, when clothing becomes wet due to rain or accidental immersion, its insulative value is compromised, and wetting of the skin facilitates heat loss by conduction, convection, and evaporation.
Physiological Responses to Cold Stress
Since the exposed body surface loses heat faster than it is replaced, skin temperature declines upon exposure to cold. When skin temperature falls below about 35°C, a peripheral vasoconstriction is elicited, mediated by increased sympathetic nervous activity that decreases peripheral blood flow and reduces convective heat transfer between the body’s core and shell (skin, subcutaneous fat, and skeletal muscle). This effectively increases insulation, retarding heat loss and defending core temperature, but at the expense of a decline in temperature of peripheral tissue that can contribute to the etiology of cold injuries. If tissue temperature falls below 0°C, freezing tissue injury will ensue, the severity of which will be related to the extent of freezing. Thus, monitoring skin temperature during cold exposure can provide information regarding the likelihood of developing freezing tissue injury.
The vasoconstrictor response to cold is pronounced in the hands and fingers, making them particularly susceptible to cold injury and a loss of manual dexterity. In these areas, another vasomotor response, cold-induced vasodilation (CIVD), develops (characterized by transient increases in blood flow to the cooled finger to periodically rewarm skin following the initial decline during cold exposure). The CIVD is thought to be beneficial in maintaining dexterity and preventing cold injury, suggesting that by monitoring the presence or absence of such a response during cold exposure might be useful for predicting cold effects, but no clear evidence exists to support this idea.
The other major physiological mechanism elicited during cold exposure is an increased metabolic heat production that helps offset heat losses. Muscle is the principal source of this thermogenic response in humans. Shivering, an involuntary series of rhythmically repeated muscle contractions, may start immediately or after several minutes of cold exposure, usually beginning in torso muscles and then spreading to the limbs. During muscular contraction, approximately 70 percent of total energy expended is liberated as heat. Certain animals can increase in metabolic heat production by noncontracting tissue in response
to cold exposure (such as nonshivering thermogenesis), but no clear evidence indicates that humans share this mechanism.
As cold stress becomes more severe, shivering intensity increases and more muscles are recruited to shiver. Oxygen uptake increases as a result of the increasing metabolic requirement of shivering, and the increase in oxygen uptake is related to the intensity of shivering. As mentioned above, heat losses and body cooling are generally more pronounced during cold-water immersion than during exposure to cold air, and the stimulus for shivering is greater in the water. As a result, whole body oxygen uptake usually increases more during immersion in cold water, often reaching 25–45 percent maximal oxygen uptake or higher, than during exposure to cold air where oxygen uptakes of 15 percent of maximal are more common (Sawka and Young, 2000). This might suggest that measuring oxygen uptake could provide a means to assess shivering intensity, and this is the case for inactive, nonexercising persons. However, muscular contractions associated with exercise also increase heat production, and this heat production can mitigate the need for shivering (see Figure D-4).
At low exercise intensities in the cold, metabolic heat production is not high enough to prevent shivering. Thus, oxygen uptake is higher, with the increased oxygen uptake representing the added requirement for shivering activity. As metabolic heat production rises with increasing exercise intensity, core and skin temperatures are maintained and the afferent stimulus for shivering declines, causing the shivering-associated component of total oxygen uptake during exercise to also decline. At high intensities, exercise metabolism is high enough to completely prevent shivering, and oxygen uptake during exercise is the same in cold and temperate conditions. The exercise intensity at which metabolic heat production is sufficient to prevent shivering depends on the severity of cold stress, which, in any given environment, will vary among individuals (see below). As a result, the utility of using oxygen uptake/metabolic rate measurements as an qualitative index of shivering activity is limited. On the other hand, more direct measurements of muscular contractile activity via actigraphy, accelerometry, or even electromyography might provide useful quantitative indices of shivering activity.
Cold exposure also influences metabolism. For example, the increased sympathetic nervous activity that mediates the cold-induced vasoconstrictor response described above also results in a pronounced rise in circulating norepinephrine concentrations. Increased norepinephrine concentrations are thought to promote glycogenolysis and glycolytic metabolism (Young, 1990), and some evidence suggests that glycogenolysis and blood lactate accumulation during light-intensity exercise can be higher in the cold than in temperate conditions. The increased glycogen use during low-intensity exercise has been attributed to the additional metabolic cost of shivering, but it is also possible that high circulating norepinephrine levels favor a shift in energy substrate metabolism favoring carbohydrate utilization. Unfortunately, a myriad of exercise, environmental,
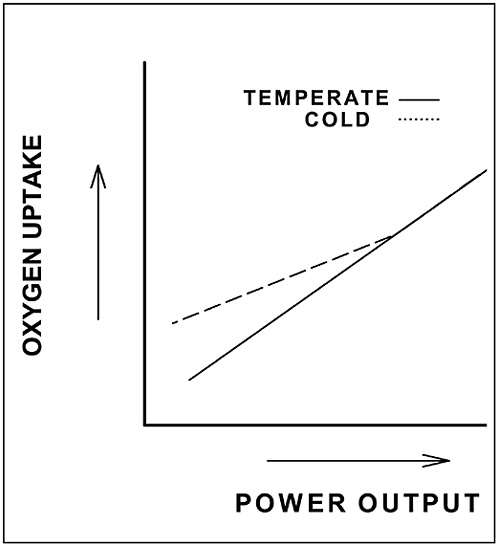
FIGURE D-4 Effect of cold-induced shivering on oxygen uptake during exercise at different intensities.
SOURCE: Adapted from Young et al. (1996)
and dietary factors can cause norepinephrine and lactate concentrations to increase and muscle glycogen breakdown to accelerate, so these responses are too nonspecific to provide any useful information about thermal strain during cold exposure.
Factors Modifying Thermoregulatory Responses to Cold
Although measuring skin temperature and shivering activity during cold exposure are feasible, and monitoring skin temperature might provide a means to predict the danger of freezing tissue injury, neither of these indices appear entirely reliable as indices of whole-body thermal strain. For example, while blunted shivering contributes to the impaired ability to maintain core temperature during cold exposure observed with exertional fatigue (Young et al., 1998) or prolonged cold exposures (Castellani et al., 1998), there are patterns of cold acclimatization in which shivering responses to cold also become blunted but, simultaneously, other adjustments develop to mitigate heat loss and enhance body heat conservation (Young, 1996). Also, fatter persons shiver less but experience smaller declines in body temperature than lean persons exposed to the same cold conditions because subcutaneous fat provides significant insulation against heat loss in the cold (Gagge and Gonzalez, 1996). Thus, differences in shivering response to cold may not always reflect important differences in thermal strain. Similarly, while the decline in skin temperature during cold exposure does reflect the cold-induced vasoconstrictor response, it is well known that the steady-state skin temperature maintained during exposure to a given cold condition can be influenced by the thickness of subcutaneous fat, fitness level, acclimatization state, and level of exercise or activity, not to mention clothing (Gagge and Gonzalez, 1996; Young, 1996). Thus, if only a single parameter is to be monitored to assess overall thermal strain in the cold, core temperature probably provides more meaningful information than measurements of either shivering or skin temperature.
Integrative Approach to Predicting Thermal Strain
Measuring or monitoring any single parameter to reflect thermal strain may be of limited value. To address this limitation, indices that integrate information from several parameters have been developed. For example, WBGT and Wind Chill both attempt to combine multiple climatic measurements into a single value reflective of the environmental stress level. Those indices predict the capacity of the environment to induce physiological strain, but not the strain actually experienced. However, Moran and colleagues (1998, 1999) have described an approach to integrate multiple physiological parameters into a single value reflective of the thermal strain experienced during exposure to heat or cold stress.
Two separate equations, one for use with heat stress and the other for cold stress, have been derived using a similar conceptual basis (Moran et al., 1998, 1999). The equations are constructed to compute the strain value, which can range from 0 (no/little strain) to 10 (very high strain) from the measured values of the physiological input parameters. Both equations assume that core temperature (both the absolute and the change from the normal resting level) is of fundamental importance in assessing the strain. Further, the Physiological Strain
Index (PSI) equation derived to predict strain in heat stress conditions incorporates a heart rate parameter because it was assumed that, with heat stress, cardiovascular strain associated with meeting thermoregulatory requirements would contribute to the overall physiological strain. PSI is calculated as
PSI=5(TCt−TC0)/(39.5−TC0)+5(HRt−HR0)/(180−HR0)
in which TCt and HRt are simultaneous measurements of core temperature and heart rate at a particular time during the heat stress exposure, and TC0 and HR0 are initial (pre-stress) measurements. The weighting factors for core temperature and heart rate are the same, reflecting the assumption that each contributes equally to the strain.
The Cold Strain Index (CSI), derived to predict physiological strain during exposure to cold, replaces the heart rate parameter with a skin temperature parameter because heart rate is little affected by cold, per se, whereas skin temperature does change quickly in response to the environmental stress and is known to provide afferent stimulus for shivering and vasoconstriction. The parameter weighting used in CSI differ from those in PSI and were chosen to mimic the weightings used to calculate mean body temperature from core and skin temperature (Pandolf and Moran, 2002). Thus, CSI is calculated
CSI=6.67(TCt−TC0)/(35−TC0 )+3.33(TSKt−TSK0)/(20−TSK0)
in which, again, TCt and TSKt are the simultaneously measured values for core and skin temperature at a particular time during cold exposure, and TC0 and TSK0 are the initial (pre-stress) values.
Moran evaluated PSI values calculated using databases from six independent experimental studies in which human volunteers experienced exercise/heat stress and reported that PSI very adequately reflects the heat strain experienced for different climatic conditions, clothing ensembles, hydration states, and exercise intensities, and between subjects of differing ages and genders (Pandolf and Moran, 2002). A similar approach to evaluate CSI calculated using databases from three independent experimental studies in which human volunteers were exposed to different cold air or cold water immersion conditions also indicated that CSI effectively depicted cold strain (Pandolf and Moran, 2002), but the authors acknowledged that the evaluation of CSI needed to consider a wider range of ambient conditions. Further development of CSI appears necessary to consider the effects of exercise on the calculated strain value (Castellani et al., 2001).
SUMMARY
Climatic heat stress and exercise interact synergistically and may strain physiological systems to their limits, impairing performance and increasing susceptibility to heat injury. Heat stress increases requirements for sweating and circulatory responses to dissipate body heat, and these physiological adjustments combined with rising body temperatures may have metabolic effects. Core body temperature and heart rate are considered reliable physiological parameters for monitoring heat strain, while monitoring skin temperature and sweat rates probably provide less important information due to the wide variability in these responses. The possibility that changes in peripheral metabolites, such as circulating prolactin levels, may provide information about central nervous system heat strain remain to be definitively examined.
In the cold, the ability to maintain body heat balance and normal body temperatures will depend primarily on the severity of climatic cold stress and clothing insulation and to a lesser extent on the influence of physiological responses. Exposure to cold elicits shivering thermogenesis, but the response to a given environment varies widely among individuals depending on their clothing, acclimatization, activity level, and body composition. Thus, monitoring the intensity of shivering may not provide useful information regarding cold strain being experienced by individuals exposed to cold. Cold-induced vasoconstriction decreases blood flow to peripheral tissues, favoring conservation of body heat at the expense of a decline in skin temperature and increased susceptibility to cold injury; thus, monitoring skin temperature, particularly in unprotected skin regions exposed to cold or areas receiving poor circulation, can provide prediction regarding development of freezing tissue injury. Changes in core temperature provide a reliable index of whole-body cooling and cold strain experienced by individuals, and reduced core temperature can degrade the ability to achieve maximal metabolic rate and submaximal endurance performance.
Possibly, no one parameter can provide a complete assessment of thermal strain under all conditions. Information from multiple physiological parameters is likely to be the best approach to quantitatively assessing thermal strain to predict injury or performance degradation. More research is needed to identify the most appropriate parameters to assess physiological strain during exposure to heat and cold strain, and to formulate the appropriate weighting and calculations to integrate the information from these multiple inputs.
Disclaimer: The views, opinions, and findings contained in this report are those of the authors and should not be construed as an official Department of the Army position, policy, or decisions unless so designated by other official documentation. Approved for public release; distribution is unlimited.
REFERENCES
Castellani JW, Young AJ, Sawka MN, Pandolf KB. 1998. Human thermoregulatory responses during serial cold water immersions. J Appl Physiol 85:204–209.
Castellani JW, Young AJ, O’Brien C, Stulz DA, Sawka MN, Pandolf KB. 2001. Cold strain index applied to exercising men in old-wet conditions. Am J Physiol 281:R1764–R1768.
Cheuvront SN, Sawka MN. 2001. Physical exercise and exhaustion from heat strain. J Korean Soc Living Environ System 8:134–145.
Gagge AP, Gonzalez RR. 1996. Mechanisms of heat exchange: Biophysics and physiology. In: Fregly MJ, Blatteis CM, eds. Handbook of Physiology. Section 4: Environmental Physiology. New York: Oxford University Press. Pp. 45–84.
Joy RJT, Goldman RF. 1968. A method of relating physiology and military performance: A study of some effects of vapor barrier clothing in a hot climate. Mil Med 133:458–470.
Moran DS, Shitzer A, Pandolf KB. 1998. A physiological strain index (PSI) to evaluate heat stress. Am J Physiol 275:R129-R134.
Moran DS, Castellani JW, O’Brien C, Young AJ, Pandolf KB. 1999. Evaluating physiological strain during cold exposure using a new cold strain index. Am J Physiol 277:R556-R564.
NWS (National Weather Service). 2003. Heat Index. Online. National Oceanic and Atmospheric Administration. Available at http://www.crh.noaa.gov/pub/heat.htm.
O’Brien C, Hoyt RW, Buller MJ, Castellani JW, Young AJ. 1998. Telemetry pill measurement of core temperature in humans during active heating and cooling. Med Sci Sports Exerc 30:468–472.
Pandolf KB, Moran DS. 2002. Relatively new heat and cold strain predictive indices. In: Tochihara XY, ed. Environmental Ergonomics. Fukuoka, Japan: Kyushu Inst. Design. Pp. 163–168.
Pugh LG, Corbett JL, Johnson RH. 1967. Rectal temperature, weight losses and sweat rates in marathon running. J Appl Physiol 23:347–352.
Sawka MN, Young AJ. 2000. Physical exercise in hot and cold climates. In: Garrett WE, Kirkendall DT, eds. Exercise and Sports Science. Baltimore, MD: Lippincott, Williams & Wilkins. Pp. 385–399.
Sawka MN, Wenger CB, Pandolf KB. 1996. Thermoregulatory responses to acute exercise-heat stress and heat acclimation. In: Fregly MJ, Blatteis CM, eds. Handbook of Physiology. Section 4: Environmental Physiology. New York: Oxford University Press. Pp. 157–186.
Young AJ. 1990. Energy substrate utilization during exercise in extreme environments. Exerc Sport Sci Rev 18:65–117.
Young AJ. 1996. Homeostatic responses to prolonged cold exposure: Human cold acclimatization. In: Fregly MJ, Blatteis CM, eds. Handbook of Physi-
ology.Section 4: Environmental Physiology. New York: Oxford University Press. Pp. 419–438.
Young AJ, Sawka MN, Pandolf KB. 1996. Physiology of Cold Exposure. In: Marriott BM, Carlson SJ, eds. Nutritional Needs in Cold and in High-Altitude Environments. Washington, DC: National Academy Press. Pp. 127–147.
Young AJ, Castellani JW, O’Brien C, Shippee RL, Tikuisis P, Meyer LG, Blanchard LA, Kain JE, Cadarette BS, Sawka MN. 1998. Exertional fatigue, sleep loss and negative energy balance increase susceptibility to hypothermia. J Appl Physiol 85:1210–1217.
HYDRATION STATUS MONITORING
Robert Carter III, Samuel N.Cheuvront, Margaret A.Kolka, Michael N.Sawka, U.S. Army Research Institute of Environmental Medicine
DEFINITION AND DOCUMENTATION
This paper reviews widely used indices of hydration status in humans. For the purposes of this review, euhydration will refer to “normal” total body water (TBW), whereas hypohydration will refer to a body water deficit. The term dehydration will be used to refer to the dynamic process of body water loss (i.e., the transition from euhydration to hypohydration) (Greenleaf and Sargent, 1965; Sawka, 1992). The term hypovolemia will define when blood volume is less than “normal.”
IMPACT ON HUMAN PERFORMANCE
Both physical and cognitive performance are impaired proportionally to the magnitude of body water loss incurred (Gopinathan et al, 1988; Sawka, 1988) However, even small losses of body water (1–2 percent body mass [BM]) have a detrimental impact on physical work and negatively impact human thermoregulation (Sawka, 1988; Sawka et al., 2001). Accordingly, dehydration may be the greatest nonadversary threat to military operations.
FLUID BALANCE, DISTRIBUTION, AND EXCHANGE
Adequate hydration is essential for maintaining effective military field operations. Several common operational stresses can result in relatively large alterations in TBW content and distribution. During most normal conditions, humans have little trouble maintaining optimal fluid balance. However, many factors, such as sickness, physical exercise, climatic exposure (heat, cold, altitude), and psychological strain, can lead to significant disturbances in water bal-
ance. Perhaps the best example of this is the combination of heat stress and physical activity. For sedentary persons in temperate conditions, water requirements usually range from 2 to 4 L/day, and water balance is regulated primarily by the kidneys. For physically active persons exposed to heat stress, water requirements can often more than double (Sawka et al., 2001), and it would not be unusual for physically active, heat-stressed individuals to incur water deficits of several liters.
Water is the largest single constituent of the body (50–70 percent of body weight) and is essential for supporting the cardiovascular and thermoregulatory systems and cellular homeostasis. TBW is distributed into intracellular fluid (ICF) and extracellular fluid (ECF) compartments. The ICF and ECF contain ~65 percent and ~35 percent of TBW, respectively (Guyton et al., 1975). The ECF is further divided into the interstitial and plasma spaces. The average 75 kg male has ~45 L of TBW; therefore, ICF contains ~30 L of water, whereas the ECF contains ~15 L of water with ~3.4 L in plasma and ~11.6 L in the interstitium. These volumes are not static, but represent the net effect of dynamic fluid exchange and turnover between compartments (Guyton et al., 1975). Exercise heat stress not only stimulates fluid loss, primarily by sweating, but also it induces electrolyte imbalances and changes in renal function. As a result, fluid deficits with and without proportionate solute changes can occur. In addition, exercise heat stress alters transcompartmental and transcapillary forces that redistribute fluids between various compartments, organs, and tissues (Sawka et al., 2001). For these reasons, the accuracy of most methods used to assess hydration status is limited by the circumstances in which they are measured and the purposes for which they are intended.
DEHYDRATION AND MUSCLE WATER
Incomplete fluid replacement decreases total body water and, as a consequence of fluid exchange, affects each fluid space. For example, Nose and colleagues (1983) determined the distribution of body water loss among the fluid spaces as well as among different body organs during dehydration. They thermally dehydrated rats by 10 percent of body weight, and the fluid deficit was apportioned between the intracellular (41 percent) and extracellular (59 percent) spaces. The distribution of organ fluid loss was muscle (40 percent), skin (30 percent), viscera (14 percent), and bone (14 percent). However, no significant changes occurred in liver and brain water content. Nose and colleagues (1983) concluded that dehydration results in water distribution largely from the intra and extracellular spaces of muscle and skin.
The measurement of TBW is the “gold standard” to assess hydration status (Aloia et al., 1998; Lesser and Markofsky, 1979). TBW can be directly measured with doubly labeled water (DLW) or other dilution techniques. The major drawbacks of the DLW and other dilution methodologies are the cost and the technical difficulties associated with isotope analyses. The requirement for an isotope ratio mass spectrometer and sample preparation systems often limits the
use of this method in most military scenarios. In addition, to obtain accurate changes in TBW with these methodologies, serial measurements are required, which further limits their use for routine assessment of TBW changes for hydration assessment. Although the choice of specific biomarker for assessing hydration status should ideally be sensitive and accurate enough to detect relatively small fluctuations in body water, the practicality of its use (time, cost, and technical expertise) is also of significant importance.
Estimates of hydration status are commonly done using (1) bioelectrical impedance analysis, (2) plasma markers and fluid regulatory hormones, (3) urine indices, (4) changes in body weight, or (5) signs and symptoms. Given consideration to military field operational use, hydration assessment measurements are presented in order of increasing assessability and practicality.
METHODS FOR HYDRATION STATUS MONITORING
Bioelectrical Impedance
Recently, bioelectric impedance (BIA) has gained attention because it is simple to use and allows rapid, inexpensive, and noninvasive estimates of TBW (O’Brien et al., 2002). In practice, a small constant current, typically 800 μA at a fixed frequency, usually 50 kHz, is passed between electrodes spanning the body. The voltage drop between these electrodes provides a measure of bioimpedance. Prediction equations, previously generated by correlating impedance measures against an independent estimate of TBW, may be used subsequently to convert a measured impedance to a corresponding estimate of TBW (Kushner et al., 1992). Absolute BIA values are well correlated with dilution TBW techniques (Kushner et al., 1992; Van Loan, 1990).
BIA does not have sufficient accuracy to assess dehydration (~7 percent TBW) and loses resolution with isotonic fluid loss (O’Brien et al., 2002; Van Loan, 1990). In addition, since fluid and electrolyte concentrations can have independent effects on the BIA signal, it can often provide grossly misleading values regarding hydration status (O’Brien et al., 2002). Therefore, BIA has little application for the field assessment of hydration status.
Plasma Markers
Plasma volume changes can be estimated from hemoglobin and hematocrit changes; however, accurate measurement of these variables requires considerable control for posture, arm position, skin temperature, and other factors (Sawka, 1988). If adequate controls are employed, plasma volume decreases in proportion with the level of exercise-heat mediated dehydration. Likewise, plasma volume decreases with dehydration, and this response varies due to the type of dehydration (isoosmotic or hyperosmotic), physical activity, physical fitness, and heat acclimatization status (Sawka, 1988).
Plasma osmolality is controlled around a set-point of 280–290 mOsmol/kg in euhydrated volunteers (Senay, 1979). This narrow range increases ~ 5 mOs-mol/kg for every 1 to 2 percent BM of dehydration incurred (Popowski et al., 2001). Figure D-5 presents the effects of body water loss on resting plasma osmolality and plasma volume in heat acclimated persons undergoing exercise-heat mediated dehydration (Sawka and Coyle, 1999). These same levels will be maintained during subsequent physical exercise. If an isoosmotic dehydration occurs, such as with altitude or cold exposure (O’Brien et al., 1998; Sawka, 1992), then plasma osmolality changes will not follow TBW changes and much larger plasma volume reductions will occur.
Plasma sodium concentration provides an alternative to measuring osmolality (as most of the osmolality changes are usually reflective of sodium changes). However, that linear relationship may not be as strong as expected (Senay, 1979).
Osmolarity is sensed in the hypothalamus by osmoreceptors, and those neurons, in turn, stimulate the production of antidiuretic hormone. When plasma osmolarity is below threshold, the osmoreceptors are not activated and antidiuretic hormone secretion is suppressed. When osmolarity increases above the threshold for alcohol dehydrogenase release, the osmoreceptors recognize this as the cue to stimulate the neurons that secrete antidiuretic hormone. Figure D-6 shows that antidiuretic hormone concentrations rise steeply and linearly with increasing plasma osmolarity (Robertson and Athar, 1976). If hydration status changes are the result of water loss, the plasma solute concentration (osmolality) will change proportionately. However, the relationship of plasma osmolarity and vasopression concentrations is confounded by exercise, hyperthermia, nausea, and fluid volume changes (Norsk, 1996).
Aldosterone, secreted by the adrenal cortex, is a potent hormone regulating electrolyte balance. Aldosterone acts directly on the kidney to decrease the rate of sodium-ion excretion with accompanying retention of water and to increase the rate of potassium-ion excretion. Dehydration-mediated elevations in aldosterone secretion are confounded by heat acclimation status and exercise (Francesconi et al., 1983). The measurement of plasma volume, osmolality, sodium, aldosterone, and adenovirus proteinase (AVP) requires phlebotomy (invasive), technical skill, and expensive instrumentation.
Urine
Urinalysis is a frequently used clinical measure to distinguish between normal and pathological conditions. Urinary markers of hydration status include urine specific gravity (USG), urine osmolality (UOsmol), and urine color. Urine specific gravity and osmolality are quantifiable and threshold values can have some value, whereas color is subjective and can be influenced by many factors. It is important to recognize that the accuracy of these urinary indices in assessing chronic hydration status is improved when the first morning urine is used,
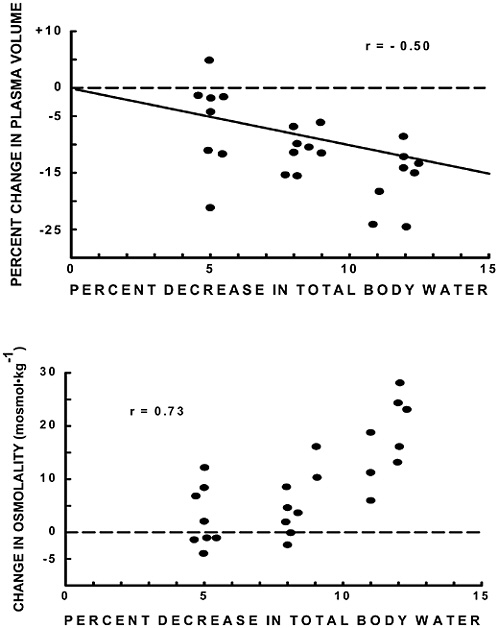
FIGURE D-5 The effects of body water loss on resting plasma osmolality and plasma volume in heat acclimated persons undergoing exercise-heat mediated dehydration.
SOURCE: Reprinted, with permission Sawka and Coyle (1999). Influence of body water and blood volume on thermoregulation and exercise performance in the heat. Exerc Sport Sci Rev 27:167–218.
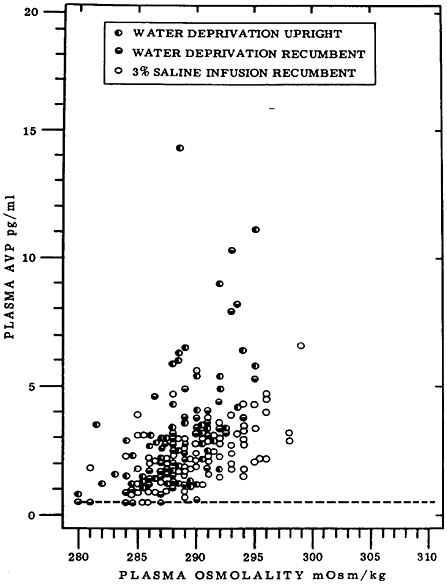
FIGURE D-6 Plasma vasopressin concentrations compared with plasma osmolarity.
SOURCE: Reprinted, with permission, Robertson and Athar (1976). Copyright 1976, The Endocrine Society.
because this urine has a more uniform volume and concentration (Sanford and Wells, 1962; Shirreffs and Maughan, 1998). Likewise, many additional factors, such as diet, medications, exercise, and previous climatic exposure, can confound these indices.
The most widely used urine index is USG. Measured against water as a standard (1.000 g/ml), USG represents the concentration of particles dissolved in
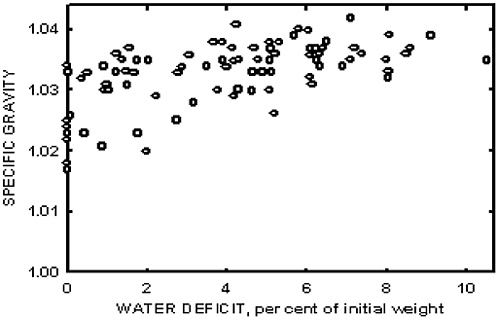
FIGURE D-7 Relation between specific gravity of urine and body water deficit.
SOURCE: Reprinted, with permission from Adolph et al. (1969).
urine and is a reflection of the kidney’s ability to concentrate or dilute urine in relation to plasma. Because urine is a solution of water and various other substances, normal values range from 1.010 to 1.030 (Armstrong et al., 1994; Popowski et al., 2001; Sanford and Wells, 1962). It has been suggested that a USG of≤1.020 represents a state of euhydration (Armstrong et al., 1994; Sanford and Wells, 1962). As a measure of chronic hydration status, USG appears to accurately reflect a hypohydrated state when in excess of 1.030 (Armstrong et al., 1994; Popowski et al., 2001; Sanford and Wells, 1962). However, considerable variability exists and no single value can be used to determine a specific hydration level (see Figure D-7). UOsmol also can provide an approximation of hydration status (Shirreffs and Maughan, 1998) as it is highly correlated with, but more variable than, USG (Armstrong et al., 1994; Popowski et al., 2001).
Endocrine responses to dehydration stimulate water and electrolyte retention by the kidney. However, while the linear rise in plasma osmolality (with hypovolemia) that occurs with dehydration (Popowski et al., 2001) stimulates vasopressin and the tubular reabsorption of water at the kidney, the renal response lags behind changes in plasma osmolality during acute fluxes in body water (2–4 hr) brought on by dehydration-rehydration (Popowski et al., 2001). In fact, when large volumes of water are consumed, a pale-colored urine with
low specific gravity is excreted long before euhydration is achieved (Shirreffs and Maughan, 1998) due to rapidly declining AVP levels triggered by the swallowing reflex. When water is consumed in excess of sweat losses during exercise, urine output increases and fluid balance is not restored unless sufficient electrolytes are also consumed (Maughan et al., 1996). Logically, UOsmol is therefore also limited for assessing acute changes in body water (Kovacs et al., 1999; Popowski et al., 2001).
Body Mass
BM measurements represent the simplest technique for rapid assessment of changes in hydration status. In our laboratory, we observe very small (<1 percent) fluctuations in first morning BM when measured over consecutive days in young men taking food and fluid ad libitum. The stability of this measurement, coupled with the known losses of fluid that occur with exercise-heat exposure (primarily eccrine sweat), allows rapid changes in BM (incurred over hours) to be correctly attributed to water loss. Acute changes in BM weight are therefore a popular and reasonable field estimate of dehydration (Cheuvront et al., 2002).
The level of dehydration is expressed as a percentage of starting body weight ([ΔBW/startBW]×100) rather than as a percentage of TBW because TBW ranges from 50 to 70 percent of body weight. This technique assumes that (1) starting body weight represents a euhydrated state, and (2) 1 ml of sweat loss represents a 1 g change in weight (i.e., specific gravity of sweat is 1.000 g/ml). As an acute measure, first morning body weight is still limited by changes in bowel habits. Body weight is also limited as a tool for long-term assessment of hydration status since the changes in body composition (fat and lean mass) that may occur with chronic energy imbalance are also reflected grossly as changes in body weight. Clearly, the use of daily body weight should be used in combination with another hydration assessment technique to dissociate gross tissue losses from water losses if long-term hydration status is of interest.
Signs and Symptoms of Dehydration
In the early stages of dehydration, no signs or symptoms are apparent. However, as greater body water losses occur, increased thirst, increased pulse rate, and increased rectal temperature present. In addition, body-water loss of 1 to 5 percent can be associated with flushed skin, nausea, sleepiness, and reductions in economy of movement. Body-water losses of 6 to 10 percent are associated with dizziness, headache, tingling in limbs, decreased blood volume, and cyanosis. Severe dehydration, 11 to 20 percent body water, results in delirium, numb skin, deafness, and spasticity. Furthermore, death is likely as greater body-water loss occurs. Assessment of dehydration via signs and symptoms is easy and quick; however, these estimates are too imprecise to accurately
TABLE D-4 Biomarkers for Hydration Assessment
|
Marker |
Advantages |
Disadvantages |
|
Signs and symptoms |
Easy, quick |
Imprecise |
|
Total body water, dilution |
Valid, reliable |
Premeasurement, invasive, complex |
|
Total body water, bioelectric impedance |
Easy, rapid |
Premeasurement, imprecise |
|
Plasma volume |
— |
Premeasurement, invasive |
|
Osmolality |
Often valid, reliable |
Imprecise |
|
Sodium |
Hyponatremia |
Invasive, complex |
|
Fluid reg. hormones |
Often valid |
Invasive, imprecise |
|
Urine |
Easy, rapid, screen |
Invasive, sometimes confounded, complex |
|
Saliva |
Easy |
Imprecise, easily confounded |
|
Body weight |
Easy, rapid |
Invalid |
determine hydration status. Nevertheless, if any of the signs and symptoms of dehydration present, rehydration should begin immediately.
CONCLUSIONS
Under most conditions, day-to-day BM changes (>2 percent) and first morning urine specific gravity (>1.030), when used together, provide an approximate indication that an individual is hypohydrated (see Table D-4). However, plasma osmolality changes can provide more reliable information regarding hydration when greater precision is required. Measurement of fluid regulatory hormones for routine hydration assessment are not necessary and are often confounding. Moreover, BIA has limited utility to assess hydration status in the field for reasons previously described. It is possible that other technological advances may allow evaluation of other measures (e.g., muscle water content) that hold promise as hydration indices.
Disclaimer: The views, opinions, and/or findings contained in this publication are those of the authors and should not be constructed as an official Department of the Army position, policy, or decision unless so designated by other documentation.
REFERENCES
Adolph EF. 1969. Physiology of Man in the Desert. New York: Hafner Publishing Co. P. 103.
Aloia JF, Vaswani A, Flaster E, Ma R. 1998. Relationship of body water compartments to age, race, and fat-free mass. J Lab Clin Med 132:483–490.
Armstrong LE, Maresh CM, Castellani JW, Bergeron MF, Kenefick RW, La-Gasse KE, Riebe D. 1994. Urinary indices of hydration status. Int J Sport Nutr 4:265–279.
Cheuvront SN, Haymes EM, Sawka MN. 2002. Comparison of sweat loss estimates for women during prolonged high-intensity running. Med Sci Sports Exerc 34:1344–1350.
Francesconi RP, Sawka MN, Pandolf KB. 1983. Hypohydration and heat acclimation: Plasma renin and aldosterone during exercise. J Appl Physiol 55:1790–1794.
Gopinathan PM, Pichan G, Sharma VM. 1988. Role of dehydration in heat stress-induced variations in mental performance. Arch Environ Health 43:15–17.
Greenleaf JE, Sargent F 2nd. 1965. Voluntary dehydration in man. J Appl Physiol 20:719–724.
Guyton A, Taylor A, Granger H. 1975. Circulatory Physiology II: Dynamics and Control of the Body Fluids. Philadelphia: WB Saunders.
Kovacs EM, Senden JM, Brouns F. 1999. Urine color, osmolality and specific electrical conductance are not accurate measures of hydration status during postexercise rehydration. J Sports Med Phys Fitness 39:47–53.
Kushner RF, Schoeller DA, Fjeld CR, Danford L. 1992. Is the impedance index (ht2/R) significant in predicting total body water? Am J Clin Nutr 56:835–839.
Lesser GT, Markofsky J. 1979. Body water compartments with human aging using fat-free mass as the reference standard. Am J Physiol 236:R215-R220.
Maughan RJ, Leiper JB, Shirreffs SM. 1996. Restoration of fluid balance after exercise-induced dehydration: Effects of food and fluid intake. Eur J Appl Physiol Occup Physiol 73:317–325.
Norsk P. 1996. Role of arginine vasopressin in the regulation of extracellular fluid volume. Med Sci Sports Exerc 28:S36-S41.
Nose H, Morimoto T, Ogura K. 1983. Distribution of water losses among fluid compartments of tissues under thermal dehydration in the rat. Jpn J Physiol 33:1019–1029.
O’Brien C, Young AJ, Sawka MN. 1998. Hypohydration and thermoregulation in cold air. J Appl Physiol 84:185–189.
O’Brien C, Young AJ, Sawka MN. 2002. Bioelectrical impedance to estimate changes in hydration status. Int J Sports Med 23:361–366.
Popowski LA, Oppliger RA, Patrick Lambert G, Johnson RF, Kim Johnson A, Gisolf CV. 2001. Blood and urinary measures of hydration status during progressive acute dehydration. Meet Sci Sports Exerc 33:747–753.
Robertson GL, Athar S. 1976. The interaction of blood osmolality and blood volume in regulating plasma vasopressin in man. J Clin Endocrinol Metab 42:613–620.
Sanford S, Wells B. 1962. The Urine. Philadephia: WB Saunders.
Sawka MN. 1988. Body Fluid Responses and Hypohydration During Exercise-Heat Stress. Indianapolis, IN: Cooper Publishing Group.
Sawka MN. 1992. Physiological consequences of hypohydration: Exercise performance and thermoregulation. Med Sci Sports Exerc 24:657–670.
Sawka MN, Coyle EF. 1999. Influence of body water and blood volume on thermoregulation and exercise performance in the heat. Exerc Sport Sci Rev 27:167–218.
Sawka MN, Montain SJ, Latzka WA. 2001. Hydration effects on thermoregulation and performance in the heat. Comp Biochem Physiol A Mol Integr Physiol 128:679–690.
Senay LC Jr. 1979. Effects of exercise in the heat on body fluid distribution. Med Sci Sports 11:42–48.
Shirreffs SM, Maughan RJ. 1998. Urine osmolality and conductivity as indices of hydration status in athletes in the heat. Med Sci Sports Exerc 30:1598–1602.
Van Loan MD. 1990. Bioelectrical impedance analysis to determine fat-free mass, total body water and body fat. Sports Med 10:205–217.
TECHNOLOGY FOR THE MEASUREMENT OF BLOOD LACTATE
David C.Klonoff, Mills-Peninsula Health Services
Glucose is metabolized by cells to produce energy. Glucose metabolism involves progressive oxidation plus breakage of carbon bonds. The oxidation process causes C-H and C-C bonds to be stripped of electrons (oxidized), which are then used to build adenosine triphosphate (ATP).
The initial steps in breakdown of glucose involve conversion of one 6-carbon molecule of glucose to two 3-carbon molecules of pyruvate. This process is known as glycolysis. Next, in the presence of oxygen, the carbon atoms in pyruvate are converted into three molecules of carbon dioxide in a process known as aerobic metabolism. When oxygen is available to serve as the final acceptor of electrons, then pyruvate is able to transfer electrons to the final acceptor, oxygen (or reduce), by way of a series of steps known as the Krebs cycle or the tricarboxylic acid cycle. When oxygen is totally reduced, it becomes water. Meanwhile, the carbon bonds of pyruvate all become oxidized to carbon dioxide.
Conversely, in the absence of oxygen, all the electron acceptors “downstream” from pyruvate are reduced and unable to offload electrons to mediators that will carry them toward oxygen. The carbon bonds are progressively oxidized in the Krebs cycle and the electrons’ energy is drawn off in steps through a process known as oxidative phosphorylation. The process is analogous to water falling down a dam and turning turbines, and at the same time the turbines
transfer energy to generators that produce electric power. The Krebs cycle is the dam, and the oxidative phosphorylation is the generator. Anaerobic metabolism is a state of water being backed up downstream so that there is no flow of water across the dam. Without oxygen, the backup of reduced substances reaches pyruvate, which cannot transfer its electrons into any chemicals within the Krebs cycle. Pyruvate itself then becomes reduced to lactate and broken down no further. The metabolic process that begins with glucose and ends with lactate is known as anaerobic metabolism. Lactate does not accumulate when oxygen is available.
Aerobic metabolism is preferable to anaerobic metabolism. More energy (defined as the number of ATP molecules generated per glucose molecule broken down) is derived from aerobic metabolism than from anaerobic metabolism. The combination of glucose ignition by way of glycolysis, the Krebs cycle, and oxidative phosphorylation in aerobic metabolism generates 36 ATP molecules per glucose molecule, whereas only two ATP molecules per glucose molecule are generated in anaerobic metabolism by glycolysis alone. When exercise is continued past the point of adequate oxygen delivery (such as during excessive training beyond the ability of cardiac output to supply adequate blood), then glucose breakdown switches from aerobic to anaerobic metabolism. Lactic acid builds up and the acid dissociates to lactate plus free hydrogen ions, which lower the pH of the blood. The acid load can damage muscles, including the heart, or even kill.
Currently, technology exists for portable monitoring of lactate to monitor people who are exercising heavily, such as athletes or soldiers in training. The technology is exclusively invasive and intermittent. Unlike the situation with portable monitoring of blood glucose, in which new monitors with advanced features are regularly introduced, there are only two portable lactate monitors on the market. No portable lactate monitors currently exist or are close to existing that are minimally invasive or noninvasive (only invasive), implanted (only external), continuous (only intermittent), or optical (only chemical).
The molecular weight of lactic acid is 90, while that of glucose is 180. Resting blood lactic acid concentrations normally range from 0.5 to 2.0 mmol/L, which are approximately one-fourth those of blood glucose. During anaerobic exercise, lactic acid levels may increase five- to tenfold up to 12 mmol/L.
Blood lactate levels can be used to determine the optimal workload for an athlete in training. Below the optimal workload, glucose metabolism is aerobic. At some point when the workload increases, the body’s ability to supply increasing amounts of oxygen to working muscles becomes limited. This is the lactate threshold, or the workload whereby lactate levels no longer rise slowly with increasing exertion, but instead rise rapidly. At the lactate threshold, glucose metabolism begins to be anaerobic as well as aerobic. At the inflection point of the curve in which lactate concentration is plotted against workload, it is best for athletes to decrease their amount of exertion to get back to or just below the lactate threshold. For a given individual, over a short term, heart rate is proportionate to workload, and heart rate is much easier to measure than workload. To
identify the optimal workload at which lactate is cleared approximately as fast as it is produced (without accumulation), an athlete’s lactate level can be measured and plotted against varying heart rates.
With improved cardiovascular function (i.e., increased fitness), the heart can deliver sufficient oxygen to maintain aerobic metabolism for progressively greater workloads. Conversely, with deconditioning, at progressively lower workloads, the lactate threshold is met. Therefore, for an athlete in training, determination of the lactate threshold (expressed as a workload level or a heart rate) indicates (1) the state of fitness (proportionate to the lactate threshold workload), and (2) the optimal work load at which to exercise whereby the workload is challenging, but potentially dangerous lactic acidosis can be avoided. Knowledge of the optimal workload is useful for an athlete in training, such as a soldier, to optimize the exercise regimen.
The lactate threshold can be calculated by performing a series of workouts at varying workloads that can be estimated by the heart rates associated with these workloads. The strategy involves initially exercising well beyond the lactate threshold to build up the blood lactate level, then decreasing the exercise to allow the lactate level to fall, and finally increasing the workload slightly to a point where the lactate level starts to rise once again. That point where lactate generation exceeds lactate clearance is the lactate threshold. The specific steps of how to calculate the lactate threshold are as follows: First is the lactate buildup phase, consisting of three 6-minute workouts (easy, medium, and hard), followed by a blood lactate measurement. Second is the lactate clearance phase, consisting initially of a 5-minute workout at a heart rate of 40 beats per minute below that of the workout rate, followed by a blood lactate measurement. The 5-minute workout should be repeated at a greater workload defined as a heart rate of 10 beats per minute higher and the blood lactate should be rechecked. Then the workout and lactate measurement should be repeated each time with a heart rate of 5 beats per minute more. Initially, the blood lactate will fall from that of the heavy exercise peak value, but with increasing workloads, the blood lactate level will begin to rise. The point where lactate production comes to exceed clearance is the lactate threshold.
Lactate monitors can be classified by size and there are three types: First are portable handheld monitors that are good for monitoring athletes and workers in the field. These include the Accusport/Accutrend (two different names for the same monitor), manufactured by Roche Diagnostics of Germany, and the Lactate Pro, manufactured by Ankray of Japan. Second, there are small bench-top monitors that can run on batteries and are only slightly mobile. These include the Little Champion monitor, manufactured by Analox and the YSI 1500 Sport Lactate Analyzer. These devices are somewhat cumbersome to use in the field, but can be so used if the instrument is fairly stationary. There are several bench-top lactate monitors that are used for hospital and research purposes. These devices are not suitable for studying athletes outdoors, but can be used within an indoor training facility. They include the Analox Champion Lactate Analyzer,
the YSI 2300 and 2700 Glucose plus Lactate Analyzers, the Kodak Ektachem DT60, and the Eppendorf Biosen 5130.
The portable lactate monitors resemble the blood glucose monitors of the late 1980s in their ease of use. The Accusport/Accutrend requires 20 μL of blood and 60 seconds of measuring time. The Lactate Pro requires 5 μL of blood and 50 seconds of measuring time. Neither monitor is approved for alternate site testing, and no portable lactate monitor has been developed for minimally invasive or noninvasive lactate testing and none has been developed for implantable, continuous, or optical lactate sensing.
If the need for faster and more convenient lactate measurement of soldiers, athletes, or other workers in the field is evident, then there is room for development of faster, more convenient lactate monitors using smaller volumes of blood. Because lactate has a structure similar to glucose, a goal for manufacturers of lactate monitors could be to produce lactate monitors as user-friendly as portable glucose monitors. There is an untapped potential for measuring lactate in more groups of exercising people and a need for better instruments to perform the monitoring.
UTILITY OF INSULIN-LIKE GROWTH FACTOR-I FOR ASSESSING METABOLIC STATUS DURING MILITARY OPERATIONAL STRESS
Bradley C.Nindl, Scott J.Montain, U.S. Army Research Institute of Environmental Medicine
MILITARY RELEVANCE OF MONITORING INSULIN-LIKE GROWTH FACTOR-I
Mission success in military tactical environments dictate that the warfighter be able to perform prolonged physical exertion in the face of food and sleep restriction (i.e., military operational stress). The physiological strain produced by these operational stressors can have deleterious effects on muscle mass, endocrine and metabolic function, as well as physical and mental performance (Friedl, 1999; Friedl et al., 2000; Nindl et al., 1997, 2002, 2003a, 2003b) (see Figure D-8). A goal of the U.S. Army Medical Research and Materiel Command’s biomedical research program is to identity useful biomarkers that are indicative of nutritional and physiological status that can be assessed rapidly, with minimally or noninvasive collection methods. Once identified, these biomarkers could potentially be used to sustain warfighter readiness and aid in assessing the effectiveness of intervention and recovery strategies.
The growth hormone/insulin-like axis is a central endocrine axis and is thought to mediate many of the somatotropic changes that are observed when
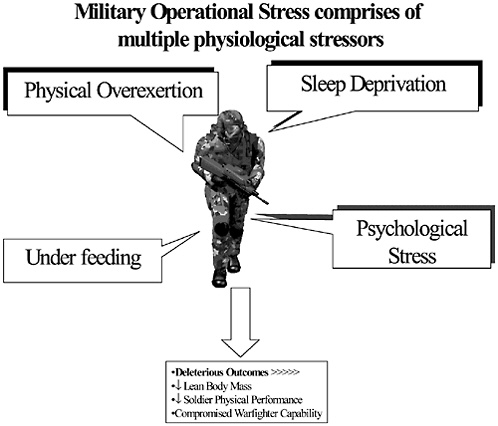
FIGURE D-8 Military operations place multiple stressors on the warfighter. These stressors typically occur simultaneously. The magnitude of the resulting strain is dependent on the severity of the stressors. The resulting physiological stain can result in deleterious outcomes on lean body mass ans soldier physical performance, and it can compromise warfighter readiness.
warfighters are exposed to harsh field environments (Florini et al., 1996; Friedl et al., 2000; Nindl et al., 2003a; Rosen, 1999; Rosendal et al., 2002). For this reason, periodic assessment of the growth hormone/insulin-like growth factor axis may have utility for sustaining warfighter health and performance. In direct support of the Objective Force Warrior’s vision of revolutionizing soldier performance by aggressively employing science and technology efforts that enhance the warfighter’s survivability, lethality, sustainment, and mobility on the modern battlefield, The Military Performance and Military Nutrition Division of the U.S. Army Research of Institute of Environmental Medicine have been evaluating insulin-like growth factor I (IGF-I) as a candidate biomarker for assessing nutritional stress. Our research has focused on (1) characterizing temporal response patterns of IGF-I and its family of binding proteins during military
operational stress, (2) the influence of macronutrient and energy intake on the circulating IGF-I system responses to stress, and (3) assessment of minimally invasive and field expedient collections methods for determination of IGF-I.
The purpose of this short review paper is to summarize why IGF-I has been of interest as a potential biomarker and our experimental strategies for evaluating the merits of IGF-I as a biomarker of nutritional and operational stress. This paper initially describes the complex nature of IGF-I regulation and relevance for the military, then the initial work characterizing the IGF-I response to military operational stress. The experimental outcomes suggest that IGF-I has potential value as a biomarker of nutritional strain during operational stress.
INSULIN-LIKE GROWTH FACTOR-I PHYSIOLOGY AND REGULATORY COMPLEXITY
The primary source of circulating IGF-I is the liver, but local release from tissues that secrete IGF-I in an autocrine/paracrine manner also contribute. IGF-I itself is a 7.6-kDa polypeptide consisting of 70 amino acids with three intrachain disulfide bonds. Only a small amount (<2 percent) of IGF-I, however, circulates in free form. Most circulates in either a binary (~20–25 percent) or ternary complex (~75 percent). When circulating in the binary form, IGF-I is complexed with one of six binding proteins (BPs 1–6), ranging in size from 22.8 to 31.4 kDa (see Figure D-9). The ternary complex consists of IGF-I, IGF BP-3, and an 80–86 kDa protein called the acid labile subunit (Baxter, 2000; Jones and Clemmons, 1995; Rajaram et al., 1997; Sara and Hall, 1990). An IGF-I specific protease is responsible for breaking the bonds holding the ternary complex together and making the IGF-I available for receptor binding. The IGF-I complexes are thought to regulate the availability of IGF-I to target tissues only the free and binary complexes can pass from the vascular compartment into the interstitial space. The different forms of BPs are also thought to play a role in transporting the IGF-I to the target tissue (Baxter, 2000; Sara and Hall, 1990).
IGF-I has several metabolic effects. It is known to promote amino acid uptake, enhance protein synthesis, and attenuate protein degradation (Florini et al., 1996; Rosen, 1999; Thissen et al., 1999). Additionally, IGF-I plays a role in stimulating cell growth and differentiation (Baxter, 2000; Florini et al., 1996).
The appeal of IGF-I as a biomarker is the dynamic nature in which circulating concentrations respond to nutritional stress. Underfeeding and proteincalorie malnutrition result in substantial reductions in IGF-I concentrations, and the response persists until the nutritional stress is removed (Friedl et al., 2000; Frystyk et al., 1999; Nindl et al., 2003a; Rand et al., 2003; Thissen et al., 1992, 1999). Additionally, IGF-I concentrations are relatively stable. Unlike hormones such as growth hormone, IGF-I displays little in the way of circadian variability, thus single time point samples are indicative of IGF-I status.
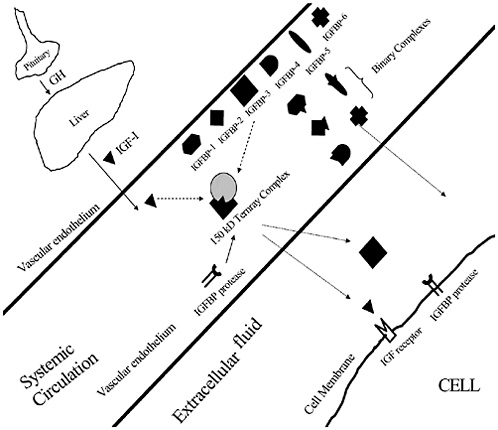
FIGURE D-9 Schematic of the IGF-I system showing the origin of release (i.e., liver), its family of binding proteins (BPs 1–6), ternary and binary complexes, and IGF-I trafficking from the circulation to the receptor.
EFFECTS OF MILITARY OPERATIONAL STRESS ON THE CIRCULATING IGF-I SYSTEM
U.S. Army Ranger Training
Friedl and colleagues performed experimental studies characterizing the physiological responses of soldiers participating in the U.S. Army Ranger Training Course (Friedl et al., 1994, 2000; Nindl et al., 1997). The data provide insight into the adaptive process that occurs as soldiers cope with sustained physical work, energy restriction, and sleep disruption. The U.S. Army Ranger training course is 62 days and is designed to teach and evaluate individual leadership and small-unit tactics under physically and mentally challenging conditions. The course includes multiday periods consisting of near-continuous physical activity, energy restriction and sleep deprivation. In the first investigation, energy intake was restricted to 1,300 kcal/day during the field-training portion
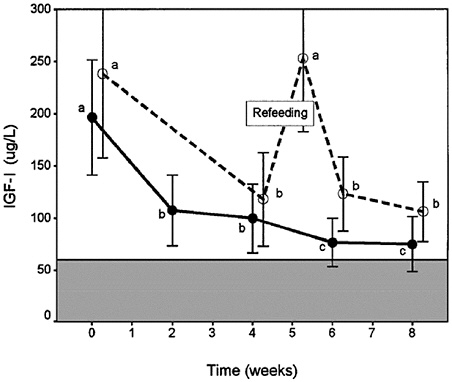
FIGURE D-10 Serum IGF-I concentrations over the 8-week U.S. Army Ranger Training Course. The solid lines represent the values from Study 1 and the dotted line represents the values from Study 2. Study 1 and Study 2 were conducted under identical conditions with the exception that during Study 2, the subjects received 400 more kcal/day than those in Study 1. Values are mean±standard deviation. Different letters represent mean values that are statistically different; the shaded area represents values below normal for young men.
SOURCE: Reprinted, with permission Friedl et al. JAP (2000).
of the course, and the periods of underfeeding produced average energy deficits of ~1,000 kcal/day over the entire course (Friedl et al., 2000). Average energy expenditures were ~4,000 kcal/day. At the end of the course, the participants had lost 13 to 16 percent of their initial body mass, ~65 percent of their fat mass, and 7 percent of their initial lean body mass. IGF-I, measured every 2 weeks during the Training Course, progressively declined through the first 6 weeks, with no further reduction over the final 2 weeks of the course (Figure D-10). At the end of the course, IGF-I values had fallen 62 percent (pre: 198±54 ng/mL−1 vs. post: 75±25 ng/mL−1). As Figure D-10 illustrates, most of the decrease in serum IGF-I occurred during the initial 2 weeks of the course. The potential of IGF-I as a discriminating variable for assessing nutritional and/or metabolic stress was the separate observation that the soldiers who had the
greatest decline in IGF-I were those that lost the most weight (r=−0.38, P< 0.01).
A second study with the U.S. Army Ranger Training Course enabled investigators to study the effects of altering the energy content of the diet on the metabolic and hormonal responses to the course (Friedl et al., 2000). In the second study, the training conditions were nearly identical, but the participants received additional calories during the energy restriction periods embedded within the course (+400 kcal/day). Additionally, to gain information about short-term responses to refeeding (while other course stressors remained undiminished), a blood sample was obtained after a week of access to food that was preceded by multiple days of energy restriction (~1,700 kcal/day) coupled with high-energy expenditures (>4,500 kcal/day). As illustrated in Figure D-10, the addition of 400 kcal/day significantly attenuated the decline in circulating IGF-I concentrations when compared with the group receiving fewer calories. Additionally, the investigators found that the brief period of refeeding was sufficient to temporarily restore IGF-I concentrations to baseline values. When food was again restricted after this brief refeeding period, IGF-I concentrations rapidly fell and remained low through the remainder of the course. These data demonstrate the sensitivity and responsiveness of IGF-I to energy and nutrient delivery. When energy is restricted, IGF-I values fall and remain low until energy restriction is removed. The provision of energy and the restoration of fuel stores are accompanied by an increase in IGF-I.
The traditional evaluation of nutritional status uses a global assessment of parameters that include anthropometric measures and the assay of serum proteins (Baxter et al., 1998). The proteins commonly measured include albumin, transferrin, prealbumin, and retinol binding protein. Transferrin is indicative of iron binding capability; retinol binding protein is indicative of vitamin A status and ability to transport vitamin A, prealbumin (considered by some to be best single marker of malnutrition due to its short half-life) is sensitive to protein malnutrition and zinc deficiency. The strength of these markers is that they provide insight into the nutritional status of the individual. Unfortunately, a number of non-nutritional factors can affect serum levels independent of dietary adequacy. For example, prealbumin levels fall with inflammation, albumin levels are affected by hydration state and oral contraceptive use, transferrin levels decline in response to protein malnutrition and with chronic illness and inflammatory states and liver disease. In contrast, IGF-I appears to be a more responsive and selective biomarker of energy status due to its rapid response to depletion and repletion (Baxter et al., 1998). The 2- to 4-hour half-life of IGF-I provides a distinct advantage versus other traditional serum protein biomarkers (prealbumin, ~2 days; albumin, 20 days; transferrin, 20 days).
In a study examining endocrine and metabolic recovery responses, Nindl and colleagues (1997) measured IGF-I, transferrin, ferritin, and prealbumin before and at the end of the U.S. Army Ranger Training Course and after 5 weeks of recovery. The 5-week recovery period produced a rebound effect such that
body mass was significantly higher than measured before starting the course. Body composition analysis revealed a 1.1-kg increase in fat-free mass and a 4.1-kg increase in fat mass above precourse values. IGF-I fell ~50 percent during the course and was 30 percent above baseline values after 5 weeks of recovery. Transferrin levels did not significantly change during Ranger training or during recovery. Prealbumin levels declined 21 percent during the course (26.8–21.3 mg/dL) and returned to baseline levels during the recovery period, but the levels at the end of the course (despite accruing an 11 percent body-mass loss) were well above values indicative of malnutrition (<15 mg/dL). Thus, in this study, IGF-I appeared more sensitive to changes in energy balance and body composition changes than the other markers of nutritional status.
Short-Term Military-Sustained Operations
To study the acute responses to energy and nutrient restriction, Nindl and colleagues (2003a) recently measured the circulating IGF-I and IGF binding proteins pattern of response to 4 days of near-continuous physical work, energy restriction, and sleep disruption. The participants had morning fasted blood drawn on days 1, 3, and 4 during a control week that contained physical performance testing but no sustained physical activity, caloric restriction, or sleep deprivation. They also had blood samples drawn on days 1, 3, and 4 of the experimental period that included the physical performance tests, near-continuous physical activity (energy expenditure ~4,500 kcal/day), energy restriction (~ 1,600 kcal/day), and sleep deprivation (6.2±1.1 hours over an 84-hour course). Blood was assayed for concentrations of total IGF-I, free IGF-I, IGFBPs 1, 3, and 6, and the acid-labile subunit. Additionally, in order to gain further insight into whether this type of stress altered the partitioning of IGF-I among its various molecular complexes, IGF-I and IGFBP-3 were measured before and after immunoaffinity depletion of acid-labile subunit complex (i.e., ternary complex removal), thus yielding estimates of ternary (high-molecular weight complexes) versus nonternary (low-molecular weight complexes) IGF-I (Khosravi et al., 2000). Two days of military operational stress significantly lowered circulating total and free IGF-I values, and they remained low with continued operational stress (Nindl et al., 2003a). Accompanying the IGF-I reductions were small reductions in IGFBP-3 and large increases in IGFBP-1. These changes in circulating IGFBP levels, however, were not associated with a measurable shift in the quantity of IGF-I circulating in ternary, binary, or free forms (Nindl et al., 2003a). The importance of these data for metabolic monitoring is that they show the speed with which the IGF-I system responds to energy and/or nutritional restriction. They also illustrate a potential method for investigating changes in the bioavailable IGF-I in response to nutritional stress.
Influence of Dietary Protein Content of Circulating IGF-I During Military Training
Both energy restriction and protein-energy malnutrition are known to suppress circulating IGF-I. There are many logistical challenges to sustaining adequate nourishment for soldiers during military field training (e.g., food preparation, storage, and delivery, and meals that provide adequate levels of calories and macro- and micronutrients). With increased operational tempo of current military maneuvers, space allocation for food is often sacrificed for weapons, ammunition, and other necessary field gear. It would therefore seem essential that the nutrients that are provided during military operational stress consist of an optimal macronutrient mix that may protect against the decline in circulating anabolic and growth factors (Friedl, 1999). The Recommended Dietary Allowance (RDA) for protein is 0.8 g/kg body mass. Current recommendations for physically active populations are 1.2 to 1.5 g protein/kg body mass (Fielding and Parkington, 2002; Rand et al., 2003). It is common for infantry type units to subsist on one to two Meals Ready-to-Eat (MRE) per day during field operations. The MRE is a 1,300-kcal ration comprising of 24 menus. Protein content of the ration ranges from 26 to 60 g with a mean value of 44 g. Thus, if soldiers are limited to one MRE per day, their diet is low in both energy and protein content. Even consuming two MREs per day, soldiers may still not meet the minimal RDA for protein.
To examine the hypothesis that dietary protein supplementation during military operational stress would attenuate the decline in IGF-I observed when units were fed insufficient energy and protein, we recently conducted a study during which dietary protein was manipulated, while controlling both carbohydrate and energy intake. Thirty-five Marines were randomly divided into either a group receiving a low energy-low protein diet (1,600 kcal/day and 0.5 g protein/kg body mass/day) or a group receiving a similar amount of energy but with sufficient added protein to receive approximately 1.0 g protein/kg body mass/day. The group was participating in an 8-day field exercise consisting of sustained physical activity (total daily energy expenditure measured in previous iterations has ranged from 17–25 MJ/day) and sleep deprivation. Morning fasted blood was obtained before, midway, and at the end of the course. Preliminary results show trends suggesting that protein supplementation may have attenuated the decline in IGF-I during the course. If a more thorough examination of the data supports this conclusion, these data would provide further support for the merit of monitoring IGF-I as a biomarker for metabolic status. Another observation from this study was that IGF-I displayed a different temporal pattern in response to the course than other conventional nutritional status indicators (e.g. ferritin, prealbumin, transferrin, and retinol binding protein). Transferrin and ferritin initially increased during the course but reversed towards baseline values during the latter half of the course, whereas retinol binding protein and prealbumin declined over the course, but more abruptly during the latter half. Thus, while both IGF-I and the conventional markers responded to the training stress, their differ-
ential response suggests that they each provide a different index of nutritional status.
Measurement of IGF-I with a Filter Paper Blood Spot Assay
If IGF-I is to be used as a metabolic status indicator during military operational stress, field-expedient methods for collection and measurement must be established. Field environments present unique logistical challenges compared with the laboratory. There is more likelihood of sample contamination, and since it is difficult and sometimes impossible to bring the laboratory equipment to remote field environments, sample collection, processing, and transportation become significant logistical hurdles.
A technique that has been used successfully to study malnutrition in underdeveloped countries is chemical analysis of dried blood spots (Diamandi et al., 1998; Mitchell et al., 1987). The technique requires minimal amounts of blood, minimal field processing, and no refrigeration during shipping. Mitchell and colleagues (1987) originally described measurement of IGF-I from blood spots using a conventional radioimmunoassay. More recently, Diamandi and colleagues (1998) described the extraction and measurement of IGF-I and IGFBP-3 from dried blood spots using an enzyme-linked immunoabsorbent assay.
To study whether the dried blood spot methodology could track IGF-I responses to military operational stress, both blood spots and conventional blood samples were collected in a recent field study that manipulated dietary protein intake (described above). We found that IGF-I measured from blood spots declined during the 8-day course and the magnitude of decline was similar to the decline measured using serum samples (Figure D-11) (Nindl et al., 2003b). Overall, the blood spot IGF-I and serum IGF-I significantly (p<0.05) correlated (r=0.92), but the blood spot values were on average 61 percent lower than serum (Nindl et al., 2003b). Diamandi and colleagues (1998) also reported lower (20–25 percent) IGF-I values from blood spots when compared with plasma samples. Several possible factors could have contributed to the differences in IGF-I using the two sampling techniques. First, in order to reduce preanalytical variance and ensure maximal extraction, it is essential that complete dryness of the blood spot is maintained until the sample is analyzed. In both our study and that of Diamandi and colleagues (1998), the blood spots were stored in plastic bags without addition of desiccant. Work by others suggests that moisture can produce a glassing effect whereby hygroscopic blood proteins impede elution. Assaying dried blood spots also assumes that an absolute and consistent blood volume is distributed onto each punch. If the volume of blood on filter paper was consistently overestimated, it may have contributed to the bias between the two sampling methods as IGF-I was purposefully measured using different assays. Regardless of the reason for the bias, the outcomes of this study reveal that the blood spot on filter paper technique can be applied for measurement of IGF-I
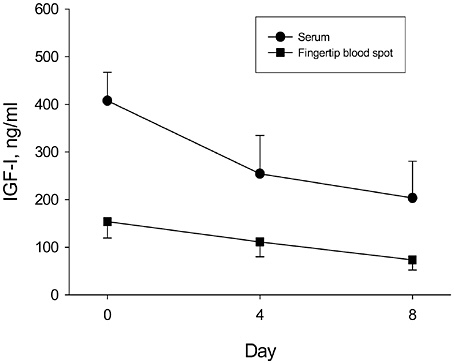
FIGURE D-11 Comparison between serum and filter paper blood spot IGF-I concentration during days 0, 4, and 8 of military operational stress. For both methods, a progressive decline over time was observed (day 0>day 4>day 8). Serum IGF-I was greater than filter paper blood spot IGF-I at each respective time point.
SOURCE: Reprinted, with permission Nindl et al. (2003b).
responses to military operational stress. The technique requires minimal blood and minimal equipment assets for sample collection, processing, and shipment. The filter paper blood spot method for IGF-I detected reductions accompanying nutritional stress and may be of potential value for characterizing the IGF-I response when conventional blood sampling methods are not feasible.
Future Directions and Enablers for the Objective Force Warrior
The data collected on the physiological responses to military operational stress support the potential utility of IGF-I as a metabolic sensor of energy status. IGF-I declines rapidly to energy restriction and remains a viable indicator of an altered energy state until the stressor is removed. IGF-I is sensitive to
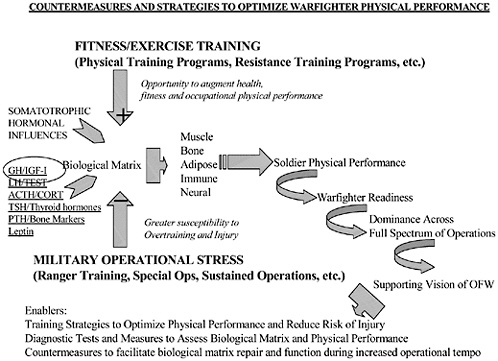
FIGURE D-12 A conceptual model depicting how a better understanding of somatotropic hormonal mediators may benefit soldier physical performance and support the vision of the Objective Force Warrior (OFW). Soldiers are exposed to rigorous physical training and military operational stress. These influences can either positively or negatively affect the body’s biological matrix. Changes in the biological matrix can affect soldier physical performance (e.g., declines in muscle mass will inhibit strength and power). Soldier physical performance directly contributes to warfighter readiness and dominance across the full spectrum of operations. Monitoring insulin-like growth factor-I (IGF-I) may have great utility for assessing physical training, evaluating recovery strategies, and sustaining performance during operational stress.
dietary changes and can be used to evaluate adequacy of protein intake independent of energy intake. Future work, however, must establish whether IGF-I alone or in combination with other biological indices can provide useful information to preserve the health and performance of military personnel during operational stress (Friedl, 2003). In addition, sampling and processing techniques must be established that are safe and reliable that require minimal logistical support and, most important, provide rapid feedback to personnel tracking physiological status.
While this review has exclusively focused on the use of IGF-I measurement during military operational stress, IGF-I may also have merit as a biomarker
during fitness and exercise training. Continued scientific efforts should focus on further elucidating the link between alterations in the biological matrix (e.g., muscle, bone, adipose, immune, and neural cells) and ensuing influences on soldier physical performance. A provocative hypothesis is that any changes in the biological matrix are mediated by somatotropic hormonal responses that act in both systemic and local mechanisms (Nindl et al., 2001, 2002). A greater understanding of the somatotropic influences mediating muscle repair and bone remodeling after the microtrauma of physical exertion and viable countermeasures that modulate muscle repair and tissue regeneration after microdamage is essential toward the transformation of the modern Army through Objective Force Warrior (see Figure D-12). To maintain dominance across the full spectrum of military operations, the twenty-first century warfighter must posses an optimal level of physical readiness and be able to recover quickly from fatigue and overexertion. IGF-I is emerging as a truly important regulator that is important to health and fitness. IGF-I is a promising outcome measure during altered energy states for military studies on the refinement of medical fitness standards, as well as on physical training and nutrition policies.
REFERENCES
Baxter RC. 2000. Insulin-like growth factor (IGF)-binding proteins: Interactions with IGFs and intrinsic bioactivities. Am J Physiol Endocrinol Metab 278:E967-E976.
Baxter RC, Hawker FH, To C, Stewart PM, Holman SR. 1998. Thirty-day monitoring of insulin-like growth factors and their binding proteins in intensive care unit patients. Growth Horm IGF Res 8:455–463.
Diamandi A, Khosravi MJ, Mistry J, Martinez V, Guevara-Aguirre J. 1998. Filter paper blood spot assay of human insulin-like growth factor I (IGF-I) and IGF-binding protein-3 and preliminary application in the evaluation of growth hormone status. J Clin Endocrinol Metab 83:2296–2301.
Fielding RA, Parkington J. 2002. What are the dietary protein requirements of physically active individuals? New evidence on the effects of exercise on protein utilization during post-exercise recovery. Nutr Clin Care 5:191–196.
Florini JR, Ewton DZ, Coolican SA. 1996. Growth hormone and the insulin-like growth factor system in myogenesis. Endocr Rev 17:481–517.
Friedl KE. 1999. Protein and amino acids: Physiological optimization for current and future military operational scenarios. In: The Role of Protein and Amino Acids in Sustaining and Enhancing Performance. Washington, DC: National Academy Press. Pp. 85–91.
Friedl KE. 2003. Insulin-like growth factor-I—A metabolic marker representing quality of life? Diabetes Technol Ther 5:463–465.
Friedl KE, Moore RJ, Martinez-Lopez LE, Vogel JA, Askew EW, Marchitelli LJ, Hoyt RW, Gordon CC. 1994. Lower limit of body fat in healthy active men. J Appl Physiol 77:933–940.
Friedl KE, Moore RJ, Hoyt RW, Marchitelli LJ, Martinez-Lopez LE, Askew EW. 2000. Endocrine markers of semistarvation in healthy lean men in a multistressor environment. J Appl Physiol 88:1820–1830.
Frystyk J, Delhanty PJD, Skjaerbaek C, Baxter RC. 1999. Changes in the circulating IGF system during short-term fasting and refeeding in rats. Am J Physiol 277:E245-E252.
Jones JI, Clemmons DR. 1995. Insulin-like growth factors and their binding proteins: Biological actions. Endocrine Rev 16:3–34.
Khosravi MJ, Diamandi A, Mistry J. 2000. Non-ternary complex IGF-I, IGF-II, and IGFBP-3 in normal, growth hormone deficient (GHD) and acromegalic subjects. In: Program and Abstracts Book. The Endocrine Society 82nd Annual Meeting. Chevy Chase, MD: The Endocrine Society. P. 483.
Mitchell ML, Hermos RJ, Moses AC. 1987. Radioimmunoassay of somatomedin-C in filter paper discs containing dried blood spots. Clin Chem 33:536–538.
Nindl BC, Friedl KE, Frykman PN, Marchitelli LJ, Shippee RL, Patton JF. 1997. Physical performance and metabolic recovery among lean, healthy men following a prolonged energy deficit. Int J Sports Med 18:317–324.
Nindl BC, Kraemer WJ, Marx JO, Arciero PJ, Dohi K, Kellogg MD, Loomis GA. 2001. Overnight responses of the circulating IGF-I system after acute, heavy-resistance exercise. J Appl Physiol 90:1319–1326.
Nindl BC, Leone CD, Tharion WJ, Johnson RF, Castellani JW, Patton JF, Montain SJ. 2002. Physical performance responses during 72 hrs of military operational stress. Med Sci Sports Exerc 34:1814–1822.
Nindl BC, Castellani JW, Young AJ, Patton JF, Khosravi MJ, Diamandi A, Montain SJ. 2003a. Differential responses of IGF-I molecular complexes to military operational field training. J Appl Physiol 95:1083–1089.
Nindl BC, Kellog MD, Khosravi MJ, Diamandi A, Alemany JA, Pietila DM, Young AJ, Montain SJ. 2003b. Measurement of insulin-like growth factor-I during military operational stress via a filter paper blood spot assay. Diabetes Technol Ther 5:455–461.
Rajaram S, Baylink DJ, Mohan S. 1997. Insulin-like growth factor-binding proteins in serum and other biological fluids: Regulation and functions. Endocr Rev 18:801–831.
Rand WM, Pellet PL, Young VR. 2003. Meta-analysis of nitrogen balance studies for estimating protein requirements in healthy adults. Am J Clin Nutr 77:109–127.
Rosen C. 1999. Serum insulin-like growth factors and insulin-like growth factor-binding proteins: Clinical implications. Clin Chem 45:1384–1390.
Rosendal L, Langberg H, Flyvbjerg A, Frystyk J, Orskov H, Kjaer M. 2002. Physical capacity influences the response of insulin-like growth factor and its binding proteins to training. J Appl Physiol 93:1669–1675.
Sara VR, Hall K. 1990. Insulin-like growth factors and their binding proteins. Physiol Rev 70:591–614.
Thissen J, Davenport ML, Pucilowska JB, Miles MB, Underwood LE. 1992. Increased serum clearance and degradation of 125I-labeled IGF-I in protein-restricted rats. Am J Physiol 262:E406-E411.
Thissen JP, Underwood LE, Ketelslegers JM. 1999. Regulation of insulin-like growth factor-I in starvation and injury. Nutr Rev 57:167–176.
THE USE OF PORTABLE ACCELEROMETERS IN PREDICTING ACTIVITY ENERGY EXPENDITURE
Kong Y.Chen, Vanderbilt University
“A soldier’s level of physical fitness has a direct impact on his combat readiness” (U.S. Army, 1998). The balance of energy intake (EI) and energy expenditure (EE) can significantly affect soldiers’ physical fitness, conditioning, and overall health. The predominant contributor to the variations of EE is physical activity. Unlike most civilian populations, soldiers are often subjected to negative energy balance (EE significantly exceeds EI) (Friedl and Hoyt, 1997). For optimum designs of food rations and physical training, accurate and detailed measurements of EE are crucial. However, our current techniques in assessing physical activity are limited, such that possible associations between physical activity and the related EE (EEACT) with respect to the health and performance in military personnel have not been well determined.
Daily EE can be categorized into three major components: basal or resting EE (also called basal metabolic rate), thermic effect of food (or food-induced thermogenesis), and EEACT. Resting EE is the rate of EE measured in postabsorptive, well-rested, and thermoneutral conditions. In sedentary subjects, resting EE is the major component of EE (Flatt, 1978). Inter-individual variations in resting EE of normal humans can be explained by differences in fat-free mass (the primary contributor), age, sex, familial traits, and fat mass (Ravussin and Bogardus, 1989; Ravussin et al., 1986). Thermic effect of food represents the increase in EE following meal ingestion for absorbing, processing, and storing the nutrients. There are two recognized subcomponents, obligatory and facultative thermogenesis, which combine to represent a small component to total EE (<8–10 percent) (Jéquier and Schutz, 1988; Welle et al., 1981) under normal conditions. EEACT is the largest variability to total EE in humans. Moderate walking can increase EE by three times, while a more vigorous activity such as running can elevate EE by ten times. Compared with civilians who generally have more sedentary lifestyles, EEACT is particularly important in soldiers’ nutritional and physiological state, affecting performance and overall health (Burstein et al., 1996; DeLany et al., 1989).
MATERIAL AND METHODS
Measuring Energy Expenditure
Doubly Labeled Water (DLW) is considered as the “gold standard” for measuring EE in the field or free-living conditions. It determines the net disappearance of hydrogen (through water) and oxygen (through water and carbon dioxide) by stable isotope labeling, that is, 2H218O (Schoeller and Hlinicka, 1996; Schoeller et al., 1982). The major advantage of the DLW method is its noninvasiveness and nonintrusiveness. It has been used to assess EE of soldiers in the field and the impact of different rations (DeLany et al., 1989), climates (Burstein et al., 1996), and other training conditions (Forbes-Ewan et al., 1989). However, the main limitation of the DLW method is that it measures total EE during a period of 7 to 14 days without being able to detect the type, duration, and intensity of physical activity, or to trace variations in physical activity and related EE within certain periods. Furthermore, the high cost and relative limited availability of 18O make this method difficult to apply.
Indirect calorimetry is the gold standard method of EE measurement under laboratory environments. It uses a facemask, a ventilated hood, or a respiratory chamber (Sun et al., 1994) to measure oxygen consumption and carbon dioxide production continuously and noninvasively. Major advantages of indirect calorimetry are the immediate and detailed measurements of the rates of EE during different activities and the macronutrient oxidations. The major disadvantage is the limited application under free-living conditions.
Methods of Assessing Physical Activity
Studying the relationship between physical activity and health in humans is complicated by the highly variable nature of physical activity. A particularly challenging area has been the development and application of accurate, valid, and cost-effective techniques to quantify physical activity under field conditions (Paffenbarger et al., 1993; Washburn and Montoye, 1986; Wilson et al., 1986). Numerous methods have been utilized to measure EE during physical activities. They vary greatly in their usefulness in different study populations and designs (Shultz et al., 2001). They can generally be categorized as subjective and objective methods.
Subjective Methods
Subjective methods include the use of direct observations, physical activity records, surveys and recall questionnaires. These techniques are used for various time periods and settings. Although inexpensive and easy to implement, their accuracies are greatly limited by the recording, recall, interviewer, and other biases. Predictions of EEACT using these methods could be further flawed by
interpretation and translation errors. Results from most subjective monitoring methods are thus difficult to quantify and to compare interindividually.
Objective Methods
Objective methods for current measurements of physical activity mainly consist of mechanical/electronic devices. Since walking and running are the most common types of physical activities, step counters are often used to estimate overall activity levels. Several types of step counters exist, including pedometers that use a mechanical movement counter (Bassey et al., 1987; Washburn et al., 1980), mercury switches (Cauley et al., 1987), and electronic load transducers and foot contact monitors inserted into the heels of shoes that sense loads held, lifted, or carried, and walking activity (Barber et al., 1973; Dion et al., 1982; Hoyt et al., 1994; Weyand et al., 2001). These are generally simple, small, and relatively inexpensive devices that are based on the principle that EEACT is correlated with individual step frequency and foot contact times (Kram and Taylor, 1990). The main limitation is that the sensitivity and accuracy of step counting may vary significantly among activity types, inter- and intraindividually. Furthermore, stride lengths, a crucial element of the velocity and distance traveled, can only be estimated.
Researchers have recently focused on an array of new activity monitors based on accelerometers, which directly measure body movements in terms of acceleration. The most currently used are the piezoelectric sensors that detect accelerations in one (typically vertical direction) or in three orthogonal planes (anterior-posterior, lateral, and vertical). Results can be recorded in a microcomputer. Most monitors are usually placed on the hip or waist (for its closeness to the center of body mass), although ankle or wrist monitors are also used. Caltrac, Tritrac-R3D (both by Hemokinetics, Madison, Wisconsin), RT3 (Stay-healthy, Monrovia, California), Computer Science and Application (CSA, Shalimar, Florida), Tracmor (Maastricht, The Netherlands), and ActiWatch (Minimitter, Sunriver, Oregon) are just a few examples of marketed systems. In several validation studies using these monitors, correlation values ranged from 0.65 to 0.92 between EE measured by indirect calorimetry and accelerometer readings during various activities (Bouten et al., 1994; Bray et al., 1994; Chen and Sun, 1997; Freedson et al., 1998), where level walking showed the highest correlation with the hip-worn triaxial accelerometers. The advantages of the accelerometry devices include their small size, noninvasiveness, and minimal intrusiveness to normal subject movements during daily activities. Additionally, they are easy to use for subjects and testers, sensitive to relative intensity, frequency, and duration detections, and have extended measuring periods (minute-by-minute data for up to 28 days), thus making free-living monitoring more feasible. The major limitations include their inability to detect activity types (for
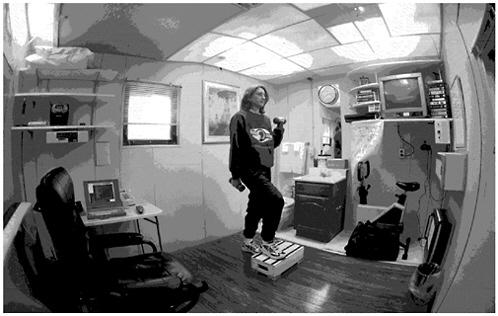
FIGURE D-13 The whole-room indirect calorimeter at Vanderbilt University.
which the associations between measured acceleration and EEACT are dependent upon), single-site monitoring that is unable to detect movements from various body segments, limited prediction algorithms to estimate EEACT across a wide range, and inability to differentiate EE due to postural changes and other low-intensity physical activities (Chen and Sun, 1997). To compensate for these errors, a combination of using accelerometry devices and inclinometers or mercury switches was used to detect postural changes and motions were reported (Levine et al., 2001; Walker et al., 1997). Recently, several research labs have tested the feasibility of using accelerometer arrays that were positioned at different body segments, mainly the chest, trunk, and thighs, to monitor the types of activities by postural identifications (Bussmann et al., 2001; Fahrenberg et al., 1997; Foerster and Fahrenberg, 2000; Zhang et al., 2003). However, EEACT predictions from these monitors have yet to be carefully validated.
Works from the Vanderbilt Energy Balance Lab
Equipped with the state-of-the-art whole-room indirect calorimeter at Vanderbilt, we are in a unique and ideal environment to develop and validate portable activity monitors for EEACT predictions. The room calorimeter is a small, airtight environmental room (2.6×3.3×2.3 m3, 19,500 L in net volume), equipped with a desk, chair, outside window, toilet, sink, telephone, TV/VCR, audio system/alarm clock, and fold-down mattress to simulate free-living conditions (Figure D-13). Oxygen consumption and carbon dioxide production are
calculated by measuring the changes of oxygen and carbon dioxide concentrations of the air inside the calorimeter and the flow rate of the purged air in an open-circuit design. A special multichannel air sampling system was designed to ensure an even sampling of the gas expired by the subject. Temperature, barometric pressure, and humidity of the room are precisely controlled and monitored. With the optimized controls and precision measurements, the minute-by-minute EE is calculated with the highest precision reported (>90 percent with each minute and>99 percent over 24 hours) (Sun et al., 1994).
RESULTS
In a previous study (Chen and Sun, 1997), we used a hip-worn triaxial accelerometer monitor, the Tritrac-R3D Research Ergometer (Hemokinetics, Inc. Madison, Wisconsin), to detect body motion during physical activities. A heterogeneous group of healthy adult volunteers (85 women and 40 men) each spent two separate 24-hour periods (one day with nonintensive walking and stepping exercises and the other day without), that respectively denoted the exercise and normal days in our room calorimeter and where each subject’s minute-by-minute EE and body movements were measured simultaneously. The Tritrac-R3D’s simple linear prediction model, using the combined signal from all three axes, significantly underestimated EEACT (by 33 percent and 49 percent) and total EE (by 17 percent and 26 percent) for normal and exercise days, respectively (Figure D-14, parts A and B). Using the EE and acceleration data measured during the exercise day, body acceleration components (A) measured by the Tritrac-R3D were fitted into a nonlinear two-parameter model:
where coefficients a, b, p1, and p2 were determined by optimization with the least sum-squared error for each individual. Results showed significant improvements (all P<0.001) in modeling total EE (Figure D-14, part C), standard error estimation parameters, and correlation coefficients. We then crossvalidated these models by applying them to the acceleration recorded during the second 24-hour period (normal day) and demonstrated that the predicted total EE was now comparable to the measured values (Figure D-14, part D). Furthermore, we showed that a generalized model, using subject’s gender, weight, height, and age to replace the individualized coefficients (a, b, p1, and p2 from the equation above, shown in Figure D-14, parts C and D), was also significantly more accurate compared with the one-parameter-linear model by Tritrac-R3D.
However, this model underestimated the EEACT during low intensities, potentially due to inadequate movement detections of the upper body motion. In a recent study (unpublished), we used a similar study design and measured EE during a 24-hour period in the room calorimeter in 60 healthy volunteers. Body movements were simultaneously measured using the same Tritrac-R3D triaxial
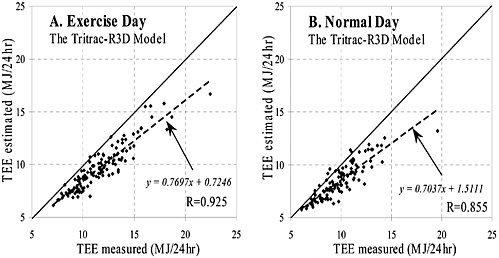
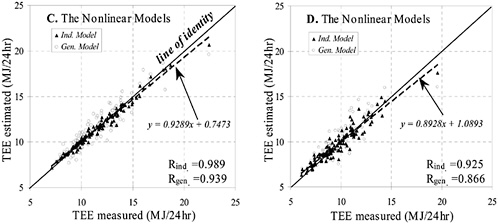
FIGURE D-14 Total daily energy expenditure (TEE) estimated by the Tritrac-R3D model (A., exercise day; B., normal day) in 85 healthy women and 40 men, and by the two-component nonlinear models (C., exercise day; D., normal day; shown on next page) versus TEE measured by the calorimeter. The line of identity signifies a perfect match between the estimated and the measured values in the room calorimeter. In C and D, individual (Ind.) model represents the parameters fitted for each volunteer and general (Gen.) model represents the model using only the subject’s gender, weight, height, and age to replace the individualized coefficients.
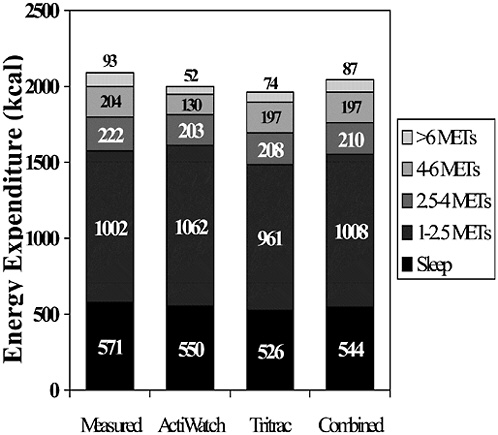
FIGURE D-15 Averaged energy expenditure (EE) in separate intensity categories of one 24-hour period in 60 healthy sedentary women (age, 35.4±9.0 y, body mass index, 30.0 ±5.9kg/m2). Comparison between EE measured in the whole-room indirect calorimeter, estimated by the ActiWatch, the Tritrac-R3D, and the ActiWatch and Tritrac-R3D monitors combined. METs=metabolic equivalents, calculated as ratio of individual energy expenditure and resting energy expenditure. (*P<0.05 compared with the measured values).
accelerometer (worn at the hip). We added a wrist accelerometer (ActiWatch64, Minimitter, Sunriver, Oregon) on the dominant arm for upper body movement measurements. The nonlinear power-fitting model was then expanded to include the arm accelerations:
We found that the Tritrac-R3D and the Acti Watch combined model accurately estimated EEACT in all intensity categories compared with measured
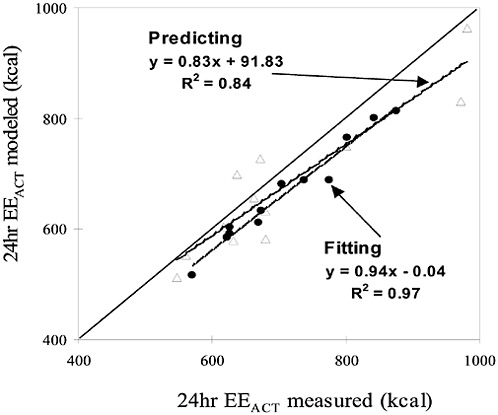
FIGURE D-16 Total energy expenditure of physical activity (EEACT) in 12 healthy women during two 24-hour periods (identical protocol) measured in the room calorimeter, compared with the estimated from the activity monitors. One day was randomly selected for fitting with combinations of ActiWatch on the wrist of the dominant hand and Tritrac-R3D at the waist, and the second day was used as the prediction validation.
EEACT by the calorimeter (Figure D-15). The particular improvements were in the measurement of lower-intensity physical activities, in which sedentary individuals tend to spend most of their time. A second 24-hour study was repeated in a subgroup of 12 volunteers and showed accurate EEACT prediction compared with measured values (Figure D-16).
DISCUSSION AND CONCLUSIONS
In view of the number of current field techniques for measuring detailed physical activity, accelerometers have been shown to be valid and useful. However, the applications of portable monitors to accurately predict energy demands in military personnel during training and field operations are unique. Compared with the more sedentary civilian populations, for whom most current activity
monitors are designed, soldiers participate in routine training regimens that are often subject to increased physical demands. Marching and running with significant added loads (>10 kg), crawling, jumping, climbing, and many other lifting or pulling activities are just a few of the activity types that present challenges to existing technologies. Furthermore, many trainings and operations are conducted in extreme external environmental conditions, such as hot or cold climates (Burstein et al., 1996), dry desert or humid jungles (Forbes-Ewan, 1989), and high altitude (Hoyt et al., 1994), while the internal stress from the imbalance of high total energy demands versus low energy intake, sleep deprivation, fatigue, and psychological stress (Nindl et al., 2002; Troumbley et al., 1990) may further exacerbate the complexity of the physical activity and EEACT estimations. Thus, we need to develop and optimize more specific portable methods for the measurements of the various activity types, intensities, durations, and frequencies. Two general areas of improvement are sensor designs and model development.
Currently marketed accelerometry activity monitors primarily use the piezoresistive sensors, either stand-alone or built-in (surface-mounted or integrated) chips. Although mostly unpublished, the ranges of acceleration are generally 0.05 to 1.0 g, with resolution of 0.02 or worse and sampling rates are 32 Hz or lower. Although this may be sufficient for monitoring the majority of physical movements of the center of mass (e.g., for the hip-worn monitors), movements of upper extremities contain higher frequency components in short bursts that may exceed the maximum range. These limitations would introduce inaccuracies in measurements. Most current activity monitors only use the dynamic component (or the AC component) of the raw signals from the sensors, partially to minimize the drifts from the baseline (or the static or DC component) due to temperature and directional changes. However, if the sensors are positioned at the proper locations, such as the chest, it may be useful to access such baseline change with respect to sensor direction for assessing body postures, which may indicate the type of activities. The dynamic signal from the sensor is generally filtered (corrected for baseline drifts), digitized, full-wave rectified (turn the negative values to positive), and integrated to 15-second epoch or longer to yield the output of activity counts. Although most of the current accelerometry monitors are packaged for easy operations for field researchers, almost all do not allow the user to change key parameters such as sampling rate or to allow raw signal collections, which are crucial to enable fundamental improvements in sensor designs.
Since currently available sensors have limited ability to detect wide ranges of physical activity types and intensities, the modeling of the acceleration output to predict EEACT is an area that needs much more development. We have demonstrated that the acceleration components recorded in the separate directions can be weighed differently to enhance EEACT prediction, since body movements in the vertical axis normally demand more energy due to the increased work against gravity, such as in the cases of weight-bearing activities like walking, running, and stepping (Haymes and Byrnes, 1993; Wong et al., 1981). Furthermore, the linear relationship between the acceleration and EEACT may not be the
pertinent model for all activity types and intensities. Thus, we have systematically developed and cross-validated a relatively simple multicomponent power prediction model that significantly improved the EEACT estimation.
The placement of the monitor is also important. Previous studies have confirmed that the center of mass is the ideal site for monitoring, particularly for weight-bearing activities that contribute to the largest dynamic changes in energy cost. From our unpublished data, we have also seen that minute-to-minute EE during a 24-hour period correlated significantly better with raw measurements of physical activity with a hip-worn triaxial accelerometer (R=0.825 ± 0.046) than with a wrist-worn uniaxial accelerometer (0.646±0.093, P<0.001, N=60). However, previous studies also illustrated that a single hip-worn monitor would be inadequate in measuring various physical activity types and intensities. Therefore, combination models that combine signals from multiple body segments need to be explored for improved accuracy in predicting EEACT.
In addition, other assessment techniques that involve physiological measurements may also be incorporated with simultaneous accelerometry monitoring to further improve EEACT modeling. An example is the use of heart-rate monitors, a simple and objective method for the estimation of EE during certain levels of physical activity and exercise (Spurr et al., 1988). Moreover, heart rate monitoring may facilitate the measurements of fatigue, state of hydration, body temperature changes, and emotional state (stress) that could affect the energy metabolism (Nielsen et al., 1993; Yoshida et al., 1994). Other physiological parameters, such as core body temperature (Gass and Gass, 1998; van Marken Lichtenbelt et al., 2001), galvanic skin conductance (estimating heat loss through sweating), and surface electromyography (measures of muscular activity), may also be explored to reveal their potentials to facilitate the prediction of EEACT.
In summary, to enhance our abilities to assess the energy demands of soldiers in the field, future research in technologies should focus on small and wireless sensors that can be positioned noninvasively and nonintrusively to measure body movements and physiological responses. Accelerometers are suitable for many aspects of the physical activity monitoring; however, much can be improved to increase their sensitivity and further reduce their size. The complex characteristics of the human physical activity, large inter- and intraindividual differences in energetic efficiencies, and inherent limitations of the sensors dictate that the development of advanced models to accurately predict EEACT should integrate more unique features of the signals from the sensors, rather than simple averaged signal outputs. This requires that we collect the raw signals from sensors while measuring EEACT simultaneously. Moreover, advanced pattern recognition and automated classification modeling techniques, such as artificial neural networks that can incorporate multiple input parameters and output feedbacks for nonlinear and adaptive modeling, need to be explored. The ideal development processes of such portable activity monitors should include the use of a respiratory chamber for sensor and model explorations under laboratory
conditions, portable indirect calorimetry units for short-term field evaluations, and DLW for overall validations. Furthermore, we should optimize such monitoring systems to the specific applications through modeling, such as weather conditions and external loads, while broadening the general applications to benefit civilian medical research.
REFERENCES
Barber C, Evans D, Fentem PH, Wilson MA. 1973. A simple load transducer suitable for long-term recording of activity patterns in human subjects. J Physiol 231:94P-95P.
Bassey EJ, Dallosso HM, Fentem PH, Irving JM, Patrick JM. 1987. Validation of a simple estimation of walking activity. Eur J Appl Physiol 56:323–330.
Bouten CV, Westerterp KR, Verduin M, Janssen JD. 1994. Assessment of energy expenditure for physical activity using a triaxial accelerometer. Med Sci Sports Exerc 12:1516–1523.
Bray MS, Wong WW, Morrow JR, Butte NF, Pivarnik JM. 1994. Caltrac versus calorimeter determination of 24-hour energy expenditure in female children and adolescents. Med Sci Sports Exerc 26:1524–1530.
Burstein R, Coward AW, Askew WE, Carmel K, Irving C, Shpilberg O, Moran D, Pikarsky A, Ginot G, Sawyer M, Golan R, Epstein Y. 1996. Energy expenditure variations in soldiers performing military activities under cold and hot climate conditions. Mil Med 161:750–754.
Bussmann JBJ, Martens WLJ, Tulen JHM, Schasfoort FC, van den Berg-Emons HJ, Stam HJ. 2001. Measuring daily behavior using ambulatory accelerometry: The activity monitor. Behav Res Methods Instrum Comput 33:349–356.
Cauley JA, LaPorte RE, Black-Sandler R, Schramm MM, Kriska AM. 1987. Comparison of methods to measure physical activity in postmenopausal women. Am J Clin Nutr 45:1422.
Chen KY, Sun M. 1997. Improving energy expenditure estimation by using a triaxial accelerometer. J Appl Physiol 83:2112–2122.
DeLany JP, Schoeller DA, Hoyt RW, Askew EW, Sharp MA. 1989. Field use of D218O to measure energy expenditure of soldiers at different energy intake. J Appl Physiol 67:1922–1929.
Dion JL, Foufllot JP, Leblanc A. 1982. Ambulatory monitoring of walking using a thin capacitive force transducer. In: Scott FD, Raftery EB, Clement DL, Wright SL, eds. Proceedings of the 4th International Symposium on Ambulatory Monitoring, and the Second Gent Workshop on Blood Pressure Variability. London: Academic Press. Pp. 420–425.
Fahrenberg J, Foerster F, Mueller W, Smeja M. 1997. Assessment of posture and motion by multi-channel piezoresistive accelerometer recordings. Psychophysiology 34:607–612.
Flatt JP. 1978. The biochemistry of energy expenditure. In: Gray GS, ed. Recent Advances in Obesity II. London: Newmann. Pp. 211–228.
Foerster F, Fahrenberg J. 2000. Motion pattern and posture: Correctly assessed by calibrated accelerometers. Behav Res Methods Instrum Comput 32:450–457.
Forbes-Ewan CH, Morrissey BL, Gregg GC, Waters DR. 1989. Use of doubly labeled water technique in soldiers training for jungle warfare. J Appl Physiol 61:14–18.
Freedson PS, Melanson E, Sirard J. 1998. Calibration of the Computer Science and Applications, Inc. accelerometer. Med Sci Sports Exerc 30:777–781.
Friedl KE, Hoyt RW. 1997. Development and biomedical testing of military operation rations. Annu Rev Nutr 17:51–75.
Gass EM, Gass GC. 1998. Rectal and esophageal temperatures during upper and lower body exercise. Eur J Appl Physiol 78:38–42.
Haymes EM, Byrnes WC. 1993. Walking and running energy expenditure estimated by Caltrac and indirect calorimetry. Med Sci Sports Exerc 25:1365–1369.
Hoyt RW, Knapik JJ, Lanza JF, Jones BH, Staab JS. 1994. Ambulatory foot contact monitor to estimate metabolic cost of human locomotion. J Appl Physiol 76:1818–1822.
Jéquier E, Schutz Y. 1988. Energy expenditure in obesity and diabetes. Diabetes Metab Rev 4:583–593.
Kram R, Taylor CR. 1990. Energetics of running: A new prospective. Nature 346:265–267.
Levine JA, Melanson EL, Westerterp KR, Hill JO. 2001. Measurement of the components of nonexercise activity thermogenesis. Am J Physiol Endocrinol Metab 281:670–675.
Nielsen B, Astrup A, Samuelsen P, Wengholt H, Christensen NJ. 1993. Effect of physical training on thermogenic response to cold and ephedrine in obesity. Intern J Obes Relat Metab Disord 17:383–390.
Nindl BC, Leone CD, Tharion WJ, Johnson RF, Castellani JW, Patton JF, Montain SJ. 2002. Physical performance responses during 72 h of military operational stress. Med Sci Sports Exerc 34:1814–1822.
Paffenbarger RS, Blair SN, Lee IM, Hyde RT. 1993. Measurement of physical activity to assess health effect in free-living populations. Med Sci Sports Exerc 25:60–70.
Ravussin E, Bogardus C. 1989. Relationship of genetics, age, and physical fitness to daily energy expenditure and fuel utilization. Am J Clin Nutr 49:968–975.
Ravussin E, Lillioja S, Anderson TE, Christin L, Bogardus C. 1986. Determinants of 24-hour energy expenditure in man: Methods and results using a respiratory chamber. J Clin Invest 78:1568–1578.
Schoeller DA, Hlinicka JM. 1996. Reliability of the doubly labeled water method for the measurement of total daily energy expenditure in free living subjects. J Nutr 126:348S-354S.
Schoeller DA, Ravussin E, Schutz Y, Acheson P, Baertschi P, Jéquier E. 1982. Energy expenditure by doubly labeled water: Validation and proposed calculation. Am J Physiol 250:R823-R830.
Shultz Y, Weinsier RL, Hunter GR. 2001. Assessment of free-living physical activity in humans: An overview of current available and proposed new measures. Obes Res 9:368–379.
Spurr GB, Prentice AM, Murgatroyd PR, Goldberg GR, Reina JC, Christman NT. 1988. Energy expenditure from minute-by-minute heart rate recording: Comparison with indirect calorimetry. Am J Clin Nutr 48:552–559.
Sun M, Reed GW, Hill JO. 1994. Modification of a whole-room calorimeter for measurement of rapid changes in energy expenditure. J Appl Physiol 76:2686–2691.
Troumbley PF, Rinkle WJ, Burman KD, Lenz ER. 1990. A comparison of the health risk, health status, self-motivation, psychological symptomatic distress, and physical fitness of overweight and normal-weight soldiers. Mil Med 155:424–429.
U.S. Army. 1998. Physical Fitness Training. FM21–20. October 1. Washington, D.C.: U.S. Army Headquarters. P. 1.
van Marken Lichtenbelt WD, Westerterp-Plantenga MS, van Haydonek P. 2001. Individual variation in the relation between body temperature and energy expenditure in response to elevated ambient temperature. Physiol Behav 73:235–242.
Walker DJ, Heslop PS, Plummer CJ, Essex T, Chandler S. 1997. A continuous patient activity monitor: Validation and relation to disability. Physiol Meas 18:49–59.
Washburn RA, Montoye HJ. 1986. The assessment of physical activity by questionnaire. Am J Epidemiol 125:563–576.
Washburn R, Chin MK, Montoye HJ. 1980. Accuracy of pedometer in walking and running. Res Q Exerc Sport 51:695–702.
Welle S, Lilavivat U, Campbell RG. 1981. Thermic effect of feeding in man: Increased norepinephrine levels following glucose but not protein or fat consumption. Metabolism 30:953–958.
Weyand PG, Kelly M, Blackadar T, Darley JC, Oliver SR, Ohlenbusch NE, Joffe SW, Hoyt RW. 2001. Ambulatory estimates of maximal aerobic power from foot-ground contact times and heart rates in running humans. J Appl Physiol 91:451–458.
Wilson PWF, Paffenbarger RS, Morris JN, Havlik RJ. 1986. Assessment methods for physical activity and physical fitness in population studies. Am Heart J 11:1177–1192.
Wong TC, Webster JG, Montoye HJ, Washburn R. 1981. Portable accelerometer device for measuring human energy expenditure. IEEE Trans Biomed Eng 28:467–471.
Yoshida T, Sakane N, Umekawa T, Kondo M. 1994. Relationship between basal metabolic rate, thermogenic response to caffeine, and body weight loss fol-
lowing combined low calorie and exercise treatment in obese women. Int J Obes Relat Metab Disord 18:345–350.
Zhang K, Werner P, Sun M, Pi-Sunyer FX, Boozer C. 2003. Measurement of human daily physical activity. Obes Res 11:33–40.
ENERGY TRANSFORMATIONS AND METABOLISM DURING HUMAN LOCOMOTION: SENSING OPPORTUNITIES IN A CONSERVATIVE WORLD
Peter G.Weyand, Rice University
ENERGY CONVERSIONS: IDENTIFYING, MEASURING AND GAUGING THE TRANSFORMATIONS
Newton (1687) originally recognized that energy is neither created nor destroyed, merely transformed from one state to another. This late seventeenth-century idea provides the contemporary understanding that the energy transformations occurring in our environment proceed without any net loss in the total energy present. We take this for granted in the transformation of the chemical energy in fossil fuels into the heat energy to warm buildings or the mechanical energy to power automobiles. Indeed, Newton’s breakthrough has enabled us to describe many of the energy transformations in the physical world in precise quantitative detail. However, in spite of the wide appreciation of the universal nature of Newton’s conservation law, we are unable to fully quantify some of the energy transformations that affect us most directly. This is particularly true of the energy transformations occurring in skeletal muscle during walking and running. The energy sources and end products for skeletal muscles are similar to those of a gasoline engine. Both transform chemical energy into heat and mechanical work (Hill, 1950). Yet, for skeletal muscle during locomotion, the relative yields of heat and work are not fully known (Alexander, 1992; Taylor, 1994; van Ingen Schenau, 1998).
Despite ongoing uncertainty about the relative quantities of heat and work produced by muscle metabolism during locomotion, the total chemical energy transformed can be accurately measured. The stoichiometry of the reactions that liberate chemical energy from foodstuffs to fuel muscular contractions is well known. This knowledge allows the chemical energy released by the body’s metabolism to be determined from the oxygen taken up and carbon dioxide given off by the process of respiration. The ease, utility, and accuracy of measurements of gas exchange have made this the method of choice for quantifying
chemical energy transformations in the body for more than a century (Blaxter, 1989; Fedak et al., 1981; Zuntz, 1897).
Because energy transformations are an integral part of movement, quantitative descriptions of these transfers can be used to characterize the performance status of humans, automobiles, or other bodies in motion. The conventional descriptors for automobiles: horsepower, fuel available, fuel economy, and engine temperature, are fully familiar. Some of these are displayed on our dashboards in real time so that we can continuously monitor the energy status of our cars. Because the energy transformations in the human body involve similar conversions, equivalent descriptors of performance capabilities exist: metabolic power, fuel reserves, locomotor economy, fuel mixtures, and core body temperatures are all quantifiable biological entities. In some cases, such as the core temperature of the body, the sensor technology needed for continuous monitoring in the field is currently in use. In other cases, the biological knowledge needed to direct sensor research and development is incomplete. Advancing the understanding of the energy transformations that occur during human locomotion should identify the most productive avenues for future sensor development.
CHEMICAL ENERGY TRANSFORMED BY MUSCLE: HEAT AND WORK
Early formal ideas regarding the fate of the chemical energy humans and other animals transform during locomotion postulated that humans behave much like today’s automobiles. Scientists considering the question believed humans produce forward movement by transforming chemical energy into the mechanical energy necessary to perform the work involved in locomotion (Fenn, 1930; Gray, 1968; Hill, 1950). Just as automobiles perform mechanical work to overcome inertia and wind resistance, human muscles were thought to convert chemical energy into the mechanical energy and work necessary to repeatedly lift and accelerate the body’s center of mass and limbs during each stride.
However, two important distinctions differentiate human locomotion produced by muscular contractions from that of an automobile powered by a gasoline engine. These differences are most easily conceptualized under steady-speed conditions on level ground. First, automobiles must transform fuel into the mechanical energy necessary to overcome the frictional resistance offered by both air and internal components. This is not true for humans because they typically do not move at sufficient speeds to encounter appreciable resistance from air, and frictional forces within the body are negligible. Thus, the net requirement for mechanical energy during human locomotion under these conditions is nearly zero. Second, in contrast to the passive support provided by the frame of the automobile, humans rely on muscles to support the weight of the body against gravity. Muscles, unlike rigid car frames, expend chemical energy in order to provide the force necessary to support the body’s weight. A car
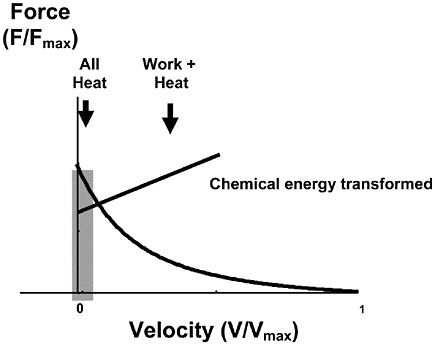
FIGURE D-17 Muscle force in relation to the velocity of shortening in an isolated muscle. The total energy transformed from chemical sources within muscle increases with the velocity of shortening during a contraction. During contractions with no length change, all of the chemical energy utilized by muscle is converted into heat. During contractions at 0.2 to 0.3 of maximal shortening velocity, 25 percent of the chemical energy fueling contraction is converted to mechanical work and the remaining 75 percent is converted into heat.
obviously does not require fuel to remain upright, but a person does, and the chemical energy transformed during motionless standing is appreciable (Margaria, 1976).
Although significant uncertainties remain about the relative yields of heat and work derived from the chemical energy transformed by muscles during locomotion, this is not the case for muscles observed in isolated preparations. Because force, shortening velocity, and heat production can be accurately measured under the latter conditions, the relationship between the mechanics of muscular contraction and the relative yields of heat and mechanical work in single muscles has been well established for more than half a century (Fenn, 1924; Hill, 1950). The maximum isometric force produced by different skeletal muscles is virtually invariant when expressed in relation to cross-sectional area (Figure D-17). Isometric contractions produce large forces that transform relatively little chemical energy. However, because no shortening occurs, and me-
chanical work by definition involves moving a force through a distance, isometric contractions produce no mechanical work, and hence provide no mechanical energy. Under isometric conditions, the chemical energy that fuels force production is converted entirely into heat. When muscles shorten while active, the largest yields of mechanical work are provided by contractions that occur at one-fifth to one-third of the muscles maximum shortening velocity (Vmax). However, performing mechanical work at these shortening velocities compromises force production. At the relative shortening velocities that maximize the work performed, the force produced is reduced to roughly one-half that of an isometric contraction. Additionally, muscle performs this work with marginal efficiency: most muscles convert a maximum of only 25 percent of the total transformed chemical energy into mechanical work. This upper efficiency limit, similar to that of an automobile engine, results in 75 percent of the total chemical energy transformed being released as heat.
Although the relative energy yields of heat and work are well established from experiments on isolated skeletal muscle preparations, equivalent information about the energy transformations that occur in the body during locomotion is not available. To date, simultaneous measurements of muscle forces, shortening velocities, and heat from the many muscles active in the body during locomotion have not been possible. Yet, the absence of this data does not preclude further consideration of these issues. Sound conclusions can be drawn from the large bodies of experimental information available on both the mechanics and chemical energy transformations involved in human locomotion.
LOCOMOTOR ENERGETICS AND MECHANICS: ALL HEAT, NO WORK?
Typical rates and quantities of the metabolic or chemical energy transformed during walking and running are illustrated in Figure D-18. With increases in speed, the rates at which the body’s chemical energy stores are transformed increase curvilinearly during walking and linearly during running (Figure D-18A, Margaria et al., 1963). These metabolic rates can be divided by speed to obtain the energy transformed per unit distance, or the metabolic cost of transport (Figure D-18B). Walking transport costs are minimized at the intermediate speeds people prefer to use and are relatively greater at both slower and faster speeds within this gait. Running transport costs are virtually constant across the range of speeds at which values can be obtained from measurements of gas exchange. In the process of covering a kilometer at self-selected speeds, a typical 70 kg person will transform approximately 270 and 420 kJ of chemical energy in these respective gaits.
Although the chemical energy transformed during walking and running has been established for many decades, the proportion converted into mechanical work is not known. Uncertainty regarding the completeness of mechanical energy transfers within each stride has precluded accurate quantification of the relative portions provided from stored mechanical versus stored chemical energy
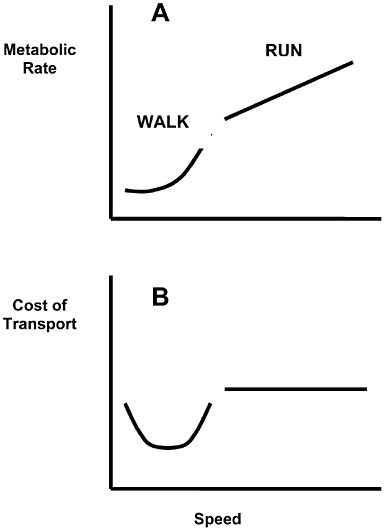
FIGURE D-18 The rate at which metabolic energy is transformed in relation to speed during steady-state human walking and running (A). Dividing metabolic rate by speed provides the energy expended per unit distance (B).
SOURCE: Reprinted, with permission Margaria et al. JAP (1963).
sources (Taylor, 1994; van Ingen Schenau, 1998). Mechanical energy is clearly required to repeatedly lift and accelerate the body’s mass and limbs during each stride. This energy might be provided, either wholly or in part, by the transformation of chemical energy stores in the body. Early experimentalists started with the assumption that the energy source of all of the mechanical work required for each stride was chemical. This assumption provided them with a seemingly logical explanation for the chemical energy transformations that had
been well-documented by gas exchange. Dozens of investigations, both past and recent, have attempted to establish a consistent relationship between the mechanical work performed and the chemical energy transformed during each locomotor stride (Heglund et al., 1982; Kaneko, 1990; Williams and Cavanagh, 1987). To date, these approaches have yielded neither consistent quantitative explanations, nor successful independent predictions of the quantities of chemical energy known to be transformed.
The alternative possibility, that the chemical energy transformed during human locomotion is not converted into mechanical work, but almost fully into heat, enjoys support from a growing body of experimental evidence. This evidence suggests that the mechanical energy needed for walking and running is continuously recycled from one stride to the next once a person is up to a constant speed. During walking, the musculoskeletal system transfers mechanical energy between gravitational potential energy and horizontal kinetic energy using a mechanism that has been likened to an inverted pendulum (Cavagna et al., 1976). The forward velocity of the body’s center of mass slows as it gains height and gravitational potential energy while approaching its highest point in midstance. Once past this apex, the body accelerates down and forward by converting the gravitational potential energy gained earlier in the stride into forward kinetic energy (Figure D-19A). During running, the body stores elastic potential energy in springy tendons during the downward movement of the center of mass that occurs during the first half of the stance phase. The height and speed the body loses early in stance is then restored via an elastic recoil that lifts and reaccelerates the body during the latter portion of the stance phase (Cavagna et al., 1964, 1977; Figure D-19B).
The exact quantities of energy transferred back and forth between various mechanical forms during each walking and running stride are not fully known, but are undoubtedly considerable. Estimates for walkers indicate that up 70 percent of the total fluctuations in the horizontal kinetic and gravitational potential energy of the body can be accomplished via pendulum-like transfers (Cavagna et al., 1977). These transfers are most complete at those intermediate speeds at which transport costs are minimized and less are complete at the faster and slower speeds that incur greater metabolic transport costs. Estimates for runners indicate that well over half (Cavagna et al., 1964; Ker et al., 1987; Roberts et al., 1997), and perhaps nearly all (Taylor, 1994) of the mechanical energy fluctuations involved might be accomplished via elastic and other transfer mechanisms. Regardless of exactly how complete these energy transfers are, the possibility of nearly complete conservation of mechanical energy raises a counterintuitive possibility: humans traveling at steady speeds on level ground may not require little to no input of mechanical energy and therefore may not transform any appreciable chemical energy into mechanical work.
From a conceptual standpoint, the muscle mechanics and energy transformations taking place in humans traveling under their own power may not differ appreciably from those that occur while standing still. In both cases, there is essentially no net requirement for mechanical work to be performed, but a large
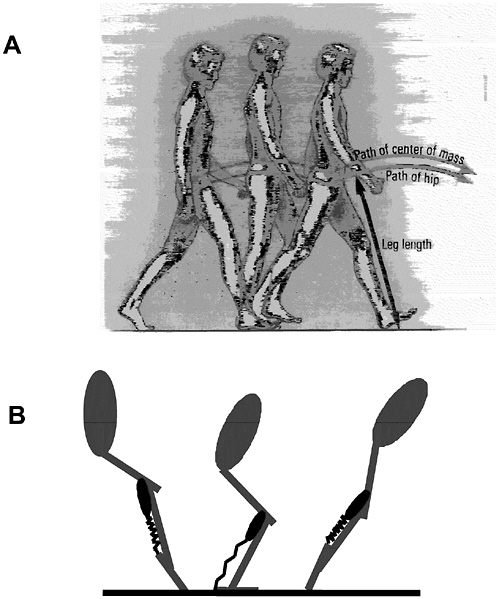
FIGURE D-19 Mechanisms by which mechanical energy is conserved during human locomotion. During walking, the mechanical energy of the body is conserved by a pendulum-like transfer between forward horizontal and gravitational potential energy (A, from Alexander, 1992 illustration from EXPLORING BIOMECHANICS: Animals in Motion by R.McNeil Alexander. Copyright © 1992 by Scientific American Library. Reprinted by permission of Henry Holt and Company, LLC), while during running, the gravitational and elastic potential energy are transferred by passive stretch and recoil of tendon springs (B).
requirement for muscles to generate the support forces that the skeleton ultimately applies to the ground. The mechanical and metabolic properties of muscle indicate that these requirements would be best satisfied by contractions during which muscle undergoes little to no change in length. For example, isometric muscle contractions would maximize the force produced per unit volume of muscle active, minimize the energy drawn from the body’s chemical stores, and eliminate the mechanical work that is theoretically unnecessary. Although counterintuitive, the empirical evidence available (Fukunaga et al., 2001; Roberts et al., 1997; Taylor, 1994) supports the general validity of this idea.
RUNNING: SPRINGING FORWARD
However close to 100 percent perfection mechanical energy transfers might be, they do not influence the earth’s gravitational field. Accordingly, there is no disagreement that muscles need to be active to support the body’s weight during locomotion. This allows support forces to be regarded as a minimum mechanical requirement for human locomotion. When the force of gravity on the mass of an average human body is considered, the magnitude of the force that must be applied to the ground in order to travel on foot is readily apparent. Peak ground reaction forces typically exceed the force of the body’s weight during walking and are at least twice as great during running (Margaria, 1976). The orientation of the ground reaction force vector in relation to the leg joints indicates that the muscle forces required for human locomotion generally exceed the ground forces by a factor of two (Biewener, personal communication; Wright and Weyand, 2001). Accordingly, the muscles of a 70 kg human must generate peak forces of approximately 1,400 to 2,800 N simply to oppose gravity during normal walking and running.
The large ground and muscle forces involved in locomotion led C.Richard Taylor and colleagues (Kram and Taylor, 1990; Roberts et al., 1998; Taylor, 1994) to hypothesize that the energy muscles require for force production is the predominant factor in determining the quantities of chemical energy transformed during locomotion. These investigators recognized that the time-averaged vertical force applied to the ground over the course of the stride must equal the body’s weight, and that this force can only be applied during the period of foot-ground contact (tc). These investigators observed a constant relationship between the metabolic rates of running or hopping animals and the rates at which they applied ground support forces (Kram and Taylor, 1990, Figure D-20). Two well-known properties of muscle helped these investigators explain this result. First, the rates at which chemical energy is transformed into heat while producing force is known to be proportional to the maximal shortening speed of the fibers generating the force (Barany, 1967). Second, during locomotion, muscle fibers are recruited in ascending order of their shortening speeds (Henneman et al., 1965; Walmsley et al., 1978). Using this information, Kram and Taylor proposed that the rates at which runners and hoppers apply force to the ground (1/tc)
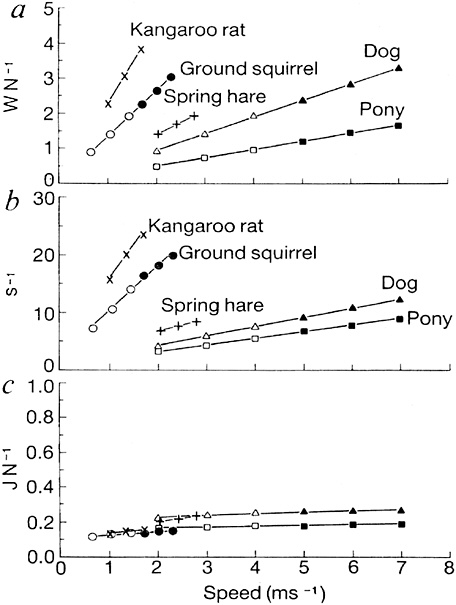
FIGURE D-20 The metabolic rates (a), during inverse periods of foot-ground contact, and (b) in different sized running and hopping animals over a range of speeds. The ratio of metabolic rates to the inverse periods of foot-ground contact (c) is a constant. This constant, the cost coefficient, represents the metabolic energy transformed in applying the ground force necessary to support the body’s weight against gravity.
SOURCE: Reprinted by permission from Nature Kram and Taylor (1990) Macmillan Publishers Ltd.
dictates the speed of the muscle fibers recruited to support their body weight and, therefore, also the rate of chemical energy transformation in the body. They expressed this relationship as:
(1)
Where ![]() is metabolic rate, FWb is the force required to support the weight of the body, 1/tc is the inverse period of foot-ground contact used to estimated that rate of ground force application, and C is a cost coefficient representing the chemical energy expended per unit of force applied to the ground to support the body’s weight. In accordance with convention for weight-bearing exercise, equation 1 can be rearranged to express metabolic rates on a mass-specific basis as:
is metabolic rate, FWb is the force required to support the weight of the body, 1/tc is the inverse period of foot-ground contact used to estimated that rate of ground force application, and C is a cost coefficient representing the chemical energy expended per unit of force applied to the ground to support the body’s weight. In accordance with convention for weight-bearing exercise, equation 1 can be rearranged to express metabolic rates on a mass-specific basis as:
(2)
The original relationship has since been found to apply to human locomotion with added weight or reduced weight (Kram, 2000), on skis (Bellizzi et al., 1998), with only ski poles (Bellizzi et al., 1998), while running on one’s hands (Glasheen and McMahon, 1995), or even backwards (Wright and Weyand, 2001).
These results offer a consistent quantitative explanation for the chemical energy transformed during locomotion that has not come forth in the many previous investigations into the possible importance of mechanical work. The assumption of complete conservation of mechanical energy allowed Taylor and colleagues to establish a link between the chemical energy transformed during locomotion and whole-body mechanics that had been previously lacking. Taylor’s hypothesis applied across a 4,500-fold range in the body sizes of running and hopping animals, a 10-fold range of speeds, and to several different gaits. Just as standing humans are recognized to be transforming chemical energy into force to support themselves against gravity, growing evidence supports Taylor’s idea that running humans and animals do largely the same thing: humans and terrestrial animals simply convert chemical energy into the force necessary to support the body’s weight while releasing this energy as heat in the process.
WALKING ENERGETICS: THE SCOOP ON SUPPORT FORCE?
Some have argued the Taylor’s force hypothesis does not provide the correct explanation for the relationship reported between chemical energy transformation in the body and the mechanics of ground force application during running (Alexander, 1991; Minetti et al., 1994; Steudel, 1990). However, the empirical information available from walking is also consistent with the original ideas put forth by the force hypothesis. If support mechanics do determine the quantities of chemical energy transformed during human locomotion, several
expectations for metabolic consequences can be inferred from the pendulum-like gait dynamics involved in walking. Metabolic energy requirements should be minimized when the transfer of mechanical energy by the pendulum is most complete. The greater the share of the mechanical energy provided conservatively by the pendulum, the smaller the demand on skeletal muscle to convert chemical energy into mechanical work during each stride. This idea can be evaluated by considering two metabolic variables introduced previously: the metabolic energy transformed per unit distance, and the metabolic energy transformed per unit of force applied to the ground (i.e., the cost coefficient; C in Figure D-21).
Several investigators (Cavagna et al., 1977; Griffin et al, 1999; Griffin et al., 2003; Heglund et al., 1982) have reported that the maximum possible energy savings from pendulum-like energy transfers occurs at intermediate walking speeds. With either positive or negative deviations from the intermediate speeds that people prefer to use, the proportions of the total mechanical energy of the body’s center of mass conserved by pendulum-like exchange become progressively smaller (Cavagna et al., 1977). When the metabolic energy transformed at different walking speeds is expressed per unit distance, a minimum occurs at those intermediate speeds of maximum possible pendulum transfer (Figure D-22). At the slower and faster speeds at which mechanical energy transfers become less possible, the measured metabolic cost of transport is greater. A similar pattern is observed for the metabolic energy transformed per unit of force applied to the ground, or the cost coefficient (Griffin et al., 2003; Figure D-21C). Walking cost-coefficient values are minimized at the intermediate walking speeds at which mechanical energy transfer is most complete and are greater at both the faster and slower speeds at which walking dynamics limit pendulum-like transfers.
Simultaneous measurements of the chemical energy transformed and the heat given off by the body at different walking speeds have been obtained using a novel suit calorimeter developed by Paul Webb (Webb et al., 1988). These data, unique to human walking, also show a pattern across speed that supports the belief that ground force application determines the chemical energy transformations occurring in the body. Webb and colleagues reported that the largest fractions of the total chemical energy transformed, as determined from gas exchange, were given off as heat at those intermediate walking speeds at which the greatest fraction of the body’s mechanical energy fluctuations can occur conservatively by pendulum-like exchange.
The fundamental importance of applying ground force to support the body’s weight in determining the energy transformed in human locomotion prompted Reed Hoyt and colleagues to use this basic relationship to develop ambulatory sensing technologies. Hoyt recognized that if rates of ground force application, as estimated from foot-ground contact times (i.e., 1/tc), dictate the rates at which chemical energy is transformed in the human body, then accurate sensing of these periods should provide valid field estimates of the chemical energy
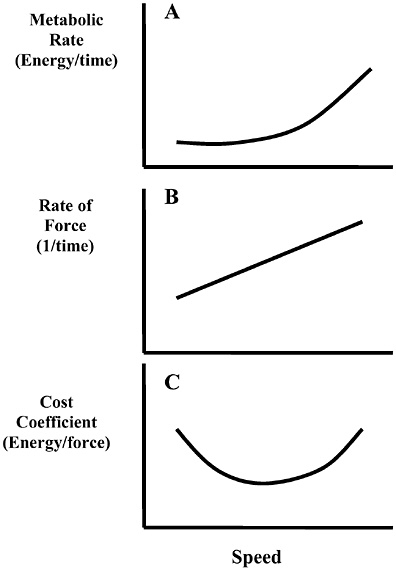
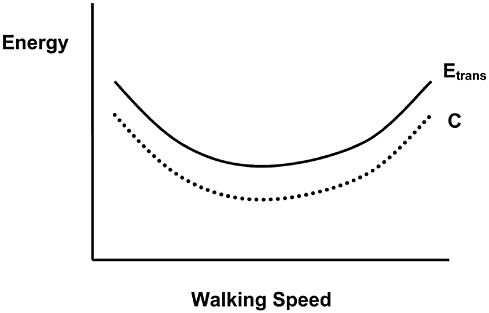
FIGURE D-22 The metabolic energy expended per unit distance (Etrans) and per unit force applied to the ground (C) to support the body’s weight in relation to walking speed.
transformed. Successful sensing would allow the metabolic energy transformed during locomotion to be monitored during the daily lives of soldiers, hikers, medical patients, and others. Hoyt’s idea proved to be both scientifically correct and practical, and thereby provided significant contributions toward the establishment of a human “energy status dashboard.”
SENSING PERFECTION: ESTIMATING FOOT-GROUND CONTACT TIMES ON THE RUN
In their initial effort, Hoyt and colleagues (1994) succeeded in obtaining measurements of foot-ground contact times from pressure sensitive resistors embedded in shoe insoles. Their sensor measurements of foot-ground contact times provided highly accurate estimates of the metabolic energy released during both human walking and running (Figure D-23). For running, this was not a complete surprise given the results reported originally by Kram and Taylor (1990) and later by others (Roberts et al., 1998; Wright and Weyand, 2001). However, the estimates the sensors provided during walking were equally accurate even though direct walking tests of the relationship had been previously absent.
Although the initial impetus for the development of foot-ground contact monitors was obtaining ambulatory estimates of the metabolic energy released
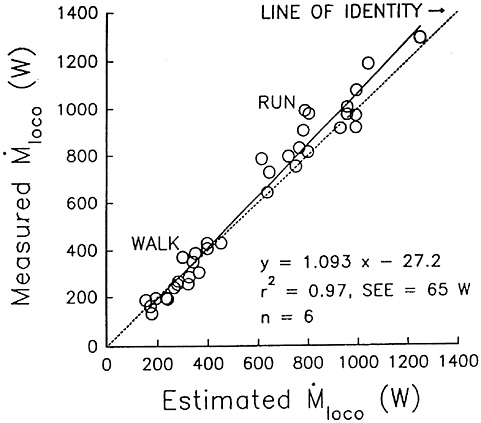
FIGURE D-23 Rates of chemical energy transformation in the body estimated by foot-ground contact time monitors and those measured directly using indirect calorimetry.
SOURCE: Reprinted, with permission Hoyt et al. JAP (1994).
during locomotion, the monitoring capabilities that arose were not limited to sensing metabolism. The consistent support mechanics humans use to support the weight of their bodies against gravity results in highly reproducible rates of ground force application at any given speed. In fact, this relationship is sufficiently consistent that foot-ground contact times, once established in relation to speed for an individual, provide precise estimates of speed. The commercial tc monitors spawned by this line of research (FitSense Incorporated, Southboro, Massachusetts) are able to estimate speeds and distances in field settings to within 2 percent or less (Weyand et al., 2001; Figure D-24).
The precision of these foot-ground contact monitors is greater, and the efficacy of the general approach is more apparent under conditions that are more controlled than those that typically exist in the field. In one application, the accelerometric method of estimating foot-ground contact times was used to monitor the world record holder in the 400 meter run during sprint competitions in
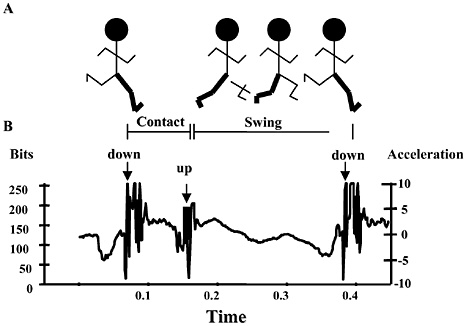
FIGURE D-24 The contact and swing phases of a single limb during a running stride (A) and the corresponding signal from a shoe-mounted accelerometer (B). The accelerometer signal allows both the instant the foot first contacts, and subsequently leaves, the surface to be identified. This allows this sensor to quantify periods of foot-ground contact (tc) which can be used to estimate the rates at which force is applied to the ground to support the body’s weight during walking and running.
SOURCE: Reprinted, with permission Weyand et al. JAP (2001).
the spring of 2000. In these instances, the foot-ground contact times of Michael Johnson were obtained from accelerometers fastened to the lateral aspect of both ankles. On the flat, consistent surface of 400 meter tracks, the speed estimates from the accelerometers agreed with the officially-timed speeds to within a fraction of a single percent. These estimates were so precise that accurate values for Michael Johnson’s instantaneous speeds, stride frequencies, and lengths were available for every step of the races monitored (Figure D-25).
More recently, the commercial version of the foot-ground contact monitors were used in combination with heart rate monitors to obtain estimates of the body’s maximal rate of chemical energy transformation from aerobic metabolism, or VO2max (Weyand et al., 2001). In this case, the combination of newer and older sensor technologies provided a practical and accurate method that can be used in field settings to estimate maximal aerobic power, thereby contributing an ambulatory horsepower gauge to the human energy dashboard.
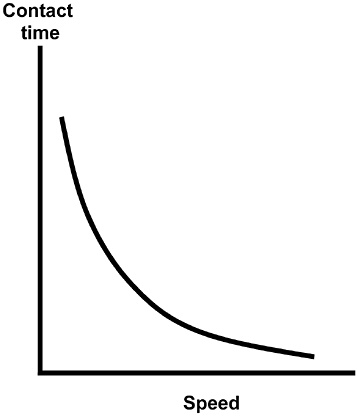
FIGURE D-25 Schematic illustration of the typical relationship between running speed and foot-ground time. The specific relationship for Michael Johnson was used to obtain his step-by-step speeds, stride lengths, and frequencies during competition in the spring of 2000. The accuracy provided by foot-ground contact sensors was equivalent to that of timing devices or video analysis.
FURTHER SENSING ADVANCES
The energy transfers involved in human locomotion considered here have focused on steady-state conditions on level ground. Scientific information, understanding, and the evolution of sensor technology warranted this focus. However, the conditions for locomotion in the natural world often deviate from these conditions. Hills and substrate quality can alter the mechanics of locomotion, the activity of the skeletal muscles, and the quantities of chemical energy transformed. Under these and other circumstances, significant challenges to biological understanding and sensor development remain. Nonetheless, experimental avenues that will provide further advances toward a human energy dashboard are clearly available. For example, the ability to assess maximal aerobic power from lightweight sensors on the body offers the possibility of obtaining reasona-
bly accurate field estimates of the fuel mixtures that are transformed during human locomotion. Because the mixture of fat and carbohydrate oxidized is closely related to fraction of maximal aerobic power at which individuals operate during locomotion (Roberts et al., 1995; Sahlin, 1986), available techniques should predict fuel mixtures with reasonable accuracy.
CONCLUSIONS
Although significant work remains before metabolic monitoring technologies provide an energy dashboard for the human body equivalently comprehensive to that of the modern automobile, there is cause for optimism. The progress made thus far in the ability to monitor speed, distance, metabolic rate, and maximum aerobic power from sensors in field settings would have been difficult to imagine a decade ago. The foundation for this monitoring progress was the experimental work that differentiated the passive and active mechanical aspects of human locomotion. Because the mechanics of steady-state walking and running allow the large majority of the mechanical energy exchanges to be recycled from one stride to the next, the remaining requirement for the musculoskeletal system is simply supporting the body’s weight against gravity. The avenues of further biological work and sensor development that are now available should provide for equally rapid progress in the coming decade.
While Newton’s principles of perfect energy conservation are known to apply ubiquitously, some particulars of energy transfer during human locomotion remain to be characterized more fully. The possibility of 100 percent transfer that has been raised here under ideal, steady-state conditions is certainly simplified to some small degree. Regardless, the empirical support for the predominant importance of support force in human locomotion is difficult to dispute. The sensor development spawned by the ideas regarding the fundamental importance of support mechanics makes a more convincing case still. The existence, utility, and remarkable accuracy of the sensor measurements under consistent conditions strongly attest to the validity of the original support force ideas. The energy transfers in the world of human locomotion may not be completely perfect, but the biological reality is certainly close enough for us to sense it.
REFERENCES
Alexander RM. 1991. Energy-saving mechanisms in walking and running. J Exp Biol 160:55–69.
Alexander RM. 1992. Exploring Biomechanics. Animals in Motion. New York: Scientific American Library.
Barany M. 1967. ATPase activity of myosin correlated with speed of muscle shortening. J Gen Physiol 50:197–218.
Bellizzi MJ, King KAD, Cushman SK, Weyand PG. 1998. Does the application of ground force set the energetic cost of cross-country skiing? J Appl Physiol 85:1736–1743.
Blaxter K. 1989. Energy Metabolism in Animals and Man. Cambridge: Cambridge University Press.
Cavagna GA, Sabiene FP, Margaria R. 1964. Mechanical work in running. J Appl Physiol 19:249–256.
Cavagna GA, Thys H, Zamboni A. 1976. The sources of external work in level walking and running. J Physiol 262:639–657.
Cavagna GA, Heglund NC, Taylor CR. 1977. Mechanical work in terrestrial locomotion: Two basic mechanisms for minimizing energy expenditure. Am J Physiol 233:R243-R261.
Fedak MA, Rome L, Seeherman HJ. 1981. One-step N2-dilution technique for calibrating open-circuit VO2 measuring systems. J Appl Physiol 51:772–776.
Fenn WO. 1924. The relation between the work performed and energy liberated in muscular contraction. J Physiol 58:373–395.
Fenn WO. 1930. Frictional and kinetic factors in the work of sprint running. Am J Physiol 92:583–611.
Fukunaga T, Kubo K, Kawakami Y, Fukashiro S, Kanehisa H, Maganaris CN. 2001. In vivo behaviour of human muscle tendon during walking. Proc R Soc Lond B Biol Sci 268:229–233.
Glasheen JW, McMahon TA. 1995. Arms are different from legs: Mechanics and energetics of human hand-running. J Appl Physiol 78:1280–1287.
Gray J. 1968. Animal Locomotion. London: Weidenfeld and Nicolson.
Griffin T, Tolani NA, Kram R. 1999. Walking in simulated reduced gravity: Mechanical energy fluctuations and exchange. J Appl Physiol 86:383–390.
Griffin T, Roberts TJ, Kram R. 2003. Metabolic cost of generating muscular force in human walking: insights from load carrying and speed experiments. J Appl Physiol 95:172–183.
Heglund NC, Fedak MA, Taylor CR, Cavagna GA. 1982. Energetics and mechanics of terrestrial locomotion. IV. Total mechanical energy changes as a function of speeds and body size in birds and mammals. J Exp Biol 79:57–66.
Henneman E, Somjen G, Carpentar D. 1965. Excitability and inhibility of motoneurons of different sizes. J Neurobiol 28:599–620.
Hill AV. 1950. The dimensions of animals and their muscular dynamics. Sci Prog 38:209–230.
Hoyt RW, Kanpik JJ, Lanza JF, Jones BH, Staab JS. 1994. Ambulatory foot contact monitor to estimate metabolic cost of human locomotion. J Appl Physiol 76:1818–1822.
Kaneko M. 1990. Mechanics and energetics in running with special reference to efficiency. J Biomech 23:57–63.
Ker RF, Bennett MB, Bibby SR, Kester RC, Alexander RM. 1987. The spring in the arch of the human foot. Nature 325:147–149.
Kram R. 2000. Muscular force or work: What determines the metabolic energy cost of running? Exerc Sport Sci Rev 28:138–142.
Kram R, Taylor CR. 1990. The energetics of running: A new perspective. Nature 346:2265–2267.
Margaria R. 1976. Biomechanics and Energetics of Muscular Exercise. Oxford: Clarendon.
Margaria R, Cerretelli P, Aghemo P, Sassi G. 1963. Energy cost of running. J Appl Physiol 56:367–370.
Minetti AE, Ardigò LP, Saibene F. 1994. Mechanical determinants of the minimum energy cost of gradient running in humans. J Exp Biol 195:211–225.
Newton I. 1687. Philosophae Naturalis Principia Mathematica I–III (The Royal Society, London). Translated by Motte A, 1729. Revised and edited by Cajori F, University of California Press, Berkeley, 1934.
Roberts T, Weber J-M, Hoppeler H, Weibel E, Taylor C. 1995. Design of the oxygen and substrate pathways: II. Defining upper limits of carbohydrate and fat oxidation. Resp Physiol 199:1651–1658.
Roberts TJ, Marsh RL, Weyand PG, Taylor CR. 1997. Muscular force in running turkeys: The economy of minimizing work. Science 275:1113–1115.
Roberts TJ, Kram R, Weyand PG, Taylor CR. 1998. Energetics of bipedal running. I. Metabolic cost of generating force. J Exp Biol 201:2745–2751.
Sahlin K. 1986. Metabolic changes limiting muscle performance. In: Saltin B, ed. Biochemistry of Exercise. VI. International Series on Sports Sciences. vol. 16. Champaign, IL: Human Kinetics. Pp. 323–344.
Steudel K. 1990. The work and energetic cost of locomotion. I. The effects of limb mass distribution in quadrupeds. J Exp Biol 154:273–285.
Taylor CR. 1994. Relating mechanics and energetics during exercise. In: Jones J, ed. Comparative Vertebrate Exercise Physiology: Unifying Physiological Principles. San Diego: Academic. Pp. 181–215.
van Ingen Schenau G. 1998. Positive work and its efficiency are at their deadend: Comments on a recent discussion. J Biomech 31:195–197.
Walmsley B, Hodgson J, Burke R. 1978. Forces produced by medial gastrocnemius and soleus muscles during locomotion in freely moving cats. J Neurophysiol 41:1203–1216.
Webb P, Saris WH, Schoffelen PF, van Ingen Schenau GJ, Ten Hoor F. 1988. The work of walking: A calorimetric study. Med Sci Sports Exerc 20:331–337.
Weyand P, Kelly M, Darley J, Oliver S, Ohlenbusch N, Joffe S, Blackadar T, Hoyt R. 2001. Ambulatory estimates of maximal aerobic power from foot-ground contact times and heart rates in running humans. J Appl Physiol 91:451–458.
Williams K, Cavanagh P. 1987. Relationship between distance running mechanics, running economy, and performance. J Appl Physiol 63:1236–1245.
Wright S, Weyand P. 2001. The application of ground force determines the energetic cost of running backward and forward. J Exp Biol 204:1805–1815.
Zuntz N. 1897. Ueber den stoffvenbrauch des hundes bei muskelarbeit. Arch Ges Physiol 68:191–211.
BIOMARKERS FOR CHANGE IN PROTEIN TURNOVER OF MUSCLE
Robert Wolfe, Elisabet Børsheim, University of Texas Medical Branch
The net gain or loss of muscle protein represents the balance between the rates of synthesis and breakdown. Consequently, when considering potential markers for changes in protein turnover in muscle, it is necessary to evaluate potential candidates in terms of the ability to reflect changes in the net balance between synthesis and breakdown.
The fundamental processes that control the balance between muscle protein synthesis and breakdown are shown in Figure D-26. Amino acids that can potentially be used for incorporation into protein (i.e., synthesis) can be derived from transport from the plasma, breakdown, or in the case of certain (nonessential) amino acids, from de novo synthesis. In turn, the amino acids in the precursor pool for synthesis can also be transported back to the plasma and carried away by venous blood.
There is interplay between all of these factors in the context of normal daily activity, including exercise and eating. Since amino acids provide a readily measurable component of the system, it is worthwhile to consider in depth the possible utility of measures of blood amino acid concentrations as indices of the status of the overall system, in particular the balance between synthesis and breakdown. In that regard, it is pertinent to first consider the role of muscle in the overall regulation of whole-body protein metabolism.
Many tissues of the body, such as the skin, heart, brain and liver, have a constant demand for amino acids. Protein breakdown is always occurring in these tissues, and without a sufficient rate of synthesis to balance the rate of breakdown, the amount of protein would quickly diminish. Since these tissues and organs do not have significant reserves of protein, even transient periods of net catabolism might have significant physiological consequences. Therefore, these tissues are normally able to extract sufficient amino acids from the blood to maintain synthesis at a rate sufficient to match the rate of breakdown, thereby avoiding a net loss of protein. Muscle, on the other hand, serves as a reservoir for amino acids. At least 15 percent of muscle mass can be lost without physiological consequences. Thus, muscle catabolism serves to provide plasma amino acids when none are available from absorption of dietary intake. In other words, there is a net negative protein balance in muscle in the postabsorptive or fasted state in order to provide the amino acids needed by other tissue organs in which the maintenance of protein mass is more essential for survival. Consequently, when amino acids are being absorbed, the muscle protein pool is the principal
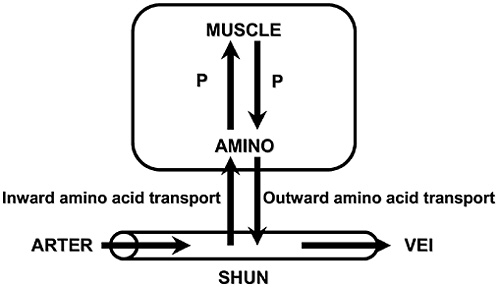
FIGURE D-26 Interaction between amino acids and protein kinetics.
target of repletion since other tissues received adequate amino acids via the blood to maintain protein balance in the absence of intake. Thus, muscle can be considered as a reservoir for amino acids that functions to keep amino acids available, via the plasma, for protein synthesis throughout the body.
The muscle performs its role as a reservoir quite efficiently. Even after 50 to 60 days of fasting in obese individuals, plasma essential and nonessential amino acids are maintained constant (Drenick et al., 1964). Further, intracellular concentrations of essential amino acids are regulated so as to remain constant unless there is a major perturbation in one or more of the factors controlling those concentrations (i.e., synthesis, breakdown, or transport). For example, when extracellular concentrations of amino acid were increased 40 percent by a primed-constant infusion, the intracellular essential amino acid concentrations remained constant, even though synthesis was stimulated (Bohe et al., In press). Further, when plasma amino acid concentrations were doubled by intravenous infusion, intracellular essential amino acid concentrations actually fell slightly, but significantly (Bohe et al., 2003). Only when the rate of infusion of amino acids increased sufficiently to exceed the capacity of synthesis to increase proportionately did the intracellular concentration of amino acids increase (Bohe et al., 2003). In an analogous response, when plasma amino acids were artificially lowered 40 percent below the basal level by hemodialysis, intracellular essential amino acid concentrations were unchanged (Kobayashi et al., 2003). Thus, under normal physiological conditions, changes in concentrations of essential amino acids cannot provide insight into the rates of muscle protein synthesis, breakdown, or the balance between them.
In severe stress, the stimulus for net protein catabolism provides the extra amino acids required for processes such as wound healing, immune function, and synthesis of acute phase proteins in the liver. In severe stress, such as burn injury, the signal for breakdown may exceed the increased requirement for amino acids, such that intracellular, and sometimes plasma concentrations, of essential amino acids increase. For example, intracellular concentrations of phenylalanine, leucine, and lysine are all elevated in burn patients (Biolo et al., 2000), although all may not be elevated in plasma. Interpretation of individual essential amino acids may be complicated by specific aspects of its metabolism. For example, phenylalanine is generally elevated in critically ill patients, but the plasma phenylalanine is clouded by the fact that its clearance not only reflects the uptake for the process of synthesis, but the liver clears phenylalanine and metabolizes it to tyrosine. Thus, in critically ill patients, an isolated increase in phenylalanine may reflect liver failure as much as net muscle protein breakdown.
The nonessential amino acids alanine and glutamine are the principal means by which nitrogen is transferred from muscle to the liver for eventual excretion as urea. Thus, when net muscle breakdown is accelerated, an increased production of alanine and/or glutamine would be expected. In fact, alanine release from muscle may be elevated by several-fold in severely burned patients (Jahoor et al., 1986); even after exercise alanine release is accelerated (Wolfe et al., 1979). However, plasma concentrations of alanine are not elevated when flux rates are elevated several-fold, probably due to the concurrent stimulation of gluconeogenesis that occurs in response to stress (Wolfe et al., 1979). In fact, alanine concentration may actually fall in severe sepsis (Gore and Wolfe, 2003). Consequently, alanine does not provide useful information about net muscle protein breakdown.
Depletion of the intramuscular glutamine pool occurs in stress states. Normally, the intramuscular concentration of glutamine is greater than the sum of all other amino acids. In severe stress, the intracellular concentration may fall by as much as 90 percent (Mittendorfer et al., 1999), but plasma concentrations are generally maintained or even fall. Thus, whereas plasma (and interstitial) concentrations of glutamine provide little insight into the net muscle protein balance, monitoring of the intracellular concentration of glutamine could likely provide reasonable insight as to whether the individual was under significant physiological stress. Current technology requires muscle biopsy to accomplish this measurement.
Muscle myofibrillar protein breakdown has been estimated using indirect measures such as 3-methylhistidine (3-MH) excretion (Young et al., 1973). 3-MH is produced by the posttranslational methylation (by protein-histidine N-methyltransferase) of specific histidine residues in the actin of all muscle fibers and in the myosin of type II fibers. It is released during protein breakdown and is not reutilized for protein synthesis or metabolized in man, but is excreted in urine. The skeletal muscle mass comprises the largest fraction of tissue-bound 3-MH in the body. Thus, urinary excretion of 3-MH in its free and acetylated form
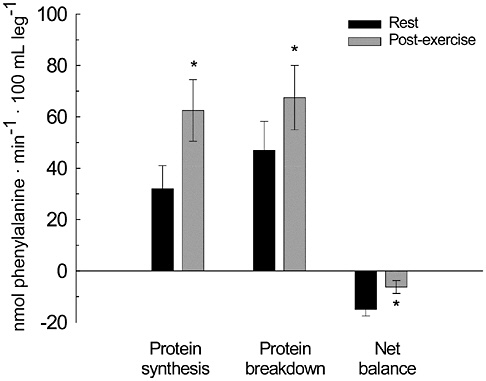
FIGURE D-27 Muscle protein synthesis, breakdown, and net protein balance at rest (black bars) and ~ 3 h after a heavy resistance exercise bout (gray bars) in untrained male volunteers. Values are mean±standard error. Asterisk (*) indicates significant difference (p<0.05) postexercise versus rest.
SOURCE: Reprinted, with permission Biolo et al. AJP (1995b).
has been used as a measure of the rate of muscle myofibrillar protein breakdown. Concerns about the validity of 3-MH excretion as an indicator of muscle protein breakdown relate to the contribution of nonmuscle sources to urinary 3-MH (e.g., gut smooth muscle and skin). Also, dietary protein intake can contribute to urinary 3-MH. Thus, urinary excretion of 3-MH may be problematic to use as a measure of skeletal muscle protein turnover. Determination of arterialvenous differences of 3-MH across muscle may be more useful in that regard. Nonetheless, even if it were to provide a precise measure of the rate of muscle protein breakdown, it would not be useful as an indicator of net muscle balance. When a large body of literature is considered, it is clear that changes in breakdown and synthesis normally occur in the same direction, and the magnitude of the individual responses (i.e., synthesis and breakdown) determines the nature of any change in net balance.
The best example of the lack of an obligatory relation between breakdown and net balance, particularly with relation to potential military applications, can be seen in Figure D-27. Resistance exercise caused an improvement in net mus-
cle protein balance (i.e., reduced the fasting rate of muscle catabolism). However, the rate of breakdown actually increased—the improvement in net balance was due to an even greater increase in synthesis (Biolo et al., 1995b). Thus, whereas monitoring 3-MH could potentially give some indication of the rate of muscle protein breakdown, it is the balance between synthesis and breakdown that determines gain or loss of muscle mass; knowledge of breakdown alone provides little insight into the net balance.
Taken together, this discussion lends to the conclusion that measurement of plasma (or urinary) levels of amino acids or other potential markers of synthesis or breakdown cannot be expected to be reliable indicators of the balance between muscle protein kinetics or breakdown. Increasing levels of invasiveness enable more detailed information to be obtained.
With oral ingestion of a 15N-alanine bolus and collection and analysis of urinary ammonia enrichment, it is possible to calculate whole body protein turnover. Coupled with ingestion of labeled 3-MH and measurement of the decay in enrichment, it is possible to distinguish the contribution of changes in muscle protein breakdown to the overall change in whole body protein turnover. In many, but not all, circumstances, changes in whole-body turnover reflect changes in muscle-protein turnover.
With increasing levels of invasiveness, it is possible to more directly obtain quantitative information. With the use of isotopically labeled tracer infusion and muscle biopsies and peripheral venous blood samples it is possible to quantify rates of muscle protein synthesis, and if arterial samples are added, breakdown can also be measured (Zhang et al., 1996). When arterial-venous sampling across the leg is coupled with biopsies, all of the factors shown in Figure D-27 can be quantified (Biolo et al., 1995a). Unfortunately, these invasive procedures are necessary because more readily accessible means of estimating muscle protein metabolism are unreliable.
SUMMARY
Changes in muscle mass occur because of an imbalance between the rates of protein synthesis and breakdown. Thus, the complication in finding a pertinent marker is that it must reflect the balance between two distinct processes. Consequently, the only reliable means of estimating changes in muscle protein turnover in a physiologically relevant manner is with the use of stable isotope tracers. Further, use of these tracers must be coupled with invasive procedures such as muscle biopsies and/or arterial and deep venous catheterizations to gain information about changes in muscle protein metabolism.
REFERENCES
Biolo G, Fleming RY, Maggi SP, Wolfe RR. 1995a. Transmembrane transport and intracellular kinetics of amino acids in human skeletal muscle. Am J Physiol 268:E75–E84.
Biolo G, Maggi SP, Williams BD, Tipton KD, Wolfe RR. 1995b. Increased rates of muscle protein turnover and amino acid transport after resistance exercise in humans. Am J Physiol 268:E514-E520.
Biolo G, Fleming RYD, Maggi SP, Nguyen TT, Herndon DN, Wolfe RR. 2000. Inhibition of muscle glutamine formation in hypercatabolic patients. Clin Sci (Lond) 100:299–301.
Bohe J, Low A, Wolfe RR, Rennie MJ. 2003. Human muscle protein synthesis is modulated by extracellular not intramuscular amino acid availability: A dose response study. J Physiol 552:315–324.
Drenick EJ, Swenseirl ME, Blahd WH, Turtle SG. 1964. Prolonged starvation as treatment for severe obesity. J Am Med Assoc 187:100–105.
Gore D, Wolfe RR. 2003. Metabolic response of muscle to alanine, glutamine, and valine supplementation during severe illness. J Parenter Enteral Nutr 27:307–314.
Jahoor F, Herndon DN, Wolfe RR. 1986. Role of insulin and glucagon in the response of glucose and alanine kinetics in burn-injured patients. J Clin Invest 78:807–814.
Kobayashi H, Borsheim E, Anthony TG, Traber DL, Badalamenti J, Kimball SR, Jefferson LS, Wolfe RR. 2003. Reduced amino acid availability inhibits muscle protein synthesis and decreases activity of initiation factor elF2B. Am J Physiol Endocrinol Metab 284:E488–E498.
Mittendorfer B, Gore DC, Herndon DN, Wolfe RR. 1999. Accelerated glutamine synthesis in critically ill patients cannot maintain normal intracellular free glutamine concentration. J Parenter Enteral Nutr 23:243–250.
Wolfe RR, Durkot MJ, Allsop JR, Burke JF. 1979. Glucose metabolism in severely burned patients. Metabolism 28:1031–1039.
Wolfe RR, Wolfe MH, Nadel ER, Shaw JH. 1984. Isotopic determination of amino acid-urea interactions in exercise in humans. J Appl Physiol 56:221–229.
Young VR, Havenbert LN, Bilamazes C, Munro HN. 1973. Potential use of 3-methylhistidine excretion as an index of progressive reduction in muscle protein catabolism during starvation. Metabolism 23:1429–1436.
Zhang X-J, Chinkes DL, Sakurai Y, Wolfe RR. 1996. An isotopic method for measurement of muscle protein fractional breakdown rate in vivo. Am J Physiol 270:E759–E767.
AMINO ACIDS AS BIOMARKERS FOR FATIGUE
T.P.Stein, University of Medicine and Dentistry of New Jersey
Muscle fatigue limits physical activity. Fatigue can be defined as the inability to maintain power output, and its causes are not known. The etiology can be of either local or central origin. Local fatigue originates within the muscle, whereas central fatigue is secondary to alterations within the brain. It is postulated that in central mechanisms, exercising muscle releases factors that act systemically and impact the central nervous system. In the context of military performance, systemic effects are likely to be of greater significance because of their potential to impact both physical and mental performance.
Muscle fatigue is not the same as muscle soreness. Muscle soreness is the pain that occurs about a day after exercise and peaks 2 to 3 days postexercise (Clarkson et al., 1992). The underlying mechanisms for delayed-onset muscle fatigue and fatigue are different. Soreness is believed to be due to a localized inflammatory response (Smith, 1991), and so the appropriate markers are markers for an inflammatory response. The onset of pain is also not considered to be a marker for muscle fatigue. Pain by itself is performance limiting and therefore is not a “predictor.”
The majority of studies of muscle fatigue have assumed that the fatigue is the result of events localized within skeletal muscle (Davies and White, 1981; Edwards, 1981). Prior studies of muscle fatigue have focused on the relationship of a putative marker to the underlying biochemical or histological changes. This review has a somewhat different focus: the use of those markers as predictors for the onset of fatigue—specifically markers of protein origin.
For a marker to be of practical use, certain conditions must be met (Banister et al., 1985). The marker must apply to all subjects; a statistical relationship is inadequate when applied to the individual (Barron et al., 1985). In addition, the measurement must be technically feasible on a large number of subjects without costing too much. These criteria limit the assays to “spot” blood and urine measurements. In-line sensors in a selected muscle are not likely to be of much use. An isolated muscle may not reflect the whole musculoskeletal system and the muscle selected may not be one of the muscles that are becoming fatigued.
LOCAL FACTORS
Protein Turnover
Proteins are the machinery of the body. All of the work and all of metabolic functions in the body; movement, ion pumping, cell division, obtaining energy from foodstuffs, and host defense mechanisms are all affected by proteins. The health of the body protein pool is maintained by proteins being in a dynamic
state; proteins are continually being made and broken down (protein turnover). A dynamic state of protein turnover allows a rapid response when a new mix of proteins is required. For example, with injury or infection, defense proteins need to be mobilized, any damaged proteins need to be removed, and protein levels need to be altered. Clearly, if the machinery begins to malfunction, performance will decrease.
Unfortunately, there is no simple means of assessing the status of protein turnover. The classical marker for protein breakdown is 3-methyl histidine (3-MeH) production. Monitoring the urinary 3-MeH is a standard assay for assessing myofibrillar protein breakdown; its limitations are well known (Long et al., 1981; Munro and Young, 1978; Rathmacher et al., 1995; Rennie and Millward, 1983). To obtain interpretable 3-MeH data, subjects should be on a meat-free diet. Placing combat troops on a meat free diet, or even attempting to control meat intake, is not a realistic option and thus monitoring of 3-MeH production is not feasible even if it were shown to somehow correlate with fatigue.
The other side of protein turnover is protein synthesis. There is no noniso-topic method for measuring human protein synthesis. Clinically, the classic method for assessing protein status (and still the most sensitive), and hence indirectly protein turnover, is nitrogen balance. The problem with the nitrogen balance method is that it is fraught with errors; the errors tend to be unidirectional towards over-estimating nitrogen retention.
Knowing that there has been a major change in nitrogen balance would be enough to cause concern. Classically, nitrogen balance is done by measuring input (food) and output (urine, sweat, feces, and any increase in blood urea nitrogen). To measure all of these parameters accurately is difficult in a clinical research center environment; to do so noninvasively in the field is not possible. There are no potential markers for protein turnover.
NUTRITIONAL FACTORS
Plasma Amino Acids
While not directly correlated with protein synthesis, plasma and tissue-free amino acid concentrations and distribution patterns provide useful information on protein metabolism. An important study by Kingsbury and colleagues (1998) compared fasting plasma amino acid patterns in elite athletes from the 1996 British Olympics team during training. Athletes were divided into three groups: group A, no lasting fatigue after training; group B, heavy fatigue at night but recovered after an overnight rest; and group C, chronic fatigue with full recovery taking a week or more. The results are summarized in Table D-5.
Plasma amino acid concentrations were lower in the two groups subject to fatigue (Table D-5). There were significant relationships between the fatigue and some of the changes in individual amino acids. Figure D-28 shows the distribution of plasma glutamine and histidine. There is virtually no overlap
TABLE D-5 Fasting Plasma Amino Acid Levels of Athlete Groups During Training (μmol/L−1)
|
Amino Acid |
Normal Range |
A (n=21) |
B (n=12) |
C (n=18) |
|
Glutamine |
480–800 |
554 (25.2) |
356 (16.0)c |
383 (13.6)c |
|
Histidine |
30–150 |
79 (6.1) |
32 (1.2)c |
50 (2.9)c |
|
Alanine |
150–450 |
422 (24.7) |
352 (20.4)a |
344 (17.1)a |
|
Threonine |
70–220 |
121 (8.7) |
72 (4.7)c |
91 (4.6)b |
|
Serine |
90–290 |
104 (5.3) |
109 (5.3) |
88 (5.1)a |
|
Lysine |
100–300 |
161 (8.5) |
89 (6.1)c |
124 (8.2)b |
|
Tryptophan |
30–80 |
67 (3.5) |
44 (3.7)c |
55 (2.9)a |
|
Tyrosine |
30–120 |
62 (3.8) |
43 (3.2)c |
55 (4.3) |
|
Valine |
90–300 |
219 (11.4) |
151 (8.8) |
188 (10.4) |
|
Leucine |
65–220 |
146 (3.9) |
127 (5.7)a |
137 (9.5) |
|
Isoleucine |
26–100 |
77 (5.3) |
59 (2.9)b |
69 (4.6) |
|
Arginine |
40–120 |
82 (6.2) |
57 (3.6)b |
71 (4.9) |
|
Proline |
85–290 |
232 (12.1) |
196 (13.8) |
188 (18.7) |
|
Ornithine |
25–120 |
59 (3.9) |
58 (5.3) |
60 (5.5) |
|
Methionine |
10–60 |
35 (2.5) |
26 (1.5)a |
30 (1.3) |
|
Glutamic acid |
25–130 |
55 (6.3) |
102 (4.9)c |
56 (8.7) |
|
Glycine |
100–330 |
227 (10.3) |
316 (20.4)c |
199 (9.9) |
|
Phenylalanine |
35–100 |
71 (2.5) |
88 (2.9)c |
70 (4.1) |
|
Total amino acids |
|
2,839 (92.1) |
2,396 (90.1) |
2,307 (71.6) |
|
NOTE: Mean with standard error of the mean in parentheses. Subjects were divided into three groups depending on level of fatigue: group A, no lasting fatigue; group B, heavy fatigue at night but with full recovery by the next day; and group C, chronic fatigue and poor performance. a p<0.05 vs. group A. b p<0.01 vs. .group A. c p<0.001 vs. group A. SOURCE: Adapted from Kingsbury et al. (1998), British Journal of Sports Medicine, 32, 25–33, with permission from the BMJ Publishing Group. |
||||
between the fatigue groups and the controls with glutamine. What is important about the findings is the very high discriminatory power of the measurements for identify the subjects prone to fatigue. The study is promising, but not definitive because the subjects were not matched by athletic event and no dietary data was collected. An observational, nonrandomized follow-up study of increasing protein intake appeared to be of benefit to the subjects with low glutamine and histidine concentrations. Plasma glutamine and histidine concentrations were increased, as was performance (Kingsbury et al., 1998).
These observations may be indicative of early substrate depletion for the maintenance of protein synthesis. More likely they reflect limitations in energy generation by the tricarboxylic acid (TCA) cycle. Amino acids provide precursor substrates for the TCA cycle (Young and Marchini, 1990). If energy expenditure is increased, the need for the replenishment of amino acids is also increased (Wagenmakers, 1998).
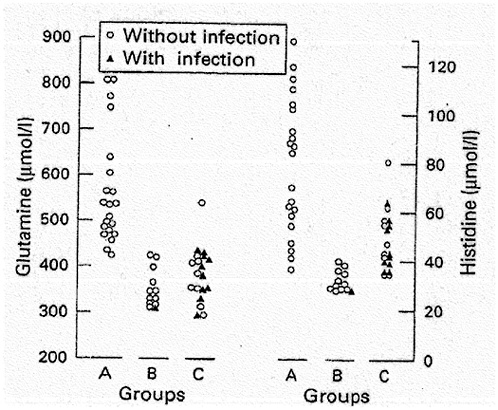
FIGURE D-28 Fasting plasma glutamine and histidine levels of athlete groups during training. Units are μmol/L−1. Subjects were divided into three groups depending level of fatigue: group A (n=21), no lasting fatigue; group B (n=12), heavy fatigue at night but with full recovery by the next day; and group C (n=18), chronic fatigue and poor performance.
SOURCE: Kingsbury et al. (1998), British Journal of Sports Medicine, 32, 25–33, with permission from the BMJ Publishing Group.
Assuming that the above results can be validated under more controlled conditions, it would appear that measurement of the fasting plasma aminogram has the potential for early identification of subjects prone to fatigue.
Energy
Troops in field situations may suffer from energy deficits either because of limited food availability or very high workloads. Indeed, rigorous military field training can induce energy deficits as high as 1,000 kcal/day (Friedl and Hoyt,
1997; Kramer et al., 1997). Such energy deficits lead to weight loss and some loss of lean body mass. Even so, nutrition is not likely to be the cause of fatigue. Glycogen depletion is a natural process, and after muscle glycogen has been used, muscle uses fat.
Humans have extensive energy reserves. The average male has enough endogenous fat to withstand starvation for up to 70 days. A controlled study by Zachwieja and colleagues (2001) found that moderate, short-term deficits (2 weeks, 750 kcal/day) in food intake does not impact performance in otherwise healthy individuals. Adequately fed humans have sufficient endogenous energy reserves to function normally for extended periods. With extreme depletion or nutritional deprivation, the situation will be different, but by that time fatigue will be of minor consequence in the health status of the soldier.
Alterations in fuel metabolism can be detected from reduced fuel availability in the plasma (fuels include energy substrates as well as oxygen) or from end products of fuel metabolism (e.g., lactate). However, since the fuel supply to the muscle is not likely to be limiting, monitoring dietary status as a potential predictor for the onset of fatigue is unlikely to be productive.
Other Nutritionally Related Factors
Several plausible mechanisms have been proposed to serve as biomarkers for fatigue. These include limited or decreased availability of energy fuels, glycogen depletion, depletion of phosphocreatine, proton accumulation, failure of neuromuscular transmission, and actual muscle damage (Davis, 1995). With the exception of proton accumulation (lactate production) and actual muscle damage, there is little supportive experimental evidence.
Monitoring specific fuels and metabolites within muscle (e.g., glycogen, phosphocreatine) is not likely to have the necessary reliability and sensitivity to serve as a biomarker for fatigue. There is no certainty that the muscle selected for monitoring is going to be one of the muscles causing the fatigue. Furthermore, such measurements are likely to be technically difficult.
MUSCLE DAMAGE
Excessive work leads to actual damage to muscle. Numerous studies have explored the use of plasma levels of muscle-derived proteins as indices of muscle damage. The principal markers that have been used are: aspartate amino transferase, lactate dehydrogenase, creatine kinase, myoglobin, fatty-acid binding proteins, carbonic anhydrase isoenzyme III, and myocyte contractile proteins such as troponins and myosin heavy chains (Janssen et al., 1989; Sorichter et al., 1999). In rodent studies it has been the clearly shown that the degree of damage estimated from plasma enzyme levels is greater than that found by histological examination. The reason is that plasma enzyme levels reflect a combination of actual muscle damage and transient changes in membrane permeability (Van der
Meulen et al., 1991). The most frequently used marker for muscle damage has been creatinine kinase.
A direct connection between muscle injury and muscle fatigue has not been proven. A little damage in one or two muscles is enough to increase plasma levels of muscle proteins, but a small degree of damage does not appear to impact performance, although if the muscle damage is severe enough, it should ultimately lead to impaired performance.
The problem with the use of proteins released from damaged muscle is that they are markers for damaged muscle—not fatigue. Subtle changes in muscle ultra structure may lead to decreased strength and fatigue, but such changes will not necessarily be reflected by increased leakage of muscle proteins into the plasma compartment (Behm et al., 2001). Muscle proteins can indicate damage, but they cannot predict fatigue in humans because the correlation between damage and fatigue is weak.
THE OVER-TRAINING SYNDROME
Related to muscle fatigue is the over-training syndrome. Over-training is a term that is used to describe the process where the training is excessive and results in a condition of staleness or burnout (Barron et al., 1985; Hooper et al., 1995). Staleness is characterized by chronic fatigue, poor performance, and delayed recovery (Fry et al., 1991; Kuipers and Keizer, 1988; Verde et al., 1992). The major symptom is underperformance (Budgett, 1998).
At present there are no objective markers for overtraining other than outcome. Parameters that have been investigated include heart rate, blood pressure, enzyme blood levels, hormones, and leukocyte numbers. In general, correlations have been observed, but they are weak and of no predictive potential. For example, a study by Hooper and colleagues (1995) investigated potential markers for overtraining in Olympic-caliber Australian swimmers. The only correlations between fatigue (as recorded by the subjects), staleness (failure to improve during training), and blood markers was higher levels of catecholamines (r2=0.33) and leukocytes (r2=−0.16) with fatigue. Both of these parameters are also markers for stress (Hooper et al., 1995). Elsewhere, Budgett (1998) concluded that “there is no diagnostic test available.”
CENTRAL FATIGUE
Little is known about the mechanisms for central fatigue as it has not been a very active area for research. But fatigue of central origin it is of potentially great significance to the Army because it could not only affect physical activity, but mental performance as well. Two viable hypotheses have been published: the ammonia hypothesis and the tryptophan hypothesis (Davis, 1995). In both cases, the theory is plausible; there is some experimental supporting evidence,
but is suggestive at best. The tryptophan hypothesis has attracted the most interest.
The Tryptophan Hypothesis
Newsholme and colleagues proposed that exercise-induced change in the plasma amino acid distribution could induce central fatigue by influencing the synthesis, concentration, and release of neurotransmitters, particularly 5-hydroxy tryptamine (5-HT) within the brain (Blomstrand, 2001; Castell et al., 1999). Brain 5-HT is in involved in the control of arousal, sleepiness, and mood, so it is therefore conceivable that brain 5-HT levels could lead to fatigue during and after vigorous physical activity (Blomstrand, 2001). Indeed, there is a considerable amount of evidence from rodent studies showing that inhibiting the action of 5-HT improves endurance (Blomstrand, 2001).
Plasma tryptophan is the precursor for brain 5-HT. The rate limiting step in the synthesis of 5-HT is the transport of tryptophan across the blood-brain barrier into the brain (Fernstrom, 1990). The tryptophan transporter system also transports the other large neutral amino acids, specifically the three branched-chain amino acids (BCAAs). The hypothesis proposes that competition for the transport between tryptophan and BCAAs occurs. Thus, the rate of entry of tryptophan into the brain will depend on the amount of free tryptophan in the blood compared with the amount of competitive amino acids. During prolonged exercise there is a decrease in the concentration of most amino acids. Most of the tryptophan in the plasma is bound to albumin, and free fatty acids compete for the tryptophan binding sites on albumin. Thus, as exercise progresses, fatty acid mobilization occurs and the increased plasma free fatty acid levels displace bound tryptophan from albumin, leading to an increase in free tryptophan in the plasma. At the same time, the concentration of BCAAs decreases with prolonged exercise. The net effect is that the ratio of free tryptophan to BCAA increases several-fold and more tryptophan is taken up into the brain. At rest, only about 10 percent of blood tryptophan is in the free form. Whether the ratio tryptophan to BCAA increases with exercise depends on the type and duration of the exercise.
The tryptophan:BCAA theory predicts that increasing the plasma BCAA concentration should decrease tryptophan uptake into the brain, thereby decreasing 5-HT synthesis and the delaying fatigue. A number of studies have sought to test this prediction. Results have been ambiguous, with some studies reporting positive results and others no effects from BCAA supplementation (Blomstrand, 2001). Ingestion of carbohydrates can also lead to lower free tryptophan during exercise. Carbohydrates depress fat mobilization, thereby increasing the proportion of the blood tryptophan bound to albumin. One report found improved mental agility of psychological tests during sustained competitive exercise when the subjects were given both BCAA and carbohydrate (Hassmen et al., 1994).
The potential markers are plasma tryptophan, plasma BCAAs, plasma albumin together with determination of the amounts of free fatty acids bound to
the albumin, and the plasma free fatty acid concentration. These are potential markers for the prediction of the onset of fatigue, and so should be considered as “real-time markers” rather than as predictors of future fatigue (e.g., amino acids). Overall the evidence is not very strong, but the hypothesis may be worth a definitive experiment. Part of the reason for favoring further investigation of the tryptophan hypothesis is that the hypothesis leads to a countermeasure: giving supplemental BCAAs. This would be feasible in a field situation.
The Ammonia Hypothesis
All tissues produce ammonia; high concentrations of ammonia in the brain are neurotoxic. With exercise, muscle ammonia production increases (Banister et al., 1985; Eriksson et al., 1985; Yuan and Chan, 2000). There is not, however, a direct correlation between exercise, blood ammonia levels, and the concentration of ammonia in the brain.
The major sources of the increased ammonia production in muscle are the purine nucleotide cycle in which adenosine monophosphate is deaminated to inosine monophosphate by adenylate deaminase, and the catabolism of BCAAs. Ammonia production through both pathways increases with duration and intensity of exercise.
Increasing the plasma ammonia levels with exercise leads to an increase in the tissues and a parallel increase within the brain (Meyer et al., 1980). The mechanisms for the increased brain ammonia are not known; both increased uptake and decreased export have been proposed (Banister et al., 1985; Yuan and Chan, 2000). Within the brain, ammonia participates in numerous reactions that could lead to neurotoxicity. The levels produced with exercise are comparable with neurotoxic levels (Banister et al., 1985), but exercise-induced increases are transient—they resolve soon after the termination of exercise. In the case of clinically induced hyperammonemia, reducing the ammonia load has been of benefit.
A potential marker for fatigue is the blood ammonia level. However, although this hypothesis is viable, there is little actual experimental evidence.
SUMMARY
The only amino acid-derived parameter with the potential for predicting future fatigue is measurement of the fasting plasma aminogram during a period of strenuous training (Kingsbury et al., 1998). If the findings on Olympic athletes can be reproduced with soldiers, measurement of the fasting plasma aminogram during training could have the potential for early identification of subjects prone to early fatigue. The measurement appears to have both the specificity and technical simplicity needed to be used in a real-life situation (Kingsbury et al., 1998). Moreover, Kingsbury and colleagues (1998) reported that in a small subset of their cohort with low plasma amino acid levels, increasing dietary intake
did lead to improved performance. Thus, there is also the possibility of treatment. Replicating Kingsbury’s results in the population of interest to the Army would be important.
The potential gain for the Army in following up Kingsbury’s observations is great, the risks negligible, and the cost small. The results are scientifically plausible. Indeed, the Army suspected that amino acids intake might be a key factor in improving performance and in 1999 commissioned the Committee on Military Nutrition to investigate the role of amino acids in improving performance. The British study was published after the committee completed their report. One wonders what would the committee have concluded had it seen Kingsbury’s data?
REFERENCES
Banister EW, Rajendra W, Mutch BJ. 1985. Ammonia as an indicator of exercise stress: Implications of recent findings to sports medicine. Sports Med 2:34–46.
Barron JL, Noakes TD, Levy W, Smith C, Millar RP. 1985. Hypothalamic dysfunction in overtrained athletes. J Clin Endocrinol Metab 60:803–806.
Behm DG, Baker KM, Kelland R, Lomond J. 2001. The effect of muscle damage on strength and fatigue deficits. J Strength Cond Res 15:255–263.
Blomstrand E. 2001. Amino acids and central fatigue. Amino Acids 20:25–34.
Budgett R. 1998. Fatigue and underperformance in athletes: The overtraining syndrome. Br J Sports Med 32:107–110.
Castell LM, Yamamoto T, Phoenix J, Newsholme EA. 1999. The role of tryptophan in fatigue in different conditions of stress. Adv Exp Med Biol 467:697–704.
Clarkson PM, Nosaka K, Braun B. 1992. Muscle function after exercise-induced muscle damage and rapid adaptation. Med Sci Sports Exerc 24:512–520.
Davies CT, White MJ. 1981. Muscle weakness following eccentric work in man. Pflugers Arch 392:168–171.
Davis JM. 1995. Central and peripheral factors in fatigue. J Sports Sci 13:849-S53.
Edwards RHT. 1981. Human muscle function and fatigue: Physiological mechanisms. In: Porter R, Whelan WJ, eds. CIBA Foundation Symposia. London: Pitman Medical. Pp. 1–18.
Eriksson LS, Broberg S, Bjorkman O, Wahren J. 1985. Ammonia metabolism during exercise in man. Clin Physiol 5:325–336.
Fernstrom JD. 1990. Aromatic amino acids and monoamine synthesis in the CNS. Influence of diet. J Nutr Biochem 10:508–517.
Friedl KE, Hoyt RW. 1997. Development and biomedical testing of military operational rations. Annu Rev Nutr 17:51–75.
Fry RW, Morton AR, Keast D. 1991. Overtraining in athletes. An update. Sports Med 12:32–65.
Hassmen P, Blomstrand E, Ekblom B, Newsholme EA. 1994. Branched-chain amino acid supplementation during 30-km competitive run: Mood and cognitive performance. Nutrition 10:405–410.
Hooper SL, Mackinnon LT, Howard A, Gordon RD, Bachmann AW. 1995. Markers for monitoring overtraining and recovery. Med Sci Sports Exerc 27:106–112.
Janssen GM, Kuipers H, Willems GM, Does RJ, Janssen MP, Geurten P. 1989. Plasma activity of muscle enzymes: Quantification of skeletal muscle damage and relationship with metabolic variables. Int J Sports Med 10:S160– S168.
Kingsbury KJ, Kay L, Hjelm M. 1998. Contrasting plasma free amino acid patterns in elite athletes: Association with fatigue and infection. Br J Sports Med 32:25–32.
Kramer TR, Moore RJ, Shippee RL, Friedl KE, Martinez-Lopez L, Chan MM, Askew EW. 1997. Effects of food restriction in military training on T-lymphocyte responses. Int J Sports Med 18:S84–S90.
Kuipers H, Keizer HA. 1988. Overtraining in elite athletes. Review and directions for the future. Sports Med 6:79–92.
Long CL, Birkhahn RH, Geiger JW, Betts JE, Schiller WR, Blakemore WS. 1981. Urinary excretion of 3-methylhistidine: An assessment of muscle protein catabolism in adult normal subjects and during malnutrition, sepsis, and skeletal trauma. Metabolism 30:765–776.
Meyer RA, Dudley GA, Terjung RL. 1980. Ammonia and IMP in different skeletal muscle fibers after exercise in rats. J Appl Physiol 49:1037–1041.
Munro HN, Young VR. 1978. Urinary excretion of N gamma-methylihistidine (3-methylihistidine): A tool to study metabolic responses in relation to nutrient and hormonal status in health and disease of man. Am J Clin Nutr 31:1608–1614.
Rathmacher JA, Flakoll PJ, Nissen SL. 1995. A compartmental model of 3-methylhistidine metabolism in humans. Am J Physiol 269:E193-E198.
Rennie MJ, Millward DJ. 1983. 3-Methylhistidine excretion and the urinary 3-methylhistidine/creatinine ratio are poor indicators of skeletal muscle protein breakdown. Clin Sci 65:217–225.
Smith LL. 1991. Acute inflammation: The underlying mechanism in delayed onset muscle soreness? Med Sci Sports Exerc 23:542–551.
Sorichter S, Puschendorf B, Mair J. 1999. Skeletal muscle injury induced by eccentric muscle action: Muscle proteins as markers of muscle fiber injury. Exerc Immunol Rev 5:5–21.
Van der Meulen JH, Kuipers H, Drukker J. 1991. Relationship between exercise-induced muscle damage and enzyme release in rats. J Appl Physiol 71:999–1004.
Verde T, Thomas S, Shephard RJ. 1992. Potential markers of heavy training in highly trained distance runners. Br J Sports Med 26:167–175.
Wagenmakers AJ. 1998. Protein and amino acid metabolism in human muscle. Adv Exp Med Biol 441:301–319.
Young VR, Marchini JS. 1990. Mechanisms and nutritional significance of metabolic responses to altered intakes of protein and amino acids, with reference to nutritional adaptation in humans. Am J Clin Nutr 51:270–289.
Yuan Y, Chan KM. 2000. A review of the literature on the application of blood ammonia measurement in sports science. Res Q Exerc Sport 71:145–151.
Zachwieja JJ, Ezell DM, Cline AD, Ricketts JC, Vicknair PC, Schorle SM, Ryan DH. 2001. Short-term dietary energy restriction reduces lean body mass but not performance in physically active men and women. Int J Sports Med 22:310–316.
BIOMARKERS OF BONE AND MUSCLE TURNOVER: EFFECTS OF EXERCISE
Clifford J.Rosen, Wesley G.Beamer, Leah Rae Donahue, The Jackson Laboratory
Bone is a hard tissue with multiple components that provide mammals with a structural framework and a never-ending source of calcium for most homeostatic processes. Traditionally, the skeleton has been classified into trabecular and cortical elements. As such, the cortical shell has been classically viewed as protective with relatively slow remodeling rates, whereas the trabecular skeleton has been considered metabolically active due to its proximity to marrow elements and its large surface area. This, however, is a relatively simplistic model for the skeleton since it is clear that there are other major differences for these two components, both in respect to cell constitution and vascular supply. In addition, the regulation of bone growth, modeling, and acquisition differs in time, sequence, and outcome between cortical and trabecular sites. Thus, as growth occurs, modeling of the skeleton takes place at the growth plate and at periosteal sites along long bones. Muscle insertion also occurs on the periosteum, and repetitive stresses strongly influence periosteal expansion and turnover.
The process of remodeling and subsequent bone acquisition represents a complex consolidative process occurring at the endosteal surface as well as the periosteum, ultimately resulting in attainment of peak bone mass. For the trabecular skeleton, that point occurs around the time of linear growth cessation, whereas cortical bone continues to consolidate until people reach their early thirties. The control over growth and remodeling, as well as skeletal maintenance, has been the subject of intense investigation over the last two decades. However, less attention has been paid to the differential compartments as they relate to growth and remodeling. Recent evidence from our laboratory and others have provided significant insight into the role of periosteal growth and remodeling in the acquisition of bone mass and the potential role of the
periosteum in modulating exercise-induced skeletal changes. This paper discusses one marker of bone and muscle turnover, IGF-I, insulin-like growth factor-I, and its role in the process of cortical peak acquisition and skeletal homeostasis.
THE PERIOSTEUM AND ENDOSTEUM
The periosteum is a highly specialized surface overlying the cortical envelop of all long bones. Although it contains all the necessary cells for bone remodeling (i.e., osteoclasts, osteoblasts, and osteocytes), the origin of these cells remains in doubt. Because of the prominent vascular supply to the periosteum and its role in fracture healing, it seems likely that these osteoblasts are, at the least, unique in respect to their signaling and origin from primitive cells outside the bone marrow. Indeed, there is some suggestion that periosteal osteoblasts may be derived from pericytes in the blood vessels of the outer cortical shell. Regardless of their site of origin, it is apparent that periosteal function changes with various stages of life, and that certain periosteal osteoblasts may work in opposition to their counterparts on the endosteum. In fact, there is likely to be differential regulation of these two compartments, and this in turn becomes important for targeting approaches aimed at strengthening bone or preventing stress fractures.
Several recent lines of evidence support differential regulation of periosteal and endosteal bone turnover. First, our group was the first to report that among inbred strains of mice, there are strong genetic differences in peak bone acquisition (Beamer et al., 1996). Initially due to the level of resolution of our scanning devices in mice, we hypothesized that the differences among inbred strains was purely genetic and not confined to a single skeletal compartment. However, recently we reported that although one inbred strain, C3H/HeJ, had much higher cortical bone mass than did another strain, C57BL6, that difference was reversed when we examined trabecular bone mass by uCT analysis (Beamer et al., 2001). Hence, within a given strain, one can find both high and low bone mass depending on the compartment being measured. Moreover, we had assumed that all bone mass was acquired in the mouse by 16 weeks of age (Beamer et al., 1996). This also proved incorrect! Cortical bone density reached peak at 4 months of age, but trabecular bone mineral density is more rapidly acquired and maintained by 6 weeks of age (Beamer et al., 1996; Bouxsein, personal communication). These findings confirm that there is dual regulation of skeletal compartments in mice.
More emerging evidence supports this thesis. A recent abstract from a group in Sweden confirmed that in humans, these two skeletal compartments work in opposite directions (Ahlborg et al., 2002). The authors followed more than 100 postmenopausal women for 19 years using single energy X-ray absorptiometry of the distal radius. They noted about a 1.7 percent/year rate of bone loss, principally from the endosteal surface, in these women over the two dec-
ades. By contrast, periosteal circumference increased 0.6 percent/year and hence expanded by nearly 12 percent over the two decades of observation. This expansion is associated with an improvement in the cross-sectional moment of inertia, and almost certainly results in modest, but not complete, structural protection against rapid bone loss. The third line of evidence is derived from unloading experiments in C3H animals with high cortical bone mass. Despite significant endosteal bone loss after sciatic neurectomy, cortical expansion becomes a major compensatory pathway that preserves bone strength, at least in the short run.
Very recently, Kim and colleagues (2003) examined the differential regulation of the periosteum and endosteum in growing rats of both genders. To begin with, they reported that male rats tend to have nearly 25 percent greater bone width than females, and this is associated with greater bone strength. They noted that growth hormone (GH) and androgens in males independently stimulate expansion of bone, but that GH deficiency alone does not significantly reduce bone fragility because of the androgen-mediated effects on periosteal growth. By contrast, in females, GH stimulates periosteal expansion, but estrogen inhibits such growth. Hence, gonadectomy in females results in trabecular bone loss, but periosteal expansion as the inhibitor of such activity is removed. As such, it is clear that under certain hormonal manipulations, as well as with mechanical influences, changes in the periosteal envelope differ considerably from that in the endosteum.
What controls periosteal and endosteal remodeling and growth? Since the origin of periosteal osteoblasts is not known, many questions remain about the control mechanisms involved in periosteal expansion during growth and with aging. Utilizing inbred strains of mice, our group has defined the importance of genetic determinants in periosteal and endosteal expansion. It is also clear that there are at least two principal regulators of the periosteum: skeletal muscle with its insertion into bone, and systemic hormones that likely make their way through the vascular network in the periosteum to alter the behavior of specific bone cells. As noted above, the sex steroids certainly are considered within this latter category, although many investigators would maintain that both types of regulators work through a single common pathway, the IGF regulatory system.
THE REGULATION OF THE PERIOSTEUM: A ROLE FOR IGF-I?
Several lines of evidence support a major role for circulating IGF-I in determining bone size. These data are principally derived from in vivo manipulations using genetic engineering and inbred strains of mice. IGF-I is a ubiquitous polypeptide that is expressed in most tissues and also circulates in very large concentrations bound to a series of IGF-specific binding proteins. Bone is a major site of IGF-I production, principally from early and mature osteoblasts. It is stored within the skeletal matrix bound to IGFBP-5 and IGFBP-2 and released during osteoclast-mediated bone resorption. Because the marrow bathes trabecular elements, it is not surprising that the relative content of IGF-I in sites such as
the vertebrae is quite substantial. As such, the principal source of IGF-I in these areas is likely to be local synthesis. On the other hand, although the periosteum is rich in osteoblasts, IGF-I content in this region appears to be a function of both circulatory and local synthesis. Impressive in vivo data supporting this contention have recently been published by our group and others.
Technology that permits selective knockout or knockdown of ligands and receptors in mice has opened an exciting era for testing functional correlates of peptide growth factors and their signals. Yakar and colleagues (2002) recently demonstrated that with selective knockout of the IGF-I gene in liver, there are significant skeletal changes. The LID mice were generated by using an albumin promoter tied to Cre-recombinase and mating those mice with another group of mice carrying a floxed IGF-I gene. The resultant animals had normal expression of IGF-I in all other tissues besides the liver, including the skeleton, but a 75 percent reduction in serum IGF-I. Despite growth curves that were not markedly abnormal, the long bones of the LID mice were shorter and had markedly reduced bone volume despite normal skeletal IGF-I expression. All the skeletal changes were in the cortical component and reflected a reduction in periosteal circumference as well as cortical thickness. Trabecular bone was entirely normal. These data suggest that alterations in circulating IGF-I affect skeleton modeling and principally the cortical component. Similarly, recent work from Tom Clemens and from our laboratory have shown that knockout of the IGF-I Type I receptor in mature osteoblasts using an osteocalcin-specific promoter and Cre lox P recombinase resulted in a dramatic skeletal phenotype of reduced trabecular bone density and slow bone mineralization, but no change in the cortical envelop, periosteal circumference, or femur length (Zhang et al., 2002). These data are remarkably similar to over-expression studies of IGF-I in bone, in which the animals have significantly enhanced bone density but no change in size, volume, or length of their bones (Zhao et al., 2000). Finally, our laboratory has confirmed that in a spontaneous mutant mouse, little, which does not make growth hormone and has low serum IGF-I, periosteal size and circumference are markedly reduced (as is femur length), but that trabecular bone mass is not altered, nor is skeletal expression of IGF-I. In sum, it appears that circulating, but not skeletal, IGF-I controls periosteal growth and modeling, whereas local IGF-I almost certainly plays an important role in trabecular mineralization and acquisition.
Further support for that tenet comes from work with congenic mice at The Jackson Laboratory. Bouxsein and colleagues (2002) created a congenic mouse that has a knockdown in serum IGF-I of approximately 20 to 25 percent. This is associated with no change in skeletal IGF-I expression, but a significant reduction in periosteal circumference, femoral length, and cortical osteocyte apoptosis. This congenic (6-T) also has reduced free levels of IGF-I compared with parental C57BL6 controls, suggesting that alterations in the circulating concentration of IGF-I can have a significant impact on bone growth and consolidation.
WHAT IS THE ROLE OF EXERCISE, LEAN MASS, AND MUSCLE IN PERIOSTEAL GROWTH?
Particular animal models have allowed us to dissect the regulation of individual skeletal compartments by careful phenotyping. Another approach is to define how the second major regulator of cortical bone, skeletal muscle, affects periosteal growth and expansion. Once again, we can turn to animal models. Currently, at The Jackson Laboratory, a major endeavor is underway to completely characterize a number of phenotypes related to body composition and bone mass in 40 different strains of mice. Not surprising, there are major differences not only in bone mass, but also in IGF-I and body composition among these strains. The “Phenome Project” will provide tremendous insight into the role of muscle and lean mass, as well as adiposity in periosteal and endosteal growth. Several strains have been identified that have similar lean body mass but major differences in bone mineral content. Experimental manipulation of these mice, followed by public dissemination of this information, will allow investigators to dissect how muscle mass, or repetitive muscle action, affects peak cortical and trabecular bone mass on various genetic backgrounds. Other approaches are likely to include repetitive exercise and muscle stimulation studies to define how muscle determines the structure of bone envelopes. In the meantime, more studies are needed to define how circulating IGF-I may predict risk for failure of the cortical skeleton, principally in respect to stress fractures. Randomized controlled trials are needed with periosteal changes as an important end point to define how particular interventions may improve both mineral and structure, thereby optimizing bone strength. Serum IGF-I is regulated by genetic factors, nutritional determinants, age of the individual, growth hormone secretion, insulin status, and systemic cytokine elaboration. As such, this test may prove to be extremely useful as an integrative measure of physiological homeostasis, as well as an indirect indicator of periosteal status.
REFERENCES
Ahlborg HG, Johnel O, Turner CH, Karlsson MK. 2002. Decreased postmenopausal bone strength due to bone loss is compensated by increased bone size, and a strength index including both bone mass and size, predict future fractures. J Bone Miner Res 17:S163.
Beamer WG, Donahue LR, Rosen CJ, Baylink DJ. 1996. Genetic differences in peak bone mass in mice. Bone 18:397–405.
Beamer WG, Shultz KL, Donahue LR, Churchill GA, Sen S, Wergedal JR, Baylink DJ, Rosen CJ. 2001. Quantitative trait loci for femoral and lumbar vertebral bone density in B6 and C3H inbred strains of mice. J Bone Miner Res 16:1195–1206.
Bouxsein ML, Rosen CJ, Turner CH, Ackert CL, Shultz KL, Donahue LR, Churchill G, Adamo ML, Powell DR, Turner RT, Muller R, Beamer WG. 2002. Generation of a new congenic mouse strain to test the relationship
among serum IGF-I, bone mineral density and skeletal morphology in vivo. J Bone Miner Res 17:570–579.
Kim BT, Mosekilde L, Duan Y, Zhang XZ, Tornvig L, Thomsen JS, Seeman E. 2003. The structural and hormonal basis of sex differences in peak appendicular bone strength in rats. J Bone Miner Res 18:150–155.
Yakar S, Rosen C, Beamer WG, Ackert C, Wu Y, Liu JL, Ooi GT, Setser J, Frystyk J, Boisclair YR, LeRoith D. 2002. Circulating levels of IGF-I directly regulate bone growth and density. J Clin Invest 110:771–781.
Zhang M, Xuan S, Bouxsein ML, Stechow D, Akeno N, Guagere M, Maulluche H, Zhao G, Rosen CJ, Efstriatiadis A, Clemens TL. 2002. Osteoblast specific knockout of the IGF receptor gene reveals an essential role of IGF signaling in bone matrix mineralization. J Biol Chem 277:44005–44012.
Zhao G, Monier-Faugere MC, Langub MC, Geng Z, Nakayama T, Pike JW, Chernausek SD, Rosen CJ, Donahue LR, Malluche H, Fagin JA, Clemens TL. 2000. Targeted overexpression of IGF-I to osteoblasts of transgenic mice increases trabecular bone volume. Endocrinology 141:2674–2682.
BIOMARKERS FOR MONITORING BONE TURNOVER AND PREDICTING BONE STRESS
Michael Kleerekoper, Wayne State University
BONE TURNOVER (REMODELING)
Bone is a structural tissue that, in common with all structural materials, is subject to fatigue damage and fracture if left unprepared. As living tissue, one has the unique potential for self-repair of fatigue damage via a process termed bone turnover or bone remodeling. This process is continuous throughout life and is governed by a variety of systemic hormonal and nutritional factors, local factors (cytokines), and local mechanical stress. During intrauterine and early postnatal life, remodeling is very rapid as the cartilaginous “scaffolding” is removed and replaced with early bone elements. This rapid phase in early infancy results in positive skeletal balance as bone is modeled into its adult shape. During childhood, the process slows dramatically but remains in slight positive balance, only to accelerate again coincident with the pubertal growth spurt, again maintaining positive balance. Once peak adult bone mass and maturity is reached in the third or fourth decade, the balance between removal of older, “damaged” bone (resorption) and replacement with new bone at the same site (formation) is in equilibrium with no net gain or loss of bone. Beginning late in the fifth decade or early in the sixth decade, this balance is upset. For unknown reasons, resorption exceeds formation with net negative skeletal balance such
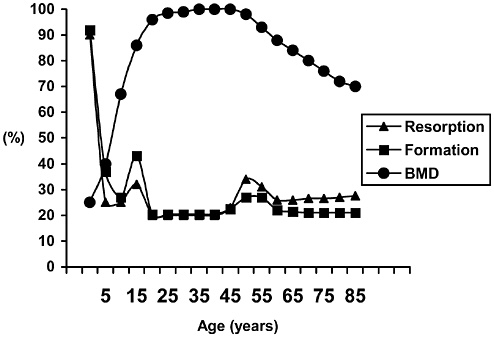
FIGURE D-29 Relative changes in bone mineral density (BMD), bone resorption, and bone formation as a function of age.
that bone loss is a universal phenomenon in human aging. The natural menopause in women results in a decline in estrogen levels to a point that local cytokine production is stimulated and bone remodeling rate increases again, but to nowhere near the levels seen during early skeletal development. This process is reversed by replacement of estrogen, by administration of antibodies to the local cytokines, or by administration of pharmacological agents that inhibit bone resorption. The rapid bone loss of the early menopause is short-lived (5–7 years), again via unknown mechanisms since estrogen levels remain low in the untreated state, but age-related bone loss continues as seen in Figure D-29.
The cells involved in bone remodeling are osteoclasts (responsible for bone resorption), osteoblasts (responsible for bone formation), and osteocytes (responsible for bone nutrition, channels for transport of nutrients and chemicals, and possibly also as local stretch or stress receptors). A number of metabolic diseases and pharmacological agents have direct effects on the bone remodeling process resulting in accelerated negative skeletal bone balance. Menopausal and age-related negative skeletal balance results in osteoporosis.
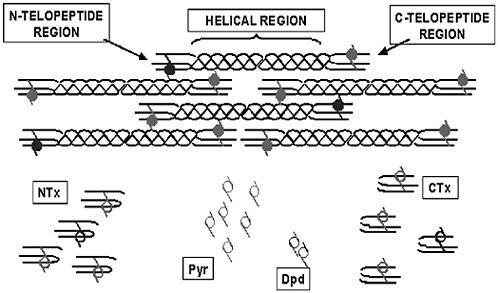
FIGURE D-30 A cartoon depicting the cross-linking between molecules of type I collagen and the breakdown products.
SOURCE: Reprinted, with permission Watts (1999), American Association for Clinical Chemistry.
BIOCHEMICAL MARKERS OF BONE TURNOVER
As osteoclasts breakdown, the skeleton to begin the process of turnover. There is removal of bone mineral (mainly calcium) and bone matrix (mainly type I collagen), and these breakdown products enter the circulation and are subsequently excreted in the urine, largely unchanged. The rise in serum calcium resulting from bone resorption is imperceptible in most circumstances because of rapid renal clearance. While urine calcium increases, it is a very nonspecific marker of the bone turnover process. The breakdown of type I collagen begins with cleavage of pyridinium cross-links between adjacent collagen molecules. Collagen is a triple helix consisting of two α1 chains and one α2 chain. At each end of the helix is a straight portion known as telopeptides with one at the amino terminal (NTX) and one at the carboxy terminal (CTX). The cross-links are between the telopeptide of one collagen molecule and the helical portion of the adjacent molecule. There are two main cross-links, pyridinoline (PYR), which is the more abundant moiety but less specific for type I collagen, and deoxypyridinoline (DPD), which is less abundant but more specific for type I collagen. These breakdown products of bone resorption may be excreted as free moieties or bound to the telopeptides. Thus NTX, CTX, PYR, and DPD constitute the main biomarkers of bone resorption. The cross-linking and breakdown products are depicted in Figure D-30. Tartrate-resistant acid phosphatase (TRAP),
TABLE D-6 Biochemical Markers of Bone Turnover
|
Stage |
Location |
Biochemical Marker |
|
Resorption |
Serum |
Amino-terminal telopeptide of collagen cross-links Carboxy-terminal telopeptide of collagen cross-links Tartrate-resistant acid phosphatase Carboxy-terminal telopeptide of type I collagen |
|
|
Urine |
Amino-terminal telopeptide of collagen cross-links Carboxy-terminal telopeptide of collagen cross-links Deoxypyridinoline Pyridinilone |
|
Formation |
Serum |
Bone specific alkaline phosphatase Carboxy -terminal fragment of type 1 procollagen Amino-terminal fragment of type I procollagen |
|
Turnover |
Serum |
Osteocalcin Osteoprotegerin Bone sialoprotein |
particularly the 5b epitope (TRAP 5b), are specific gene products of the osteoclast and can also be measured as an assessment of bone resorption.
Type I collagen is a secretory product of the osteoblast. It leaves the cell as a larger procollagen molecule from which an amino terminal and a carboxy terminal propeptide are cleaved before incorporation into the bone matrix. These extension peptides remain in the circulation where they can be measured (P1NP and P1CP) as markers of osteoblastic activity. Alkaline phosphatase (AP) is an enzyme secreted by the osteoblast and is involved in bone mineralization. There are many isoenzymes of AP that differ in post-translational glycosylation. While total AP is a useful marker when levels are quite elevated, the bone-specific isoenzyme has better sensitivity and specificity. Osteocalcin (OCN) is also a secretory product of the osteoblast and is incorporated into the bone matrix as a noncollagenous protein. While this could qualify OCN as a marker of formation, as part of the bone matrix it is also released during bone resorption so is really a marker of “turnover,” with some resultant loss of sensitivity. A summary of the biochemical markers of bone turnover is presented in Table D-6.
CLINICAL UTILITY OF BONE MARKERS
In those conditions where a specific disease process directly alters bone turnover (e.g., Paget’s disease of bone, osteomalacia, rickets), the level of biochemical markers is usually quite elevated, and changes in these levels can be used to monitor progression or regression of the disease in individual patients. In contrast, in diseases that result from a primary abnormality in the remodeling balance, most notably osteoporosis, the markers have lesser sensitivity and specificity for monitoring progression or regression of disease in individual patients. Population studies do suggest that the higher the turnover, the greater the
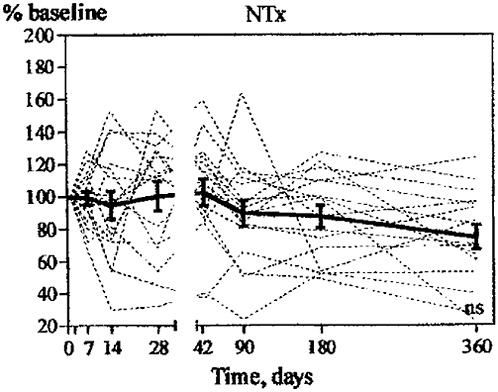
FIGURE D-31 Serial changes in urine amino-terminal telopeptide of collagen cross-links (NTX) following ankle fracture.
SOURCE: Osteoporosis International, Ingle et al. (1999a), with permission from Springer-Verlag.
anticipated rate of bone loss, but there are only weak correlations between baseline levels of markers and prospectively measured changes in bone mineral density (BMD). Similarly, population-based studies in the elderly have demonstrated that high levels of markers can predict hip fracture risk almost as well as can hip BMD, but here too that is of limited sensitivity and specificity in individual patients. Patients with osteoporosis who are treated with drugs that inhibit bone resorption generally have low levels of markers while compliant with therapy. A high level of marker on therapy in a compliant patient suggests that another metabolic bone disease might have supervened on the osteoporosis. With the recent introduction of teriparatide (synthetic amino-terminal parathyroid hormone) as a therapy to directly stimulate bone formation, there are likely to be expanded roles for markers in selecting patients for specific therapies and in monitoring the therapeutic response (Watts, 1999).
BONE TURNOVER MARKERS AND FRACTURES
An acute fracture is a potent stimulus to bone repair, and there are resultant changes in markers of bone turnover. However, this has been surprisingly little studied and those few studies that have been reported have yielded disappointing results. This is not really a surprise as fracture repair is a local process and the markers of bone turnover reflect global skeletal remodeling.
The most extensive work has come from two back-to-back articles by Ingle and colleagues (1999a, 1999b). The first followed serial changes after distal forearm fracture and the second after ankle fracture (see Figure D-31). The forearm fracture study followed 20 women, mean age 63 years, for 52 weeks following the fracture. In individual subjects there were marked changes in some of the markers studied, but not in any consistent pattern. Overall there was minimal serial change in the studied markers.
BONE TURNOVER AND STRESS FRACTURES
Only one group has studied changes in bone markers before and after the development of stress fractures in athletes (Bennell et al., 1998). There were no differences in baseline levels of markers between those who did or did not sustain a stress fracture. The serial data demonstrated no change in markers from before to after fracture during a total of 12 months of follow-up.
SUMMARY AND CONCLUSIONS
Bone turnover is an efficient mechanism for ongoing repair of microdamage to the skeleton. Stress fractures occur when the rate of accumulation and propagation of microdamage exceeds the capacity of the repair process. Several biochemical markers are available to monitor the global rate of bone turnover and have proven useful in monitoring progression or regression of systemic metabolic diseases resulting in abnormal turnover or resulting from abnormalities in the remodeling cycle. Changes in these markers undoubtedly occur during the repair phases following acute traumatic fracture, but the extent of skeleton involved is too small to be reflected in these markers of global skeletal activity. It is likely that changes in markers occur during the development and repair of stress fractures. However, here too the extent of skeleton involved is too small to be reflected in these markers of global skeletal activity.
THE FUTURE?
It is extremely unlikely that a marker of bone turnover with sufficient sensitivity to detect change when only small area of the skeleton is damaged will be developed in the foreseeable future. Functional imaging studies (magnetic resonance imaging, positron emission tomography, regional bone scintigraphy) are far more likely to detect changes in local skeletal remodeling that precede stress
fractures, even in the asymptomatic state. Whether it will ever be economically feasible to apply these technologies to asymptomatic recruits in the hopes of predicting stress fracture will require extensive and expensive prospective studies. Whether such early prefracture detection will decrease the “down-time” for recruits recovering from stress fractures is questionable.
REFERENCES
Bennell KL, Malcolm SA, Brukner PD, Green RM, Hopper JL, Wark JD, Ebeling PR. 1998. A 12-month prospective study of the relationship between stress fractures and bone turnover in athletes. Calcif Tissue Int 63:80–85.
Ingle BM, Hay SM, Bottjer HM, Eastell R. 1999a. Changes in bone mass and bone turnover following ankle fracture. Osteoporos Int 10:408–415.
Ingle BM, Hay SM, Bottjer HM, Eastell R. 1999b. Changes in bone mass and bone turnover following distal forearm fracture. Osteoporos Int 10:399–407.
Watts NB. 1999. Clinical utility of biochemical markers of bone remodeling. Clin Chem 45:1359–1368.
BIOMARKERS TO PREDICT THE OCCURRENCE OF BONE STRESS AND MATRIX ABNORMALITIES DUE TO SUSTAINED AND INTENSIVE PHYSICAL ACTIVITY
Wendy M.Kohrt, Catherine M.Jankowski, University of Colorado Health Sciences Center
There are two major competing hypotheses for the pathogenesis of stress fractures that occur as a result of high-intensity repetitive mechanical loading, such as in basic training for the military. The first hypothesis is that it is mechanical stress, per se, that causes bone to fail. The second hypothesis is that mechanical loading triggers an increase in bone remodeling activity that causes a transient reduction in bone mass, thereby increasing the vulnerability of bone to damage if mechanical loading continues. This brief review will focus on the concept that the initiation of vigorous exercise training could trigger an increase in bone resorption through three general pathways: (1) a normal, mechanical stress-induced increase in bone remodeling, (2) an increase in bone resorption to repair microdamage caused by mechanical stress, and (3) the effects of exercise training on other physiological factors that influence bone resorption or forma-
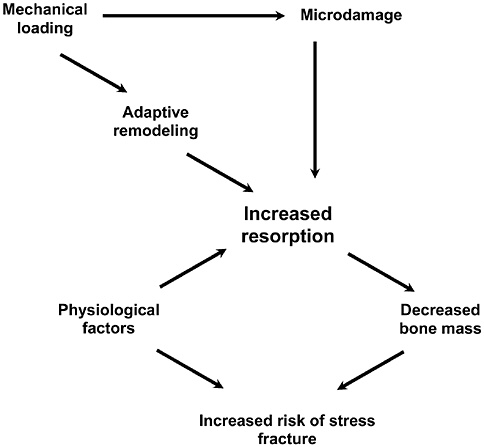
FIGURE D-32 Theoretical model for an increase in bone resorption in response to (a) loading-induced remodeling activity, (b) microdamage that occurs as a result of mechanical loading, and (c) exercise-induced changes in physiological factors that increase bone resorption. The “hyper-resorptive” state would result in a transient reduction in bone mass, increasing the vulnerability of bone to stress fracture. Physiological factors may also exacerbate risk of stress fracture through other mechanisms (e.g., reduced calcium absorption consequent to increased cortisol excretion).
tion (see Figure D-32). Finally, biomarkers thought to be potential predictors of risk for stress fracture will be identified.
EPIDEMIOLOGY OF STRESS FRACTURES
Stress fractures are nontraumatic fractures that are due to repeated loading of the skeleton (Burr, 1997). They typically occur in physically active individuals, including soldiers, runners, and dancers. The most common fracture sites are the tibia (soldiers, runners), metatarsals (dancers), and calcaneus. In military
recruits, incidence rates of stress fracture are elevated within 2 to 3 weeks of the onset of training, and peak rates occur after 5 to 8 weeks (Burr, 1997).
In a recent study of 3,758 female U.S. military recruits, the incidence of stress fracture was 8.5 percent during 8 weeks of basic training (Lappe et al., 2001). Women who fractured, compared with those who did not, were: older, more likely to use depo-medroxyprogesterone acetate, had a lower adult body weight, and were more likely to report current or past smoking, alcohol consumption of more than 10 drinks per week, and use of corticosteroids. A history of regular exercise was protective. Such findings suggest that risk for stress fracture is influenced by a number of physiological and behavioral factors.
DEVELOPMENT OF STRESS FRACTURES-MECHANICAL LOADING FACTORS
There is a wealth of evidence from a variety of animal models that repetitive mechanical loading results in bone damage (Burr, 1997; Burr et al., 1997). Furthermore, the rate of development of lesions is consistent with the observation in humans that stress fractures develop in a matter of weeks in response to an abrupt increase in mechanical stress (Burr et al., 1990). Based on theoretical modeling and empirical data from studies of animals, very high levels of bone strain (e.g., 8,000 microstrain) will cause bone to fail after only 103 to 104 loading cycles. However, in humans, peak shear strains of the tibia measured during walking and running under a variety of conditions (e.g., uphill, downhill, zigzag, while carrying extra weight) are typically less than 2,000 microstrain. At this level of strain, it has been estimated that bone can withstand at least 106 loading cycles, or roughly 1,100 miles of running (Burr, 1997).
Although these observations suggest that mechanical stress, per se, is not likely to be the sole cause of stress fractures that occur after only a few weeks of basic training, definitive evidence to rule this out is lacking. It is possible that bone strain is increased under certain conditions, such as when muscles are fatigued (Christina et al., 2001), or that brief periods of mechanical stress in excess of 2,000 microstrain induce damage. Although higher degrees of strain may not occur during planned activities (Milgrom et al., 2000), they may occur during unplanned movements. For example, in patients with hip prostheses outfitted with telemetrically monitored force sensors, the highest forces were recorded during unexpected movements, such as stumbling (Bergmann et al., 1993, 1995). However, even when all these factors are considered, it seems unlikely that the development of stress fractures after only a few weeks of intensive physical activity is attributable solely to mechanical stress. In an animal model, more than 30,000 loading cycles applied to a limb over a 3-week period resulted in bone damage, whereas applying the same number of loading cycles in 1 day did not (Burr, 1993). The temporal factor suggests that physiological responses to the mechanical stress contribute to the propensity for fracture.
DEVELOPMENT OF STRESS FRACTURES—BONE REMODELING FACTORS
Mechanical stress is thought to trigger an increase in bone remodeling activity that begins with an increase in bone resorption, leading to a transient decrease in bone mass, followed by an increase in bone formation. The transient reduction in bone mass would increase the vulnerability of bone to damage if mechanical loading continues during this period because forces of the same magnitude would now represent a greater relative stress. This hypothesis is consistent with theoretical models and empirical data on the time course of remodeling and of the development of stress fractures (Burr, 1997). The recruitment of osteoclasts, the bone resorbing cells, typically occurs in a few days. The period of bone resorption lasts about 3 to 4 weeks, with subsequent activation of bone formation activity.
If the induction of bone resorption and consequent decrease in bone mass does, indeed, increase the susceptibility of bone to stress fracture, it could be postulated that use of an antiresorptive agent would diminish this risk. However, it is likely that mechanical loading results in microdamage to bone, and that an increase in remodeling activity is an obligatory step in the repair of microdamage. In this scenario, use of antiresorptive agents could result in an accumulation of microdamage and an increased, rather than a decreased, risk of stress fracture.
The temporal nature of the response of bone to severe mechanical stress was evaluated by Bentolila and colleagues (1998). In their experiment, the right ulnae of rats was loaded to fatigue on day 1 and the left ulnae underwent the same fatigue loading on day 10; both bones were harvested immediately after the second loading session. Microcrack density was significantly higher in the acutely loaded ulnae than in the ulnae that had been stressed 10 days earlier, suggesting that some healing had occurred in the intervening period. However, bone resorption activity was evident only in the bones that had been stressed 10 days earlier and tended to be concentrated in regions of microcracks. Three-quarters of all microcracks were associated with resorption spaces, but resorption spaces were also visualized in regions of bone in which there was no detectable matrix damage. This suggests that resorptive activity was initiated as part of the normal remodeling response to mechanical stress (in undamaged regions) and also to repair areas of microdamage. Thus, it seems plausible that the degree of activation of bone resorption and the extent of transient bone loss depends on the severity of the mechanical stress and the extent of damage that it causes.
The notion that inhibiting bone remodeling could lead to an accumulation of microdamage and increased bone fragility has been studied in animals using bisphosphonate therapy (Hirano et al., 2000; Mashiba et al., 2001a, 2001b). One year of etidronate therapy at a dose 100 times higher than the recommended clinical dose in humans resulted in increased osteoid volume and a high incidence of spontaneous fractures. At a dose 10 times the clinical dose, there was evidence of microdamage accumulation, but no significant increase in spontaneous fractures. The relevance of these findings to the concept of using antiresorp-
tive therapy to prevent stress fractures remains uncertain. It will be important to determine the effects of lower doses of bisphosphonates and other antiresorptive agents and to specifically evaluate the effects on bone microdamage and fragility under conditions of increased mechanical stress.
DEVELOPMENT OF STRESS FRACTURES—OTHER PHYSIOLOGICAL FACTORS
The fact that stress fractures develop in only a few weeks in response to an increase in mechanical loading is temporally consistent with the hypothesis that an increase in bone resorption triggers a decrease in bone mass that transiently increases the vulnerability of bone to fracture. In this context, other physiological factors that may further exaggerate bone resorption or impair the coupling with subsequent bone formation activity should be considered. The following discussion is not meant to be an exhaustive list of possible factors, but rather an overview of a few factors that can be influenced by vigorous exercise training and are known to affect bone metabolism.
Sex Hormones
Both estradiol and testosterone have potent effects on bone metabolism (Riggs et al., 2002), and levels of these sex hormones have been reported to be decreased in highly trained athletes (Laughlin et al., 1998; Roberts et al., 1993). There is emerging evidence that it is low energy availability during vigorous training, rather than the exercise per se, that causes this hormonal dysregulation, at least in women (Loucks, 2001; Loucks and Thuma, 2003). Whatever the cause, if estradiol levels decrease during vigorous exercise training, this would be expected to stimulate an increase in bone resorption, because even normal fluctuations in estradiol across the menstrual cycle are inversely associated with bone resorption rate (Chiu et al., 1999). There have been few studies of bone metabolism and testosterone levels in young male athletes, but the suppression of androgens in men results in a dramatic increase in the rate of bone resorption (Stoch et al., 2001). Because estradiol appears to play a more important role than testosterone in maintaining bone mass in men, it is important to note that reductions in serum testosterone in men will be accompanied by reductions in estradiol because the primary source of estradiol in men is the aromatization of testosterone (Riggs et al., 2002).
Sex hormones have independent effects on bone metabolism, but they may also influence risk for stress fracture through other mechanisms. Recent studies have found an increase in apoptosis of rat (Tomkinson et al., 1998) and human (Tomkinson et al., 1997) osteocytes in response to estrogen withdrawal. The investigators suggested that, because the capacity of bone to repair microdamage and to modulate the effects of mechanical strain may be dependent on osteocyte viability, this could be a mechanism by which estrogen deficiency leads to bone
fragility. It has also been demonstrated that estrogen receptor alpha is involved in generating the bone response to mechanical stress (Cheng et al., 2002; Damien et al., 2000), and that the combined effects of estradiol and mechanical stress on bone formation activity are additive or synergistic (Cheng et al., 1997; Kohrt et al., 1995). Thus, the effectiveness of mechanical loading to favorably affect bone metabolism may be diminished in the estrogen-deficient state or when estrogen receptor function is alerted.
Glucocorticoids
The physical and psychological stresses of basic training and survival training can increase the secretion of stress hormones, including cortisol (Hellhammer et al., 1997; Morgan et al., 2002), which has a potent, negative effect on bone. With respect to direct actions on bone metabolism, cortisol both increases bone resorption, by stimulating osteoclastogenesis and inhibits bone formation, by inhibiting osteoblastic cell replication and differentiation and increasing apoptosis of mature osteoblasts (Canalis and Delany, 2002). Cortisol may also influence bone metabolism through indirect actions (Manelli and Giustina, 2000). Glucocorticoids have been found to decrease calcium absorption, modify vitamin D metabolism, and inhibit activity of both the gonadotropic and the somatotropic axis.
Growth Hormone and IGF-1
Growth hormone and growth factors such as IGF-1 have potent and complex effects on bone metabolism (Rosen and Donahue, 1998). The effects of physical stress to suppress the somatotropic axis and the potential adverse consequences on bone metabolism were presented by other participants in the workshop (Nindl and Rosen, respectively) and are reviewed elsewhere in this publication.
Use of Nonsteroidal Anti-inflammatory Drugs
The use of nonsteroidal anti-inflammatory drugs (NSAIDs) is known to impair fracture healing (Simon et al., 2002). In animal models, NSAIDs also impair the bone formation response to mechanical loading (Cheng et al., 1997; Chow and Chambers, 1994). The likely mechanism of this action is the inhibition by NSAIDs of cyclooxygenase activity, which catalyzes the conversion of arachidonate to prostanoids. Prostaglandin E2 has been identified as an important signaling factor in mechanotransduction in bone (Chow, 2000) and has been found to increase in response to mechanical loading in humans (Thorsen et al., 1996). Currently, there are no controlled studies of the potential adverse effects of NSAIDs on the bone formation response to mechanical stress in humans. However, the compelling findings from animal studies suggest that attention
should be directed to this issue, particularly since NSAID use is likely to be increased during periods of vigorous physical activity.
POTENTIAL BIOMARKERS FOR THE DEVELOPMENT OF STRESS FRACTURES
Based on the discussion above, potential biomarkers to predict the development of stress fractures could fall within three general categories: mechanical stress, bone metabolism, and physiological factors.
Biomarkers of Mechanical Stress
Although it is unlikely that stress fractures develop solely as a result of mechanical loading, the extent of mechanical stress may influence other predictors of stress fracture. The number of loading cycles is thought to be of less importance than the stress magnitude, which could potentially be monitored by load sensors in the shoes. However, of even greater importance would be the ability to monitor the bone response to mechanical stress, that is, strain. Strain gauges positioned on regions of bone prone to stress fracture (e.g., anterior tibia) could potentially measure strain magnitude and strain rate, since both are important determinants of the bone remodeling response. Because bone is weaker in shear than in compression, it may be particularly important to monitor shear strain. A more futuristic goal would be the early detection of microdamage in bone. The development of such methodologies as vibration analysis, ultrasound, or peripheral quantitative computed tomography for this purpose should be considered.
Biomarkers of Bone Metabolism
If the concept put forth above is correct, that an exaggerated increase in bone resorption in response to multiple stimuli increases the vulnerability of bone to fracture, it will be very important to monitor markers of bone resorption and formation. However, the methodologies currently available measure these markers in serum or urine, which reflect whole-body bone metabolism and are not likely to be useful in identifying the targeted changes in bone remodeling that occur in response to localized strain and microdamage. Methodologies to measure local changes in markers of resorption and formation are not currently available.
Other Physiological Factors as Biomarkers
The identification of appropriate physiological factors that predict the development of stress fractures will depend on extending the current state of knowledge of the mechanisms for the pathogenesis of stress fractures in humans. Candidate markers that are likely to be important include those that change in
response to vigorous physical training and have potent effects on bone metabolism, such as estradiol and cortisol.
Currently, the signaling pathway by which mechanical stress generates the appropriate cellular responses in bone remains poorly defined. It will be important to promote research directed toward furthering our understanding of the cellular mechanisms of mechanotransduction. However, it will be equally important to support clinical research that evaluates these mechanisms in humans using applied, integrative approaches to determine the relative importance in maintaining bone health. For example, prostaglandin E2 has been found to play a critical role in the bone formation response to mechanical stress in both isolated cell and in vivo animal models, and the response is abrogated by NSAIDs. Despite the widespread use of NSAIDs by humans, particularly in conjunction with exercise training, there is no knowledge of the potential adverse effects on bone metabolism. Because it is likely that risk for stress fractures is multifactorial, involving both localized parameters of strain and bone metabolism and systemic hormonal modulators of bone metabolism, understanding the pathophysiology of stress fracture development in humans will likely require collaborative research that considers these factors in an integrative fashion.
The authors are supported by National Institutes of Health research awards AG18198 and AG18857 and U.S. Army Medical Research and Materiel Command award DAMD17–01–1–0805.
REFERENCES
Bentolila V, Boyce TM, Fyhrie DP, Drumb R, Skerry TM, Schaffler MB. 1998. Intracortical remodeling in adult rat long bones after fatigue loading. Bone 23:275–281.
Bergmann G, Graichen F, Rohlmann A. 1993. Hip joint loading during walking and running, measured in two patients. J Biomech 26:969–990.
Bergmann G, Graichen F, Rohlmann A. 1995. Is staircase walking a risk for the fixation of hip implants? J Biomech 28:535–553.
Burr DB. 1993. Remodeling and the repair of fatigue damage. Calcif Tissue Int 53:S75-S80.
Burr DB. 1997. Bone, exercise, and stress fractures. Exerc Sport Sci Rev 25:171–194.
Burr DB, Milgrom C, Boyd RD, Higgins WL, Robin G, Radin EL. 1990. Experimental stress fractures of the tibia. Biological and mechanical aetiology in rabbits. J Bone Joint Surg Br 72:370–375.
Burr DB, Forwood MR, Fyhrie DP, Martin RB, Schaffler MB, Turner CH. 1997. Bone microdamage and skeletal fragility in osteoporotic and stress fractures. J Bone Miner Res 12:6–15.
Canalis E, Delany AM. 2002. Mechanisms of glucocorticoid action in bone. Ann N Y Acad Sci 966:73–81.
Cheng MZ, Zaman G, Rawlinson SC, Pitsillides AA, Suswillo RF, Lanyon LE. 1997. Enhancement by sex hormones of the osteoregulatory effects of mechanical loading and prostaglandins in explants of rat ulnae. J Bone Miner Res 12:1424–1430.
Cheng MZ, Rawlinson SC, Pitsillides AA, Zaman G, Mohan S, Baylink DJ, Lanyon LE. 2002. Human osteoblasts’ proliferative responses to strain and 17beta-estradiol are mediated by the estrogen receptor and the receptor for insulin-like growth factor I. J Bone Miner Res 17:593–602.
Chiu KM, Ju J, Mayes D, Bacchetti P, Weitz S, Arnaud CD. 1999. Changes in bone resorption during the menstrual cycle. J Bone Miner Res 14:609–615.
Chow JW. 2000. Role of nitric oxide and prostaglandins in the bone formation response to mechanical loading. Exerc Sports Sci Rev 28:185–188.
Chow JW, Chambers TJ. 1994. Indomethacin has distinct early and late actions on bone formation induced by mechanical stimulation. Am J Physiol 267:E287-E292.
Christina KA, White SC, Gilchrist LA. 2001. Effect of localized muscle fatigue on vertical ground reaction forces and ankle joint motion during running. Hum Mov Sci 20:257–276.
Damien E, Price JS, Lanyon LE. 2000. Mechanical strain stimulates osteoblast proliferation through the estrogen receptor in males as well as females. J Bone Miner Res 15:2169–2177.
Hellhammer DH, Buchtal J, Gutberlet I, Kirschbaum C. 1997. Social hierarchy and adrenocortical stress reactivity in men. Psychoneuroendocrinology 22:643–650.
Hirano T, Turner CH, Forwood MR, Johnston CC, Burr DB. 2000. Does suppression of bone turnover impair mechanical properties by allowing microdamage accumulation? Bone 27:13–20.
Kohrt WM, Snead DB, Slatopolsky E, Birge SJ Jr. 1995. Additive effects of weight-bearing exercise and estrogen on bone mineral density in older women. J Bone Miner Res 10:1303–1311.
Lappe JM, Stegman MR, Recker RR. 2001. The impact of lifestyle factors on stress fractures in female Army recruits. Osteoporos Int 12:35–42.
Laughlin GA, Dominguez CE, Yen SS. 1998. Nutritional and endocrine-metabolic aberrations in women with functional hypothalamic amenorrhea. J Clin Endocrinol Metab 83:25–32.
Loucks AB. 2001. Physical health of the female athlete: Observations, effects, and causes of reproductive disorders. Can J Appl Physiol 26 :S176-S185.
Loucks AB, Thuma JR. 2003. Luteinizing hormone pulsatility is disrupted at a threshold of energy availability in regularly menstruating women. J Clin Endocrinol Metab 88:297–311.
Manelli F, Giustina A. 2000. Glucocorticoid-induced osteoporosis. Trends Endocrinol Metab 11:79–85.
Mashiba T, Turner CH, Hirano T, Forwood MR, Jacob DS, Johnston CC, Burr DB. 2001a. Effects of high-dose etidronate treatment on microdamage ac-
cumulation and biomechanical properties in beagle bone before occurrence of spontaneous fractures. Bone 29:271–278.
Mashiba T, Turner CH, Hirano T, Forwood MR, Johnston CC, Burr DB. 2001b. Effects of suppressed bone turnover by bisphosphonates on microdamage accumulation and biomechanical properties in clinically relevant skeletal sites in beagles. Bone 28:524–531.
Milgrom C, Finestone A, Levi Y, Simkin A, Ekenman I, Mendelson S, Millgram M, Nyska M, Benjuya N, Burr D. 2000. Do high impact exercises produce higher tibial strains than running? Br J Sports Med 34:195–199.
Morgan CA III, Rasmusson AM, Wang S, Hoyt G, Hauger RL, Hazlett G. 2002. Neuropeptide-Y, cortisol, and subjective distress in humans exposed to acute stress: Replication and extension of previous report. Biol Psychiatry 52:136–142.
Riggs BL, Khosla S, Melton LJ III. 2002. Sex steroids and the construction and conservation of the adult skeleton. Endocr Rev 23:279–302.
Roberts AC, McClure RD, Weiner RI, Brooks GA. 1993. Overtraining affects male reproductive status. Fertil Steril 60:686–692.
Rosen CJ, Donahue LR. 1998. Insulin-like growth factors and bone: The osteoporosis connection revisited. Soc Exp Biol Med 219:7.
Simon AM, Manigrasso MB, O’Connor JP. 2002. Cyclo-oxygenase 2 function is essential for bone fracture healing. J Bone Miner Res 17:963–976.
Stoch SA, Parker RA, Chen L, Bubley G, Koy J, Vincelette A, Greenspan SL. 2001. Bone loss in men with prostate cancer treated with gonadotropin-releasing hormone agonists. J Clin Endocrinol Metab 86:2787–2791.
Thorsen K, Kristoffersson AO, Lerner UH, Lorentzon RP. 1996. In situ microdialysis in bone tissue. Stimulation of prostaglandin E2 release by weight-bearing mechanical loading. J Clin Invest 98:2446–2449.
Tomkinson A, Reeve J, Shaw RW, Noble BS. 1997. The death of osteocytes via apoptosis accompanies estrogen withdrawal in human bone. J Clin Endocrinol Metab 82:3128–3135.
Tomkinson A, Gevers EF, Wit JM, Reeve J, Noble BS. 1998. The role of estrogen in the control of rat osteocyte apoptosis. J Bone Miner Res 13:1243–1250.
AUTONOMIC NERVOUS SYSTEM ACTIVITY AND ITS RELATIONSHIP TO ATTENTION AND WORKING MEMORY
Julian F.Thayer, National Institute on Aging; Bjorn Helge Johnsen, University of Bergen
In this paper we describe a model of neurovisceral integration in which a set of neural structures involved in cognitive, affective, and autonomic regulation are related to heart rate variability (HRV) and cognitive performance. Neural network studies in humans have reported increased activity in the prefrontal cortex during tasks involving executive function and working memory (Goldman-Rakic, 1998). Compte and colleagues (2000) have proposed that the prefrontal cortex holds sensory information temporarily online through sustained activity. This continued activation of a neural network is essential for the linking of “input” with “output” to achieve flexible responding to changing environments. As such, optimal prefrontal functioning is necessary for the formation of associations and the representation of acquired relationships between disparate pieces of information, including information separated in time (Miller, 2000). In addition, these cortical regions are implicated in inhibitory functions that are known to be critical for the performance of executive function tasks. Relatedly, performance on working memory tasks have been reported to be significantly related to general intelligence as indexed by standard intelligence quotient tests. Direct and indirect pathways by which the frontal cortex modulates parasympathetic activity via subcortical inputs have been identified (Ter Horst, 1999; Ter Horst and Postema, 1997). A number of researchers have hypothesized inhibitory cortical-subcortical circuits (Benarroch, 1993, 1997; Masterman and Cummings, 1997; Mayberg et al., 1999; Spyer, 1989). However, Thayer and Lane (2000) have been the first to tie these circuits to HRV.
We will provide an overview of the neural structures linking the central nervous system to HRV. Next, we will review a number of studies from our group showing that individual differences in HRV are related to performance on tasks associated with executive function and prefrontal cortical activity. We propose that these findings have important implications for the development of biomarkers related to performance in modern warfighters.
THE CENTRAL AUTONOMIC NETWORK
Investigators have identified functional units within the central nervous system (CNS) that support goal-directed behavior and adaptability. One such entity is the central autonomic network (CAN; Benarroch, 1993, 1997). Functionally, this network is an integrated component of an internal regulation system through which the brain controls visceromotor, neuroendocrine, and behavioral responses that are critical for goal-directed behavior, adaptability, and health.
Structurally, the CAN includes the anterior cingulate, insular, orbitofrontal, and ventromedial prefrontal cortices, the central nucleus of the amygdala, the paraventricular and related nuclei of the hypothalamus, the periaquaductal gray matter, the parabrachial nucleus, the nucleus of the solitary tract, the nucleus ambiguus, the ventrolateral medulla, the ventromedial medulla, and the medullary tegmental field. These components are reciprocally interconnected such that information flows bidirectionally between lower and higher levels of the CNS. The primary output of CAN is mediated through preganglionic sympathetic and parasympathetic neurons that innervate the heart via the stellate ganglia and vagus nerve, respectively. The interplay of these inputs to the cardiac sinoatrial node produces complex variability that characterizes the heart-rate time series (Saul, 1990). Thus, the output of CAN is directly linked to HRV. Notably, vagal influences dominate cardiac chronotropic control (Levy, 1990). In addition, sensory information from peripheral end organs such as the heart and the immune system are fed back to the CAN. As such, HRV is an indicator of central-peripheral neural feedback and CNS-autonomic nervous system integration.
Other functional units within the CNS serving executive, social, affective, attentional, and motivated behavior in humans and animals have been identified (Damasio, 1998; Devinsky et al., 1995; Masterman and Cummings, 1997; Spyer, 1989). One such network has been termed the anterior executive region (AER; Devinsky et al., 1995). The AER and its projections regulate behavior by monitoring the motivational quality of internal and external stimuli. The AER network has been called the “rostral limbic system” and includes the anterior, insular, and orbitofrontal cortices, amygdala, periaquaductal gray, ventral striaturn, and autonomic brainstem motor nuclei. Damasio (1998) has recognized a similar neural “emotion circuit,” for which there is considerable structural overlap with CAN and AER (Thayer and Lane, 2000).
We propose that CAN, the AER network, Damasio’s “emotion circuit”, and related systems (Masterman and Cummings, 1997; Spyer, 1989) represent a common central functional network recognized by different researchers from diverse approaches. This CNS network is associated with the processes of response organization and selection and serves to control psychophysiological resources in attention and emotion (Friedman and Thayer, 1998a, 1998b; Thayer and Friedman, 1997). Additional structures are flexibly recruited to manage specific behavioral adaptations. This sparsely interconnected neural complex allows for maximal organism flexibility in accommodating rapidly changing environmental demands. When this network is either rigidly coupled or completely uncoupled, the ability to recruit and utilize appropriate neural support to meet a particular demand is hampered and the organism is thus less adaptive.
It has been proposed that the prefrontal cortex is taken “off-line” during emotional stress to let automatic, prepotent processes regulate behavior (Arnsten and Goldman-Rakic, 1998). This selective prefrontal inactivation may be adaptive by facilitating predominantly nonvolitional behaviors associated with sub-
cortical neural structures (e.g., the amygdala) to organize responses without delay from the more deliberative and consciously guided prefrontal cortex. In modern society, however, inhibition, delayed response, and cognitive flexibility are vital for successful adjustment and self-regulation, and prolonged prefrontal inactivity can lead to hypervigilance, defensiveness, and preservation.
ATTENTIONAL REGULATION AND EXECUTIVE FUNCTION
Attentional regulation and the ability to inhibit prepotent but inappropriate responses is also important for health and optimal performance in a complex environment. Many tasks important for survival in today’s world involve cognitive functions such as working memory, sustained attention, behavioral inhibition, and general mental flexibility. These tasks are all associated with prefrontal cortex activity (Arnsten and Goldman-Rakic, 1998). Deficits in these cognitive functions tend to accompany aging and are also present in negative affective states and dispositions such as depression and anxiety. Stress can also impair cognitive function and may contribute to the cognitive deficits observed in various mental disorders and in extreme environments. It is also possible that autonomic dysregulation contributes to deficits in attention and cognitive performance. A series of experiments in our lab have been conducted to examine this issue and are described below.
In a recent experiment, Johnsen and colleagues (2003) examined inhibitory responses in an emotional Stroop paradigm. Dental phobics were first exposed to recorded scenes of dental procedures and then administered the emotional Stroop test. In addition to the traditional color congruent and color incongruent words, phobic subjects also were asked to respond to neutral words and dental-related words (e.g., drill and cavity) that were threatening to them. All subjects exhibited longer reaction times to the incongruent color words and the dental-related threat words and, thus, displayed a difficulty in inhibiting prepotent responses. However, greater HRV was associated with faster reaction times to these words, consistent with the link among vagally mediated HRV, inhibitory ability, and frontal lobe function. These results support the idea that vagally mediated HRV is associated with efficient attentional regulation and greater ability to inhibit prepotent but inappropriate responses.
Subsequent studies further examined executive function and working memory in healthy individuals in a military context. In the first experiment, subjects performed a number of tasks involving continuous performance, including a simple reaction-time task, a choice reaction-time task, and three tasks that involved delayed responding and working memory (Hansen et al., 2003; Johnsen et al., 2002). The California Computerized Assessment Package Abbreviated version, (CalCAP; Norland Software, Los Angeles, California; Miller, 1999) was chosen as a continuous performance task. CalCAP is recognized as a test of sustained attention and consists of four subtests, two with nonexecutive compo-
nents (simple reaction time and response latencies to specific stimuli components) and two with executive components (detection of identical stimuli and a simple addition task). The test was self-explanatory and needed only minimal supervision by the investigator. In addition, a modified version of a working memory test developed by Hugdahl and colleagues (2000), based on Baddeley and Hitch’s research (1974), was chosen. This test consisted of a continuous flow of digits and subjects were to detect identical digits to the one presented two trials previously. The stimuli were numbers from one to nine. These latter three tasks involved aspects of delayed responding and working memory and have been shown to be associated with prefrontal activity (Goldman-Rakic, 1998). HRV and cortisol responses were recorded, and subjects were grouped into low- and high-HRV groups.
Performance on tasks involving simple and choice reaction times did not differ between these groups. However, on tasks associated with prefrontal activity, subjects in the low-HRV group performed more poorly in terms of reaction time, number of errors, and number of correct responses than those in the high-HRV group. In addition, the groups did not differ in baseline, morning, or evening cortisol, but the low-HRV group showed larger cortisol responses to cognitive tasks that lasted into the post-task recovery period. Stress is associated with an increased cortisol release, and cortisol plays a major role in immune function through its association with proinflammatory cytokines (Kiecolt-Glaser et al., 2002). Cortisol is also known to impair function on cognitive tasks associated with the prefrontal cortex (Lupien et al., 1999). Thus, the low-HRV group was less stress tolerant as indexed by cortisol responses and more impaired cognitively than the high-HRV group.
In another study in the series, military subjects performed the same tasks as above, but half did so under threat of electric shock (Hansen et al., 2002). Again, subjects were divided into two groups based on resting HRV levels. In the shock threat condition, task performance involving delayed responding and prefrontal activity was significantly impaired in the low-HRV group. Thus, persons with high HRV were more stress tolerant and less affected by the threat compared with those with low HRV. In yet another study, HRV was manipulated by having half of the subjects in a physically active group undergo mild detraining for four weeks. Aerobic capacity and HRV were significantly reduced in this group compared with those that maintained their fitness and HRV levels. All subjects again performed the above cognitive tasks: once before the four-week detraining period and once after. The detrained, low-HRV group failed to show the expected learning effect associated with repeated performance of the cognitive tasks and, thus, did not reap the typical benefit of previous task exposure.
CONCLUSIONS
Taken together, these results support the use of HRV to index efficient allocation of attentional and cognitive resources needed for efficient functioning in a
challenging environment in which delayed responding and behavioral inhibition are key. In addition, these data show that low HRV marks increased risk to stress exposure. Significantly, these results provide a connection among stress-related cognitive deficits, high negative affect, and negative health consequences via the common mechanism of autonomic imbalance and low parasympathetic activity.
REFERENCES
Arnsten AFT, Goldman-Rakic PS. 1998. Noise stress impairs prefrontal cortical cognitive function in monkeys: Evidence for a hyperdopaminergic mechanism. Arch Gen Psychiatry 55:362–368.
Baddeley AD, Hitch G. 1974. Working memory. In: Bower GA, ed. The Psychology of Learning and Motivation, vol. 8. New York: Academic Press. Pp. 47–89.
Benarroch EE. 1993. The central autonomic network: Functional organization, dysfunction, and perspective. Mayo Clin Proc 68:988–1001.
Benarroch EE. 1997. The central autonomic network. In: Low PA, ed. Clinical Autonomic Disorders. 2nd ed. Philadelphia: Lippincott-Raven. Pp. 17–23.
Compte A, Brunel N, Goldman-Rakic PS, Wang XJ. 2000. Synaptic mechanisms and network dynamics underlying spatial working memory in a cortical network model. Cereb Cortex 10:910–923.
Damasio AR. 1998. Emotion in the perspective of an integrated nervous system. Brain Res Rev 26:83–86.
Devinsky O, Morrell MJ, Vogt BA. 1995. Contributions of anterior cingulate cortex to behavior. Brain 18:279–306.
Friedman BH, Thayer JF. 1998a. Anxiety and autonomic flexibility: A cardiovascular approach. Biol Psychol 49:303–323.
Friedman BH, Thayer JF. 1998b. Autonomic balance revisited: Panic anxiety and heart rate variability. J Psychosom Res 44:133–151.
Goldman-Rakic PS. 1998. The prefrontal landscape: Implications of functional architecture for understanding human mentation and the entral executive. In: Roberts AC, Robbins TW, Weiskrantz L, eds. The Prefrontal Cortex: Executive and Cognitive Function. Oxford: Oxford University Press. Pp. 87–102.
Hansen AL, Johnsen BH, Sellers JJ, Thayer JF. 2002. Neural control of the heart modulates cognitive processing during stress. Clin Auton Res 12:167.
Hansen AL, Johnsen BH, Thayer JF. 2003. Vagal influence on working memory and attention. Int J Psychophysiol 48:263–274.
Hugdahl K, Thomsen T, Landrø NI, Ersland L, Smievoll AI, Lundervold A, Barndon R, Sundberg H, Iversen JK, Roscher B. 2000. Separating mental arithmetic from working memory: A fMRI-study. Neuroimage 11:384.
Johnsen BH, Hansen AL, Sellers JJ, Murison R, Thayer JF. 2002. Heart rate variability is inversely associated with cortisol reactivity. Psychosom Med 64:128.
Johnsen BH, Thayer JF, Laberg JC, Wormnes B, Raadal M, Skaret E, Kvale G, Berg E. 2003. Attentional and physiological characteristics of patients with dental anxiety. J Anxiety Disord 17:75–87.
Kiecolt-Glaser JK, McGuire L, Robles TF, Glaser R. 2002. Emotions, morbidity, and mortality: New perspectives from psychoneuroimmunology. Ann Rev Psychol 53:83–107.
Levy MN. 1990. Autonomic interactions in cardiac control. Annals N Y Acad Sci 601:209–221.
Lupien SJ, Gillin CJ, Hauger RL. 1999. Working memory is more sensitive than declarative memory to the acute effects of corticosteroids: A dose-response study in humans. Behav Neurosci 113:420–430.
Masterman DL, Cummings JL. 1997. Frontal-subcortical circuits: The anatomical basis of executive, social and motivated behaviors. J Psychopharmacol 11:107–114.
Mayberg HS, Liotti M, Brannan SK, McGinnis S, Mahurin RK, Jerabek PA, Silva JA, Tekell JL, Martin CC, Lancaster JL, Fox PT. 1999. Reciprocal limbic-cortical function and negative mood: Converging PET findings in depression and normal sadness. Am J Psychiatry 156:675–682.
Miller EK. 2000. The prefrontal cortex and cognitive control. Nature Rev 1:59–65.
Miller EN. 1999. CalCAP. California Computerized Assessment Package Manual 2nd ed. Los Angeles: Norland Software.
Saul JP. 1990. Beat-to-beat variations of heart rate reflect modulation of cardiac autonomic outflow. News Physiol Sci 5:32–37.
Spyer KM. 1989. Neural mechanisms involved in cardiovascular control during affective behavior. Trends Neurosci 12:506–513.
Ter Horst GJ. 1999. Central autonomic control of the heart, angina, and pathogenic mechanisms of post-myocardial infarction depression. Eur J Morphol 37:257–266.
Ter Horst GJ, Postema F. 1997. Forebrain parasympathetic control of heart activity: Retrograde transneuronal viral labeling in rats. Am J Physiol 273:H2926-H2930.
Thayer JF, Friedman BH. 1997. The heart of anxiety: A dynamical systems approach. In: Vingerhoets A, ed. The (Non)Expression of Emotions in Health and Disease. Amsterdam: Springer Verlag.
Thayer JF, Lane RD. 2000. A model of neurovisceral integration in emotion regulation and dysregulation. J Affect Disord 61:201–216.
SWEAT PATCH AS A NOVEL APPROACH TO MONITOR THE LEVEL OF ACTIVITY OF THE STRESS SYSTEM: POTENTIAL APPLICATION FOR STUDIES CONDUCTED IN THE FIELD
Giovanni Cizza, National Institute of Mental Health; Farideh Eskandari, National Institute of Mental Health; Terry Phillips, National Institutes of Health; Esther M.Sternberg, National Institute of Mental Health
THE STRESS SYSTEM: GENERAL CHARACTERISTICS
The stress system has evolved to maintain homeostasis in response to disruptive internal or external stimuli (Chrousos et al., 1995). A highly conserved system, the stress system is represented in lower species and has a central as well as a peripheral component. The central component involves several areas in the central nervous system, including the paraventricular nucleus of the hypothalamus, the main source of corticotrophin-releasing-hormone (CRH); the locus coeruleus, the main source of catecholamines; and the prefrontal cortex, the cortical coordinating center. The afferent limbs of the stress system include the pituitary-adrenal axis with its main effector molecule, cortisol, and the sympathoadrenal system with its two main effectors, the catecholamines norepinephrine and epinephrine, produced by the sympathetic terminal nerves and by the adrenal medullary gland, respectively.
These effectors of the stress system regulate a highly coordinated response aimed at mobilizing energy, increasing arousal, and restoration of homeostasis in the face of threatening stimuli. Other endocrine systems, including the growth hormone/insulin-like growth factor-1 (GH/IGF-1) and the reproductive and the thyroid hormone axes are inhibited by the stress. During acute and chronic stress, complex alterations of the immune system also take place, which result in a switching from a cellular immune pattern of response to a humoral response (T-helper 1 to T-helper 2) (Chrousos and Elenkov, 2000). Such a coordinated series of responses is essential to survival. A complex network of inhibitory feed-back loops within and among the above components of the stress system has evolved to ensure that the stress response is effective, but contained.
The Stress Response: Specific or Nonspecific?
Initially, the stress response was thought to be homogeneous in response and independent of the nature of the perturbatory challenge, a concept originally formulated by Hans Selye and known as the doctrine of the nonspecificity of the stress response. More recently, it is being recognized that different stressful stimuli may elicit different patterns of stress responses. In addition, there is growing evidence suggesting that genetic variability, as well as differences in
experiences during the first years of life, or even during intrauterine life, may “imprint” the stress responsivity of any given individual in a stable fashion. A corollary of the specificity of the stress response is that different stressful stimuli, if protracted and/or severe enough, are associated with different diseases.
The Stress System: Theoretical and Practical Challenges in Monitoring Its Activity in Vivo
There are several challenges to measuring the levels of activity of the stress system (Eskandari and Cizza, 2002): (a) the complexity of the system and the multiplicity of the effector molecules to be measured, (b) the methodology used to measure the activity of the stress system must not perturb the system, (c) the intrinsic variability of several hormones due to their circadian rhythmicity, (d) the importance of measuring stress reactivity, as well as baseline stress response measures, and (e) for studies conducted in the field, the feasibility of collecting integrated measures without using large volumes of blood or other biological samples.
The approaches currently used to measure the activity of the stress system in field studies originally evolved from the approaches used to measure the activity of the hypothalamic-pituitary-adrenal axis in selected categories of patients, including patients with hyperactivity of the stress system such as those with Cushing’s disease, with a major depression, or with a rare tumor of the adrenal gland, the pheochromocytoma (Cizza and Chrousos, 1997). The clinical methods used in these cases involve measurements of the relevant circulating hormones during both basal and stimulated conditions, and often, given the diurnal rhythmicity of these hormones, around the clock measurements. Biological fluids collected in clinical settings include blood and sometimes cerebrospinal fluid or hypophysial portal blood for specific research purposes; more frequently, in an outpatient setting urine or saliva are collected. However, in the field it would be necessary to collect biological fluids in a noninvasive manner with a nonbulky collection apparatus, minimal discomfort, and cooperation from the subject. The purpose of this paper is to provide support for the sweat patch method (in which sweat collected by means of a commercially available, cutaneously applied patch) as a viable option for monitoring indices of stress system activity in the field.
Biology of the Stress Response and Bone Mass
An example of a serious medical consequence resulting from chronic stress is osteoporosis. Bone loss and fractures are often observed as a consequence of hypercortisolism resulting from endogenous Cushing’s syndrome or the chronic use of steroids (Cizza et al., 1996). It is becoming more evident that subjects suffering from major depression also exhibit bone loss likely due to
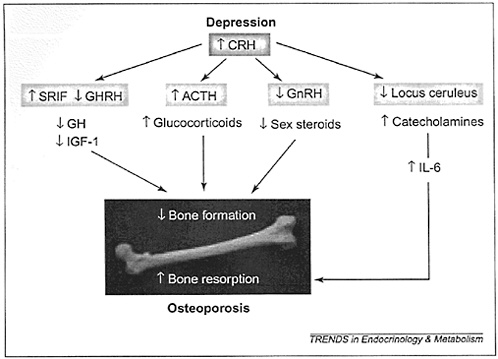
FIGURE D-33 The proposed endocrine mechanisms contributing to bone loss in subjects suffering from despression.
SOURCE: Reprinted from Cizza et al. (2001), with permission from Elsevier.
hypercortisolism (Figure D-33) (Cizza et al., 2001). CRH hypersecretion and hypercortisolism in turn lead to the inhibition of the reproductive axis and hypogonadism. The latter is an established risk factor for bone loss in both genders. CRH hypersecretion and hypercortisolism also decrease the activity of the GH-IGF-1 axis, an important enhancer of bone formation. In depression, a dysregulation of several inflammatory mediators, including interleukin-6, has also been reported. Interleukin-6, a major mediator of bone resorption, is elevated in depressed subjects, especially at an older age. Increased sympathetic activity, often observed in depressed subjects, also is associated with increased inter-leukin-6 secretion. This cytokine may be implicated in some of the other medical consequences of major depression, such as cardiovascular disease and insulin resistance.
Stress fractures are often observed in young military recruits of both genders during intense military training or operations (Imeida et al., 1999). In addition to the obvious physical component of mechanical overload associated with marching for a long period time with heavy loads, it is reasonable to hypothesize that some of the endocrine responses associated with the psychological stress may accelerate bone resorption and decrease bone formation. Specifically, an increase in cortisol and a decrease in IGF-1 (an important contributor to skeletal
integrity) may, with mechanical overload, synergistically decrease bone mass at specific skeletal sites below the threshold for fractures (Munoz-Torres et al., 2001). Stress fractures are a common problem in young people who engage in vigorous physical activity, especially endurance training. For example, stress fractures during basic training occur in approximately 7 percent of male and 14 percent of female recruits. It is therefore important to identify subjects at greater risk; known risk factors include low level of physical fitness, current or past history of smoking, more than ten alcoholic beverages per week, use of corticosteroids, and low body weight. In women, additional factors include amenorrhea, delayed menarche, and use of depo-medroxyprogesterone acetate. In young men, low levels of testosterone, a hormone with an anabolic effect on bone, in a hypogonadal range are reported during intense training. To the best of our knowledge, there are no studies addressing the potential association between patterns of the individual stress response and subsequent risk of stress fractures, most likely because of the lack of a feasible method to measure the stress response in the field in an integrated fashion.
SWEAT: BACKGROUND AND PHYSIOLOGY
Summarized below is information supporting the notion that sweat may represent a biological fluid from which it is feasible to measure endogenous substances released during stress in ambulatory or field situations (Guyton, 2000). In humans, three types of sweat glands are present. Apocrine sweat glands are largely confined to the axillary and perineal regions and their ducts open directly into hair follicles. The apoeccrine sweat glands are present in adult axillae. They develop from eccrine-like precursor glands and their ducts open directly onto the skin surface. The eccrine sweat glands are distributed over the entire body. Generalized eccrine sweating is the physiological response to an increased body temperature. This is the most effective means by which humans regulate their body temperature through evaporative heat loss.
The eccrine sweat glands develop from the epidermal ridge as a cord of epithelial cells growing downward. These glands are stimulated by the cholinergic sympathetic nervous system. The preoptic hypothalamic area plays an essential role in regulating body temperature. Efferent nerve fibers originating from the hypothalamic preoptic sweat center descend through the ipsilateral brain stem and synapse in the intermediolateral cell columns of the spinal cord without crossing. The myelinated axons rising from the intermediolateral horn of the spinal cord (preganglionic fibers) pass through the anterior roots to reach the sympathetic chain and synapse. Unmyelinated, postganglionic sympathetic class C fibers arising from sympathetic ganglions join the major peripheral nerves and end around the sweat glands. The major neurotransmitter released from the periglandular nerve endings is acetylcholine. In addition, adenosine triphosphate, catecholamine, vasoactive intestinal peptide, natriuretic peptide, calci-
tonin gene-related peptide, and galanin have been localized in the periglandular nerves.
The eccrine sweat gland consists of two segments: a secretory coil and a duct. The secretory coil secretes an ultrafiltrate of plasma-like fluid called the primary secretion. The concentration of sodium is about 142 mmol/L and chloride about 104 mmol/L, with much smaller concentrations of the other solutes of plasma. In addition, sweat glands excrete heavy metals, organic compounds, and macromolecules. As this precursor solution flows through the duct portion of the gland, it is modified by reabsorption of most of the sodium and chloride ions. This reduces the osmotic pressure of the sweat fluid to such a low level that most of the water is then also reabsorbed. The degree of this reabsorption depends on the rate of sweating. When the sweat glands are stimulated only slightly, the primary secretion passes through the duct slowly and essentially all the sodium and chloride ions are reabsorbed. The concentration of each of these falls to as low as 5 mmol/L, followed by reabsorption of water, which concentrates most of the other constituents. Conversely, when the sweat glands are strongly stimulated by the sympathetic nervous system, large amounts of primary secretions are formed and the concentrations of the sodium and chloride ions are then at a maximum of about 50 to 60 mmol/L and little of the water is reabsorbed.
Content of Human Sweat in Hormones or Cytokines
Several studies have been reported using skin biopsy specimens or sweat specimens collected over an oil barrier on a plastic film or in a polypropylene sack. Traditionally, sweat is collected after exercise or exposure to intense heat. Interleukin (IL)-1 and IL-1β, IL-6, IL-8, and tumor necrosis factor have been identified in human sweat. Interestingly, to the best of our knowledge, there are no published reports on the presence of cortisol or catecholamines in sweat in humans.
Why the Sweat Patch?
We propose to use a cutaneous patch as a convenient and noninvasive technique that may overcome several of the limitations intrinsic to blood and urine collection. Such a technique would have the advantage of being noninvasive, of being easily applied at any time of the day, and of being worn for an extended period of time with minimal discomfort. A series of biochemical markers of bone turnover, cytokines, and neurohormones may be measured in microliters of specimen, using state-of-the art technologies, such as recycling immunoaffinity chromatography and cytokine chip technology. These techniques require a minimum amount of biological sample, thus overcoming the need for collection of large volumes of blood. Once validated, the cutaneous patch, in conjunction with an ultramicro analytical immunochemistry method, should substantially
expand our ability to examine and understand the interactions between the endocrine, immune, and nervous systems and their role in stressful conditions in the field.
Current Clinical Application of the Cutaneous Patch in Diagnostic Testing
A cutaneous patch is approved by the Food and Drug Administration for qualitative detection of a variety of drugs and their metabolites, including opioids, benzodiazepines, and methamphetamines. It can also be used to measure methadone, caffeine, and nicotine. This device is commercially available under the trade name of Osteopatch and has been used for determinations of free pyridinoline cross-links in sweat. It has been validated in healthy subjects and in subjects affected by metabolic bone disease, including postmenopausal osteoporosis, and hyperparathyroidism. The Osteopatch has been used in subjects treated with estrogen replacement therapy and treated with alendronate. Sweat determinations of pyridinoline reflected true changes in bone resorption due to metabolic disease and antiresorptive treatments, indicating that these measurements were valid and accurate (Sarno et al, 1999, 2001). In addition, as pyridinoline in sweat arises from plasma, measurements of pyridinoline in this biological fluid reflect true bone resorption more closely than urine measurements.
To correct for sweat volume, determinations of potassium are performed. Potassium is consistently recovered from the patch and its secretion is reasonably well correlated with sweat volume. In contrast to sweat sodium and chloride, potassium is relatively insensitive to subject age, diet, and methods of fluid replacement (i.e., intake of water only as compared with glucose-electrolyte solution) in situations of extreme heat. The latter characteristics make this test potentially valuable for field studies.
In order to validate the reliability and sensitivity of use of the Osteopatch for collection of stress, neuroendocrine, and immune biomarkers in sweat, it is necessary to: (1) determine the range of stress, neuroendocrine, and immune biomarkers that can be measured in sweat and the stability of these biomarkers under various collection conditions, and (2) determine the degree to which these sweat biomarkers reflect their concentrations in other biological fluids, including blood, urine, and saliva.
METHODS
Description of the Sweat Patch: Advantages and Pitfalls
The transdermal diagnostic skin patch is a device that provides easy, noninvasive, reliable and relatively nonvariable access to body sweat. The patch is a nonocclusive sweat collection device. It consists of an adhesive layer on a thin transparent film of surgical dressing with a cellulose-absorbent pad attached. The patch passively collects and concentrates nonaqueous components of sweat.
The outside surface of the patch forms a barrier for substances in the environment. The potential disadvantage of the nonocclusive design is that the volume of the secreted sweat is not measurable and, thus, the concentrations of analytes cannot be normalized to sweat volume. This limitation may be overcome by normalizing against potassium measurements. The patch can be worn over an extended period of time (usually a few days) and is reported by the manufacturer as being well tolerated. However, we propose to limit its application to a period of time not longer than 24 hours. In our limited experience we have observed no adverse reaction with the exception of one subject, a 36-year-old female normal volunteer who, 6 months after the application of a patch, had an area of discoloration on the abdomen in the area in which the adhesive part of the patch had been applied.
Analytical Procedures
Two major challenges are encountered from an analytical perspective when measuring biological analytes in sweat: (1) the available assays are not sufficiently sensitive to detect some analytes, and (2) there may not be sufficient volume to perform all the measurements needed. The application of newer technologies, including recycling immunoaffinity chromatography and the cytokine chip technology, described below, should address both challenges (Brown et al., 2000; Phillips et al., 1997).
Recycling Immunoaffinity Chromatography
Specimens can be analyzed for cytokines, hormones, biochemical markers of bone turn-over, or any other substance of interest using a 25-μL sample injected into a modified liquid chromatography system, equipped with a panel of 25 to 30 immunoaffinity columns packed with antibody-coated glass beads. The specimen passes through the columns in a serpentine fashion, each column extracting a single analyte, while allowing the nonreactive materials to pass to the next column. The bound analytes are measured by sequential acid elution of each column, followed by laser-induced fluorescence detection. Concentrations of each recovered analyte is calculated by comparing them with standard curves constructed by running known amounts of pure analyte through identical conditions.
Cytokine Chip Technology
Glass chips are constructed by covalently immobilizing 200 nL spots of avidin to the glass surface via a robotics system. The chips are heat annealed, washed in 0.01 M phosphate buffer, pH 7.4, and blocked with 0.1 percent bovine albumin. The chips are then rewashed in phosphate buffer, dried, and stored under nitrogen at −70°C. Biotinylated antibodies, directed against the analytes of
TABLE D-7 Substances Detected in Sweat Collected by the Osteopatch
|
Type |
Substance |
|
Cytokines |
Tumor necrosis factor α, interleukin (IL)-1αa, IL-1 β, IL-6, IL-8 |
|
Hormones |
Cortisol, substance P, calcitonin gene-related peptide, neuropeptide Y, β endorphin, prolactina, vasoactive intestinal peptide, angiotensin, insulin-like growth factor (IGF)-1a, growth hormone |
|
Miscellaneous compounds |
Pituitary adenyl cyclase-activating peptidea, neurotrophin-3a, transforming growth factor ß, leukemia inhibitory factora, gamma interferon-inducible protein 10a, epidermal growth factor, ciliary neutrophic factor, nerve growth factor, ß fibroblast growth factora, macrophage inflammatory protein αa |
|
a Substance that can be detected in sweat only after a 12-min walking-running test. |
|
interest, are spotted in appropriate patterns onto rehydrated chips and incubated in a moist chamber for 60 minutes at 37°C. The chips are then incubated with fluorescent-labeled specimens for 60 minutes at 37°C, washed in phosphate buffer, and read in a laboratory-built, laser-induced fluorescence reader (Instrument Development Resource, Division of Bioengineering and Physical Science, Office of Research Services, National Institutes of Health). The concentration of each analyte is calculated from calibration curves constructed by subjecting known standards to the same analytical procedure.
RESULTS
Table D-7 lists analytes that can be detected either under baseline conditions or after a brief bout of exercise in sweat collected by the means of the patch. The panel of substances that can be measured in sweat includes inflammatory cytokines such as IL-1, tumor necrosis factor-alpha, IL-6, and IL-8; neuropeptides stimulated by pain such as substance P; hormones increased during the stress response, such as cortisol or prolactin; IGF-1, an important factor for bone regeneration; and several chemokines. In addition, this device is already marketed for the measurements of several markers of bone turnover.
SUMMARY
In summary, we have collected sweat at baseline conditions and after a short course of exercise from which we measured several biomarkers, including stress hormones, neuropeptides, and cytokines, by applying ultrasensitive techniques requiring minute amounts of biological samples. Many of the analytes that we have detected in sweat have never been described in this biological fluid. As the endocrine and immune responses to stress are highly interconnected, the
ability to measure many of the molecules involved in these responses in the same sample greatly enhances the ability to more precisely define those complex interactions at an individual level. Since the Osteopatch is designed and approved for measurements of biomarkers of bone turn-over, the integration of these bone measures in sweat, together with stress hormone and immune cytokine measures that contribute to bone loss, should provide a sensitive method for detection of predictive conditions leading to deleterious effects.
In conclusion, the sweat patch provides the opportunity to conduct naturalistic studies outside of the laboratory on a very large number of subjects. Once validated in a reference population, this technique would allow for the early identification of subjects who, because of their individual physiological responses to stress, may be at greater risk during intense training of stress fractures, acute infections, or other stress-related accidents.
Conflict of Interest: None of the authors has any commercial interest in the development of the device described in this paper or in any other similar device.
REFERENCES
Brown SA, Mayberry AJ, Mathy JA, Phillips TM, Klitzman B, Levin LS. 2000. The effect of muscle flap transposition to the fracture site on TNFalpha levels during fracture healing. Plast Reconstr Surg 105:991–998.
Chrousos GP, Elenkov IJ. 2000. Interactions of the endocrine and immune system. In: De Groot L, Jameson JL, eds. Endocrinology. Philadelphia: WB Saunders. Pp. 571–586.
Chrousos GP, McCarty R, Pacak K, Cizza G, Sternberg E, Gold PW, Kvetnansky R, eds. 1995. Stress: Basic mechanism and clinical implications. Ann N Y Acad Sci 771.
Cizza G, Chrousos GP. 1997. ACTH-dependent Cushing syndrome: Clinical presentation, differential diagnosis, treatment and potential pathophysiological implications. In: Arnold A, ed. Endocrine Neoplasms Treatment and Research Series. Boston: Kluwer Academic. Pp. 25–40.
Cizza G, Nieman L, Doppman J, Czerwiek F, Passaro MD, Chrousos GP, Cutler GB. 1996. Factitious Cushing syndrome. J Clin Endocrinol Metab 81:3573–3577.
Cizza G, Ravn P, Chrousos GP, Gold PW. 2001. Depression: A major unrecognized risk factor for osteoporosis. Trend Endocrinol Metab 5:198–203.
Eskandari F, Cizza G. 2002. Cortisol, DHEA, the Holy Grail and the Fountain of Youth. J Endocrinol Invest 25:753.
Guyton AC. 2000. Body temperature, temperature regulation, and fever. In: Hall G, ed. Textbook of Medical Physiology. Philadelphia: WB Saunders. Pp. 822–823.
Imeida SA, Williams KM, Shaffer RA, Brodine SK. 1999. Epidemiological patterns of musculoskeletal injuries and physical training. Med Sci Sports Exerc 31:1176–1182.
Munoz-Torres M, Mezquita-Raya P, Lopez-Rodriguez F, Torres-Vela E, de Dios Luna J, Escobar-Jimenez F. 2001. The contribution of IGF-I to skeletal integrity in postmenopausal women. Clin Endocrinol 55:759–766.
Phillips TM, Kennedy LM, De Fabo EC. 1997. Microdialysis-immunoaffinity capillary electrophoresis studies on neuropeptide-induced lymphocyte secretion. J Chromatogr Biomed Sci Appl B 697:101–109.
Sarno M, Powell H, Tjersland G, Schoendorfer D, Harris H, Adams K, Ogata P, Warnick GR. 1999. A collection method and high-sensitivity enzyme immunoassay for sweat pyridinoline and deoxypyridinoline cross-links. Clin Chem 45:1501–1509.
Sarno M, Sarno L, Baylink D, Drinkwater B, Farley S, Kleerekoper M, Lang R, Lappe J, Licata A, McClung M, Miller P, Nattrass S, Recker R, Schwartz EN, Tucci JR, Wolf S, Powell H, Tjersland G, Warnick GR. 2001. Excretion of sweat and urine pyridinoline crosslinks in healthy controls and subjects with established metabolic bone disease. Clin Chem Lab Med 39:223–228.
BIOMARKERS FOR BRAIN HYPOMETABOLISM DUE TO SLEEP DEPRIVATION
Nancy Wesensten, Walter Reed Army Institute of Research
Both acute and chronic sleep deprivation (roughly surge and sustained operations, respectively) degrade cognitive performance (Belenky et al., 2003). The neurobiological basis of this cognitive performance degradation appears to be a global decrease in brain energy metabolism, with the greatest decreases occurring in the prefrontal cortex (Thomas et al., 2000). The prefrontal cortex governs the highest-order cognitive processes, including anticipation, planning, situational awareness, and common mental models; the ability to envision the desired end state; and the paths to achieving it. In military operations, these functions translate into the ability to adapt at all levels of command and control to take advantage of tactical, operational, and strategic opportunities in real time.
Surge operations and sustained operations differ in their effects on performance and thus presumably on underlying neurobiology. During surge operations (less than 4 hours of sleep per 24 hours), performance degrades in a linear fashion, while brain metabolism declines over the first 24 hours and then stabilizes at this lower level (Thomas et al., 2000). Because recovery from surge operations is rapid and generally complete within 24 to 48 hours with adequate (8 hours per night) recovery sleep, it is assumed that brain metabolism also recov-
ers completely. The effects of sustained operations (more than 4 but less than 7 hours of sleep per 24 hours) on performance has received far less attention, and therefore are less well understood—however, results from a recently completed study by our group indicate that with less than 8 hours of sleep per night, performance degrades over the first few days and then stabilizes at a lower submaximum level of performance (Balkin et al., 2000; Belenky et al., 2003). Unlike surge operations, recovery from sustained operations can take days or weeks (Belenky et al., 2003). The effects of sustained operations on brain metabolism are not known, but our performance data suggest that sustained operations are associated with a more enduring down-regulation of brain metabolic capacity.
As both military and civilian industrial endeavors become increasingly continuous (24 hours per day) operations, the potential for sleepiness-related incidents—ranging from operational inefficiencies to errors resulting in serious accidents—is increasing. The task of determining how, or what, to measure to predict human performance degradation is difficult and complex. Because brain hypometabolism is assumed to underlie performance deficits, the former would be the “gold standard” biological signal to monitor. Biomarkers of brain metabolism changes during sleep deprivation include blood flow (Braun et al., 1997) and glucose metabolism (Thomas et al., 2000). Clearly, however, these markers are not fieldable—and to date evidence indicating that they are predictive of performance degradation is lacking. Since in most operational settings changes in actual performance are of concern, the question could be rephrased as, “Are measures of actual performance as good as (or perhaps better than) measures of brain hypometabolism?” If the answer to the latter is positive, the question then becomes, “What constitutes a promising metric of general sleep-related performance capacity for use in the operational environment?” To this end, we tested, compared, and judged several candidate measures across seven consecutive days in which subjects were allowed 9, 7, 5, or 3 hours in bed per night. This design constituted an in-laboratory simulation of sustained operations (as defined above).
MATERIALS AND METHODS
General Design and Procedures
A complete description of the study subjects, design, and procedures can be found in Balkin and colleagues (2000). Briefly, 66 commercial motor vehicle-licensed drivers (16 women, 50 men; age range 24–62 years) participated. They spent 14 days in the laboratory. The first 2 days were adaptation/training (T1, T2) and the third served as baseline (B). Subjects were allowed 8 hours in bed (TIB) from 2300 to 0700 on the nights prior to T2 and B. Beginning on the fourth day and continuing for a total of 7 days (E1-E7) subjects were assigned to one of four sleep conditions: 9 hours TIB (2200–0700); 7 hours TIB (2400–0700); 5 hours TIB (0200–0700); or 3 hours TIB (0400–0700). On the eleventh
day and continuing for a total of 3 “recovery” days (R1-R3), subjects were again allowed to sleep from 2300 to 0700 (8 hours TIB). Data from these recovery days are not reported here.
Cognitive/Psychomotor Tests
Subjects performed a series of cognitive and alertness tests daily, including psychomotor vigilance (PVT) (Dinges and Powell, 1985); synthetic work (Elsmore, 1994); simulated driving (StiSim) (Balkin et al., 2000); running memory; grammatical (logical) reasoning; Stroop color naming; serial addition/subtraction; 10-choice reaction time (RT); time estimation or “interval reproduction”; code substitution; subjective sleepiness via the Stanford Sleepiness Scale (SSS) (Hoddes et al., 1973); objective sleepiness via a sleep latency test (SLT) (Carskadon et al., 1986); 4-choice RT (Thorne et al., 1985); and an oculomotor function test (FIT). A detailed description of these tests can be found in Balkin and colleagues (2000).
Data Analyses
Analysis of Variance
Data were first analyzed using conventional analysis of variance (ANOVA; Kirk, 1995) techniques: a mixed ANOVA for sleep group (between subjects) × day (within subjects) was applied to all data, with additional factors for time of day as appropriate. Greenhouse-Geisser corrections (Kirk, 1995) were applied to repeated measures effects. Significant sleep group×day interactions were followed by simple effects analyses for sleep group at each day. Significant sleep-group simple effects were then analyzed using post-hoc Tukey honestly significant difference (HSD) comparisons (Kirk, 1995) among all possible pairs of sleep groups (maximum of six comparisons: 3 hr vs. 5 hr, 7 hr, and 9 hr; 5 hr vs. 7 hr and 9 hr; 7 hr vs. 9 hr). All performance data were normalized by converting to percent baseline.
Effect Size Analysis
Data were also explored by generating an effect size estimate (also known as a d statistic) for the relationship between nightly sleep time and each task/dependent variable listed above independent of sleep group assignment (Balkin et al., submitted). Variability of the effect size was estimated using a bootstrap procedure to determine whether the effect size differed from zero. The bootstrap procedure also provided estimates of confidence intervals.
RESULTS
Analysis of Variance
ANOVA revealed that nightly total sleep time (TST) increased significantly in the 9-hour group and decreased significantly in the 3-, 5-, and 7-hour groups across the sleep restriction/augmentation phase (E1-E7) compared with baseline (B) (group×night, p<0.05). TST significantly differed among all sleep groups on nights E1 through E7 (Tukey HSD, ps<0.05).
Table D-8 summarizes the number of significant post-hoc comparisons among sleep groups for each task and dependent variable baseline (B) through experimental day 7 (E7) for which both the sleep group×day interaction and significant simple effects of sleep group at each day were significant. The tasks/dependent variables are rank-ordered by total number of significant posthoc contrasts summed across baseline and E1 through E7. As indicated in Table D-8, by this criterion PVT relative speed was most sensitive.
Effect Size Analyses
Figure D-34 shows results of the effect size analysis (Balkin et al., submitted). Using this technique, SLT accounted for the largest percentage of variance in nocturnal sleep during the experimental phase (45 percent), followed by PVT speed (21 percent), StiSim lane deviations (19 percent) 4-choice RT speed (13 percent), and SSS (10 percent); the effect sizes for these tasks/dependent measures were statistically significant (ps<0.05). Note that although StiSim accidents showed a relatively large effect size, the confidence intervals for this measure also were large; thus, the effect size was nonsignificant. On the other hand, effect sizes for StiSim lane position (7 percent), 10-choice RT number correct (7 percent), serial addition/subtraction speed (5 percent), and 4-choice RT correct (3 percent) were relatively small but significant since the confidence intervals were relatively narrow.
DISCUSSION AND CONCLUSIONS
Although it is assumed that biomarkers of brain hypometabolism (presumed to underlie performance deficits) would be the preferred biological signal to monitor to predict sleep deprivation-induced performance impairments, such markers are currently not fieldable. Therefore, the question of what constitutes a promising metric of general sleep-related performance capacity for use in the operational environment is addressed.
Of the various measures compared, the most sensitive (as reflected by the number of statistically significant post-hoc comparisons from the ANOVA) was PVT (Dinges and Powell, 1985). The most sensitive test as reflected by the effect size analysis was SLT. Although the rank ordering of tasks differed somewhat between ANOVA and effect size analysis, in general those tests found to
be most sensitive by one technique also ranked highly using the other technique. Tasks in the top rankings for both included PVT, simulated driving lane deviations and lane position, SLT, SSS subjective sleepiness self-ratings, and serial addition/subtraction speed.
That SLT accounted for the most variance by the effect size technique is perhaps not surprising since it could be argued that SLT is the most “direct” measure of sleep loss in that it actually gauges sleep (onset) itself. However, under most circumstances the SLT is not practical—and more important, sleep latency does not necessarily predict performance. PVT speed most frequently mirrored the gradations in total sleep times—and, by inference, the differential levels of recuperation that result from spending 3, 5, 7, or 9 hours in bed over 7 consecutive nights. That PVT speed did not account for a greater proportion of variance in nocturnal sleep time (effect size analysis) may indicate that total sleep time, rather than PVT speed, is not a particularly sensitive index of recuperation processes. It may be that some other index of sleep-mediated recuperative processes, such as slow-wave activity, might better predict performance.
The present results suggested relatively poor sensitivity of FIT for detecting sleepiness. It is possible that sensitivity could have been increased by increasing FIT test duration. In its current configuration, FIT is a short (45 sec) test. Even extremely sleepy subjects can perform adequately for short periods of time, suggesting that any short-duration task will lack sensitivity. For example, had PVT been administered only for 45 seconds, it likely would have been relatively insensitive and, in fact, our analyses of PVT data across time on task indicate that decrements do not become evident until the third or fourth minute on task. SLT may also constitute a 20-minute vigilance task, the sensitivity of which would be decreased by shortening the test to 1 to 2 minutes.
In the near-term, progress in developing the means to measure and monitor the effects of sleep loss in the operational environment will require further, similar studies—systematic, head-to-head comparisons of the sensitivity and reliability of multiple measures (with consideration of the likelihood that these measures could be obtained in the operational environment of interest). At the core of these near-term (within 2–5 years) studies will be performance metrics, with a vision toward integration of newer, “high-risk/high-payoff” technologies, such as analyses of changes in gene expression across sleep deprivation/sleep restriction, and how such changes in gene expression relate to specific performance metrics. Also needed in the near-term are studies describing the exact relationship between sleep deprivation-induced brain hypometabolism and specific aspects of cognitive performance to determine whether there is actually a need for measuring hypometabolism directly. That is, does a marker of brain hypometabolism (blood flow, metabolism) confer some predictive advantage beyond that of performance measures? Do markers of brain hypometabolism better determine individual differences in response to sleep loss? Far-term (10–20 years out) studies will consist of aggregate measures of sleep/wake history over
TABLE D-8 Number of Significant Post-hoc Contrasts Among Sleep Groups for Each Task and Dependent Measure
|
|
|
Number of Significant Post-hoc Contrasts Among Sleep Groups (max=6/day)c |
Actual Group n (max possible) |
|
|
||||||||||||
|
Taska |
Dependent Measureb |
B |
EI |
E2 |
E3 |
E4 |
E5 |
E6 |
E7 |
Total |
3 (18) |
5 (16) |
7 (16) |
9 (16) |
Total (66) |
* |
^ |
|
Total sleep time |
Abs Min of sleep |
NS |
6 |
6 |
6 |
6 |
6 |
6 |
6 |
42 |
18 |
16 |
15 |
16 |
65 |
|
|
|
PVT |
Rel speed |
NA |
2 |
3 |
4 |
4 |
3 |
4 |
4 |
24 |
14 |
13 |
14 |
16 |
57 |
|
|
|
PVT |
Rel speed −2 times of day |
NA |
2 |
3 |
4 |
4 |
4 |
4 |
3 |
24 |
16 |
15 |
15 |
16 |
62 |
|
|
|
StiSim |
Rel SD of lane tracking |
NA |
NS |
4 |
2 |
2 |
3 |
2 |
3 |
16 |
10 |
13 |
13 |
12 |
48 |
|
|
|
StiSim |
Rel lane position |
NA |
1 |
2 |
3 |
2 |
2 |
2 |
2 |
14 |
10 |
13 |
13 |
12 |
48 |
|
|
|
Stanford Sleepiness Scale |
Rel sleepiness score |
NA |
NS |
2 |
3 |
1 |
2 |
2 |
1 |
11 |
17 |
15 |
15 |
13 |
60 |
|
|
|
Wilkinson 4-choice RT |
Rel speed |
NA |
NS |
1 |
2 |
2 |
2 |
1 |
3 |
11 |
14 |
15 |
15 |
10 |
54 |
|
|
|
Running memory |
Rel speed |
NA |
1 |
NS |
1 |
0 |
3 |
2 |
3 |
10 |
17 |
14 |
15 |
14 |
60 |
|
|
|
Modified MSLT |
ABS latency to sleep (min) |
NA |
NS |
4 |
0 |
NS |
4 |
2 |
0 |
10 |
16 |
14 |
15 |
9 |
54 |
|
|
|
Stroop |
Rel speed |
NA |
1 |
NS |
NS |
1 |
1 |
1 |
2 |
6 |
17 |
15 |
14 |
15 |
61 |
|
|
|
Serial addition/subtracti on |
Rel speed |
NA |
NS |
NS |
1 |
1 |
1 |
1 |
2 |
6 |
17 |
14 |
15 |
13 |
59 |
|
|
|
Running memory |
Rel accuracy |
NA |
NS |
NS |
NS |
NS |
1 |
1 |
3 |
5 |
17 |
14 |
15 |
14 |
60 |
|
|
|
Serial addition/subtracti on |
Rel accuracy |
NA |
NS |
NS |
NS |
NS |
1 |
2 |
2 |
5 |
17 |
14 |
15 |
13 |
59 |
|
|
|
Grammatical reasoning |
Rel accuracy |
NA |
0 |
0 |
NS |
NS |
NS |
NS |
NS |
0 |
17 |
14 |
15 |
13 |
59 |
|
|
|
Time estimation |
Rel CV |
NA |
NS |
NS |
NS |
0 |
0 |
0 |
0 |
0 |
17 |
13 |
15 |
13 |
58 |
|
|
|
Wilkinson 4-choice RT |
Rel accuracy |
NA |
NS |
NS |
0 |
NS |
NS |
0 |
0 |
0 |
14 |
15 |
15 |
10 |
54 |
|
|
|
|
|
Number of Significant Post-hoc Contrasts Among Sleep Groups (max=6/day)c |
Actual Group n (max possible) |
|
|
||||||||||||
|
Taska |
Dependent Measureb |
B |
EI |
E2 |
E3 |
E4 |
E5 |
E6 |
E7 |
Total |
3 (18) |
5 (16) |
7 (16) |
9 (16) |
Total (66) |
* |
^ |
|
10-Choice RT |
Rel speed (group x day, p= 0.0) |
NA |
NS |
NS |
0 |
1 |
0 |
3 |
2 |
6 |
17 |
13 |
15 |
13 |
58 |
|
|
|
Stroop |
Rel accuracy |
NA |
NS |
NS |
NS |
NS |
NS |
NS |
NS |
0 |
17 |
15 |
14 |
15 |
61 |
* |
|
|
Grammatical reasoning |
Rel speed |
NA |
NS |
NS |
NS |
NS |
NS |
NS |
NS |
0 |
17 |
14 |
15 |
13 |
59 |
* |
|
|
10-ChoiceRT |
Rel accuracy |
NA |
NS |
NS |
NS |
NS |
NS |
NS |
NS |
0 |
17 |
13 |
15 |
13 |
58 |
* |
|
|
SYNWORK |
Rel composite score |
NA |
NS |
NS |
NS |
NS |
NS |
NS |
NS |
0 |
17 |
15 |
11 |
15 |
58 |
* |
|
|
Code substitution |
Rel accuracy (IRE score) |
NA |
NS |
NS |
NS |
NS |
NS |
NS |
NS |
0 |
16 |
13 |
13 |
8 |
50 |
* |
|
|
StiSim |
Abs number of accidents |
NA |
NS |
NS |
NS |
NS |
NS |
NS |
NS |
0 |
13 |
14 |
13 |
13 |
53 |
* |
|
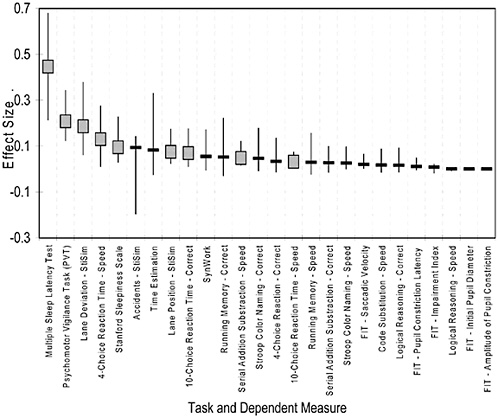
FIGURE D-34 Effect size for each task and dependent measure. Significant effect sizes are denoted by filled gray squares; nonsignificant effect sizes are denoted by a solid dash. Vertical lines indicate confidence intervals. StiSim=simulated driving, SynWork=synthetic work, FIT=oculomotor function test.
weeks, analogous to glycosylated hemoglobin as an index of blood glucose control over a period of weeks.
In both the near and far terms, investigations into the underlying neurobiology of sleep and wakefulness are critical; for example, no chemical has yet been identified in the blood that accumulates during sleep deprivation and causes performance impairments. The analogous state of affairs would be alcohol-induced impairment, where alcohol levels are measurable in exhaled air, and levels of alcohol have been correlated with degree of performance impairment. The latter is the end result of a long and complex (and still ongoing) process.
REFERENCES
Balkin T, Bliese P, Belenky G, Sing H, Thorne D, Thomas M, Redmond D, Russo M, Wesensten N. Submitted. Comparative utility of instruments for monitoring sleepiness-related performance decrements in the operational environment. J Sleep Res
Balkin T, Thorne D, Sing H, Thomas M, Redmond D, Wesensten N, Williams J, Hall S, Belenky G. 2000. Effects of sleep schedules on commercial driver performance. Report No. DOT-MC-00–133. Washington, DC: Federal Motor Carrier Safety Administration, U.S. Department of Transportation.
Belenky G, Wesensten NJ, Thorne DR, Thomas ML, Sing HC, Redmond DP, Russo MB, Balkin TJ. 2003. Patterns of performance degradation and restoration during sleep restriction and subsequent recovery: A sleep dose-response study. J Sleep Res 12:1–12.
Braun AR, Balkin TJ, Wesensten NJ, Carson RE, Varga M, Baldwin P, Selbie S, Belenky G, Herscovitch P. 1997. Regional cerebral blood flow throughout the sleep-wake cycle: An H215O positron emission tomography study. Brain 120:1173–1197.
Carskadon MA, Dement WC, Mitler MM, Roth T, Westbrook PR, Keenan S. 1986. Guidelines for the multiple sleep latency test (MSLT): A standard measure of sleepiness. Sleep 9:519–524.
Dinges DF, Powell JW. 1985. Microcomputer analyses of performance on a portable, simple visual RT task during sustained operations. Behav Res Methods Instrum Comput 17:65 2–655.
Elsmore TF. 1994. SYNWORK1: A PC-based tool for assessment of performance in a simulated work environment. Behav Res Methods Instrum Comput 26:421–426.
Hoddes E, Zarcone V, Smythe H, Phillips R, Dement WC. 1973. Quantification of sleepiness: A new approach. Psychophysiology 10:431–436.
Kirk RE. 1995. Experimental Design: Procedures for the Behavioral Sciences. 3rd ed. Monterey, CA: Brooks/Cole.
Thomas M, Sing H, Belenky G, Holcomb H, Mayberg H, Dannals R, Wagner H, Thorne D, Popp K, Rowland L, Welsh A, Balwinski S, Redmond D. 2000. Neural basis of alertness and cognitive performance impairments during sleepiness. I. Effects of 24 h of sleep deprivation on waking human regional brain activity. J Sleep Res 9:335–352.
Thorne DR, Genser SG, Sing HC, Hegge FW. 1985. The Walter Reed performance assessment battery. Neurobehav Toxicol Teratol 7:415–418.
ELECTROENCEPHALOGRAPHIC INDICATORS OF IMPAIRED AVIATOR STATUS DURING SLEEP DEPRIVATION
John A.Caldwell, Brooks Air Force Base
Monitoring the brain activity of aviators for indications of degraded cognitive/performance capacity is desirable for enhancing flight safety. Research has shown that degraded pilot status has caused serious mishaps. For instance, McCann and Schulze (1963) reported that a substantial number of fatal aviation accidents have resulted from pilot incapacitation due to hypoxia, hyperventilation, or blackout; Yacavone (1993) found that serious flight mishaps have been associated with inadequate crew coordination or decrements in the physical or mental status of pilots. Pilot fatigue is now recognized as a serious threat to aviation safety, especially in operations that involve sleep loss from circadian disruptions, extended duty periods without sleep, and episodes of night duty during which alertness is typically impaired due to circadian factors (Akerstedt, 1995). Aviator fatigue degrades response accuracy and speed, impairs the capacity to integrate information, and narrows attention (Perry, 1974). Fatigued pilots tend to decrease their physical activity, withdraw from social interactions, and lose the ability to effectively divide mental resources among different tasks. These effects are compounded by the fact that increased sleepiness in the cockpit is associated with less consistent performance and deteriorations in vigilance (Dinges, 1990).
Kirsh (1996) estimates that fatigue may be involved in 4 to 7 percent of civil aviation mishaps, and data from the U.S. Army suggest fatigue is involved in 4 percent of Army accidents (Caldwell and Gilreath, 2002). Furthermore, 25 percent of the Air Force’s night tactical fighter Class A accidents were attributed to fatigue between 1974 and 1992, and 12.2 percent of the Navy’s total Class A mishaps were thought to be the result of aircrew fatigue from 1977 to 1990 (Ramsey and McGlohn, 1997). Especially noteworthy mishaps in the commercial aviation sector include the crash of Korean Air flight 801 in which 228 people died (NTSB, 1999), the near crash of China Airlines flight 006 in which two people were severely injured while numerous other passengers were traumatized (Kostad, 1989), and the accident involving American Airlines flight 1420 in which 11 people died (Krause, 1999). In each of these cases, crew fatigue from insufficient sleep and/or circadian factors was implicated.
It is regrettable that a suitable metric has not been developed to determine the point at which aviator fatigue becomes a hazard to safe flight. In fact, neither the military nor the civilian aviation sector has identified a better fatigue countermeasure than the age-old strategy of flight-time or duty-time limitations. Unfortunately, this approach fails to account for the known effects of fatigue-inducing factors such as: (1) the quality of sleep prior to reporting for duty, (2) the deleterious impact of chronically restricted sleep periods, and (3) the hour-
by-hour fluctuations in physiological alertness that stem from circadian rhythms. What is needed is a validated, objective measurement of aviator status that ultimately can be monitored continuously and in real time.
Since the electroencephalogram (EEG) is the most direct indication of central nervous system functioning (which presumably underlies all cognition and performance), this measure holds great promise for objectively and accurately monitoring the fatigue state of operators. The fact that EEG activity can be collected without interfering with the primary task of flying the aircraft (Caldwell et al., 2002) supports the feasibility of continuous, real-time monitoring. In addition, numerous ground-based studies have established the sensitivity of EEG activity to work-related stressors such as sleep deprivation. Several researchers have shown that slow-wave EEG activity (i.e., delta and/or theta) is significantly elevated by even moderate sleep loss (e.g., Caldwell et al., 1996; Comperatore et al., 1993; Lorenzo et al., 1995; Pigeau et al., 1987). Recently, Caldwell and Hall (2001) reported that both delta and theta are reliably accentuated after 23 to 26 hours of continuous wakefulness, approximately the same time that both mood and performance are adversely affected.
Although studies relating in-flight EEG data to the readiness level of aviators are virtually nonexistent, a few investigators have suggested a link. Sterman and colleagues (1987) demonstrated changes in EEG theta and alpha as a function of increased flying demands, as well as increased EEG asymmetries as a function of increased workload, and Wilson and Hankins (1994) found differences in EEG theta activity attributable to alterations in attention and cognitive demands in flight. With regard to the appearance of EEG indications of in-flight fatigue, several researchers have reported EEG microsleeps (bursts of slow-wave EEG) in aircrews during trips ranging from 8 to 15 hours in duration (Cabon et al., 1993; Rosekind et al., 1994; Samel et al., 1997; Wright and McGown, 2001). Since such events signal an impaired ability to respond to incoming stimuli (Belyavin and Wright, 1987; Ogilvie et al., 1989, 1991), these findings are relevant to aviation safety.
In this study, EEG data were systematically collected from sleep-deprived subjects in a specially-instrumented, rotary-wing aircraft to determine whether the typical increases in theta and reductions in alpha (recorded under controlled conditions in the laboratory) would occur in the in-flight environment, particularly while pilots were at the controls of the aircraft. The magnitude of differences at selected points during 29 hours of continuous wakefulness was examined. In addition, the extent to which EEG changes were associated with fatigue was assessed by collecting cognitive and mood data between flight times.
MATERIALS AND METHODS
Ten UH-60 current and qualified aviators served as subjects. The average age of the participants was 31.2 years (with a range of 26–46). Resting (eyes open/eyes closed) EEG evaluations were completed both in the laboratory and in the aircraft (while the safety pilot was on the controls). In addition, EEG evalua-
tions were performed while the pilot was flying the aircraft. Performance and mood evaluations were conducted between flights in the laboratory.
In-flight EEG evaluations were conducted using a Cadwell Laboratory Airborne Spectrum 32, which transmitted data to a standard ground-based Cadwell Spectrum 32 for review and analysis. Laboratory EEG evaluations were made with a standard Cadwell Spectrum 32. The low filters were set at 0.53 Hz, the high filters were set at 100 Hz, and the 60 Hz notch filters were used. Grass E5SH electrodes were used to detect EEG.
Subjective mood evaluations were made in the laboratory using the Profile of Mood States (POMS) (McNair et al., 1981), a 65-item test that measures: (1) tension-anxiety, (2) depression-dejection, (3) anger-hostility, (4) vigoractivity, (5) fatigue-inertia, and (6) confusion-bewilderment. Subjective sleepiness/alertness was measured via the Visual Analog Scale (VAS). Several items were included, such as sleepy, alert, energetic, and talkative.
Basic cognitive abilities were examined in the laboratory with the Multi-Attribute Task Battery (MATB), a test that requires subjects to track a target and tune a communications radio while monitoring fuel levels and warning lights and dials.
The test schedule included three training sessions on the first day of participation. These were followed by three testing sessions that began on the second day of participation, continued during the night, and ended on the morning of the third day. On the training day, subjects arrived at the laboratory at approximately 1000 and were released by approximately 2200. On the following (testing) day, subjects awakened at 0700, reported to the laboratory at 1700, and remained in the laboratory (except for the flights) until approximately 1200 the next day (no sleep was permitted).
On the testing day, EEG electrodes were attached, and the subject proceeded to the first EEG test in the laboratory. The subject was instructed to sit quietly for 5 minutes with eyes open, followed by 5 minutes with eyes closed. Following EEG testing, the subject completed one VAS, one POMS, and performed the MATB for 30 minutes. Afterward, he completed another resting EEG, VAS, and POMS. Once laboratory testing for the session was complete, the subject was driven to an airfield for the first flight at 2300. After reaching altitude, with the safety pilot at the controls, the subject completed an eyes-open/eyes-closed EEG while the safety pilot was in control of the aircraft. Afterward, the subject flew several standard flight maneuvers. At the conclusion of the flight, the subject was driven back to the laboratory for the next test session (EEG, VAS, POMS, and MATB) at 0200. Afterward, the subject departed for the second flight (at approximately 0400). Following this flight, there was one final laboratory test session at 0700 and one final flight at 0900.
RESULTS
A variety of detailed analyses were conducted in this study. For the sake of brevity these will be summarized here, but a detailed account is available in Caldwell and colleagues (2002).
Electroencephalogram Laboratory Data
The analysis of variance (ANOVA) on delta activity included two factors: session (2045, 2140, 0145, 0240, 0645, and 0740) and eyes (eyes open and eyes closed). There were session main effects at Fz, Cz, and Pz; eyes main effects at Fz, Cz, and Pz; and session-by-eyes interactions at Cz and Pz (p<0.05). Delta power increased from 2045 to 0740 and was greater under eyes closed than eyes open. The session-by-eyes interaction at Cz was due to the fact that there was a small increase in delta from eyes-open to eyes-closed early in the deprivation period (at 2045), followed by a much larger increase later in the deprivation period (at 0645). A similar pattern occurred at Pz. The analysis of theta activity revealed session main effects at Fz, Cz, and Pz primarily because of linear increases from the first to the last sessions of the deprivation cycle. Eyes main effects at all three electrodes were due to less theta at eyes-open than at eyes-closed. Session-by-eyes interactions at Fz, Cz, and Pz were all because of more theta under eyes-closed than eyes-open at various points in the deprivation cycle (particularly at 2045, 0145, 0645, and 0740), with the differences being more noticeable at certain times than at others. The ANOVA on alpha activity indicated session main effects and eyes main effects at Fz, Cz, and Pz. There were session-by-eyes interactions at Fz and Cz (p<0.05). A decrease in alpha activity occurred from the first to the last part of the deprivation period at Fz and Cz, and an increase in alpha occurred under the eyes-closed versus the eyes-open condition at all three electrodes. The session-by-eyes interactions were the result of large differences between the eyes-open and eyes-closed conditions at 2045, 2140, 0145, and 0740, with smaller or more variable differences at 0240 and particularly at 0645. Beta activity revealed a session difference only at Pz (p< 0.05) which was the result of higher amounts of beta during the first part of the deprivation period (from 2045 to 0145) than at 0645, after which there was a rebound at 0740. Eyes main effects occurred at all three sites (p<0.05) because of greater amounts of beta under eyes-closed than eyes-open. There were no significant interactions.
Electroencephalogram In-Flight Data
In the in-flight (aircraft) setting, EEG data were collected under a resting eyes-open condition (with the safety pilot on the controls) at the beginning of each flight and subsequently during each of the 15 maneuvers (with the participant on the controls). Only time-related effects will be reported here.
The ANOVA on delta activity for flight (2300, 0400, and 0900) and segment (resting, maneuver 1, maneuver 2, maneuver 3, …maneuver 15) indicated there was a flight- (or session) related difference only at Pz (p<0.05). This was due to increased delta from the first two flights to the third. Theta power at Fz, Cz, and Pz increased from the first to the last flight, and theta at Pz showed a particularly striking increase by the time of the third flight. Alpha power at Fz, Cz, and Pz increased from the 2300 flight to the 0900 flight as well, but EEG beta activity did not change as a function of flight time.
Profile of Mood States
One-way ANOVAs of the scales from the POMS given at 2100, 2155, 0200, 0255, 0700, and 0755 revealed main effects on tension-anxiety, vigor-activity, fatigue-inertia, and confusion-bewilderment (p<0.05). These occurred because mood deteriorated as the hours of continuous wakefulness increased.
Visual Analog Scale
The one-way ANOVAs on the VAS given after the POMS (at 2100, 2155, 0200, 0255, 0700, and 0755) indicated significant session differences on six of the eight subscales: alertness, energy, confidence, irritability, sleepiness, and talkativeness (p<0.05). Once again, these were due to linear deteriorations in mood from the first to the last test sessions. Alertness, energy, confidence, and talkativeness declined generally from the beginning to the end of the deprivation period, whereas irritability and sleepiness increased.
Multiattribute Task Battery
There were statistically significant effects on the reaction times to warning lights and dials, the standard deviation of reaction times to the dials, and the root-mean-square (RMS) errors in the tracking task, due to a linear deterioration in performance from the 2105 session to the 0705 session in all four cases (p < 0.05). In addition, there were quadratic trends in the reaction times to lights, the standard deviation of reaction times to dials, and the tracking RMS errors due to more pronounced decrements towards the end of the deprivation period than the beginning.
DISCUSSION
There were EEG effects in both the laboratory and the in-flight testing situations, and theta activity was affected consistently across the two settings. Theta activity (3.0–8.0 Hz) progressively increased from the beginning to the end of the deprivation period, suggesting that fatigue from sleep deprivation was exerting a negative impact on the physiological alertness of the pilots. In addi-
tion, lower-frequency delta (1.5–3.0 Hz) activity also was accentuated as a function of sleep deprivation in both testing situations, but the effect was localized to Pz in the aircraft, whereas it was seen at all three recording sites in the laboratory. Increases in delta activity are primarily associated with sleep in normal adult subjects (Ray, 1990). Differences in alpha activity were not consistent from the laboratory to the aircraft, possibly because of environmental effects (the laboratory environment is more soporific than the noisier and less comfortable in-flight environment). However, the uniform effects in both delta and theta strongly suggest that: (1) participants were becoming more fatigued as the deprivation period progressed, and (2) this increase in fatigue was detectable via EEG recordings both in the more traditional laboratory setting and in the less-well-researched aircraft setting.
These EEG findings agree with the subjective mood data (from the POMS and the VAS), which indicated that the pilots were adversely affected by sleep deprivation. Ratings of fatigue, sleepiness, irritability, tension, and confusion all increased significantly as a function of prolonged wakefulness, whereas ratings of vigor, alertness, energy, confidence, and talkativeness decreased. These decrements no doubt contributed to the deterioration in basic cognitive abilities observed on MATB. Although less than half of MATB outcome measures apparently were sensitive to the effects of sleep loss and fatigue, the ones that did degrade seem particularly pertinent to aviator performance. Degradations in the reaction time to warning lights and out-of-bounds dial indications, along with more variable performance and increased tracking errors, became more pronounced as the amount of sleep deprivation progressed. Thus, not only were self-perceptions of alertness declining with increased hours awake, but objective measures of performance were deteriorating as well.
Overall, the findings from this study suggest that it is feasible to monitor increases in the fatigue levels of pilots via the real time acquisition of EEG activity from the in-flight environment. Thus, it is possible to gain insight into the functional status of aviators without disrupting performance on the primary task of flying the aircraft. However, future studies are needed to establish whether there are significant correlations between in-flight physiological changes and inflight performance changes.
Acknowledgments: The author greatly appreciates the resources provided by the U.S. Army Medical Research and Materiel Command, which made this research effort possible.
REFERENCES
Akerstedt T. 1995. Work hours, sleepiness, and the underlying mechanisms. J Sleep Res 4:15–22.
Belyavin A, Wright NA. 1987. Changes in electrical activity of the brain with vigilance. Electroencephalogr Clin Neurophysiol 66:137–144.
Cabon PH, Coblentz A, Mollard R, Fouillot JP. 1993. Human vigilance in railway and long-haul flight operations. Ergonomics 36:1019–1033.
Caldwell JA, Gilreath SR. 2002. A survey of aircrew fatigue in a sample of Army aviation personnel. Aviat Space Environ Med 73:472–480.
Caldwell JA, Hall KK. 2001. The effects of 40 hours of continuous wakefulness on EEG power and flight performance. Sleep 24:A31.
Caldwell JA, Caldwell JL, Crowley JS. 1996. Sustaining helicopter pilot alertness with Dexedrine during sustained operations. Proceedings of the Advisory Group for Aerospace Research and Development, Aerospace Medical Symposium on Neurological Limitations of Aircraft Operations: Human Performance Implications, CP -579. Neuilly Sur Seine, France: North Atlantic Treaty Organization.
Caldwell JA, Hall KK, Erickson BS. 2002. EEG data collected from helicopter pilots in flight are sufficiently sensitive to detect increased fatigue from sleep deprivation. Int J Aviat Psychol 12:19–32.
Comperatore CA, Caldwell JA, Stephens RL, Mattingly A, Chiaramonte J, Trast ST. 1993. The Use of Electrophysiological and Cognitive Variables in the Assessment of Degradation during Periods of Sustained Wakefulness. USAARL Technical Report No. 93–5. Fort Rucker: U.S. Army Aeromedical Research Laboratory.
Dinges DF. 1990. The nature of subtle fatigue effects in long-haul crews. In: Proceedings of the Flight Safety Foundation 43rd International Air Safety Seminar. Arlington, VA: Flight Safety Foundation.
Lorenzo I, Ramos CA, Guevara MA, Corsi-Cabrera M. 1995. Effect of total sleep deprivation on reaction time and waking EEG activity in man. Sleep 18:346–354.
Kirsch AD. 1996. Report on the statistical methods employed by the U.S. FAA in its cost benefit analysis of the proposed “Flight Crewmember Duty Period Limitations, Flight Time Limitations and Rest Requirements,” Docket No. 28081. Comments of the Air Transport Association of America to FAA notice 95–18, FAA Docket No. 28081, Appendix D. Washington, DC: Federal Aviation Administration. Pp. 1–36.
Kostad JL. 1989. National Transportation Safety Board safety recommendation. In: Evaluation of U.S. Department of Transportation Efforts in the 1990s to Address Operator Fatigue, Appendix A. Report No. NTSB/SR-99/01. Washington DC: National Transportation Safety Board. Pp. 30–37.
Krause KS. 1999. Little Rock aftermath. Trafficworld June: 11–12.
McCann JP, Schulze VE. 1963. In-flight pilot incapacitation. J Am Med Assoc 183:1088–1090.
McNair DM, Lorr M, Droppleman LF. 1981. Manual for the Profile of Mood States. San Diego: Educational and Industrial Testing Service.
NTSB (National Transportation Safety Board). 1999. Aircraft Accident Report: Controlled Flight into Terrain, Korean Air Flight 801, Boeing 747–300,
HL7468, Nimitz Hill Guam, August 6, 1997. Report No. NTSB/AAR-99–02. Washington DC: NTSB.
Ogilvie RD, Wilkinson RT, Allison S. 1989. The detection of sleep onset: Behavioral, physiological and subjective convergence. Sleep 12:458–474.
Ogilvie RD, Simons IA, Kuderian RH, MacDonald T, Rustenburg J. 1991. Behavioral, event-related potential and EEG/FFT changes at sleep onset. Psychophysiology 28:54–64.
Perry IC. 1974. Helicopter Aircrew Fatigue. AGARD-AR-69. Paris: Advisory Group for Aerospace Research and Development.
Pigeau RA, Heselegrave RJ, Angus RG. 1987. Psychophysiological measures of drowsiness as estimators of mental fatigue and performance degradation during sleep deprivation. In: Electric and Magnetic Activity of the Central Nervous System: Research and Clinical Applications in Aerospace Medicine. AGARD CP-432, 21–1/21–16. Neuilly Sur Seine, France: Advisory Group for Aerospace Research and Development.
Ramsey CS, McGlohn SE. 1997. Zolpidem as a fatigue countermeasure. Aviat Space Environ Med 68:926–931.
Ray W. 1990. The electrocortical system. In: Cacioppo T, Tassinary LG, eds. Principles of Psychophysiology: Physical, Social, and Inferential Elements. Cambridge: Cambridge University Press. Pp. 385–412.
Rosekind MR, Graeber RC, Dinges DF, Connell LJ, Rountree MS, Spinweber CL, Gillen KA. 1994. Crew Factors in Flight Operations IX: Effects of Planned Cockpit Rest on Crew Performance and Alertness in Long-Haul Operations. NASA Technical Memorandum no. 108839. Moffet Field, CA: Ames Research Center, National Aeronautics and Space Administration.
Samel A, Wegmann HM, Vejvoda M. 1997. Aircrew fatigue in long-haul operations. Accid Anal Prev 29:439–452.
Sterman MB, Schummer GJ, Dushenko TW, Smith JC. 1987. Electroencephalographic correlates of pilot performance: Simulation and in-flight studies. In: Electrical and Magnetic Activity of the Central Nervous System: Research and Clinical Applications in Aerospace Medicine, AGARD CP No. 432, 31–1/31–16. Neuilly Sur Seine, France: NATO.
Wilson GF, Hankins T. 1994. EEG and subjective measures of private pilot performance. In: Proceedings of the Human Factors and Ergonomics Society 38th Annual Meeting . Santa Monica, CA: Human Factors and Ergonomics Society. Pp. 1322–1325.
Wright N, McGown A. 2001. Vigilance on the civil flight deck: Incidence of sleepiness and sleep during long-haul flights and associated changes in physiological parameters. Ergonomics 44:82–106.
Yacavone DW. 1993. Mishap trends and causal factors in Naval aviation: A review of Naval Safety Center data, 1986–90. Aviat Space Environ Med 64:392–395.
CIRCULATING PLASMA MARKERS OF COGNITIVE STATUS
Harris R.Lieberman, Mark D.Kellogg, Gaston P.Bathalon, U.S. Army Research Institute of Environmental Medicine
BACKGROUND
Basic scientists and clinicians have been searching for biochemical markers of cognitive state for many years. Unfortunately, little progress has been made with regard to identification of markers that, in normal individuals, relate metabolic status to cognitive function or assess general cognitive state. It would be a significant breakthrough for basic science and clinical practice to have reliable plasma markers of cognitive function. Many devastating diseases are either cognitive in nature or produce secondary cognitive deficits. Biochemical tests for the cognitive deficits associated with Alzheimer’s disease, depression, or Attention Deficit Hyperactivity Disorder (ADHD) would be of extraordinary value to society. In addition, it would be very useful for understanding the biological basis of human behavior to have objective plasma markers of cognitive state. On the battlefield, such markers could also be of significant value. They could potentially be employed to optimize warfighter cognitive function and to prevent errors associated with the stress of combat and illnesses associated with combat, such as Post-Traumatic Stress Disorder (PTSD) or Gulf War Syndrome-like diseases.
Current State of the Field
Many peripheral metabolic diseases such as diabetes, hyperthyroid syndromes, and Cushing’s disease (elevated cortisol), are associated with impaired cognitive function. Frequently, the metabolic markers of the disease are biochemical markers of cognitive state, and sometimes these indicators can provide information about cognitive status in healthy humans. For example, elevated plasma cortisol is an indicator of acute stress and is negatively correlated with various aspects of cognitive function. The adverse effects of elevated cortisol on cognitive function can be observed in various disease states and also when exogenous cortisol is administered to normal humans (for a review, see Jameison and Dinan, 2001). Unfortunately, cortisol and similar markers appear to provide little information about normal human cognitive function beyond serving as an index of stress-induced declines in cognition. Decrements in military operational performance can be stress-related, but in many instances are not (Johnson and Merullo, 2000). We will provide data that suggest that another endogenous glucocorticoid, dehydroepiandrosterone sulphate (DHEA-S) is, at least in a population we have recently studied, a better marker of normal cognitive status than cortisol.
Plasma glucose, as discussed in detail below, is also an indicator of impaired cognitive function in diseases such as diabetes. When it is artificially lowered to below physiological levels using the insulin clamp technique, cognitive deficits result. However, it often seems to provide little information about cognitive status in healthy individuals, in part because it is tightly regulated. We will provide data that suggest that other metabolic factors associated with energy and carbohydrate metabolism, in particular free fatty acids (FFA) and triglycerides, may, in healthy individuals, be better markers of cognitive state, and perhaps metabolic status, than glucose.
The Inherent Difficulty of Identifying Biochemical Markers for Cognitive State
Although there is great need for objective markers of cognitive state, there are a variety of reasons why it has been extremely difficult to define reliable markers for brain function in normal humans. The greatest difference in normal human cognitive states is between sleep and waking. Classical electrophysiological techniques (polysomnography), as well as functional measures (e.g., monitoring physical activity), can distinguish sleep from waking state. However, it is not possible to biochemically distinguish these states. The only biochemical measure that, under certain conditions, corresponds to sleep state is the hormone melatonin, but it is not a marker of sleep state. If states as disparate as sleep and waking—which exhibit the most extreme differences in human cognitive function—are not biochemically distinguishable, we cannot expect to easily find a marker for more subtle differences in human cognitive state, such as optimal alertness versus sleepiness.
The lack of markers for cognitive state is reflected by the fact that there are no biochemical markers for any common psychiatric or neurological disease. Diagnosis and assessment of most psychiatric and neurological disorders typically rely on labor-intensive, often subjective, clinical evaluations and self-reports. Common diseases such as depression, schizophrenia, ADHD, PTSD, narcolepsy, and Alzheimer’s and Parkinson’s diseases, cannot be diagnosed or their progression followed by a biochemical test. Progress has been made using scanning technologies to assess cognitive function, as well as to diagnose and follow the progression of certain central nervous system (CNS) diseases. However, it is difficult to conceive of how such technologies could be practically employed in military field operations to assess cognitive state until significant technological advances occur.
Why has there been so little progress in discovering biological markers of CNS function? It has been known for many years that specific neurotransmitter systems were involved in various CNS disorders, including depression, schizophrenia, and Parkinson’s disease. However, no biochemical test has been developed to diagnose or follow the course of these diseases. Clearly, the development of biochemical tests to assess brain function and behavior has been hampered by the unique, protected status of the brain. The blood-brain-barrier
(BBB) isolates, and thereby protects, the brain by preventing the transfer of metabolites from the periphery into the brain. However, the BBB also isolates the periphery from brain metabolites. Therefore, when biochemical markers are assessed in the periphery, usually no direct information regarding central function is provided. Limited exceptions to this principle include hormones released by the brain into the periphery and a few substances that cross from the brain to the plasma.
Usually glucose is the major source of energy for the brain and, under certain limited conditions; plasma glucose is a predictor of cognitive state. When plasma glucose is reduced from normal euglycemic levels of about 5.0 mmol/L−1 (90 mg/dL) to 2.6 mmol/L−1 (47 mg/dL) in nondiabetic individuals and using a hyperinsulinemic clamp, cognitive function is impaired (Strachan et al., 2001). Although this nonphysiological paradigm demonstrates the importance of glucose to the brain, peripheral glucose is tightly regulated in healthy individuals and rarely reaches levels below 3.6 mmol−1 (Wilson et al., 1998). Studies of sustained military training scenarios that simulate combat (e.g., Ranger Training) support these clinical observations. In Ranger trainees who are in a chronic state of semistarvation due to several months of severe undernutrition in harsh field conditions, plasma glucose levels fell to no lower then 3.8 mmol/L−1 (Friedl et al., 2000; Moore et al., 1992).
In military as well as civilian populations, a consistent relationship between plasma glucose within the normal range and cognitive performance has never been demonstrated. Carbohydrate administration can clearly enhance physical performance when high levels of energy are being expended. However, the data relating cognitive performance, carbohydrate administration, and plasma glucose are not consistent. Both beneficial and adverse effects on cognition of increasing plasma glucose and providing carbohydrate have been reported (for a review, see Bellisle et al., 1998). Overall, while it is clear that carbohydrate supplementation can, in certain circumstances, alter cognitive function (Lieberman et al., 2002b); these effects are probably not associated in any simple manner with plasma glucose levels in healthy, nondiabetic individuals.
NEW MARKERS OF COGNITIVE STATE: STUDIES ON MILITARY POPULATIONS IN WHICH COGNITIVE AND BIOCHEMICAL FACTORS WERE ASSESSED
On several occasions, as part of field studies, we have examined the relationship between cognitive performance and plasma or saliva metabolites. Initially, neurotransmitter precursors like tryptophan and tyrosine were of interest as they are actively transported into the brain across the BBB. In an early study, the volunteers were soldiers participating in an evaluation of a lightweight ration and were modestly undernourished for several weeks (Askew et al., 1987). In that study, the ratio of plasma tryptophan to the other large neutral amino acids
(LNAA), which predicts the rate of transport of tryptophan across the BBB, was correlated with cognitive performance (r=0.40–0.44, p<0.02). We believe that the tryptophan/LNAA ratio was associated with cognitive performance because tryptophan is the precursor of a critical brain neurotransmitter, serotonin. Levels of other plasma amino acids were not related to cognitive performance (Lieberman et al., 1997). In a previous presentation to the Committee on Military Nutrition Research, we discussed these findings and addressed the overall importance of a variety of neurotransmitter precursors (Lieberman, 1999). In the last few years we have focused on hormones and metabolic factors that can be measured in saliva or that do not require assessment of multiple amino acids (all the LNAAs).
Study I: A Brief, Intense Training Exercise Conducted by an Operational Ranger Unit
Recently, we evaluated cognitive function and several biochemical markers of stress of soldiers engaged in a brief (52 h) high-intensity training operation. The exercise was conducted by U.S. Army Rangers and had been designed to evaluate junior leaders (Lieberman et al., 2002a). The scenario simulated combat-like conditions, specifically a high-intensity, light infantry operation in a hostile environment, by combining multiple stressors: near total sleep deprivation; continuous physical activity; substantial physiological, environmental, and psychological stress; and simulated combat-like activities. All volunteers (N= 31) were Ranger officers (mean age=32 years) with the rank of Captain, and had served on average 9 years on active duty. The exercise was conducted in a hot, humid environment.
The exercise consisted of three phases: a garrison preparation phase, a field exercise, and a concluding garrison phase. Cognitive performance, mood, and body composition were assessed once during each phase. We used a battery of cognitive tests that were administered on notebook computers and took less than an hour to complete. The battery was designed to assess a wide range of militarily relevant cognitive functions. To assess mood we employed the most widely accepted measure of mood state, the Profile of Mood States (POMS), which has been used in hundreds of civilian and military studies (McNair et al., 1971). It is a standardized, validated self-report questionnaire consisting of 65 mood-related adjectives that are rated on a five-point scale in response to the question, “How are you feeling right now?” It takes less than 5 minutes to complete. The adjectives factor into six mood subscales: tension, depression, anger, vigor, fatigue, and confusion.
Carefully selected measures of mood state are excellent predictors of cognitive performance and sensitive indicators of functional capability. Depressed patients perform poorly, and drowsy normal subjects have impaired cognitive function. Drugs, environmental stress, foods, and dietary supplements that affect cognitive performance have repeatedly been shown to have analogous effects on related mood states. Compounds that enhance cognitive performance, such as
amphetamine, caffeine, and tyrosine, improve corresponding moods, while treatments that degrade performance, such as benzodiazepines (e.g., valium), melatonin, and antihistamines, invariably impair mood (Dollins et al., 1993; Fine et al., 1994; Lieberman et al., 1986; Newhouse et al., 1989). Advantages of mood questionnaires include: the brief period of time required to administer even comprehensive versions of them and the fact that no equipment is needed for their administration. In situations like Marine basic training, where volunteers are available for only brief periods of time and a large number of subjects must be tested simultaneously, they are the only practical way of gathering frequent and detailed data on cognitive state.
At both the in-field and post-field testing sessions we observed very large decrements in cognitive performance, including changes in fundamental functions like vigilance (p<0.001; Figure D-35) and choice reaction time (p< 0.001), as well as more complex abilities: learning (p<0.001), memory (p< 0.001), and logical reasoning (p<0.001; Figure D-35). All mood states assessed were adversely affected, including vigor (p<0.001), fatigue (p<0.001; Figure D-35), confusion (p<0.001; Figure D-35), tension (p<0.02), depression (p< 0.002), and anger (p<0.01) (Lieberman et al., 2002a). We also assessed cortisol, testosterone, and melatonin in saliva samples collected three times per day. As in previous short-duration studies conducted with soldiers exposed to multiple stressors (for example see Opstad, 1994), rather than an increase in cortisol or testosterone, we observed suppression in their circadian pattern of release. Patterns of melatonin release did not change. We did not observe any consistent relationship between hormone levels and impairments in cognitive performance over the course of the exercise, although pre-exercise cortisol did predict, in several instances, pre-exercise and subsequent cognitive performance. This association suggests Rangers who perceived the exercise as likely to be stressful, or who were already stressed when they reported for the exercise, performed worse than their peers. In this study, conducted with soldiers who were subjected to a variety of stressors, but not severe psychological stress, saliva cortisol, testosterone, and melatonin levels provided limited information on cognitive state.
Study II: Marine Basic Training Relationships Between Cognitive and Biochemical Changes in Female Trainees
Recently, our laboratory conducted a comprehensive study of a large group of female trainees enrolled in the 12-week Marine basic training course at Parris Island, South Carolina (Bathalon et al., In press). Every 4 weeks, on the same day, plasma was collected and a POMS mood state questionnaire was administered. A variety of other parameters was also regularly assessed. The mood questionnaire was administered in the morning and blood samples were obtained in the afternoon. Mood was assessed to provide information on the cognitive state of the volunteers as they progressed through training. We also attempted to
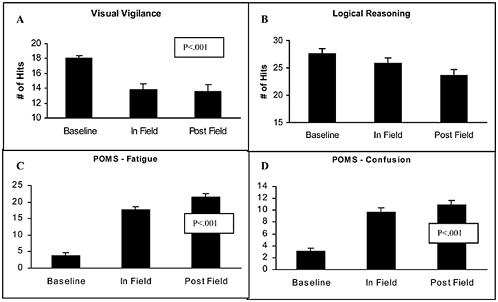
FIGURE D-35 Changes in cognitive performance and mood (mean+standard error of the mean) assessed before, during, and immediately after a brief, high intensity Ranger training exercise. Statistical significance over time, as determined by a within-subject analysis of variance, is provided. POMS=Profile of Mood States.
SOURCE: Lieberman et al. (2002a).
assess the relationship between mood state and biochemical markers of metabolic state, endocrine status, and inflammation.
All mood states assessed by the POMS in the female Marine basic trainees improved substantially over the course of basic training (Figure D-36). The trainees began basic training feeling worse than is typical of age-matched females, but by the time they had completed training their scores were better than the norm (McNair et al., 1971). During training there were also significant changes in a number of biochemical parameters, particularly FFAs, triglycerides, and DHEA-S (Figure D-37). Other biochemical markers such as glucose and cortisol were more stable (Figure D-37). The changes in FFA and triglycerides were consistent with the changing physiological and nutritional status of the trainees. Over the course of the study, the women lost substantial body mass overall (mean=1.7 kg), especially fat (mean=4.4 kg), but gained muscle mass (mean=3.3 kg) as assessed by dual-energy X-ray absorptiometry. A gain in muscle mass would be expected given the rigorous nature of basic training. The trainees’ diets also changed, with a significant reduction in total food intake and reduced fat in the diet, compared with their prerecruit diets. Levels of stress appeared elevated as indicated by chronically elevated levels of cortisol (near the upper limits of normal) and high levels of tension on the POMS, particularly during the earlier phases of training (Figures D-36 and D-37).
There were robust, highly significant correlations between mood and DHEA-S, substance P, FFA, and triglycerides (Table D-9) over the course of training. Plasma levels of fructosamine, which reflects average blood glucose levels for the last 17 to 21 days, thyroid-stimulating hormone, and substance P also were associated with mood states, but not as frequently or as robustly as DHEA-S, FFA, and triglycerides (Table D-9). When stepwise multiple linear regression analyses were performed, the most reliable predictor variables for mood were DHEA-S, FFA, and triglycerides. The extent of overall individual weight loss over the course of training was only associated with the mood state of vigor, with the greater weight loss associated with less vigor (r=−0.20, p< 0.02). Weight loss was often a statistically significant predictor variable in the multiple regression analyses, even though the correlations between weight loss and moods were modest ranging from±0.02 to 0.20. It also appeared that the predictive biochemical parameters were associated with a similar underlying factor, as they often were individually correlated. When these markers—FFA, triglycerides, fructosamine, and DHEA-S—were aggregated in multiple regression models with weight loss included as a predictor variable, ability to predict mood states was increased and r2 values as high 0.40 were obtained, indicating the regression model could account for 40 percent of the overall variance associated with certain mood states.
The magnitude of the relationships we observed between mood states and these biochemical markers, both as individual correlations and within multiple regression models, was surprising. We are not aware of any combination of putative physiological markers for mood or cognitive state where such robust asso-
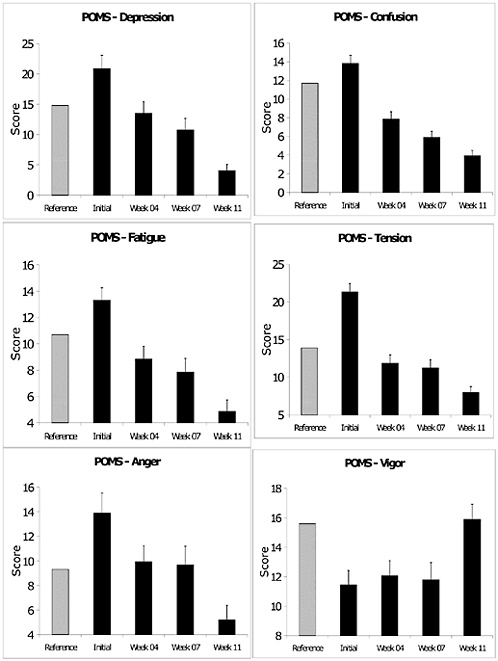
FIGURE D-36 Mean (+standard error of the mean) changes in mood state in female trainees as assessed by the Profile of Mood States (POMS) over the course of Marine basic training. A reference value for female college students, of approximately the same age as the trainees, is provided for comparison (McNair et al., 1971). Statistical significance over time, as determined by a within-subject analysis of variance, is provided.
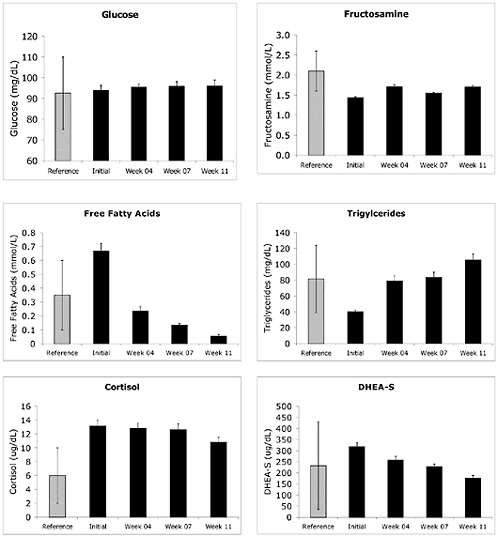
FIGURE D-37 Variation in mean (±standard error of the mean) plasma concentration of the indicated marker in female trainees over the course of Marine basic training. A reference value (±2 standard deviations) is provided for comparison. Whenever the data were available, the reference value is for females of approximately the same age. Statistical significance over time, as determined by a within-subject analysis of variation, is provided.
ciations have been observed in healthy individuals. The magnitude of the individual relationships between plasma markers and mood (many r values were in the range of 0.3–0.45, as shown in Table D-9) should be placed in the context of firmly established, clinically significant relationships between other biochemical markers and functional outcomes. Widely accepted markers of disease generally have only modest associations with the underlying disease state they predict. For example, the association of “ratio of high density cholesterol to total cholesterol” with the extent of coronary occlusion in patients with cardiovascular disease is only r=−0.20 (Naito et al., 1980).
The associations we have observed between these peripheral metabolic markers and cognitive state during Marine basic training are of the same magnitude as those we had previously observed for the tryptophan/LNAA ratio in soldiers participating in the lightweight ration study discussed above. The tryptophan/LNAA ratio determines the rate of tryptophan transport across the BBB. Tryptophan, because it is a rate-limiting precursor of the neurotransmitter serotonin, serves a critical CNS need (Lieberman, 1999; Lieberman et al., 1997). It should be emphasized that many of the metabolites and hormones evaluated in the Marine basic training study, including glucose, corticotrophin-releasing factor, cortisol, and leptin which, based on their known associations with brain function, might have been expected to be associated with cognitive function, but were not (Table D-9).
CONCLUSIONS AND RECOMMENDATIONS
There are many obstacles associated with identifying biochemical markers of cognitive state. In the study we conducted with U.S. Army Rangers engaged in a brief, high-intensity field exercise, saliva cortisol, melatonin, and testosterone were not usually associated with performance and mood. However, the preliminary findings from the Marine basic trainee study we describe suggest that at least one endocrine factor (DHEA-S) and several metabolites associated with energy status are robust markers for cognitive state in female recruits during basic training. Of course, these associations may be unique to the gender of the volunteers or to the combination of physiological, nutritional, and psychological factors the basic trainees experienced. To determine if these relationships generalize to other populations, this study will have to be replicated and extended, including studies of males. Of particular interest will be whether cognitive performance, as well as mood, is associated with these biochemical markers. It will require a substantial effort to address these questions since it is more difficult to assess cognitive performance than mood state in large samples. Furthermore, the unique factors associated with basic training, especially the large changes in mood and biochemical state that occur, make attempts at replications in other populations of questionable validity. We believe that we observed these biochemical-behavioral relationships because we were evaluating individuals who had unusually robust changes in both metabolism and behavior. Rarely are
TABLE D-9 The Relationship Between Plasma Markers and Mood States During Marine Basic Training in Females
|
Plasma Marker |
Fatigue |
Confusion |
Depression |
Tension |
Anger |
Vigor |
|
Hormones |
||||||
|
Adrenocorticotropic hormone |
−0.22, 0.005 |
NSa |
NS |
NS |
NS |
0.19, 0.02 |
|
Cortisol |
NS |
NS |
NS |
NS |
NS |
NS |
|
Corticotropin releasing factor |
NS |
NS |
NS |
NS |
NS |
NS |
|
Dehydroepiandrosterone sulfate |
0.36, <0.001 |
0.45, <0.001 |
0.35, <0.001 |
0.44, <0.001 |
0.30, <0.001 |
NS |
|
Follicle-stimulating hormone |
NS |
NS |
NS |
NS |
NS |
NS |
|
Growth hormone |
NS |
NS |
NS |
NS |
NS |
NS |
|
Leptin |
NS |
NS |
NS |
NS |
NS |
NS |
|
Leutenizing hormone |
NS |
NS |
NS |
NS |
NS |
NS |
|
Neuropeptide Y |
NS |
−0.18, 0.02 |
NS |
NS |
NS |
0.23, 0.006 |
|
Progesterone |
NS |
NS |
NS |
NS |
NS |
NS |
|
Substance P |
0.18, 0.03 |
0.23, 0.005 |
0.23, 0.007 |
NS |
0.18, 0.03 |
−0.22, 0.01 |
|
Testosterone |
NS |
NS |
NS |
NS |
NS |
NS |
|
Thyroid stimulating hormone |
NS |
−0.15, 0.05 |
NS |
−0.18, 0.02 |
−0.20, 0.009 |
NS |
|
Free T3 |
NS |
NS |
NS |
NS |
NS |
NS |
|
T4 |
NS |
0.22, 0.006 |
NS |
0.18, 0.02 |
NS |
NS |
|
Metabolites |
||||||
|
Total cholesterol |
NS |
NS |
NS |
NS |
NS |
NS |
|
Free fatty acids |
0.22, 0.005 |
0.46, <0.001 |
0.24, 0.002 |
0.44, < 0.001 |
0.16, 0.05 |
−0.18, 0.02 |
|
Fructosamine |
NS |
−0.23, 0.003 |
−0.23, 0.003 |
−0.31,< 0.001 |
−0.22, 0.005 |
NS |
|
Glucose |
NS |
NS |
NS |
NS |
NS |
NS |
|
Glycated hemoglobin |
NS |
NS |
NS |
NS |
NS |
NS |
|
High-density lipoprotein |
0.21, 0.007 |
NS |
NS |
NS |
0.16, 0.04 |
NS |
|
Low-density lipoprotein |
NS |
NS |
NS |
NS |
NS |
NS |
|
Triglycerides |
−0.25, 0.001 |
−0.45, < 0.001 |
−0.35, < 0.001 |
−0.44, < 0.001 |
−0.29, < 0.001 |
0.19, 0.02 |
metabolic and cognitive changes of this magnitude observed in healthy individuals.
Acknowledgments: This work was supported by the U.S. Army Medical Research and Materiel Command (USAMRMC). Approved for public release; distribution is unlimited. The views, opinions, and/or findings in this report are those of the authors, and should not be construed as an official Department of the Army position, policy, or decision, unless so designated by other official documentation. Human subjects participated in these studies after giving their free and informed voluntary consent. Investigators adhered to AR 70–25 and USAMRMC Regulation 70–25 on the use of volunteers in research. For the protection of human subjects, the investigators adhered to policies of applicable Federal Law CFR 46. Citation of commercial organization and trade names in this report do not constitute an official Department of the Army endorsement or approval of the products or services of these organizations.
REFERENCES
Askew EW, Munro I, Sharp MA, Siegel S, Popper R, Rose MS, Hoyt RW, Reynolds K, Lieberman HR, Engell D, Shaw CP. 1987. Nutritional Status and Physical and Mental Performance of Soldiers Consuming the Ration, Lightweight or the Meal, Ready-to-Eat Military Field Ration During a 30 Day Field Training Exercise. Natick, MA: U.S. Army Research Institute of Environmental Medicine.
Bathalon GP, McGraw SM, Falco CM, Georgelis JH, DeLany JP, Young AJ. In press. Total energy expenditure during strenuous U.S. Marine Corps recruit training. Proceedings of the 51st Meeting of the American College of Sports Medicine. June 2–5. Indianapolis, IN.
Bellisle F, Blundell JE, Dye L, Fantino M, Fern E, Fletcher RJ, Lambert J, Roberfroid M, Specter S, Westenhofer J, Westerterp-Plantenga MS. 1998. Functional food science and behavior and psychological functions. Br J Nutr 80:S173-S193.
Dollins AB, Lynch HJ, Wurtman RJ, Deng MH, Kischka KU, Gleason RE, Lieberman HR. 1993. Effect of pharmacological daytime doses of melatonin on human mood and performance. Psychopharmacology 112:490–496.
Fine BJ, Kobrick JL, Lieberman HR, Marlowe B, Riley RH, Tharion WJ. 1994. Effects of caffeine or diphenhydramine on visual vigilance. Psychopharmacology 114:233–238.
Friedl KE, Moore RJ, Hoyt RW, Marchitelli LJ, Marinez-Lopez LE, Askew EW. 2000. Endocrine markers of semistarvation in healthy lean men in a multistressor environment. J Appl Physiol 88:1820–1830.
Jameison K, Dinan TG. 2001. Glucocorticoids and cognitive function: From physiology to pathophysiology. Hum Psychopharmacol Clin Exp 16:293–302.
Johnson RF, Merullo DJ. 2000. Caffeine, gender, and sentry duty: Effects of a mild stimulant on vigilance and marksmanship. In: Friedl KE, Lieberman HR, Ryan DH, Bray GA, eds. Pennington Center Nutrition Series, Volume 10: Countermeasures for Battlefield Stressors. Baton Rouge, LA: Louisiana State University Press. Pp. 272–289.
Lieberman HR. 1999. Amino acid and protein requirements: Cognitive performance, stress, and brain function. In: The Role of Protein and Amino Acids in Sustaining and Enhancing Performance. Washington DC: National Academy Press. Pp. 289–307.
Lieberman HR, Spring B, Garfield GS. 1986. The behavioral effects of food constituents: Strategies used in studies of amino acids, protein, carbohydrate and caffeine. Nutr Rev 44:61–70.
Lieberman HR, Askew EW, Hoyt RW, Shukitt-Hale B, Sharp MA. 1997. Effects of 30 days of undernutrition on plasma neurotransmitter precursors, other amino acids, and behavior. J Nutr Biochem 8:119–126.
Lieberman HR, Bathalon GP, Falco CM, Georgelis JH, Morgan CA III, Niro P, Tharion WJ. 2002a. The “Fog Of War”: Documenting cognitive decrements associated with the stress of combat. In: Proceedings of the 23rd Army Science Conference. Orlando, FL. December 2–5. Available at http://www.asc2002.com/manuscripts/I/IO-01.PDF.
Lieberman HR, Falco CM, Slade SS. 2002b. Carbohydrate administration during a day of sustained aerobic activity improves vigilance, assessed with a novel ambulatory monitoring device, and mood. Am J Clin Nutr 76:120–127.
McNair DM, Lorr M, Droppelman LE. 1971. Edits Manual for the Profile of Mood States. San Diego: Educational and Industrial Testing Service.
Moore RJ, Friedl KE, Dramer TR, Martinez-Lopez LE, Hoyt RW, Tulley RE, DeLany JP, Askew EW, Vogel JA. 1992. Changes in Soldier Nutritional Status and Immune Function During the Ranger Training Course. NTIS accession no. AD-A257 437. Natick, MA: U.S. Army Research Institute of Environmental Medicine.
Naito HK, Greenstreet RL, David JA, Sheldon WL, Shirey EK, Lewis RC, Proudfit WL, Gerrity RG. 1980. HDL-cholesterol concentration and severity of coronary atherosclerosis determined by cine-angiography. Artery 8:101–112.
Newhouse PA, Belenky G, Thomas M, Thorne D, Sing HC, Fertig J. 1989. The effects of d-amphetamine on arousal, cognition, and mood after prolonged total sleep deprivation. Neuropsychopharmacol 2:153–164.
Opstad PK. 1994. Circadian rhythm of hormones is extinguished during prolonged physical stress, sleep and energy deficiency in young men. Eur J Endocrinol 131:56–66.
Strachan MWJ, Deary IJ, Ewing FME, Ferguson SSC, Young MJ, Frier BM. 2001. Acute hypoglycemia impairs the functioning of the central but not peripheral nervous system. Physiol Behav 72:83–92.
Wilson JD, Foster DW, Kronenberg HM, Larsen PR, Williams WB, eds. 1998. Textbook of Endocrinology. 9th ed. Philadelphia: WB Saunders.
CIRCULATING PLASMA MARKERS OF COGNITIVE STATUS: ODORS AS BIOMARKERS
Gary K.Beauchamp, Monell Chemical Senses Center
Chemical signals (herein termed body odors or just odors) provide information on many characteristics of an organism and are involved in coordination and regulation of all aspects of behavior and physiology. Typically, body odors have been divided into two broad classes, those termed pheromones and all others. In the former category are included chemical signals that have evolved to convey very specific information, elicit specific behavioral and physiological responses, and are in principle rather simple chemically. Examples include odorants that elicit behavioral responses such as sexual attraction and aggression (often termed releaser pheromones) and those that elicit physiological responses such as estrus synchrony and sexual maturation (often termed primer pheromones). The other broad class (sometimes included in the pheromone category but at other times excluded) encompasses odors that signal information such as individual identity, age, emotional status, and health. However, both in practice and in principle, the distinctions between these two categories are often difficult to discern (Beauchamp et al., 1976; Wysocki and Preti, 1998). In the remainder of this paper, this distinction will be ignored.
Body odors have a number of inherent characteristics that should make them particularly useful for those interested in monitoring organic states of individual humans. First, many body odors evolved to communicate messages between individuals. As a consequence, these messages ought to be relatively unambiguous and difficult to falsify. Second, unlike many visual and auditory signals, odors often persist in the environment. Indeed, many species make use of this characteristic during territorial scent marking, such as dogs urinating on posts. Darwin noted that the odor on a handkerchief that he had rubbed on a scent gland of an animal persisted on the cloth for years in spite of repeated washings. Third, body odors often directly reflect physiological processes. For example, odors associated with stress have been suggested to arise from action of stress hormones on odor-producing body structures. Fourth, odors can be detected from a distance and hence noninvasively. It has often been noted that when a dog follows a scent of an individual person, it does not put its nose directly on the ground, but instead holds it above the presumed odor source. Finally, in principle, it ought to be relatively straight-forward to develop devices to detect and recognize specific chemical signatures indicative of particular physio-
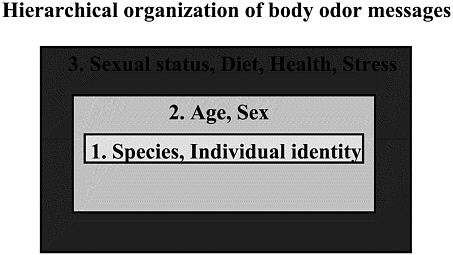
FIGURE D-38 Three levels of chemical signals derived from body odors illustrated by the mouse system. 1. Core messages largely innately determined and with little variation across the life span. 2. Messages that are relatively fixed but do vary in expression across the life span of the organism. 3. Messages that vary from time to time and may reflect short term physiological fluctuations.
logical states. In practice, however, this has remained a challenge as will be described below.
In the following brief paper, the kinds of information that exist in body secretions and excretions are discussed. Next, the possible use of body odor to identify messages signaling physiological states, such as stress, will be discussed. Finally, speculation on the future use of body volatiles in monitoring physiological status will be provided.
MESSAGES IN BODY ODOR
Work with body odors in nonhuman animals has clearly demonstrated that a variety of messages is transmitted and that these messages influence the behavior and physiology of the receiver. The categories of information are illustrated in Figure D-38.
Core Messages
Core messages (1. in Figure D-38) involve characteristics of the animal that are relatively fixed. Thus, animals are able to determine the species of the odor producer and its individual identity. For example, a large series of studies have
demonstrated that the individual identity of a mouse is coded in part by the genes of the major histocompatibility complex, the same genes involved in self-nonself recognition within the context of the immune system (Penn and Potts, 1998; Yamazaki et al., 1999). Presumably an individual mouse’s odor (and very likely an individual human’s odor as well) is a fixed characteristic of that animal. Based on these ideas, we are now attempting to identify the odorous materials in mouse and human emanations with a long-range goal of developing sensors that could recognize individuals by their genetically determined characteristic body odors.
Life Span Messages
At a second level (2. in Figure D-38) there are a number of messages that are relatively stable yet do vary over the life span of an individual. Two of these are age and odor-expressed gender. Consider gender first. Although basic biological gender is fixed at conception, many data indicate that body odors reflecting this do change over the course on an individual’s life. Most dramatic are odor changes that accompany sexual maturation. Indeed, in human males almost the first easily observable sign of male puberty is a change in body odor—this clearly precedes changes in body hair and voice. These changes clearly reflect changes in amounts of circulating sex hormones. As a practical example, it is well known that castration reduces male body odor in pigs, reducing “boar taint” in male pig meat.
In many species it has been speculated that information on the age of an animal may serve to modulate mate choice. Older males may be preferred mates due to the fact since they survived, they must possess “good” genes that are advantageous for the female to pass on to her offspring. Recently we (Osada et al., 2003) have identified some of the volatile chemicals in mouse urine that change with age and may underlie age-related discriminative odors. Several of these are plausibly linked to changes in immune function. This raises the possibility that immune system activity could be determined by sensors that detect body odors (see below).
Varying Messages
Finally, there is a series of odor-based messages that are quite variable (3. in Figure D-38). Included here is information on sexual receptivity or willingness to mate, incidence of disease, and emotional state. For example, many animal studies have documented changes in female odor as a function of estrus cycle, and there is some evidence that the body odors of women change over the menstrual cycle (independent of the odors associated with menses; Stern and McClintock, 1998). In nonhuman animals, female odors associated with sexual receptivity are often highly attractive to males.
That body odors can be indicative of disease has a long history in medical practice (Penn and Potts, 1998). Nevertheless, little systematic study of this topic has been conducted. For example, there are many anecdotes of dogs identifying the presence of cancers prior to formal diagnosis, but few experimental studies document this in a rigorous fashion.
As a first model system to investigate disease and body odor, we (Yamazaki et al., 2002) have recently reported on a model system: the mouse mammary tumor virus (MMTV). It is possible in this model to test for changes in odor profiles that arise prior to overt disease. Mouse mammary tumors are notably lacking in cachectic, metastatic, and other general systemic effects on the host that might be expected to alter body odor in a nonspecific manner. Our studies revealed that mice can be trained to discriminate female or male intact mice or their urine odors as a function of the presence of MMTV, either acquired through infection or genetically. Furthermore, odor distinction based on the presence of virus occurs in the absence of overt disease. We are currently investigating the chemical pattern change that occurs following infection and are attempting to identify biologically relevant odorants. More generally, however, these studies suggest that it may be possible to identify and diagnose certain diseases (e.g., viral diseases such as AIDS and smallpox) before they are otherwise obvious and via the relatively noninvasive route of body odors.
BODY ODORS INDICATIVE OF OTHER PHYSIOLOGICAL STATES
Very little experimental work has been conducted on odors indicative of emotion (e.g. fear, anger, happiness) or fatigue in humans. Nevertheless, there is a widespread belief that an individual’s emotional state is reflected in changes in body odor and this belief is reinforced by the results of some animal studies. For example, there are a number of studies that indicate that stressed animals emit a distinctive odor. It has been suggested that these odors may function to warn others of danger; these odors often elicit avoidance.
Anecdotal evidence in humans is consistent with animal studies. It is said that when one is under stress, sweating increases and this in turn leads to increases in body odor. Whether this purported change in odor is qualitative (new odorants being produced specifically indicating stress) or quantitative is not known. There is a plausible mechanism for a change in odor production with stress, however, since it is well known that certain neurotransmitters, such as epinephrine, stimulate heightened sweat gland activity.
As far as can be determined, there are no studies on changes in body odor with fatigue. Also, there is very little research on body odor changes with other emotional variations, with two exceptions. Chen and Haviland-Jones (2000) have reported that arousal of the emotions of happiness and fear by film clips results in production of body odors that can be discriminated by human noses. Similarly, Ackerl and colleagues (2002) have also reported that women made “fearful” by watching a scary movie produce an axillary odor that can be dis-
criminated (by other women) from axillary odors collected under nonfear conditions. These studies are admittedly tentative but in light of their implications, a number of investigators are following them up.
BODY ODORS AS SIGNALS: FUTURE PROSPECTS
Based on studies with nonhuman animals and much more limited work with humans, it is safe to say that body odor is a rich potential medium for monitoring physiological states. There are, however, a number of problems that make it difficult to put this potential into practice at the present time.
Production and Communication
The first problem is our current lack of definitive studies on what information human body odors contain. Such studies are difficult to conduct for a variety of reasons, but they are not impossible. It is encouraging that there is considerable interest now in the potential to identify individuals based on their body odors. Here it is assumed that there is a genetically based individual odor, but whether this can be reliably discriminated in spite of variation in such factors as diet, perfume use, and odors associated with home and work place remains a major question. Apparently dogs can discern the individual signature of a person in spite of these potential distracters indicating that, at least in principle, it should be possible for a device to do this as well.
Similar studies should be encouraged to determine further how odors reflect emotional states. The Chen and Haviland-Jones and Ackerl and colleagues work represent just the very beginning. Both of these investigations asked whether humans can make olfactory discriminations between samples of body odors based on the emotional state of the odor donor. Based on nonhuman animal work, it is highly likely that human stress induces specific odor changes, but this must be rigorously demonstrated before programs to try to identify specific odorants and to develop sensors are instituted. It is also important to recognize that for volatile signals indicative of emotional states to be useful for monitoring emotion, it is not necessary that human noses be able to detect these substances. More discriminative devices, be they other biological ones such as rats or dogs, or specialized nonbiological sensors (see below), may be able to detect these volatile signals and thereby serve as monitors, even if other people find these discriminations difficult or impossible.
Detection and Discrimination
A second major problem involves techniques to identify and monitor odorants. In nature the olfactory system has evolved to be astoundingly sensitive to small molecules. Recently, much progress has been made in our understanding of this system, although many mysteries remain. Briefly, it is now thought that
mammals have about 1,000 different molecular receptors for odorants (however, about two-thirds of these are not functional in humans). Each receptor, located on an individual receptor cell that is actually a primary sensory neuron, is responsive to a variety of structurally similar odorants (Zhang and Firestein, 2002). It is thus the pattern of receptor activity that is monitored and that determines odor quality and intensity. Processing and fine-tuning this pattern occurs beginning at the first synapse in the olfactory bulbs, but how further central nervous system processing occurs remains mostly unknown.
One strategy is to develop devices that mimic or even use biological principles to detect specific body odors. Particularly attractive is the idea that one might be able to express olfactory receptors in a device that monitors their activity using, for example, fluorescence to express overall patterned activity. This is a promising approach, but it clearly needs much more research.
A very active research area involves using a variety of artificial sensors to develop so-called e-noses, or artificial odor sensing devices. Although success of these devices has been mixed (initial claims turned out to be highly exaggerated), there is no doubt that progress is being made in sensors and sensor-interpretation interfaces. It seems likely that for highly accurate sensors, a knowledge of the specific odorants of interest will be needed. Hence, detector device development must go hand in hand with studies on the biology and chemistry of odors of interest.
CONCLUSIONS AND PROSPECTUS
Nonhuman animal studies confirm that body odors are a rich source of information about an organism. Human studies are few; nevertheless it is highly likely that our odors serve communicative functions. Because these odors presumably evolved to communicate, the messages should be much more readily useful for monitoring physiological states than, for example, hormones or metabolites from body fluids. In this latter case, multiple extraneous factors can obviously interfere with what is measured since there have been no evolutionary constraints to insure a high signal-to-noise ratio. For an evolved signal like an odor, in contrast, the signal-to-noise ratio should be high and the information content buffered against disruption from environmental and physiological variables. Consequently, additional work aimed at investigating odors for monitoring various physiological states is a very promising line of inquiry. Future work should reveal what information is available in body odor and the chemical identity of the odorants. In parallel, devices to accurately and reliably monitor these odors will be developed.
REFERENCES
Ackerl K, Atzmueller M, Grammer K. 2002. The scent of fear. Neuroeendocrinol Lett 23:79–84.
Beauchamp GK, Doty RL, Moulton DG, Mugford R. 1976. The pheromone concept in mammalian chemical communication: A critique. In: Doty RL, ed. Mammalian Olfaction, Reproductive Processes, and Behavior. New York: Academic Press. Pp. 144–160.
Chen D, Haviland-Jones J. 2000. Human olfactory communication of emotion. Percept Mot Skills 91:771–781.
Osada K, Yamazaki K, Curran M, Bard JA, Beauchamp GK. 2003. The scent of age. Proc R Soc Lond B Biol Sci 270:929–933.
Penn D, Potts WK. 1998. Chemical signals and parasite-mediated sexual selection. Trends Ecol Evol 13:391–396.
Stern K, McClintock MK. 1998. Regulation of human ovulation by pheromones. Nature 392:177–179.
Wysocki CJ, Preti G. 1998. Pheromonal influences. Arch Sex Behav 27:627–629.
Yamazaki K, Singer A, Beauchamp GK. 1999. Origin, functions and chemistry of H-2 regulated odorants. Genetica 104:235–240.
Yamazaki K, Boyse EA, Bard J, Curran M, Kim D, Ross SR, Beauchamp GK. 2002. Presence of mouse mammary tumor virus specifically alters the body odor of mice. Proc Natl Acad Sci 99:5612–5615.
Zhang X, Firestein S. 2002. The olfactory receptor superfamily of the mouse. Nature Neurosci 5:124–133.
MOLECULAR MARKERS OF MECHANICAL ACTIVITY/INACTIVITY INDUCED ANABOLIC AND CATABOLIC STATES IN STRIATED MUSCLE
Kenneth M.Baldwin, Fadia Haddad, Gregory R.Adams, University of California, Irvine
BACKGROUND
Striated muscle is highly plastic in that the individual cells or myocytes comprising this complex system have the capacity to change their mass, metabolic capacity, and contractile properties in accordance with the chronic functional demands (or lack thereof) imposed on it (Baldwin and Haddad, 2001). In the last 30 years, considerable evidence has accumulated to suggest that several key processes involving gene expression are closely linked in the regulation of both the amount and types of protein that are expressed in the muscle cells, thereby enabling them to adapt to various environmental stimuli (Adams, 2002; Baldwin and Haddad, 2001; Booth and Baldwin, 1996). Therefore, the goal of this report is to determine if different activity/inactivity paradigms can induce altered expression/activity in certain molecular markers (studied in an acute set-
ting) to predict long-term adaptations reflecting changes in either the phenotype and/or net protein balance (anabolic and catabolic states) in skeletal muscle.
Fundamental Concepts of Gene Expression
Figure D-39 presents a schematic of how the expression of a gene is typically regulated via collective molecular processes to produce a specific protein product. Through these processes as depicted for a single gene, it is now recognized that expression of a variety of genes could contribute collectively to the regulation of many fundamental processes occurring in the cell. These are illustrated by, but are not limited to, the following processes that are known to undergo dramatic alteration in their functional properties: (a) the contraction process (e.g., actin and myosin interaction); (b) aerobic and anaerobic energy transformations; (c) muscle growth regulation (growth factor expression); (d) protein synthetic pathways; and (e) protein degradation pathways. Also depicted are key steps in the cascade that interact to control the amount of protein that is expressed, depending on how each step in the cascade is regulated. These steps include transcription and pretranslational processes that combine to produce the message substrate (mature messenger ribonucleic acid [mRNA]) of the gene for producing the protein. The mRNA is then translated into protein, a process that is commonly referred to as protein synthesis. This process is known to be regulated by several important steps, the chief of which is at the “protein initiation” step. Also operating simultaneously are post-translational events, including the process whereby proteins become targeted for subsequent degradation. It should be noted that all proteins within the cell undergo turnover (synthesis and degradation). It is through this process of protein turnover that both the type and amount of protein expression in the muscle can be changed from one functional state to another.
Factors Defining Protein Balance in Muscle
Based on the above, it is apparent that the amount of the protein maintained in a given muscle cell is controlled by the balance of those processes that transcribe/translate a protein relative to those processes that regulate its degradation. When the muscle is in a stable steady state (e.g., neither growing nor atrophying), the synthetic processes are in balance with the degradation processes. However, when the muscle is exposed to stimuli that induce a net accumulation of protein (referred to herein as an anabolic state), the transcriptional/translational processes of the muscle must be greater than those operating on the degradation side. On the other hand, if the conditions are such that the transcript-
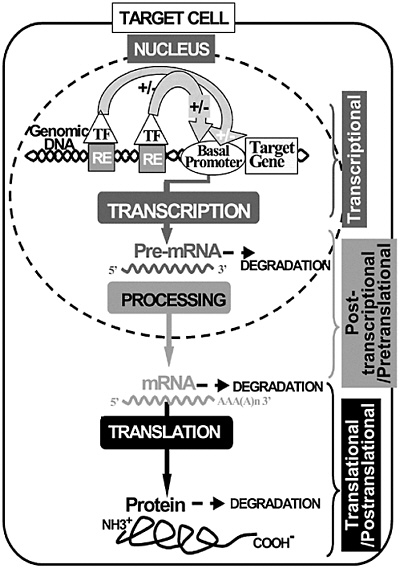
tional/translational processes cannot match those of degradation, then the muscle enters a state of catabolism, which results in net protein loss leading to its atrophy. Thus, it is important to note that all of the processes operating in the cascade can undergo altered rates of operation to thereby significantly influence the net protein balance in the muscle cell.
The Importance of Protein Isoforms
Coupled to this general scheme of gene/protein regulation is the fact that the genome of mammalian species contains a variety of multigene families. These consist of groups of very similar genes that encode slight variants of the protein product that have slightly different functional properties. An example of this is the myosin heavy chain (MHC) gene family, which collectively encode several different isoforms or species of myosin. Each isoform has distinct functional properties that ultimately dictate the intrinsic contraction properties (speed of contraction, fatigability) of the cells in which it is expressed. Depending on how this gene family is regulated in a given fiber, it is possible to repress one type of MHC gene and increase expression of another MHC type. This plasticity of gene expression enables the muscle to transform its intrinsic contractile properties. Thus, it is possible for the muscle to change both its size and its contraction phenotype depending on how the complex cascade in Figure D-39 is regulated from one functional state to another.
Signaling Pathways in Adaptive Processes
Presented in Figure D-40 is a complex array of processes/pathways that collectively operate to modulate those proteins/enzymes that coordinate the functional operation of the cascade depicted in Figure D-39. While it is beyond the scope of this short review to describe these signaling molecules and pathways in detail, it is important to emphasize that there are both upstream initiation factors (e.g., growth factors) and downstream effector proteins that regulate the integrated events governing transcription, translation, and degradation processes, thereby enabling the muscle cell to remodel its structure and functional properties. Importantly, this simplified scheme in no way reflects all of the signaling molecules and regulatory factors that control adaptive processes in striated muscle.
Activity Paradigms for Studying Adaptations in Skeletal Muscle: Animals Models
In this paper we will focus on three different activity/inactivity paradigms: (1) a model of chronic functional overload (FO) in which a smaller target muscle is continually overloaded due to the surgical removal of its larger synergist
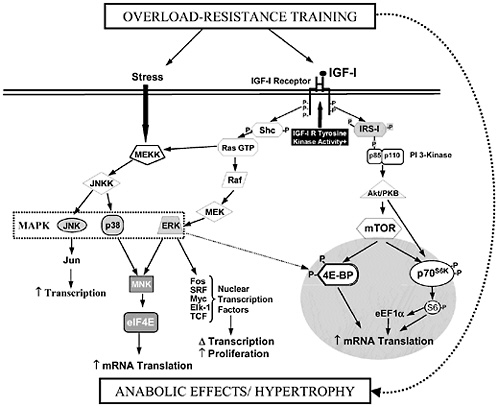
FIGURE D-40 Signaling pathways in adaptive processes.
(Adams et al., 2002); (2) intermittent resistance overload training (RT), in which the target muscle is trained with a specified contraction regimen spanning 1 or 2 training sessions (Haddad and Adams, 2002); and (3) the model of spinal isolation (SI) in which the target muscles are rendered almost completely inactive by midthoracic/sacral spinal cord transectioning that is coupled to a dorsal rhizotomy procedure. This procedure eliminates all sensory and higher center input to the motor unit pool of the lower extremity muscles, while keeping the muscle-nerve connections intact (Huey et al., 2001). This latter model, in essence, provides a “ground zero” catabolic reference state to which the anabolic mechanical overload paradigms can be compared.
METHODS AND MATERIALS
All the animal projects involved adult female rats. Functional overload and resistance training procedures were as described in detail elsewhere (Adams et al., 2002; Baldwin and Haddad, 2001; Haddad and Adams, 2002). The spinal isolation model involved surgical procedures as described by (Huey et al.,
2001). The biochemical/molecular analyses of marker protein phosphorylation, RNA concentration, and mRNA levels (via reverse transcriptase-polymerase chain reaction techniques) for specific genes were adapted from procedures described previously (Adams et al., 2002; Haddad and Adams, 2002). For comparative purposes, we report some initial findings (unpublished results) on humans that have undergone a combination of limb unloading plus resistance training in an attempt to ameliorate the atrophy that occurs in unloaded human skeletal muscle (Carrithers et al., In press).
RESULTS AND DISCUSSION
Early Events Leading to Net Protein Accumulation in Response to Mechanical Loading
Previous studies show that infusing physiological levels of insulin-like growth factor-1 directly into the muscle can induce significant hypertrophy within several days (Adams and McCue, 1998). The question is whether a mechanical stimulus, in and of itself, can induce rapid increases in muscle-derived IGF-1 expression in muscle thereby stimulating compensatory growth. If such a response occurs, it would suggest the involvement of an autocrine/paracrine process in the anabolic cascade following mechanical loading. As shown in Figure D-41, there is a rapid increase in mRNA expression for both IGF-1, and a variant isoform of IGF-1 (Adams et al., 1999, 2002) called mechanical growth factor in response to functional overload. This response occurs early in the adaptive response, and it is seen in both FO and isometric RT paradigms (Adams et al., 2002; Haddad and Adams, 2002; Huey et al., 2001) suggesting that growth factors are likely playing a key role in inducing anabolic responses in muscle under conditions that produce high mechanical stress on the muscle.
In addition to the response of growth factors, we also determined if there are rapid adaptive changes in the machinery that translates mature mRNA into protein (Figure D-39). Therefore, we examined levels of total RNA in skeletal muscle, since approximately 85 percent of the RNA pool exists as ribosomal RNA. Ribosomal RNA provides the scaffolding to which the mature mRNA is attached, providing the template for synthesizing the encoded protein. As shown in Figure D-42, there is a rapid increase in the concentration and content of total RNA in response to FO, suggesting that this is an important adaptive response to provide the machinery for producing more protein.
Based on the above observations, it is apparent that there are early events occurring to enable the muscle to enter into an anabolic state. Therefore, it was of interest to determine if adaptive changes occur in the pathways that are considered to be rate limiting steps in protein synthesis (e.g., the initiation steps in protein translation). We examined two different but complementary markers of this process. The first involves the phosphorylation of p70S6 kinase (pS6K). When this kinase is phosphorylated, it increases phosphorylation/activity levels of other proteins involved in the translation of mRNAs encoding proteins
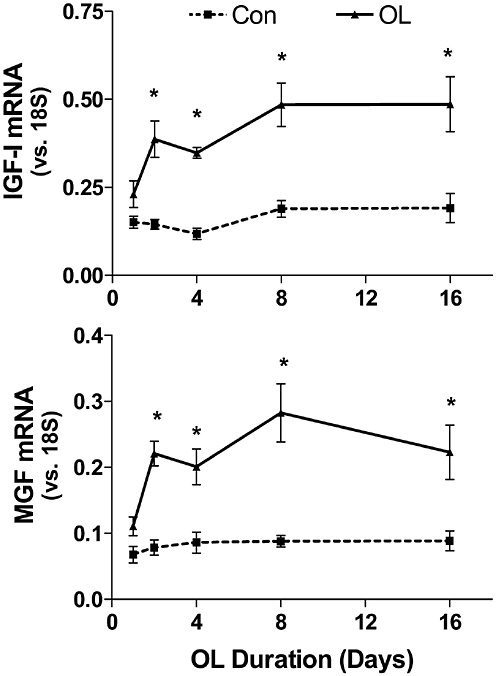
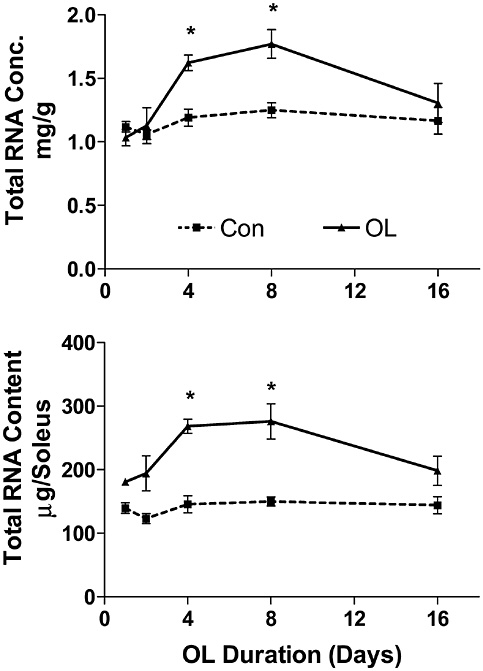
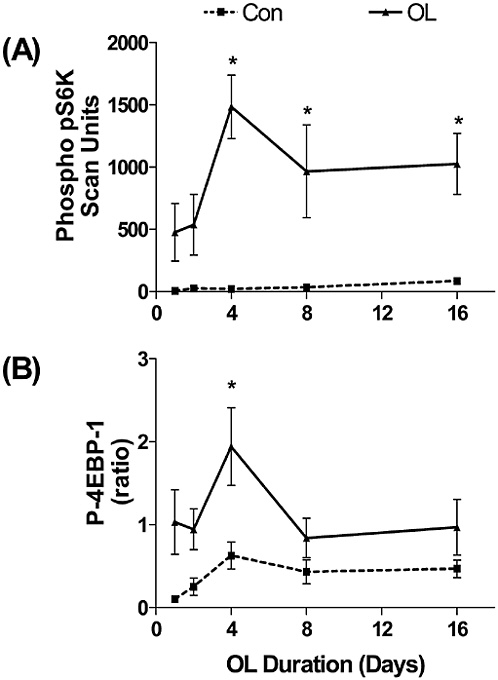
comprising the ribosomal machinery. As shown in Figure D-43A, there was a marked increase in the phosphorylation state of pS6K indicative that this pathway was activated. This observation is also consistent with the increase in total RNA presented in Figure D-42. Also, we examined the phosphorylation state of another marker of protein initiation (e.g., eukaryotic initiation factor 4E bind-ing protein, or 4EBP-1). This factor normally functions as a negative regulator of the formation of the 43 kD pre-initiation complex that is essential for protein translation. However, when 4EBP-1 undergoes increased phosphorylation, it dissociates from the protein, eIF4E, a key protein subunit that is necessary for the 43S complex to form so that the initiation process can occur. As presented in Figure D-43B, 4EBP-1 also undergoes increased phophorylation at the early stages of mechanical loading, which is also indicative that protein initiation processes are being activated. Thus, we have demonstrated that there are several molecular markers that can serve as early-event signaling molecules to predict that the muscle is entering a state of positive protein balance. All of the markers that have been identified above to predict that an anabolic state is occurring in response to functional overload show similar adaptive responses when the mechanical stimulus is intermittent, rather than continuous. For example, when isometric resistant training paradigms are imposed on the muscle, the muscle responds in a way similar to that seen in the functional overload paradigm (Haddad and Adams, 2002).
Early Responses of Molecular Markers During Muscle Atrophy
In response to anabolic stimuli, do inactivity paradigms that induce marked degrees of muscle atrophy cause the opposite responses of those markers presented above? The answer to this question appears to be negative, since some of the markers (IGF-1, p6SK, 4EBP-1) that are highly responsive to mechanical loading either are maintained at normal levels or show some level of increased expression or increased activity when the target muscles undergo rapid atrophy in response to SI (Haddad et al., submitted). Instead, there appears to be a different set of molecular markers that are highly sensitive to the unloading state. First, at the onset of muscle unloading, there is a decrease in the transcriptional activity of key genes that encode important structural/functional proteins that comprise the sarcomere machinery, that is, the system that produces contraction (e.g., myosin heavy chain and actin). This is depicted in Figure D-44, which shows that transcriptional activity of actin as well as the slow type I MHC gene (which predominates in load-sensitive muscle cells) are significantly reduced. Second, there is a reduction in total RNA and specific mRNA expression for both actin and total MHC. These responses are indicative of a reduction in both the substrate and the machinery necessary for carrying out translation of key proteins. Third, genes encoding enzymes that are involved in the process of protein ubiquitination are up-regulated (Figure D-45). These enzymes define the process whereby specific proteins become targeted for degradation by the
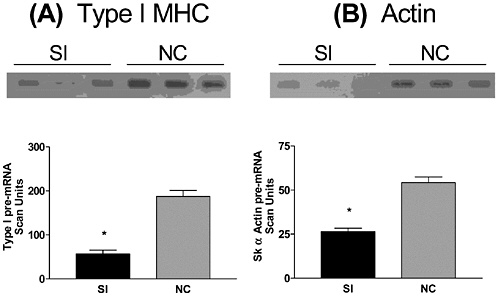
FIGURE D-44 Type I myocin heavy chain (MHC) (A) and actin (B) pre-mRNA expression in control and 8 days SI soleus muscle. Pre-mRNA is the nascent transcriptional product and changes in its expression represent changes in gene transcriptional activity.
proteasome system, which is the major pathway for protein degradation in muscle cells. These collective responses provide a mechanism to rapidly reduce muscle mass by decreasing the ability of the muscle to accumulate protein while increasing the processes for decreasing protein pools, thereby creating a catabolic state and net protein loss. Since those processes that regulate factors such as IGF-1 and the phosphorylation of pS6K and 4EBP-1 do not appear to be down-regulated, it is apparent that the loss of muscle protein is not necessarily the result of a “shutting down” of those processes that cause muscle cell enlargement. Thus, one must focus on a different set of molecular markers to distinguish a net catabolic state from that which defines a net anabolic state in predicting a protein balance profile of the muscle under different physiological conditions.
Do the Molecular Responses Seen in Animal Models Have Relevance to Adaptation in Human Muscle?
While there is abundant evidence that there are viable human models (e.g., resistance training, bed rest, and the unique model of unilateral limb suspension [ULLS] that can mimic, to a certain extent, the gross responses seen in animal models of hypertrophy and of atrophy), questions arise as to whether acute
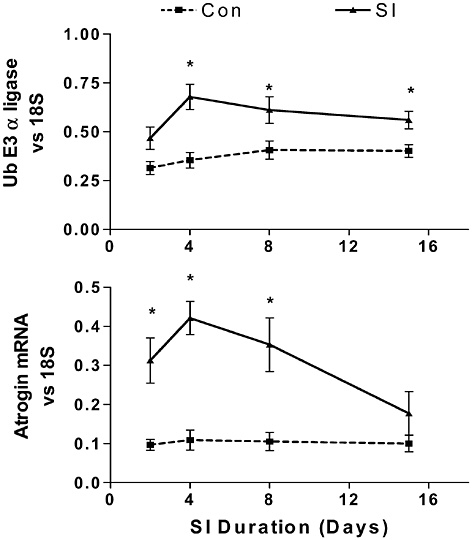
FIGURE D-45 Degradation marker mRNAs expression in soleus in response to SI.
changes in the mechanical stress imposed on human skeletal muscle induce the same type of responses as reported herein for rodent muscle. In an attempt to address this issue, we performed preliminary analyses in conjunction with Dr. Per Tesch at the Karolinska Institute in Stockholm (Carrithers et al., In press) on selected molecular markers in biopsy samples obtained from three groups of subjects (n=8 each): (1) a group subjected to ULLS for 3 weeks (left limb unloaded, right limb ambulatory), (2) a group of subjects subjected to ULLS plus a resistance training paradigm (Carrithers et al., In press), and (3) a group
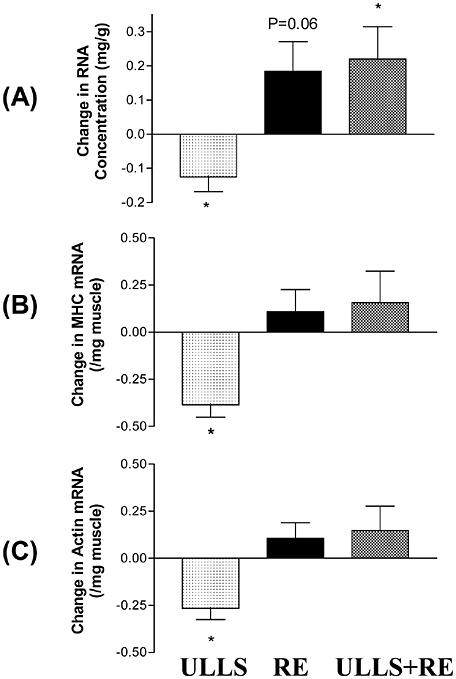
as seen for ULLS-trained group. The results indicated that the ULLS caused a of fully ambulatory subjects that received the same resistance training paradigm reduction in strength and muscle mass in the suspended limb. This response was attenuated in the ULLS plus resistance-trained group. The resistance training of the ambulatory subjects did not significantly enhance muscle mass or muscle strength beyond that which was observed for the ULLS plus trained group. Biopsies were obtained on each subject at the beginning and end of the experimental protocol. As presented in Figure D-46A, there was a deficit in the pre- and post-change in muscle total RNA concentration for the ULLS versus the two resistance-trained groups. Also there were net deficits in both the MHC and actin mRNA responses in the ULLS group versus that seen for the two resistance trained groups (Figures D-46B and D-46C). Thus, we propose that the same general adaptive processes that operate in the muscles of animal models also are seen in human subjects when they are exposed to perturbations that alter the homeostasis of the skeletal muscles under different loading states.
SUMMARY AND CONCLUSION
In this report we have demonstrated that skeletal muscle of both animal and human subjects possess a high level of plasticity (ability to change in response to altered environment) of gene expression in response to altered states of loading and/or mechanical stress. This phenomenon makes it possible to establish molecular marker profiles based on adaptive responses to acute disruptions in muscle homeostasis that predict impending alterations in catabolic and anabolic states that affect outcomes in the net protein balance in muscle cells. This information paves the way for the eventual development of technologies with the capability of monitoring the muscle’s molecular status for predicting outcomes to paradigms that may have either a positive or negative impact on the structure and function of the skeletal muscle system.
This research was supported by a grant from the National Space Biomedical Research Institute (NCC9–78–70) and National Institutes of Health grants AR 30346 (KMB) and AR 45594 (GRA).
REFERENCES
Adams GR. 2002. Autocrine/paracrine IGF-1 and skeletal muscle adaptation. J Appl Physiol 93:1159–1167.
Adams GR, McCue SA. 1998. Localized infusion of IGF-1 results in skeletal muscle hypertrophy in rats. J Appl Physiol 84:1716–1722.
Adams GR, Haddad F, Baldwin KM. 1999. The time course of changes in markers of myogenesis in overloaded rat skeletal muscles. J Appl Physiol 87:1705–1712.
Adams GR, Caiozzo VJ, Haddad F, Baldwin KM. 2002. Cellular and molecular responses to increased skeletal muscle loading following irradiation. Am J Physiol Cell Physiol 283:C1182-C1195.
Baldwin KM, Haddad F. 2001. The effects of different activity and inactivity paradigms on myosin heavy chain gene expression in striated muscle. J Appl Physiol 90:345–357.
Booth FW, Baldwin KM. 1996. Muscle plasticity: Energy demand/supply processes. In: Rowell LB, Shepherd JT, eds. American Physiological Society Handbook of Physiology: Section 12. Exercise: Regulation and Integration of Multiple Systems. New York: Oxford University Press. Pp. 1075–1123.
Carrithers JA, Tesch PA, Trieschmann J, Ekberg A, Trappe TA. In press. Skeletal muscle protein composition following 5 weeks of ULLS and resistance exercise countermeasures. J Grav Physiol.
Haddad F, Adams GR. 2002. Acute cellular and molecular responses to resistance exercise. J Appl Physiol 93:394–403.
Huey KA, Roy RR, Baldwin KM, Edgerton VR. 2001. Time dependent effects of inactivity on myosin heavy chain gene expression in antigravity skeletal muscles. Muscle and Nerve 24:517–527.


