
Appendix C
Detection Technologies
This appendix provides a synopsis of key items related to various widely used methods and technologies for the detection, isolation, enumeration, characterization, and identification of viruses, bacteria, yeasts, molds, and higher organisms in a variety of water samples.1 For more complete descriptions of detection technologies, readers should consult Standard Methods for the Examination of Water and Wastewater (APHA, 1998), Compendium of Methods for the Microbiological Examination of Foods (APHA, 2001), Automated Microbial Identification and Quantitation: Technologies for the 2000’s (Olson, 1996), Introduction to Bioanalytical Sensors (Cunningham, 1998), Biosensors (Eggins, 1996), Microarray Biochip Technology (Schna, 2000), DNA Microarrays and Gene Expression: From Experiments to Data Analysis and Modeling (Baldi and Hatfield, 2002), and a review article, “Rapid Methods and Automation in Microbiology” in the inaugural issue of Comprehensive Reviews in Food Science and Food Safety published by Institute of Food Technologists (Fung, 2002).
WATER SAMPLING METHODS AND TECHNOLOGIES
The most commonly used method for recovery and concentration of microorganisms in water involves filtration of various volumes through an array of different filter formats. Procedures frequently used for detection of indicator or
enteric bacteria in water involve filtration of 100 mL sample volumes through 0.45-μm-porosity, 47-mm-diameter nitrocellulose membranes and plating on selective media. Membrane filtration is commonly used for indicator microorganisms such as total coliforms, fecal coliforms, enterococci (fecal streptococci), and aerobic spore formers, and for detection of specific organisms or pathogens such as Escherichia coli, E. coli O157:H7, Shigella, Salmonella, Yersinia, and others. Membrane filtration of turbid surface water can be problematic and a labor-intensive Multiple Tube Fermentation method is often used. Detection of enteric protozoa and viruses requires analysis of much larger volumes of water than the 100 mL typically used for bacterial analysis because of their lower expected concentrations. In contrast to detection of enteric bacteria, conventional filtration approaches for protozoa and viruses require recovery of the organisms from the filtration matrix and further processing for analysis. Elution and dissolution of the filter matrix are commonly used. The selection of elution procedures and reagents is critical if cultural or infectivity assays are the end point analyses because some methods reduce the viability of the recovered organisms. Membrane dissolution methods often result in loss of infectivity, so these procedures are not suitable for assays in which viability or infectivity measurements are crucial.
Concentration methods for microorganisms in water have typically been optimized for a specific pathogen or at best for a limited number of related pathogens (i.e., the enteroviruses). Although there have been attempts to search for a single concentration method for an array of microorganisms in water, to date such efforts have produced mixed results. Development of new technology for concentrating pathogens in water is tedious and requires extensive testing with a variety of organisms and water matrices. Membrane concentration is perhaps the most explored concentration technique, and its advantages and disadvantages have been documented. Membrane concentration procedures are suitable for implementation in the field and for rapid throughput in the laboratory. Hollow-fiber and various ultrafiltration formats have been explored as sampling approaches for multiple bacteria, protozoa, and viruses in water (e.g., Sobsey et al., 1996).
Sampling Methods for Bacteria
Presnell and Andrews (1976) described a combined membrane filter-most probable number (MPN) procedure to increase the amount of water that could be passed (typically 4-5 L of surface water) through the membrane filter. The filters were subsequently washed and MPN analysis was conducted. Van Sluis and Yanko (1977) developed a concentration procedure at the County Sanitation Districts of Los Angeles County (CSDLAC) laboratory to detect the occurrence of Salmonella in disinfected effluents and receiving water. The procedure utilized Whatman glass-fiber filters overlaid with filter aid and a pressure filtration apparatus to concentrate 20-liter samples of surface water. The glass-fiber filter and filter aid were then emulsified in diluent. Salmonella were detected at concentra-
tions as low as 0.06 MPN per liter. These approaches suggest that reasonably simple procedures can be used to increase the potential detection of pathogenic bacteria in water.
Sampling Methods for Viruses
The most widely used virus sampling and concentration method for large volumes of surface, ground, or finished drinking water is adsorption-elution of virus from microporous filters. Although the pore sizes of the filters (0.2-8.0 μm) are considerably larger than the diameter of the viruses (20-90 nm), viruses are concentrated via adsorption mediated by electrostatic and hydrophobic interactions. However, if the viruses are associated with larger nonviral particles in the water, they will be mechanically strained out in the filter. The accumulated viruses are then desorbed or eluted from the filters with a small volume of eluent fluid. Viruses in this fluid may be assayed directly, but they are usually further concentrated by acid precipitation or by polyethylene glycol precipitation.
Two classes of adsorbent filters have been used to concentrate enteric viruses from freshwater and sewage effluents: negatively charged and positively charged filters. Negatively charged filters are more effective in virus concentration after the water is conditioned by decreasing the pH (3.5) and adding polyvalent cations. Positively charged filters (e.g., Virosorb 1MDS) are commonly used because they have the advantage of adsorbing viruses efficiently over a wide pH range without added polyvalent cations. Nonetheless, negatively charged filters are typically used for virus concentration in marine water. Adsorption-elution methods for virus concentration have limitations such as interference. Dissolved and colloidal substances in water, especially organic matter such as humic and fulvic acids, can interfere with virus adsorption to filters by competing with viruses for adsorption sites. In addition, adsorption-elution efficiencies depend on the enteric virus. For example, Sobsey and Glass (1980) reported overall virus recovery in 1.3 liters of dechlorinated tap water samples containing poliovirus 1, echovirus 1, and reovirus 3 using the electropositive Virosorb 1MDS filter at 57, 53, and 19 percent, respectively. Poliovirus concentration from 1,000 liters of water using Virosorb 1MDS filters is 48 percent with 108 plaque-forming units (PFU) of input virus and 24 percent with 200 to 400 PFU of input virus. Virus concentration efficiency will differ with the source of water. A determination of recovery efficiency for seeded virus in the sample water is recommended in the seventeenth edition supplement of Standard Methods for the Examination of Water and Wastewater (APHA, 1989b). Despite limitations, virus adsorption-elution from microporous filters is the method of choice for concentrating enteric viruses from large volumes of water.
Viruses concentrated on the adsorbent filters are eluted with beef extract at pH 9.5 followed by pH neutralization prior to assay or storage. Modifications to this procedure have generally involved alternative methods for concentrating vi-
ruses recovered in the beef extract eluent. Most modifications have been pursued to adapt this step for use in molecular-based assays. Although beef extract has been the eluent of choice for the past 15 years, it contains reverse transcription polymerase chain reaction (RT-PCR) inhibitors, and the inhibitory effect of beef extract is exacerbated during flocculation procedures for second-step virus concentration (Schwab et al., 1993). Alternative second-step concentration approaches include the use of precipitation agents such as polyethylene glycol and ProCipitate and/or antibody capture (Sobsey et al., 1996). Use of prescreened lots of beef extract and polyethylene glycol (PEG) precipitation for second-step virus concentration results in virus concentrates with lower PCR inhibitors. PEG precipitation has been found to be effective for polioviruses, hepatitis A, and noroviruses (Schwab et al., 1993). Nonetheless, PEG precipitation has to be optimized for the type of water to be assessed.
Various ultrafiltration procedures including tangential flow filtration, vortex flow filtration, and filtration through hollow fibers have also been used to recover and concentrate human viruses and coliphage indicators from up to 100 L of environmental water samples (Jiang et al., 2001). Nonetheless, each one of these approaches has to be optimized for compatibility with cell culture or molecular assays.
Sampling Methods for Protozoa
Early methods for recovering protozoa from water involved passing large volumes of water (up to 1,000 L) through polypropylene yarn-wound filter cartridges with a nominal porosity of 1 μm. More recently developed methods entail passing 10-1,000 L of water through 1-μm absolute porosity pleated membrane capsules, and subsequent concentration and purification of recovered protozoa by immunomagnetic separation (EPA, 1999; McCuin et al., 2001). Other filtration formats used for waterborne protozoa include flat membranes of various diameters (up to 293 mm) and composition (typically polycarbonate or cellulose acetate), compressed foam disks, and hollow-fiber ultrafilters (Clancy et al., 2000; Kuhn and Oshima, 2001).
CONVENTIONAL AGAR PLATE METHOD, MPN METHODS, AND IMPROVED METHODS FOR MONITORING MICROORGANISMS IN WATER
Viable Cell Count Methods and Related Technologies
Viable Cell Count
Use of selective and nonselective agars for growing live bacteria, yeasts, and molds requires water sampling, sample dilution, application of samples into petri
dishes, pouring melted agar, incubation of solidified agar samples for a specified time at a specified temperature, and enumeration of colony forming units (CFU) per milliliter depending on the agar used and on the color, shape, size, and fluorescence characteristics of the microorganisms. Further tests of a group or type of microorganism in the water sample (i.e., total viable count, coliform count, fecal coliform count, streptococci count, enterococci count, Clostridium perfringens counts) can also be determined. Indeed, myriad combinations of selective and non-selective agars, time and temperature of incubation, aerobic versus anaerobic conditions, volume of sample plated, amount of agar and so forth have been used in performing viable cell counts of water. Standard Methods for the Examination of Water and Wastewater (APHA, 1989a) was published to provide consistency of methods between laboratories nationally and, hopefully, internationally (see also Chapter 5 for further discussion).
Improvements of the Conventional Viable Cell Count Method
These methods were developed for efficient operation of the conventional viable cell count method. Many of the methods described here were validated by the Association of Analytical Communities (AOAC International, 2002), a volunteer organization that approves proposed new methods, such as the following:
-
Spiral Plating Method (Spiral Biotech, Bethesda, Md.), an automatic plating system on surfaces of agar;
-
ISOGRID System (Neogen Incorp., Lansing, Mich.), a membrane filtration system;
-
Petrifilm System (3M Co., St. Paul, Minn.), a rehydratable self contained film system;
-
Redigel System (3M Co., St. Paul, Minn.), a system that uses pectic gel instead of agar;
-
SimPlate System (BioControl, Bellevue, Wash.), a system that uses a round plastic plate with multiple wells as chambers for growth of microbes; and
-
Fung’s Double Tube, a system for cultivation and enumeration of anaerobic bacteria, especially for Clostridium perfringens from food and water (Fung and Lee, 1981).
“Real-Time” Instruments for Viable Cell Count
Viable cell counts can be made with the following real-time instruments:
-
direct epifluorescent filter technique involves vital dyes to stain live bacteria for obtaining viable cell counts in about one hour using fluorescent microscopy;
-
Chemunex Scan RDI system (Monmouth Junction, N.J.) filters cells on a membrane, stains cells with vital dyes, and then reads the viable cells after 90 minutes in a scanner; and
-
MicroStar System (Millipore Corp, Benford, Mass.) utilizes adenosine 5′-triphosphate (ATP) bioluminescence to report microcolonies in a few hours.
Miniaturized Viable Cell Count Methods Using Microtiter Plates and Spot Plating
Miniaturized methods have been developed to reduce the volume of reagents and media used and include the following:
-
loop dilution and spot plating of liquid sample on agar surfaces; and
-
automated pipette for dilution and spot plating liquid sample on agar surfaces.
Most Probable Number Method
The MPN method is a reliable but laborious method that has been used internationally for about 100 years for coliform enumeration in water. Developments are continuously being made to miniaturize, automate, and computerize the conventional MPN system.
Conventional Five-Tube and Three-Tube MPN Method
Water samples (10 mL, 1 mL, and 0.1 mL) are placed in a series of five tubes or three tubes with nutrients and incubated for a specific time and temperature. Following incubation, the tubes with turbidity and/or gas are recorded and the MPN values are read from established five-tube or three-tube MPN tables.
Miniaturized MPN Modifications in Microtiter Plates
Miniaturized MPN modifications in microliter plates include the following:
-
Loop dilution of samples in the wells with nutrients to obtain three-tube MPN (Fung and Kraft, 1969); and
-
Automated pipettes to dilute samples in wells and an automated microtiter plate reader and computer to record and interpret MPN of water sample (Irwin et al., 2000; Walser, 2000).
Instrumental Methods for Estimation of Viable Cell Count
Many instruments were developed to measure microbial growth in water
samples by monitoring changes such as ATP levels, appearance of specific enzymes, pH, electrical impedance, conductance, capacitance, generation of heat, carbon dioxide, consumption of oxygen, and so on. To obtain useful information, these aforementioned parameters must be related to viable cell count of the same sample series. In general, the larger the number of viable cells in the water sample, the shorter is the detection time of these systems. A scattergram of cells versus detection time is generated that has an inverse slope. By comparing the detection time generated by the microbes of a water sample in these instruments, the initial population can be estimated from the scattergram. The assumption is that as the number of microorganisms in the sample increases, their physical, biophysical, and biochemical activities will also increase. These methods are not suitable for nonviable cells, as injured cells will take much longer to develop a detectable population. The following are selected examples of these instruments.
Impedance and Conductance Methods
Instruments that measure the change of impedance, conductance, or capacitance of the liquid over time as microbes grow include the following:
-
Bactometer (bioMerieux, Hazelwood, Mo.), which measures impedance;
-
RABIT system (BioScience International, Bethesda, Md.), which measures impedance; and
-
Malthus System (Crawley, U.K.), which measures conductance.
ATP Methods
Instruments that measure the increase of microbial ATP over time include the following:
-
Lumac (Landgraaf, the Netherlands);
-
Biotrace (Neogen, Lansing, Mich.);
-
Lightning (BioControl, Bellevue, Wash.);
-
Hy-Lite (EM Science, Darmstadt, Germany);
-
Charm 4000 (Charm Sciences, Malden, Mass.);
-
Celsis System (Cambridge, U.K.);
-
Zylux (Maryville, Tenn.); and
-
Profile (New Horizon, Columbia, Md.) among others.
A common problem with these systems is the inability to separate background ATP from microbial ATP and to distinguish one type of microbe (e.g., bacteria) from another type (e.g., yeasts) in the same sample.
Turbidity and Color Measurements
Instruments that measure turbidity change or color change include the following:
-
Omnispec Bioactivity Monitor System (Wescor, Inc., Logan, Utah), which measures tri-stimulus reflectance colorimetry by monitoring dye pigmentation changes mediated by microbial activities in the water along with appropriate dyes; and
-
BioSys (BioSys, Ann Arbor, Mich.), which measures the color change of an agar plug at the bottom of a chamber containing nutrient, dye, and the water sample; the uniqueness of the system is that the color compounds developed during microbial growth are diffused into the agar plug and the automatic measurement of color change by the instrument is done without the interference of particles in the sample.
Measure of Gases
Instruments that measure specific gas development include the following:
-
Bactec (Johnston Laboratories, Inc., Cockeysville, Md.), which measures carbon dioxide gas developed by microbial growth in the liquid samples by infrared measurement or radioactivity; and
-
BacT/alert Microbial Detection System (Oragnon Teknika/bioMerieux, Hazelwood, Mo.), which measures carbon dioxide development in a liquid sample using a sensor that changes color as carbon dioxide reaches a defined concentration.
IDENTIFICATION AND CHARACTERIZATION OF MICROOORGANISMS FROM WATER
A comprehensive discussion of this subject is beyond the scope of this appendix because there are literally thousands of physical, chemical, biochemical, serological, and immunological tests for the identification and characterization of microorganisms isolated from water. The conventional single-tube test method has largely been replaced by many diagnostics kits developed in the past 30 years. Moreover, many of these tests have been automated, and identification procedures have been computerized to increase the efficiency of operation and eliminate human errors. The following sections briefly identify and describe some detection methodologies for pathogens and indicator organisms that can be considered innovative.
Immunochemical Techniques
A powerful scheme for detecting specific antigens, including both soluble proteins and whole microorganisms, is immunoassays. In this approach, antibodies (either polyclonal or monoclonal) are obtained with specificity toward a particular antigen. The only limitation of this approach is that the antigen must possess a molecular weight greater than 1,000 Daltons. There are a wide variety of different formats for immunoassays. The most useful and sensitive may be the enzyme-linked immunosorbent assay (ELISA; see Figure C-1). In this approach, a first antibody is immobilized on a surface. When a sample containing a particular antigen is exposed to this surface, it binds with a high degree of specificity to the immobilized antibody. After the residual sample is washed to remove any non-specifically bound material from the surface, a second antibody with specificity toward the same antigen, but for a different epitope (binding site), is exposed to the substrate. The second antibody has an enzyme or other group conjugated to it. If the second antibody contains the latter, subsequent exposure to a third solution will direct an enzyme to the complex. The end result is the formation of a “sandwich” in which the initial binding to the first antibody results in the
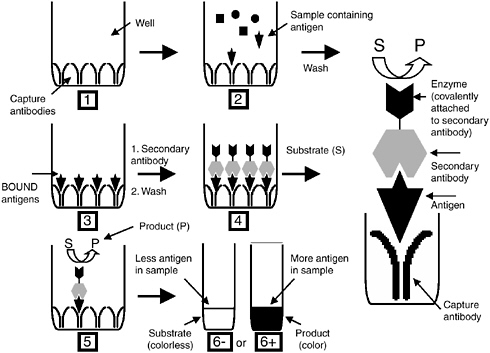
FIGURE C-1 Overview of the ELISA assay.
attachment of an enzyme reporter. A fluorogenic or chromogenic substrate solution is then added to the surface with an appropriate buffer. The intensity of color or fluorescence that forms is proportional to the amount of antigen present in the initial sample.
In addition to immunoassays, immunohistochemical approaches can be used to detect pathogens. In this method, an antibody conjugated to a fluorescent dye is incubated with a sample. The antibody is selected to bind to a particular hapten (site) on the cell, phage, or particle of interest. If binding occurs, the antibody labels the cell so that the cell can be detected more readily. In some cases, multiple labels are employed to label several agents of interest simultaneously. Specific labeling or patterns of labeling can be used to differentiate between cell types.
Nucleic Acid Detection
Genetic methods, based on DNA or RNA analysis, have been rapidly developing in all areas of applied microbiology which include food, clinical, industrial, environmental, and water in the past 20 years.
DNA Sequences
A variety of strategies can be employed for DNA sequence analysis. The simplest approach, analogous to a single sensor, would employ a unique sequence characteristic of the organism of interest. Such an approach would enable the user to identify the pathogen unequivocally because its sequence would not appear in any other organism. The success of this strategy relies on the sequencing of a large number of both pathogenic and nonpathogenic organisms to build up a sufficient database to enable sequence selection. An alternative approach would involve the examination of multiple sequences spread over the genome. In this approach, multiple single nucleotide polymorphisms (SNPs) would be examined. The pattern of expression of the SNPs enables the unique identification of the particular species and strain. This approach can potentially identify patterns of expression that distinguish pathogens from nonpathogens; such distinction would allow development of alarm-type sensors that are based on identifying what the microbe will do rather than what strain or species it is.
Another approach that combines the two methods described involves identifying specific loci with several alleles at each locus. By measuring the expression of the various alleles at a number of loci, it should be possible to generate a unique pattern, a genetic fingerprint or barcode, to minimize the number of regions of the genome that would be examined.
There are various methods for conducting DNA analysis. Sequencing is performed by commercially available instruments. These instruments operate on the basis of a four-color labeling reaction (one color for each base) and read out the
sequence from the migration patterns of the DNA sequencing reaction after the reaction products are separated on a polymer gel. They are robust, high-through-put instruments that were used in sequencing the human genome. Although these instruments are fully automated, the time between sample collection and sequence analysis tends to be long. Thus, they are useful primarily for obtaining de novo sequence data rather than for diagnostic or routine analyses.
Once sequence data are available, there are a variety of ways to determine whether a specific sequence is present. DNA arrays operate on the basis of hybridization. These arrays are referred to as microarrays or gene chips (see more below). They are prepared by attaching a single-stranded DNA sequence, the probe, to a surface. Platforms that exist for attaching DNA include photolithographic arrays, spotted arrays, fiber-optic arrays, nanoparticle arrays, and electro-chemically addressable arrays. The operating principle for all of these platforms is the same. If the target sequence of interest is present in the sample, it hybridizes via Watson-Crick nucleotide base pairing (i.e., to the complementary probe DNA sequence attached to the surface). The stringency of hybridization conditions can be adjusted so as to enable hybridization only to the perfectly complementary target sequence, and even a single-base mismatch in the DNA target will not result in binding to the array. By attaching many different probe sequences to the array, it is possible to interrogate many (up to hundreds of thousands) sequences simultaneously. In order to detect DNA from a sample, it is first necessary to perform a series of purifications and amplifications. In the purification step, cells must be disrupted and the cell debris, including proteins and membrane fragments, must be removed to isolate the nucleic acid fraction.
DNA is amplified via PCR, which expands the sequences of interest exponentially while all the other sequences grow arithmetically. During the amplification step, specific primers are employed that bracket the DNA sequence to be amplified. These primers often have fluorescent dyes attached to them so that the amplified sequences become labeled for easy detection. Other methods of amplification include rolling circle amplification, ligase chain reaction, and strand displacement assays. The two important aspects of amplification are (1) provision of a detectable amount of DNA sample to employ for subsequent analysis and (2) provision of a specific selection step so that only the specific DNA sequence(s) of interest is amplified.
Basically, a DNA molecule (double helix) of a target pathogen (e.g., Salmonella) is first denatured at about 95°C to form two single strands, then the temperature is lowered to about 55°C for two primers (small oligonucleotides specific for Salmonella) to anneal to specific regions of the two single stranded DNA molecules. The temperature is then increased to about 70°C for a special heat stable polymerase, the TAQ enzyme from the thermophilic microorganism Thermus aquaticus, to add complementary bases (A,T,G,C) to the single-stranded DNA molecule and complete the extension to form a new double strand of DNA. This is called a thermal cycle. After this, the tube is again heated to 95°C for the
next cycle. After one thermal cycle, one copy of DNA will become two complete copies. After about 21 cycles and 31 cycles, 1 million and 1 billion copies of the DNA will be formed, respectively (see Figure C-2). The entire process can be accomplished in less than an hour in an automatic thermal cycler. After PCR reactions are complete however, one still needs to detect the presence of the PCR products to indicate the presence of the pathogen.
The first generation of the BAX system for screening family of PCR assays for pathogens (Qualicon, Inc., Wilmington, Del.) used the time consuming and laborious electrophoresis to detect PCR products. Recently, the new BAX system combines DNA amplification and automated homogeneous detection to determine the presence or absence of specific targets like Salmonella. All primers, polymerase, and bases necessary for PCR as well as a positive control and an intercalating dye are incorporated into a single tablet. The system works directly from an overnight enrichment of the target organisms and no DNA extraction is necessary. Assays are available for Salmonella, E. coli O157:H7, Listeria monocytogenes, and Campylobacter jejuni/coli. The system uses an array of 96
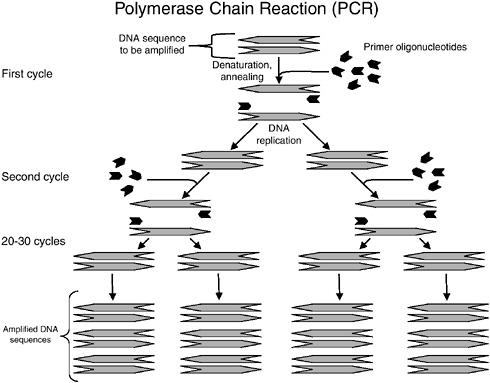
FIGURE C-2 Overview of polymerase chain reaction.
blue light emitting diodes (LEDs) as excitation sources and a photomultiplier tube to detect the emitted fluorescent signal. The integrated system improves the ease of use of the assay and thus, no electrophoresis of PCR products is necessary in this new version of BAX. Notably, a BAX system that detects waterborne Cryptosporidium parvum is commercially available.
So called “real time PCR” is a solution method in which a fluorescent signal grows in solution if the target sequence is present. It relies on the use of fluorescent molecules and has the ability to directly measure the amplification products while amplification is taking place. The more target DNA in a broth, the sooner the number of PCR products will reach the detection threshold and be detected since fewer thermal cycles are needed compared with a broth with less target DNA. Thus, the methods are not “real time” per se because it still takes time to reach the threshold for a particular fluorescence level to be detected.
In one manifestation of real time PCR, called TaqMan (Applied Biosystems, Foster City, Calif.), a DNA polymerase enzyme abbreviated Taq obtained from a thermophilic organism is employed. TaqMan possesses exonuclease activity and the TaqMan probe (20-30 base pairs) hybridizes to its complementary target sequence (if present), and consists of a site-specific probe sequence labeled with a fluorescent reporter dye and a fluorescent quencher dye. During the PCR reaction, the hybridized probe is degraded due to the exonuclease activity of the Taq polymerase, thereby separating the quencher from the reporter during extension and resulting in an increase in the fluorescence intensity of the reporter dye. During the PCR amplification, the light emission from the reporter increases exponentially if the target sequence is present—the final level being measured by spectrophotometry after termination of the PCR. Because amplification occurs only in the presence of a particular target sequence, TaqMan assays are of particular value for the detection of specific sequences and are useful for waterborne pathogen detection.
Another real time PCR system called molecular beacon technology (iQ-check system by Bio-Rad, Hercules, Calif.) is now available and all reactions are performed in the same tube. A molecular beacon is a tailor-made hairpin-shaped hybridization probe that is used to specifically bind to target PCR products as it becomes amplified during PCR reactions within the system. On one end of the probe is attached a fluorophore and on the other end a quencher of the fluorophore is attached. In the absence of the target PCR product the beacon forms a hair-pin shape and there is no fluorescence due to quenching of the fluorophore by the quencher. However, during PCR reactions and the generation of target, the beacons will bind to the amplified target and cause the hair-pin molecule to unfold. As the quencher moves away from the fluorophore, fluorescence will occur and can be measured when a threshold of fluorescence is reached. Again, the more target DNA in the broth, the shorter will be the detection time of fluorescence. By using molecule beacons containing different fluorophores, one can detect different PCR products in the same reaction tube, thus performing “multiple” tests of
several target pathogens such as Salmonella, E. coli O157:H7, and Listeria monocytogenes in the same broth.
Advantages of real-time PCR in food and water quality monitoring include faster results, no post-PCR analysis, fewer handling steps, no risk of contamination due to a closed tube analysis, and multiplexing capability. Traditional PCR requires thermal cycling to amplify DNA molecules. An isothermal system called nucleic acid-sequence based amplification (NASBA) has recently been developed which has other advantages over the traditional PCR technologies. Since the target is RNA, NASBA can be used to detect RNA viruses and functional mRNA targets.
Conducting multiple PCR reactions enables the simultaneous interrogation of specific nucleic acid sequences, thereby providing excellent specificity for many different microorganisms of interest. Nucleic acid technologies are becoming increasingly sophisticated and powerful tools for applied microbiology and the detection of waterborne pathogens and indicator organisms.
Microarray Technology
Recently, much attention has been directed to the field of “gene chips” and “microchips,” in which microarrays of sensors or detection elements are used to detect a great variety of molecules including waterborne and foodborne pathogens and indicator organisms (Ramsay, 1998). Because of ongoing advances in miniaturization technology, as many as 50,000 individual “spots”—with each spot containing millions of copies of a specific DNA probe—can be immobilized on a specialized microscope slide or other substrate. Fluorescently-labeled targets can be hybridized to these spots and be subsequently detected. Microarray technology has been recently discussed as a method for mass testing and diagnostics for viruses and intestinal bacteria in various clinical samples (Petrik, 2001; Sengupta et al., 2003; Wang et al., 2002a,b; Wilson et al., 2002).
Environmental applications of microarray technology have also emerged in recent years. Chips for the detection of a variety of bacteria have been developed which exploit the sequence variability inherent in rDNA, spacer region, and virulence and functional genes, which can help with the identification (taxonomy) of bacteria to the genus and species. The key to these advances has been the validation of these types of microarrays for some 15 groups or genera/species of targeted bacteria (Denef et al., 2003). Addressing functional genes via microarray technology, important specifically for environmental Pseudomonas, has also been recently reported (Musarrat and Hashsham, 2003). Recent and forecasted advancements in microarray technology will help make these detection technologies increasingly applicable to the identification and study of waterborne pathogens and indicator organisms.
Ribotyping
Ribotyping involves isolating DNA from a particular microbial strain and fragmenting it with a restriction endonuclease. The resulting DNA is run on a gel, and then probes containing rRNA gene sequences are used to label the gel. The gel labeling pattern can then be used to identify the strain.
Pulsed-Field Gel Electrophoresis (PFGE)
PFGE is similar to ribotyping in that DNA is separated on a gel and labeled. In PFGE, entire chromosomes are separated on the basis of their molecular weights, and the gel pattern distinguishes the different strains from one another.
A newer method for performing DNA fragment analysis involves capillary electrophoresis. In this approach, a glass capillary is employed and the surface charge on the glass serves to separate different DNA lengths from one another. As the different DNA strands elute from the capillary, they are exposed to a laser and the time of elution can be correlated with their position on a hypothetical gel. Capillary electrophoresis systems are much faster than traditional gel-based electrophoresis. In addition, they are amenable to implementation in “lab-on-a-chip” devices.
Mass Spectrometry
An important new area for pathogen detection is mass spectrometry. In this approach, samples, including whole viruses or bacteria, are introduced into the mass spectrometer and ionized and the fragmentation pattern is detected. The ability to detect macromolecules is enabled by developments in sample introduction through ionization including matrix-assisted laser desorption/ionization (MALDI) and electrospray ionization (ESI). The fragmentation pattern, or characteristic peaks in the mass spectrum, provides signatures for the organisms of interest (Demirev, 2001a,b).
Miscellaneous Methods
Aptamers
A recent addition to the armament of specific receptors is the use of aptamers. These materials are isolated from combinatorial oligonucleotide libraries. Antigens are immobilized on a solid support and panned with the oligonucleotide library. Those oligonucleotides that bind with any affinity are retained on the support and those with no binding affinity are washed away. The retained oligonucleotides are displaced from the support, amplified, and panned iteratively, with the higher-affinity binders being preferentially retained and expanded at each
step. After several iterations, the oligonucleotides with the highest affinity are isolated, amplified, and sequenced. The resulting aptamers are oligonucleotides (RNA or DNA) that have affinities for the antigen in the micro- to nanomolar range.
Phage Display Libraries
A similar approach employs phage libraries. Phage libraries have combinatorial peptide libraries inserted into a protein that is expressed on the surface of the phage particle. Each phage contains only one peptide insert. Using a similar affinity panning procedure to the one described above for aptamers, successive iterations of binding and expansion of the bound phage lead to high-affinity binders.
Both aptamers and phage display approaches provide new binding receptor entities around which assays can be developed.
Sensors and Sensor Strategies
Sensors collect data and provide information. The information required determines the complexity of the data that must be collected as well as the output of the sensor. If a simple yes or no answer is required, indicating the presence or absence of a particular analyte, the sensor would operate in a fashion akin to a smoke alarm. An example of an alarm sensor would be a trigger sensor employed for detection of various biological agents. Triggers used for bio-detection typically comprise an ultraviolet light source used to excite an air or water sample. Fluorescence emitted by the sample in a particular spectral region signifies the presence of a biological material such as bacteria or spores. Such a sensor is not specific and gives a reading for virtually any biological material. A positive reading causes a sample to be taken and analyzed more thoroughly, hence the word “trigger.”
As more information is required, the sophistication of the sensor increases. It may be necessary to determine only that a particular species is there. For example, the presence of a highly infective pathogen would have no threshold concentration; it would be important to know whether or not it was present in the sample. On the other hand, the presence of a particular species may be insufficient information and the abundance of the particular species may be required. Quantitative measurements are critical for most environmental samples in which thresholds are set and regulated. Thus, as one moves from alarm sensors, through sensors that tell one what is there, to sensors that quantify how much of a substance is present, the sophistication of the measurement increases.
Chemical sensors operate on the basis of four generic transduction mechanisms including electrochemical, optical, thermal, and mass measurements. Sensors generally consist of a selective binding layer coupled to a transducer. The
binding layer provides selectivity and specificity for the sensor, and the transducer measures a signal resulting from the binding event.
Most sensors are designed using the traditional biological paradigm in which a receptor binds a ligand and generates a signal, referred to as transduction. Many receptor classes exist including ionophores, dyes, and chemically designed binding agents. Developing receptors for the plethora of analytes constitutes a major field of endeavor and is broadly categorized as molecular recognition.
Biosensors employ a biological recognition element such as an enzyme, DNA sequence, receptor, or antibody to perform the recognition and are powerful tools in applied microbiology. Ivnitski et al. (1999) provided a comprehensive overview of different physicochemical instrumental techniques for direct and indirect identification of microorganisms such as infrared and fluorescence spectroscopy, flow cytometry, chromatography, and chemiluminescence techniques as a basis for biosensor construction. The basic concept of a biosensor is simple but their actual construction and operation are quite complex. Basically, a biosensor is a molecule or a group of molecules of biological origin attached to a signal recognition material. When an analyte comes in contact with the biosensor the interaction will initiate a recognition signal that can be transduced and read by an instrument. Many types of biosensors have been developed such as enzymes, antibodies, nucleic acids, cellular materials, and so on. Analytes detected by biosensors include microbial toxins, specific pathogens, carbohydrates, insecticides and herbicides, and antibiotics. The recognition signals used include electrochemical (e.g., potentiometry, voltage changes, conductance, impedance, light addressable, etc.); optical (e.g., UV, bioluminescence, chemiluminescence, fluorescence, laser scattering, reflection and refraction of light, surface plasmon resonance, polarized light); and miscellaneous transducers (e.g.. piezoelectric crystals, thermister, acoustic waves, quartz crystals). Several excellent review articles and books concerning biosensors are available, including Eggins (1997) and Cunningham (1998).
In some cases, biosensors may employ whole cells or tissues for detection. These types of sensing systems receive a significant amount of attention because they enable functional assays to be performed. For example, a heavy metal chemical sensor designed to measure mercury may give a positive readout. On the other hand, a cell-based biosensor that detects mercury by exhibiting toxic effects may not respond in some cases even when mercury is present. This feature underscores an important aspect of cell-based sensors—they have the ability to discriminate between different forms of mercury and can report on their bioavailablity. There is also the possibility to use cell-based biosensors for detecting waterborne pathogens, indicator organisms, and toxins. Although they have not been extensively validated with relevant environmental conditions, this area of emerging technology has significant potential benefit and relevance to waterborne bioagent detection (e.g., see Baeumner, 2003; Belkin, 2003). In all of
these approaches, the key is to couple the binding or recognition event to signal generation.
Artificial or electronic “noses” are based on a cross-reactive design model. In this approach, an array of broadly responding sensors is employed. Each sensor responds to a wide number of species rather than to only a single substance. The specificity is encoded in the pattern of response; for example, each substance generates a unique array response pattern that can be distinguished from the pattern for other substances. In this approach, the arrays must be trained on each substance of interest, and a computational pattern recognition program is employed to learn the responses of the array to each substance and then recognize that pattern upon subsequent exposure. Such systems are attracting increasing attention due to their broad specificity and to their ability to respond to substances without the need to design specific receptors.
SUMMARY
Detection technologies concerning fecal indicator microorganisms in water can be addressed in the following three areas:
-
Sampling and Concentration Technologies. The main goal of sampling and concentration technologies is to capture and present target cells, cell components, and metabolites in a large enough number and in a suitable form such that subsequent analysis can be efficiently made. Concentration of target microorganisms can be done by filtration (membrane, ultrafiltration, reverse osmosis, fiber filters with positive or negative charges), centrifugation, flocculation, immunocapture (solid support or immunomagnetic separation), DNA/RNA hybridization, and so on.
-
Enumeration of Target Microbes. This can be done by direct microscopic observation of total cell numbers by differential staining techniques to enumerate live and dead cells. Also, live and injured cells can be grown and enumerated in nonselective agar or selective agar media. MPN procedures can be performed in aliquots of liquid media (non-selective and selective liquid media using the conventional five-tube or three-tube MPN methods and miniaturized MPN procedures using 96-well microtiter plates and computer interphase). Preenrichment and enrichment liquid media can also recover and grow target microbes to large numbers for subsequent analysis but will not provide the actual number of cells in the original water sample.
-
Detection and Monitoring of Target Microbes. This can be done by measuring changes in turbidity, color, fluorescence, impedance, conductance, capacitance, heat, pH, specific enzyme activities, gas, ATP levels, and so forth, in the water samples supplemented with appropriate growth-promoting ingredients. More specific information can be obtained by immunochemistry, DNA/RNA hybridization and probes, sequencing of DNA and RNA by sophisticated instru-
-
ments, PCR and detection of PCR products using electrophoresis or fluorescence technologies. Pulsed-field gel electrophoresis, ribotyping, and related technologies can provide species and subspecies information about target microbes. Target microbes and molecules can be separated and detected by microfluidic, proteomic, genomic, microarray, and microchip technologies. Biosensors and mass spectrometry technologies can also be used to detect many target whole cells and cell components.
To achieve full usefulness of these detection technologies, trained scientists and well designed procedures and instruments must be available and utilized. Final data must be presented logically and scientifically such that informed, appropriate, and defensible decisions can be made by responsible local, regional, national, and indeed, international authorities to promote water safety and protect public health of citizens of the nation and the world.
REFERENCES
AOAC (Association of Analytical Communities) International. 2002. Official Methods of Analysis of AOAC International, 17th Edition, Volumes I and II. Arlington, Virginia.
APHA (American Public Health Association). 1989a. Standard Methods for the Examination of Water and Wastewater. Washington, D.C.
APHA. 1989b. Supplement to Standard Methods for the Examination of Water and Wastewater. Washington, D.C.
APHA. 1998. Standard Methods for the Examination of Water and Wastewater, 20th Edition, Washington, D.C.
APHA. 2001. Compendium of Methods for the Microbiological Examination of Foods, 4th Edition, F.P. Downes and K. Ito, eds. Washington, D.C.
Baeumner, A.J. 2003. Biosensors for environmental pollutants and food contaminants. Analytical Chemistry and Bioanalysis 377(3): 434-445.
Baldi, P., and G.N. Hatfield. 2002. DNA Microarrays and Gene Expression: From Experiments to Data Analysis and Modeling. New York: Cambridge University Press.
Belkin, S. 2003. Microbial whole-cell sensing systems of environmental pollutants. Current Opinion in Microbiology 6(3): 206-212.
Clancy, J.L., Z. Bukhari, T.M. Hargy, J.R. Bolton, B.W. Dussert, and M.M. Marshall. 2000. Using UV to inactivate Cryptosporidium. Journal of the American Water Works Association 92(9): 97-104.
Cunningham, A.J. 1998. Introduction to Bioanalytical Sensors. New York: John Wiley & Sons, Inc.
Demirev, P., J.S. Lin, F.J. Pineda, and C. Fenselau. 2001a. Bioinformatics and mass spectrometry for microorganism identification: Proteome-wide post-translational modifications and database search algorithms for characterization of intact Helicobacter pylori. Analytical Chemistry 73: 4566-4573.
Demirev, P., J. Ramirez, and C. Fensulau. 2001b. Tandem mass spectrometry of intact proteins for characterization of biomarkers from Bacillus cereus T spores. Analytical Chemistry 73: 5725-5731.
Denef, V., J. Park, J.L.M. Rodrigues, T. Tsoi, S. Hashsham, and J. Tiedje. 2003. A more sensitive method enabling the use of spotted oligonucleotide DNA microarrays to study bacterial community functioning. Environmental Microbiology 5(10): 933-943.
Eggins, B. 1997. Biosensors. New York: John Wiley & Sons, Inc.
EPA (U.S. Environmental Protection Agency). 1999. Method 1623. Office of Water. Washington, D.C.: EPA-821-R-99-006.
Fung, D.Y.C., and A.A. Kraft. 1969. Rapid evaluation of viable cell counts using the Microtiter system and MPN techniques. Journal of Milk Food Technology 32: 408-409.
Fung, D.Y.C., and C.M. Lee. 1981. Double-tube anaerobic bacterial cultivation system. Food Science 7: 209-213.
Fung, D.Y.C. 2002. Rapid methods and automation in microbiology. Comprehensive Reviews in Food Science and Food Safety 1: 3-22.
Irwin, P., S.I. Tu, W. Damert, and J. Phillips. 2000. A modified Gauss-Newton algorithm and ninety-six well micro-technique for calculating MON using EXCEL spreadsheet. Journal of Rapid Methods and Automated Microbiology 8: 171-191.
Ivnitski, D., I. Abdel-Hamid, P. Atanasov, and E. Wilkins. 1999. Biosensors for detection of pathogenic bacteria. Biosensors and Bioelectronics 14: 599-624.
Jiang, S.C., R. Nobel, and W. Chu. 2001. Human adenoviruses and coliphage in urban runoff-impacted coastal waters of Southern California. Applied and Environmental Microbiology 67: 179-184.
Kuhn, R.C., and K.H. Oshima. 2001. Evaluation and optimization of a reusable hollow fiber ultrafilter as a first step in concentrating Cryptosporidium parvum oocysts from water. Water Research 35(11): 2779-2783.
McCuin, R.M., Z. Bukhari, J. Sobrinho, and J.L. Clancy. 2001. Recovery of Cryptosporidium oocysts and Giardia cysts from source water concentrates using immunomagnetic separation. Journal of Microbiology Methods 45(2): 69-76.
Musarrat, J., and S.A. Hashsham. 2003. Customized cDNA microarray for expression profiling of environmentally important genes of Pseudomonas stutzeri strain KC. Teratogenesis Carcino-genesis and Mutagenesis Supplement 1: 283-294.
Olson, W.P., ed. 1996. Automated Microbial Identification and Quantitation: Technologies for the 2000s. Buffalo Grove, Illinois: Interpharm Press, Inc.
Petrik, J. 2001. Microarray technology: The future of blood testing? Vox Sanguinis 80(1): 1-11.
Presnell, M.W., and W.H. Andrews. 1976. Use of membrane filter and filter aid for concentrating and enumerating indicator bacteria and Salmonella from estuarine waters. Water Research 10: 549-554.
Ramsay, G. 1998. DNA chips: State of the art. Nature Biotechnology 16(1): 40-44.
Schna, M., ed. 2000. Microarray Biochip Technology. Sunnyvale, California: TeleChem International, Inc.
Schwab, K.J., R. De Leon, and M.D. Sobsey. 1993. Development of PCR methods for enteric virus detection in water. Water Science and Technology 27: 211-218.
Sengupta, S., K. Onodera, A. Lai, and U. Melcher. 2003. Molecular detection and identification of influenza viruses by oligonucleotide microarray hybridization. Journal of Clinical Microbiology 41(10): 4542-4550.
Sobsey, M.D., and J.S. Glass. 1980. Poliovirus concentration from tap water with electropositive adsorbent filters. Applied and Environmental Microbiology 40(2): 201-210.
Sobsey, M.D., K.J. Schwab, R. De Leon, and Y.-S.C. Shieh. 1996. Enteric Virus Detection in Water by Nucleic Acid Methods. Denver, Colorado: American Water Works Association.
Van Sluis, R.J., and W.A. Yanko. 1977. The Fate of Salmonella sp. Following Dechlorination of Tertiary Sewage Effluents. Project report submitted in partial fulfillment of EPA Contract No. 14-12-150. Dechlorination of Wastewater: State-of-the-Art Field Survey and Pilot Plant Studies.
Walser, P.E. 2000. Using conventional microtiter plate technology for the automation of microbiological testing of drinking water. Journal of Rapid Methods and Automated Microbiology 8: 193-207.
Wang, R.F., M.L. Beggs, L.H. Robertson, and C.E. Cerniglia. 2002a. Design and evaluation of oligo-nucleotide-microarray method for the detection of human intestinal bacteria in fecal samples. FEMS Microbiology Letters 213(2): 175-182.
Wang, D., L. Coscoy, M. Zylberberg, P.C. Avila, H.A. Boushey, D. Ganem, and J.L. DeRisi. 2002b. Microarray-based detection and genotyping of viral pathogens. Proceedings of the National Academy of Sciences 99: 15687-15692.
Wilson, W.J., C.L. Strout, T.Z. DeSantis, J.L. Stilwell, A.V. Carrano, and G.L. Andersen. 2002. Sequence-specific identification of 18 pathogenic microorganisms using microarray technology. Molecular and Cellular Probes 16: 119-127.


