
1
Introduction
AN EPIDEMIC OF CHILDHOOD OBESITY
Children’s health in the United States has improved dramatically over the past century. Vaccines targeting previously common childhood infections—such as measles, polio, diphtheria, tetanus, rubella, and Haemophilus influenza—have nearly eliminated these scourges. Through the widespread availability of potable water, improved sanitation, and antibiotics, diarrheal diseases and infectious diseases such as tuberculosis and pneumonia have diminished in frequency and as primary causes of infant and child deaths in the United States (CDC, 1999). Pervasive food scarcity and essential vitamin and mineral deficiencies have largely disappeared in the U.S. population (IOM, 1991; Kessler, 1995). The net result is that infant mortality has been lowered by over 90 percent, contributing to the substantial increase in life expectancy—more than 30 years—since 1900 (CDC, 1999). Innovations such as seatbelts, child car seats, and bike helmets, meanwhile, have contributed to improved children’s safety, and fluoridation of municipal drinking water has enhanced child and adolescent dentition (CDC, 1999).
Given this steady trajectory toward a healthier childhood and healthier children, we begin the 21st century with a startling setback—an epidemic1
of childhood obesity. This epidemic is occurring in boys and girls in all 50 states, in younger children as well as in adolescents, across all socioeconomic strata, and among all ethnic groups—though specific subgroups, including African Americans, Hispanics, and American Indians, are disproportionately affected (Ogden et al., 2002; Caballero et al., 2003). At a time when we have learned that excess weight has significant and troublesome health consequences, we nevertheless see our population, in general, and our children, in particular, gaining weight to a dangerous degree and at an alarming rate.
The increasing prevalence of childhood obesity throughout the United States has led policy makers to rank it as a critical public health threat for the 21st century (Koplan and Dietz, 1999; Mokdad et al., 1999, 2000; DHHS, 2001). Over the past three decades since the 1970s, the prevalence of childhood obesity (defined in this report as a gender- and age-specific body mass index [BMI] at or above the 95th percentile on the 2000 CDC BMI charts) has more than doubled for preschool children aged 2 to 5 years and adolescents aged 12 to 19 years, and it has more than tripled for children aged 6 to 11 years (see Chapter 2; Ogden et al., 2002). Approximately nine million American children over 6 years of age are already considered obese. These trends mirror a similar profound increase in U.S. adult obesity and co-morbidities over a comparable time frame, as well as a concurrent rise in the prevalence of childhood and adult obesity and related chronic diseases internationally, in developed and developing countries alike (WHO, 2002, 2003; Lobstein et al., 2004).
IMPLICATIONS FOR CHILDREN AND SOCIETY AT LARGE
Many of us consider our weight and height as personal statistics, primarily our own, and occasionally our physician’s concern. Our weight is something we approximate on forms and applications requiring this information. Body size has been a cosmetic issue rather than a health issue throughout most of human history, but scientific study has changed this view. One’s aesthetic preference for a lean versus a plump body type may be related to personal taste, cultural and social norms, and association of body type with wealth or well-being. However, the implications of a wholesale increase in BMIs are increasingly becoming a public health problem. Thus, we need to acknowledge the sensitive personal dimension of height and weight, while also viewing weight as a public health issue, especially as the weight levels of children, as a population, are proceeding on a harmful upward trajectory.
The as yet unabated epidemic of childhood obesity has significant ramifications for children’s physical health, both in the immediate and long term, given that obesity is linked to several chronic disease risks. In a
population-based sample, approximately 60 percent of obese children aged 5 to 10 years had at least one physiological cardiovascular disease (CVD) risk factor—such as elevated total cholesterol, triglycerides, insulin, or blood pressure—and 25 percent had two or more CVD risk factors (Freedman et al., 1999).
The increasing incidence of type 2 diabetes in young children (previously known as adult onset diabetes) is particularly startling. For individuals born in the United States in 2000, the lifetime risk of being diagnosed with diabetes at some point in their lives is estimated at 30 percent for boys and 40 percent for girls if obesity rates level off (Narayan et al., 2003).2 The estimated lifetime risk for developing diabetes is even higher among ethnic minority groups at birth and at all ages (Narayan et al., 2003). Type 2 diabetes is rapidly becoming a disease of children and adolescents. In case reports limited to the 1990s, type 2 diabetes accounted for 8 to 45 percent of all new childhood cases of diabetes—in contrast with fewer than 4 percent before the 1990s (Fagot-Campagna et al., 2000). Young people are also at risk of developing serious psychosocial burdens related to being obese in a society that stigmatizes this condition, often fostering shame, self-blame, and low self-esteem that may impair academic and social functioning and carry into adulthood (Schwartz and Puhl, 2003).
The growing obesity epidemic in children, and in adults, affects not only the individual’s physical and mental health but carries substantial direct and indirect costs for the nation’s economy as discrimination, economic disenfranchisement, lost productivity, disability, morbidity, and premature death take their tolls (Seidell, 1998). States and communities are obliged to divert resources to prevention and treatment, and the national health-care system is burdened with the co-morbidities of obesity such as type 2 diabetes, hypertension, CVD, osteoarthritis, and cancer (Ebbeling et al., 2002).
The obesity epidemic may reduce overall adult life expectancy (Fontaine et al., 2003) because it increases lifetime risk for type 2 diabetes and other serious chronic disease conditions (Narayan et al., 2003), thereby potentially reversing the positive trend achieved with the reduction of infectious diseases over the past century. The great advances of genetics and other biomedical discoveries could be more than offset by the burden of illness, disability, and death caused by too many people eating too much and moving too little over their lifetimes.
Aside from the statistics, we can see the evidence of childhood obesity in our community schoolyards, in shopping malls, and in doctors’ offices. There are confirmatory journalistic reports of the epidemiologic trends in weight—from resizing of clothing to larger coffins to more spacious easy chairs to the increased need for seatbelt extenders. These would be of passing interest and minimal importance were it not for the considerable health implications of this weight gain for both adults and children. For example, compared with adults of normal weight, adults with a BMI of 40 or more have a seven-fold increased risk for diagnosed diabetes (Mokdad et al., 2003). Indeed, the obesity epidemic places at risk the long-term welfare and readiness of the U.S. military services by reducing the pool of individuals eligible for recruitment and decreasing the retention of new recruits. Nearly 80 percent of recruits who exceed the military accession weight-for-height standards at entry leave the military before they complete their first term of enlistment (IOM, 2003).
What might our population look like in the year 2025 if we continue on this course? In a land of excess calories ingested and insufficient energy expended, the inevitable scenario is a continued increase in average body size and an altered concept of what is “normal.” Americans with a BMI below 30 will be considered small and obesity will no longer be newsworthy but accepted as the social norm.
While the existence and importance of the increase in the population-wide obesity problem are no longer debated, we are still mustering the determination to forge effective solutions. We must remind ourselves that social changes to transform public perceptions and behaviors regarding seatbelt use, smoking cessation, breastfeeding, and recycling would have sounded unreasonable just a few decades ago (Economos et al., 2001), yet we have acted vigorously and with impressive results. How to proceed similarly in meeting the formidable childhood obesity challenge is the focus of this Institute of Medicine (IOM) report.
The 19-member IOM committee was charged with developing a prevention-focused action plan to decrease the prevalence of obesity in children and youth in the United States. The primary emphasis of the committee’s task was on examining the behavioral and cultural factors, social constructs, and other broad environmental factors involved in childhood obesity and identifying promising approaches for prevention efforts. This report presents the committee’s recommendations for many different segments of society from federal, state, and local governments (Chapter 4), to industry and media (Chapter 5), local communities (Chapter 6), schools (Chapter 7), and parents and families (Chapter 8).
CONTEXTS FOR ACTION
Investigating the causes of childhood obesity, determining what to do about them, and taking appropriate action must address the variables that influence both eating and physical activity. Seemingly straightforward, these variables result from complex interactions across a number of relevant social, economic, cultural, environmental, and policy contexts.
U.S. children live in a society that has changed dramatically in the three decades over which the obesity epidemic has developed. Many of these changes, such as both parents working outside the home, often affect decisions about what children eat, where they eat, how much they eat, and the amount of energy they expend in school and leisure time activities (Ebbeling et al., 2002; Hill et al., 2003).
Other changes, such as the increasing diversity of the population, influence cultural views and marketing patterns. Lifestyle modifications, in part the result of media usage and content together with changes in the physical design of communities, affect adults’ and children’s levels of physical activity. Many of the social and cultural characteristics that the U.S. population has accepted as a normal way of life may collectively contribute to the growing levels of childhood obesity. The broad societal trends that impact weight outcomes are complex and clearly multifactorial. With such societal changes, it is difficult to tease out the quantitative and qualitative role of individual contributing factors. While distinct causal relationships may be difficult to prove, the dramatic rise in childhood obesity prevalence must be viewed within the context of these broad societal changes.
An understanding of these contexts, particularly regarding their potential to be modified and how they may facilitate or impede development of a comprehensive obesity prevention strategy, is therefore essential. This next section provides a useful background to understand the multidimensional nature of the childhood obesity epidemic.
Lifestyle and Demographic Trends
The interrelated areas of family life, ethnic diversity, eating patterns, physical activity, and media use—discussed below—are all aspects of societal change that must be considered. Singly and in concert, the trends in these areas will strongly influence prospects for preventive and corrective measures.
Family Life
The changing context of American families includes several distinct trends such as the shifting role of women in society, delayed marriage,
childbearing outside of marriage, higher divorce rates, single parenthood, and work patterns of parents (NRC, 2003). Among the many important transformations that have occurred are expanded job opportunities for women, which have led to more women entering the workforce. Economic necessities have also prompted this trend. Moreover, married mothers are increasingly more likely than they were in the past to remain in the labor force throughout their childbearing years.
Women’s participation in the labor force increased from 36 percent in 1960 to 58 percent in 2000 (Luckett Clark and Weismantle, 2003). Since 1975, the labor force participation rate of mothers with children under age 18 has grown from 47 to 72 percent, with the largest increase among mothers with children under 3 years of age (U.S. Department of Labor, 2004). Over the same period, men’s labor force participation rates declined slightly from 78 percent to 74 percent (Population Reference Bureau, 2004b). In 2002, only 7 percent of all U.S. households consisted of married couples with children in which only the husband worked.
These trends, together with lower fertility rates, a decrease in average household size, and the shift in household demographics from primarily married couples with children to single person households and households without children, have caused the number of meal preparers in U.S. households who cook for three or more people to decline (Population Reference Bureau, 2003; Sloan, 2003).
It has been suggested that smaller households experience fewer economies of scale in home preparation of meals than do larger families. Preparing food at home involves a set amount of time for every meal that changes minimally with the number of persons served. Eating meals out involves the same marginal costs per person. Moreover, changes in salary and the lower prices of prepared foods may have reduced the value of time previously used to prepare at-home meals. Thus, incentives have been shifted away from home production toward eating more meals away from home (Sturm, 2004). Time-use trends for meal preparation at home reveal a gradual decline from 1965 to 1985 (44 minutes per day versus 39 minutes per day) and a steeper decline from 1985 to 1999 (39 minutes per day versus 32 minutes per day) (Robinson and Godbey, 1999; Sturm, 2004).
Ethnic Diversity
The racial and ethnic composition of children in the United States is becoming more diverse. In 2000, 64 percent of U.S. children were white non-Hispanic, 15 percent were black non-Hispanic, 4 percent were Asian/ Pacific Islander, and 1 percent were American Indian/Alaska Native. The proportion of children of Hispanic origin has increased more rapidly than the other racial and ethnic groups from 9 percent of the child population in
1980 to 16 percent in 2000 (Federal Interagency Forum on Child and Family Statistics, 2003).
Differences among ethnic groups (e.g., African American, American Indian, Hispanic, and Asian/Pacific Islanders) include variations in household composition and size—particularly larger household size in Hispanic and Asian populations (Frey, 2003)—and in other aspects of family life such as media use and exposure, consumer behavior, eating, and physical activity patterns (Tharp, 2001; Nesbitt et al., 2004).
Ethnic minorities are projected to comprise 40.2 percent of the U.S. population by 2020 (U.S. Census Bureau, 2001), and the food preferences of ethnic families are expected to have a significant impact on consumers’ food preferences and eating patterns (Sloan, 2003). The higher-than-average prevalence of obesity in several ethnic minority populations may indicate differences in susceptibility to unfavorable lifestyle trends and the consequent need for specially designed preventive and corrective strategies (Kumanyika, 2002; Nesbitt et al., 2004).
Eating Patterns
As economic demands and the rapid pace of daily life increasingly constrain people’s time, food trends have been marked by convenience, shelf stability, portability, and greater accessibility of foods throughout the entire day (Food Marketing Institute, 1996, 2003; French et al., 2001; Sloan, 2003). Food has become more available wherever people spend time. Because of technological advances, it is often possible to acquire a variety of highly palatable foods, in larger portion sizes, and at relatively low cost. Research has revealed a progressive increase, from 1977 to 1998, in the portion sizes of many types of foods and beverages available to Americans (Nielsen and Popkin, 2003; Smiciklas-Wright et al., 2003); and the concurrent rise in obesity prevalence has been noted (Nestle, 2003; Rolls, 2003).
Foods eaten outside the home are becoming more important in determining the nutritional quality of Americans’ diets, especially for children (Lin et al., 1999b; French et al., 2001). Consumption of away-from-home foods comprised 20 percent of children’s total calorie intake in 1977-1978 and rose to 32 percent in 1994-1996 (Lin et al., 1999b). In 1970, household income spent on away-from-home foods accounted for 25 percent of total food spending; by 1999, it had reached nearly one-half (47 percent) of total food expenditures (Clauson, 1999; Kennedy et al., 1999).
The trend toward eating more meals in restaurants and fast food establishments may be influenced not only by simple convenience but also in response to needs such as stress management, relief of fatigue, lack of time, and entertainment. According to a 1998 survey conducted by the National Restaurant Association, two-thirds of Americans indicated that patronizing
a restaurant with family or friends allowed them to socialize and was a better use of their leisure time than cooking at home and cleaning up afterward (Panitz, 1999).
For food consumed at home, never has so much been so readily available to so many—that is, to virtually everyone in the household—at low cost and in ready-to-eat or ready-to-heat form (French et al., 2001; Sloan, 2003). Increased time demands on parents, especially working mothers, have shifted priorities from parental meal preparation toward greater convenience (French et al., 2001), and the effects of time pressures are seen in working mothers’ reduced participation in meal planning, shopping, and food preparation (Crepinsek and Burstein, 2004). Industry has endeavored to meet this demand through such innovations as improved packaging and longer shelf stability, along with complementary technologies, such as microwaves, that have shortened meal preparation times.
Another aspect of this trend toward convenience is an increased prevalence, across all age groups of children and youth, of frequent snacking and of deriving a large proportion of one’s total daily calories from energy-dense snacks (Jahns et al., 2001). At the same time, there has been a documented decline in breakfast consumption among both boys and girls, generally among adolescents (Siega-Riz et al., 1998) and in urban elementary school-age children as compared to their rural and suburban counterparts (Gross et al., 2004); further, children of working mothers are more likely to skip meals (Crepinsek and Burstein, 2004).
There are also indications that children and adolescents are not meeting the minimum recommended servings of five fruits and vegetables daily recommended by the Food Guide Pyramid (Cavadini et al., 2000; American Dietetic Association, 2004). This trend is partially explained by the limited variety of fruits and vegetables consumed by Americans. In 2000, five vegetables—iceberg lettuce, frozen potatoes, fresh potatoes, potato chips, and canned tomatoes—accounted for 48 percent of total vegetable servings and six fruits (out of more than 60 fruit products)—orange juice, bananas, apple juice, apples, fresh grapes, and watermelon—accounted for 50 percent of all fruit servings (Putnam et al., 2002).
These trends have contributed to an increased availability and consumption of energy-dense foods and beverages. As summarized in Table 1-1 and Figures 1-1 through 1-3, trends in the dietary intake of the general U.S. population parallel trends in the dietary intake of children and youth. A more in-depth discussion of caloric intake, energy balance, energy density, Dietary Guidelines for Americans, and the Food Guide Pyramid is included in Chapters 3, 5, and 7.
Physical Activity
Physical activity is often classified into different types including recreational or leisure time, utilitarian, household, and occupational. The direct surveillance of physical activity trends in U.S. adults began only in the 1980s and was limited to characterizing leisure-time physical activity. In 2001, CDC began collecting data on the overall frequency and duration of time spent in household, transportation, and leisure-time activity of both moderate and vigorous intensity in a usual week through the state-based Behavioral Risk Factor Surveillance System (BRFSS) (CDC, 2003c).
National surveys conducted over the past several decades suggest an increase in population-wide physical activity levels among American men, women, and older adolescents; however, a large proportion of these populations still do not meet the federal guidelines for recommended levels of total daily physical activity.3 The data for children’s and youth’s leisure time and physical activity levels reveal a different picture than the adult physical activity trend data that are summarized in Table 1-2.
Trend data collected by the Americans’ Use of Time Study, through time-use diaries, indicated that adults’ free time increased by 14 percent between 1965 and 1985 from 35 hours to an average total of nearly 40 hours per week (Robinson and Godbey, 1999). Data from other population-based surveys, including the National Health Interview Survey, National Health and Nutrition Examination Survey (NHANES), BRFSS, and the Family Interaction, Social Capital and Trends in Time Use Data (1998-1999), together with trend data on sports and recreational participation, suggest minor to significant increases in reported leisure-time physical activity among adults (Pratt et al., 1999; French et al., 2001; Sturm, 2004).
Data from the 1990-1998 BRFSS4 revealed only a slight increase in self-reported physical activity levels among adults (from 24.3 percent in 1990 to 25.4 percent in 1998), and a decrease in respondents reporting no physical activity at all (from 30.7 percent in 1990 to 28.7 percent in 1998) (CDC, 2001).
Women, older adults, and ethnic minority populations have been identified as having the greatest prevalence of leisure-time physical inactivity (CDC, 2004b). In general, the prevalence of self-reported, no leisure-time physical activity was highest in 1989, and declined to its lowest level in 15 years among all groups in 35 states and the District of Columbia based on
TABLE 1-1 Trends in Food Availability and Dietary Intake of the U.S. Population and of U.S. Children and Youtha
|
Dietary Intake Trend |
U.S.Population |
U.S.Children and Youth |
|
Portion sizes of foods |
Portion sizes of most foods consumed by adults both at home and away from home (except pizza) increased between 1977 and 1996 (Nielsen and Popkin, 2003). |
Portion sizes for children aged 2 years and older increased for most foods consumed both at home and away from home between 1977 and 1996 (Nielsen and Popkin, 2003). |
|
Total energy intake derived from away-from-home sources |
Total energy intake increased from 18% to 34% for adults between 1977-1978 and 1995 (Lin et al., 1999a). |
Total energy intake increased from 20% to 32% for children between 1977-1978 and 1994-1996 (Lin et al., 1999b). |
|
Total energy intake |
Between 1971 and 2000, average energy intake increased from 2,450 to 2,618 calories for men and 1,542 to 1,877 kcal forwomen (CDC, 2004a). Between 1989 and 1991 and 1994-1996, total energy increased 8.6% and 9.5%, according to food supply and CSFII data, respectively (Chanmugan et al., 2003). Between 1983 and 2000, calories per capita increased by 20% (USDA, 2003) (Figure 1-1). |
No significant increased trends inenergy intake were observed in children aged 6-11 years between 1977-1978 and 1994-1996, 1998 (Enns et al., 2002). Total calories consumed by adolescent boys aged 12 to 19 years increased by 243 between 1977-1978 and 1994-1996 from 2,523 to 2,766 calories (Enns et al., 2003). Total calories consumed by adolescent girls aged 12 to 19 years increased by 123 between 1977-1978 and 1994-1996 from 1,787 to 1,910 calories (Enns et al., 2003). |
|
Total fat consumption |
Between 1971 and 2000, the percentage of calories from total fat decreased for men (from 36.9%to 32.8%) and women (from 36.1% to 32.8%) (CDC, 2004a). However, the intake of grams of total fat increased among women and decreased among men (CDC, 2004a) (Figure 1-2). |
Between 1965 and 1996, the proportion of energy from total fat consumed by children decreased from 39% to 32%, and saturated fat from 15% to 12% (Cavadini et al., 2000). Children aged 6 to 11 years in 1994-1996, 1998 consumed 25% of calories from discretionary fat (USDA, 2000; Enns et al., 2002). |
|
|
|
For adolescents aged 12 to 19 years, girls consumed 25% and boys consumed 26% of their calories from added fat (USDA, 2000; Enns et al., 2003). |
|
Added dietary sweeteners |
Between 1977 and 2000, an 83 calorie/day increase in caloric sweeteners was observed in the U.S. for all individuals 2 years and older, representing a 22% increase in the proportion of energy derived from caloric sweeteners (Popkin and Nielsen,2003). Between 1982 and 1997, per capita consumption of sweetners increased 28% (34 pounds) (Putnam and Gerrior, 1999). |
Children aged 6 to 11 years in 1994 to 1996 and 1998 consumed 21-23 teaspoons of added sugars in a 1,800-2,000 calorie diet which exceeded the Food Guide Pyramid recommendation of 6-12 teaspoons for a 1,600-2,200 calorie diet (USDA, 1996; Enns et al., 2002). |
|
Dairy and milk consumption |
Between 1970 and 1997, the consumption of milk per capita decreased from 31 gallons to 24 gallons, while cheese consumption increased 146% from 11 pounds/person in 1970 to 28 pounds/person in 1997 (French et al., 2001). Americans consumed 2.5 times as much cheese and drank 23% less milk per capita in 1997 than in 1970 (Putnam and Gerrior, 1999). |
Milk consumption decreased by 37% in adolescent boys and 30% in adolescent girls between 1977-1978 and 1994 (Cavadini et al., 2000). In 1977-1978, children aged 6 to 11 years consumed four times as much milk as any other beverage, and adolescents aged 12 to 19 years drank 1.5 times as much milk as any other beverage. In 1994-1996 and 1998, children aged 6 to 11 consumed 1.5 times as much milk as soft drinks, and by 1994-1996 adolescents consumed twice as much soft drinks as milk (French et al., 2001). |
|
Dietary Intake Trend |
U.S. Population |
U.S. Children and Youth |
|
|
|
Adolescent intake of whole milk decreased while cheese increased. In 1994-1996, for adolescents aged 12 to 19 years, only 12% of girls and 30% of boys consumed the number of dairy servings recommended by the Food Guide Pyramid (USDA, 2000; Enns et al.,2002, 2003). |
|
Fruit and vegetable consumption |
In 1997, Americans consumed 24% more fruit and vegetables per capita than did in 1970 (French et al., 2001). |
In 1977-1978 children aged 6 to 11 years consumed more total vegetables than children in 1994-1996, 1998 (Enns et al., 2002). In 1994-1996, 1998, only 24% of girls and 23% of boys consumed the number of Food Guide Pyramid recommended fruit servings (USDA, 2000; Enns et al., 2002). In 1994-1996 adolescents aged 12 to 19 years, only 18% of girls and 14% of boys consumed the number of Food Guide Pyramid recommended fruit servings (USDA, 2000; Enns et al., 2003). |
|
Meat, poultry, and fish consumption |
Total meat consumption per capita increased by 19 lbs from 1970 to 2000. In 2000, individual Americans consumed 16 pounds less red meat than in 1970, 32 lbs more poultry, and 3 lbs more fish and shellfish (Putnam et al., 2002). |
In 1994-1996 and 1998 the percentages of children aged 6 to 11 years and adolescents aged 12 to 19 years consuming meat, poultry, fish, and eggs were lower than in 1977-1978 (USDA, 2000; Enns et al., 2002, 2003). |
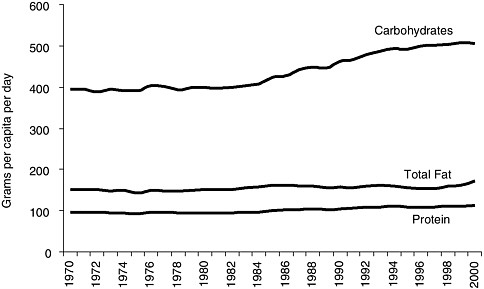
FIGURE 1-1 U.S. macronutrient food supply trends for carbohydrates, protein, and total fat, 1970-2000.
SOURCES: Putnam et al., 2002; USDA, 2003.
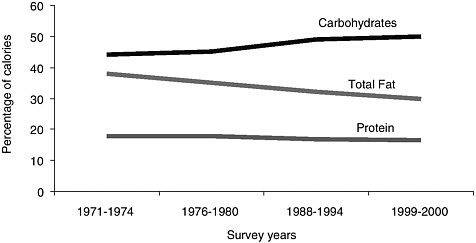
FIGURE 1-2 Percentage of calories from macronutrient intake for carbohydrates, protein, and total fat among adult men and women, 1970-2000.
SOURCE: CDC, 2004a.
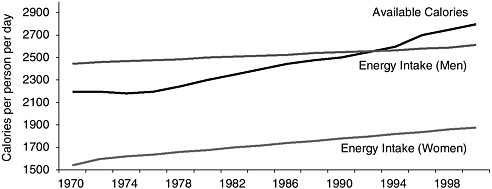
FIGURE 1-3 Available calories from the U.S. food supply, adjusted for losses,a and average energy intake for adult men and women,b 1970-2000.
SOURCES: Putnam et al., 2002; CDC, 2004a.
aBased on USDA food supply data, calories from the U.S. food supply adjusted for spoilage, cooking losses, plate waste, and other losses increased by 20 percent between 1983 and 2000 (Putnam et al., 2002; USDA, 2003).
bDietary intake trends and percentage of calories from macronutrient intake are based on a CDC analysis of four NHANES, by survey year, for adult men and women aged 20 to 74 years from 1971 to 2000 for energy intake (kilocalories), protein, carbohydrates, total fat, and saturated fat (CDC, 2004a).
BRFSS data, although it is unclear why this occurred (CDC, 2004b). In 2001, BRFSS respondents were asked to report the overall frequency and duration of time spent in household, transportation, and leisure-time activity of both moderate and vigorous intensity (CDC, 2003c). Although 45.4 percent of adults reported having engaged in physical activities consistent with the recommendation of a minimum of 30 minutes of moderate intensity activity on most days of the week in 2001, more than one-half of U.S. adults (54.6 percent) were not sufficiently active to meet these recommendations (CDC, 2003c).
The physical activity trend data for children and youth are even more limited than for adults. Most available information is on the physical activity levels of high school youth, with limited data available on levels in younger children. Based on the Youth Risk Behavior Survey (YRBS), daily enrollment in physical education classes declined among high school students from 42 percent in 1991 to 25 percent in 1995 (DHHS, 1996) and increased slightly to 28.4 percent in 2003 (CDC, 2004c). Cross-sectional data collected through the YRBS for 15,214 high school students indicated that one-third (33.4 percent) of 9th to 12th graders nationwide are not engaging in recommended levels of moderate or vigorous physical activity
TABLE 1-2 Trends in Leisure Time and Physical Activity of U.S. Adults, Children, and Youth
|
Trend |
Adults |
Children and Youth |
|
Available leisure time |
Adults ’free time increased by 14% between 1965 and 1985 to an average of nearly 40 hours per week based on Americans’ Use of Time Study (Robinson and Godbey, 1999). |
From 1981 to 1997, children aged 3 to 12 years experienced a decline in their free time by seven hours per week (Sturm, 2005a). |
|
Leisure-time physical activity |
There have been increases in reported leisure-time physical activity among U.S. adults based on NHES, NHANES, BRFSS, and trend data on sports and recreational participation (Pratt et al., 1999; French et al., 2001). There was a slight increase in self-reported physical activity levels among adults, based on the 1990-1998 BRFSS, from 24.3% in 1990 to 25.4% in 1998 (CDC, 2001). There was a slight decrease in adults reporting no physical activity at all (from 30.7% in 1990 to 28.7% in 1998) (CDC, 2001). |
An estimated 61.5% of children aged 9 to 13 years do not participate in any organized physical activity during their nonschool hours and 22.6% do not engage in any free-time physical activity based on the 2002 YMCLS (CDC, 2003a). From 1981 to 1997, children aged 3 to 12 years experienced an increase in time spent in organized sports and outdoor activities (Sturm, 2005a). |
|
Moderate to vigorous physical activity |
Based on the 2001 BRFSS, 45.4% of adults reported having engaged in physical activities consistent with the recommendation of a minimum of 30 minutes of moderate-intensity activity on most days of the week in 2001. However, 54.6% of U.S. adults were not sufficiently active to meet these recommendations (CDC, 2003c). |
High school students in grades 9 to 12 are not engaging in recommended levels of moderate or vigorous physical activity based on the YRBS (CDC, 2003b, 2004c; see Chapter 7). |
and an estimated 10 percent report that they are inactive (CDC, 2003b, 2004c; see Chapter 7).
In 2002, the CDC collected baseline data through the Youth Media Campaign Longitudinal Survey (YMCLS), a nationally representative survey of children aged 9 to 13 years and their parents, which revealed that 61.5 percent of youth in this age group do not participate in any organized physical activity during their nonschool hours and 22.6 percent do not engage in any free-time physical activity (CDC, 2003a).
Shifts in transportation patterns can affect energy balance. Many technological innovations have occurred over the past several decades such as the increased availability of labor-saving devices in the home, a decline in physically active occupations, and the dominance of automobiles for commuting to work and personal travel (Cutler et al., 2003). National data tracking trends on the physical activity levels and leisure or discretionary
time of younger children and pre-adolescents are limited. However, an analysis of the available data for children aged 3 to 12 years from 1981 to 1997 (Hofferth and Sandberg, 2001) suggests a decline in their free time by six hours per week—attributed to an increase in time away from home in structured settings—and an increase in time spent in organized sports and outdoor activities over this time frame (Sturm, 2005a). However, it is not possible to determine the overall impact of these changes on children’s physical activity levels.
One factor that has influenced overall transportation patterns in the United States is the change in the built environment. Through a number of mediating factors, the built environment can either promote or hinder physical activity, although the role and influence of the built environment on physical activity levels is a relatively new area of investigation. The ways in which land is developed and neighborhoods are designed may contribute to the level of physical activity residents achieve as a natural part of their daily lives (Frank, 2000).
There have been many changes in the built environment over the past century or more. For a variety of reasons, Americans moved away from central cities to lower density suburbs, many of the most recent of which necessitate driving for transportation.
In these areas, streets were often built without sidewalks, residential areas were segregated from other land uses, and shopping areas were designed for access by car.These characteristics discourage walking and biking as a means of transportation, historically an important source of physical activity.
Indeed, the amount of time that adults spend walking and biking for transportation has declined in the past two decades, largely because people are driving more (Sturm, 2004). In addition, the more time that Americans spend traveling, the less time they have available for other forms of physical activity.In 2000, Americans spent nearly 26 minutes commuting to their jobs, an increase from 22 minutes in 1990, and the average commuting time was 30 minutes or more in 25 of the 245 cities with at least 100,000 population (Population Reference Bureau, 2004a).
Children’s motorized vehicle travel to and from school has increased, though this represents a small proportion of their overall travel. The 2001 National Household Travel Survey (NHTS) indicated that less than 15 percent of children aged 5 to 15 years walked to or from school and 1 percent bicycled (Bureau of Transportation Statistics, 2003). Even children living relatively close to school do not walk to this destination. The 1999 HealthStyles Survey found that among participating households, 25 percent of children aged 5 to 15 years who lived within a mile of school either walked or bicycled at least once during the previous month (CDC, 2002).
From 1977 to 2001, there was a marked decline in children’s walking
to school as a percentage of total school trips made by 5- to 15-year-olds from 20.2 percent to 12.5 percent (Sturm, 2005b). Based on data collected through the National Personal Transportation Surveys for 1977 and 1990, and the NHTS for 2001, there is little evidence of changes in walking trip length although distance traveled by bicycle has decreased (Sturm, 2005b). Although reduced physical activity has been identified as an unintended consequence of dependence on motorized travel, it is unclear how changes in children’s transportation patterns have reduced their overall physical activity levels (Sturm, 2005b).
Media
The presence of electronic media in children’s lives, and their time spent with such media, has grown considerably and has increased the time spent in sedentary pursuits, often with reduced outside play time. In 1999, the average American child lived in a home with three televisions, three radios, three tape players, two video cassette recorders (VCRs), one video game player, two compact disc players, and one computer (Roberts et al., 1999) (Figure 1-4). In 2003, nearly all children (99 percent) aged zero to six years lived in a home with a television set and the average number of VCRs or digital video discs (DVDs) in these young children’s homes was 2.3 (Rideout et al., 2003). Television dominates the type of specific media used by children and youth and is the only form of electronic media for which trend data are available. In 1950, approximately 10 percent of U.S. households had a television (Putnam, 1995) in comparison with 98 percent in 1999 (Nielsen Media Research, 2000). The percent of American homes with more than one television set rose from 35 percent in 1970 (Lyle and Hoffman, 1972) to 88 percent in 1999 (Roberts et al., 1999). Moreover, there has been a ten-fold increase over the same period in the percent of American homes with three or more television sets (Rideout et al., 2003). In 2003, one-half (50 percent) of children aged zero to six years had three or more televisions, one-third (36 percent) had a television in their bedrooms, and nine out of ten children in this age range had watched television or DVDs (Rideout et al., 2003).
During a typical day, 36 percent of children watch television for one hour or less, 31 percent of children watch television for one to three hours, 16 percent watch television for three to five hours, and 17 percent watch television for more than 5 hours (Roberts et al., 1999) (Figure 1-5).
Two separate national data sources have tracked children’s and adolescents’ discretionary time spent watching television. Results indicate that the extent of television viewing differs by age, but also suggest an observed decline in television watching by children under 12 years by approximately four hours per week between 1981 and 1997 (Hofferth and Sandberg,
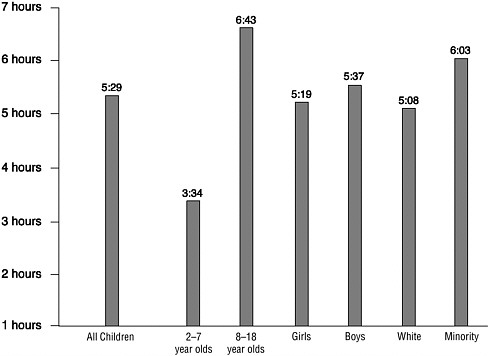
FIGURE 1-4 Daily media use among children by age. Media use includes television, video games, radios, cassette tape players, VCRs, compact disc players, and computers.
SOURCE: Rideout et al., 1999. This information was reprinted with permission from the Henry J. Kaiser Family Foundation.
2001). Based on the Monitoring the Future Survey from 1990 to 2001, there was a steady decrease in heavy television watching (three hours or more) among adolescents yet an observed increase in television viewing for one hour or less (Child Trends, 2002). Although children are using other types of electronic media including video games and computers (Roberts et al., 1999; Rideout et al., 2003), television viewing represents a significant amount of discretionary time among children and youth, which is a sedentary and modifiable activity (see Chapter 8).
Consumer Attitudes and Public Awareness
Trends in media coverage suggest a striking increase in public interest in obesity. The International Food Information Council (IFIC) has been following U.S. and international media coverage of the obesity issue since
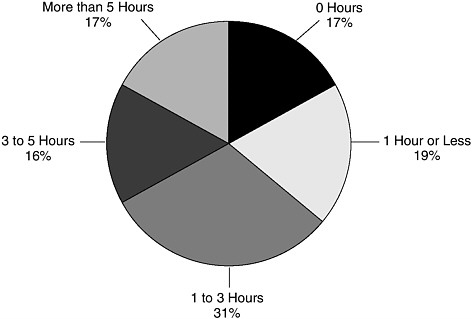
FIGURE 1-5 Daily television viewing by children and youth in hours.
SOURCE: Rideout et al., 1999. This information was reprinted with permission from the Henry J. Kaiser Family Foundation.
1999 and has tracked a steady upward trend in the volume and breadth of issues covered (IFIC, 2004) (Figure 1-6).
This media focus, independent of the longstanding popularity of weight control as a consumer issue (Serdula et al., 1999), includes obesity-related topics ranging from popular diets and quick weight loss strategies to litigation against fast food restaurants to reports of new programs, policies, and research findings.
The media coverage on obesity is viewed by the public, parents, and other stakeholder groups in a variety of ways, depending on their personal beliefs regarding issues such as personal responsibility, the role of government and other institutions in promoting personal freedoms, media influences, free speech and the rights of advertisers, and the ways in which parents should raise their children, as well as on consequent responses to various population level approaches being proposed to address obesity.
While some people place a high value on the individual’s right to choose what, when, where, and how to eat and be active, others are looking for advice, information, and enhanced opportunities, and may even favor government interventions that facilitate healthier choices (Kersh and Morone, 2002).
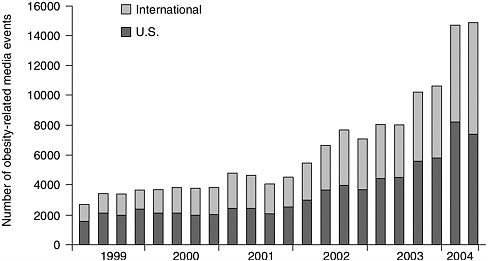
FIGURE 1-6 Trends in obesity-related media coverage, 1999-2004.
SOURCE: IFIC, 2004. Reprinted, with permission. Copyright 2004 by the International Food Information Council.
Recent opinion polls indicate that a large number of adults and parents are very concerned or somewhat concerned about childhood obesity (Field Research Corporation, 2003; Widmeyer Polling & Research, 2003). For example, a recent telephone survey of 1,068 randomly selected California residents suggested that for one out of three respondents, obesity-related behaviors, especially unhealthy eating habits or the lack of physical activity, represent the greatest risk to California children (Field Research Corporation, 2003). Although obesity is considered a health problem comparable to smoking, some research suggests that it remains low on the list of Americans’ perceptions of serious health problems, which remain dominated by cancer, HIV/AIDS, and heart disease (Oliver and Lee, 2002; Lake Snell Perry & Associates, 2003; San Jose Mercury News/Kaiser Family Foundation, 2004). More recent national research shows that Americans are perceiving childhood obesity to be a serious problem, similar to tobacco use, underage drinking, and violence, but not as serious as drug abuse (Evans et al., 2004).
Families may vary in the value they place on different health outcomes related to obesity, and the merits they attribute to certain benefits or drawbacks of changing behaviors to address it (Whitaker, 2004). Research suggests that some parents do not perceive weight, per se, to be a health issue for their children (Baughcum et al., 2000; Jain et al., 2001; Borra et al., 2003), independent of their child’s physical and social functioning. They
think of their child as healthy if he or she has no serious medical conditions, and they embrace the hope that the overweight child will outgrow the problem. They may also hesitate to raise weight-related issues due to their concerns that this may lower the child’s self-esteem and potentially encourage him or her to develop an eating disorder. School-age children, however, do not generally view obesity as a health problem as long as it does not significantly affect appearance and performance (Borra et al., 2003). Being obese, whether as a child or an adult, is highly stigmatized and viewed as a moral failing, among some educators (Price et al., 1987), health professionals (Teachman and Brownell, 2001), and even very young children (Cramer and Steinwert, 1998; Latner and Stunkard, 2003).
Further, individuals and consumers vary in the priority they place on healthy eating and an active lifestyle, and they hold a spectrum of views on health regarding weight management, weight control, and wellness (Buchanan, 2000; Strategy One, 2003). Consumer research reveals that Americans express not having enough time to fit everything into their day that they would like to, with the consequence that their health may be neglected (Strategy One, 2003).
In a recent national poll of 1,000 U.S. adult respondents, half of the respondents viewed obesity as a public health problem that society needs to solve while the other half considered it a personal responsibility or choice that should be dealt with privately (Lake Snell Perry & Associates, 2003).
However, Americans do appear more uniformly willing to support proactive actions to reduce obesity in children and youth, especially in the school setting (Lake Snell Perry & Associates, 2003; Robert Wood Johnson Foundation, 2003; Widmeyer Polling & Research, 2003). Childhood obesity presumably engenders more support for societal-level approaches because children, who are thought to have less latitude in food and activity choices than adults, are unlikely to be blamed by society for becoming obese. Understanding consumer perceptions and knowledge of public awareness about obesity will be essential in order to design an effective multimedia and public relations campaign supporting obesity prevention (see Chapter 5).
Emerging Programs and Policies
As it has done with many other child health concerns, from whooping cough, polio, and measles to use of toddlers’ seats in automobiles, the United States is now addressing the growing problem of childhood obesity. State legislatures, federal agencies, school boards, teachers, youth programs, parents, and others are mobilizing to address the array of interrelated issues associated with the development, and potential prevention, of childhood obesity. Because adult overweight and obesity rates are even higher than
those of children, many efforts focus on improving eating habits and encouraging physical activity for people of all ages.
The range of these efforts is quite broad, and many innovative approaches are under way. As discussed throughout the report, many of these efforts are occurring at the grassroots level—neighborhood-specific or community-wide programs and activities encouraging healthy eating and promoting regular physical activity. A number of U.S. school districts, for instance, have established new standards for the types of food and beverages that will be available in their school systems (Prevention Institute, 2003). Many communities are examining the local availability of opportunities for physical activity and are working to expand bike paths and improve the walkability of neighborhoods. Further, community child- and youth-centered organizations (such as the Girl Scouts and the Boys and Girls Clubs of America) are adding or expanding programs focused on increasing physical activity. A national cross-sector initiative, Shaping America’s Youth, supported by the private sector (industry), nonprofit organizations, and the Department of Health and Human Services, is working to compile a registry of the relevant ongoing research and intervention programs across the country as well as funding sources. Evaluating these efforts and disseminating those that are most effective will be the challenge and goal for future endeavors.
In many other countries where childhood obesity is a growing problem, including the United Kingdom, Sweden, Germany, France, Canada, and Australia, a broad array of national and community-level efforts and policy options are being pursued. Among these are the banning of vending machines in schools, developing restrictions for television advertising to children, and using taxes derived from energy-dense foods to support physical activity programs.
PUBLIC HEALTH PRECEDENTS
Public health problems of comparably broad scope and complexity have been successfully addressed in the past (Economos et al., 2001), and this experience gives us not only the confidence that childhood obesity too can be moderated, even prevented, but supplies us with some of the needed tools. This solid public health history of achievements is exemplified in Box 1-1 (CDC, 1999; Appendix D).
Many of these problems were not apparent at first, and grew to become an accepted part of life before they were recognized and subsequently addressed. For example, in 1900, with only approximately 8,000 cars on the roads, it was surely inconceivable that motor vehicle deaths could reach a peak of 56,278 per year in 1972 (U.S. Department of Transportation, 1995; Waller, 2002). Multifocal interventions on vehicular safety and high-
|
BOX 1-1 Ten Great Public Health Achievements United States, 1900-1999
SOURCE: CDC, 1999. |
way improvements have enabled us to make great progress in reducing motor vehicle deaths from this peak (Bolen et al., 1997; NSC, 1997). As the number of miles driven in the United States rose from 206 billion in 1930 to 2,467 billion in 1996, the death rate per 100 million miles declined dramatically from 15.97 in 1930 to 1.76 in 1996 (NSC, 1997; IOM, 1999). Even with this progress, however, we continue to record over 42,000 deaths a year from motor vehicle collisions (U.S. Department of Transportation, 2004).
Early in the 20th century, when cigarettes were hand-rolled, few would have predicted that cigarette smoking would become the major preventable cause of death in the United States a century later. Tobacco reform efforts can be traced back to the late 19th and early 20th century and were strengthened in the 1940s and 1950s as epidemiological studies began to convince the medical community and public about the health hazards of tobacco (Fee et al., 2002). In 1964, nearly 70 million people in the U.S. consumed tobacco on a regular basis; and according to the 1955 Current Population Survey, two-thirds of men (68 percent) and one-third of women (32.4 percent) 18 years and older were regular smokers of cigarettes. As revealed by these data, cigarette smoking was the social norm, its link with heart and lung diseases was not widely accepted, and the desire or ability to quit smoking in that era was very low (DHHS, 1964). The reduction in national prevalence of cigarette smoking from 41.9 percent in 1965 to 23 percent in 2001 (Kochanek and Smith, 2004) reflects changes in the social norms and the positive influence of public health and policy interventions (Public Health Service, 1994; Economos et al., 2001).
Recently, intensive effort has been devoted to reviewing the evidence of the effectiveness of community preventive services. The Guide to Community Preventive Services (Task Force on Community Preventive Services, 2004) has completed an analysis of the evidence in nine major areas (two health behaviors, six specific health conditions, and one addressing the social environment). Additional reports, including those central to preventing childhood obesity (e.g., school-based programs, community fruit and vegetable consumption, consumer literacy, and food and nutrition policy) are forthcoming. In the nine health areas examined to date, the Task Force found that certain categories of interventions appear to have strong evidence of effectiveness for multiple health behaviors and problems (Table 1-3). Further, based on the experience to date from the Guide
TABLE 1-3 Recommended Public Health Interventions Common to Multiple Health Behaviors and Conditions
|
Type of Intervention |
Health Behavior or Condition |
|
Community-wide campaigns |
Physical activity** Motor vehicle occupant injuries* Oral health (water fluoridation)** |
|
School-based interventions |
Physical activity** Oral health (sealants)** Vaccine preventable diseases (requirement for school admission)* Skin cancer* |
|
Mass media strategies |
Tobacco initiation and cessation** Motor vehicle occupant injuries** |
|
Laws and regulations |
Reducing exposure to secondhand smoke** Motor vehicle occupant injuries** |
|
Provider reminder systems |
Vaccine preventable diseases** Tobacco cessation* |
|
Reducing costs to patients |
Tobacco cessation* Vaccine preventable diseases** |
|
Home visits |
Vaccine preventable diseases* Violence prevention** |
|
* Sufficient Evidence. ** Strong Evidence. SOURCE: Task Force on Community Preventive Services, 2004. |
|
to Community Preventive Services, it appears that comprehensive programs that involve communities, schools, mass media, health providers, and laws and regulations are most likely to be effective for a number of health problems (see also Appendix D).
There is a general pattern to the interventions that have successfully addressed many of these public health problems (CDC, 1999). In nearly all cases, policy changes were followed by the emergence of new government leadership structures to effectively enforce the policies and oversee the development and implementation of pertinent programs. Such direction was aided by improved surveillance methods, control measures, technologies, and treatments, together with expanding systems of service delivery and provider education. By organizing the experiences, principles, and strategies underlying these multiple achievements into conceptual frameworks, we may likewise develop successful approaches to childhood obesity prevention.
SUMMARY
After working throughout the 20th century to improve children’s physical health by reducing the incidence of disease and widening margins of safety, we now find ourselves bringing children into environments with some decidedly less-than-healthful features—fewer opportunities to be physically active and socially interactive, more opportunities to be sedentary and passively entertained, and frequent temptations to consume in the absence of hunger or need and to engage in other risky behaviors.
A complex of interacting cultural, social, economic, familial, and psychological issues have set the stage for these growing obesity risks for children. Although the need to take action to curb the epidemic is widely acknowledged, the debate about what to do and how to do it is just beginning in earnest. Important insights can potentially be obtained from an examination of past successes in overcoming, or at least alleviating, some other problems that also seemed insurmountable at first. Such insights are presented as part of the committee’s charge to use theoretical and empirical findings to assess the potential utility of specific approaches within a comprehensive childhood obesity prevention strategy.
This report provides a broad-based examination of the problem of obesity in children and youth, and it presents an action plan—with recommendations on the roles and responsibilities of numerous stakeholders and many sectors of society—for addressing this problem. The committee hopes that the report will produce shared understandings and stimulate sustained societal and lifestyle changes so that the current obesity trends among our children and youth may be reversed.
REFERENCES
American Dietetic Association. 2004. Position of the American Dietetic Association: Dietary guidance for healthy children ages 2 to 11 years. J Am Diet Assoc 104(4):660-677.
Baughcum AE, Chamberlin LA, Deeks CM, Powers SW, Whitaker RC. 2000. Maternal perceptions of overweight preschool children. Pediatrics 106(6):1380-1386.
Bolen JR, Sleet DA, Chorba T, Brewer R, Dellinger A, Wallace LJD, Johnson VR. 1997. Overview of efforts to prevent motor-vehicle-related injury. In: Prevention of Motor Vehicle-Related Injuries: A Compendium of Articles from the Morbidity and Mortality Weekly Report, 1985-1996. Atlanta, GA: National Center for Injury Prevention and Control.
Borra ST, Kelly L, Shirreffs MB, Neville K, Geiger CJ. 2003. Developing health messages: Qualitative studies with children, parents, and teachers help identify communications opportunities for healthful lifestyles and the prevention of obesity. J Am Diet Assoc 103(6):721-728.
Buchanan DR. 2000. An Ethic for Health Promotion. New York: Oxford University Press.
Bureau of Transportation Statistics. 2003. National Household Travel Survey. [Online]. Available: http://www.bts.gov/programs/national_household_travel_survey/ [accessed July 27, 2004].
Caballero B, Himes JH, Lohman T, Davis SM, Stevens J, Evans M, Going S, Pablo J. 2003. Body composition and overweight prevalence in 1704 schoolchildren from 7 American Indian communities. Am J Clin Nutr 78:308-312.
Cavadini C, Siega-Riz AM, Popkin BM. 2000. US adolescent food intake trends from 1965 to 1996. Arch Dis Child 83(1):18-24.
CDC (Centers for Disease Control and Prevention). 1999. Ten great public health achievements—United States, 1990-1999. MMWR 48(12):241-243.
CDC. 2001. Physical activity trends—United States, 1990-1998. MMWR 50(9):166-169.
CDC. 2002. Barriers to children walking and bicycling to school—United States, 1999. MMWR 51(32):701-704.
CDC. 2003a. Physical activity levels among children aged 9-13 years—United States, 2002. MMWR 52(33):785-788.
CDC. National Center for Health Statistics. 2003b. Health, United States, 2003 with Chartbook on Trends in the Health of Americans. [Online]. Available: http://www.cdc. gov/nchs/data/hus/tables/2003/03hus059.pdf [accessed May 25, 2004].
CDC. 2003c. Prevalence of physical activity, including lifestyle activites among adults—United States, 2000-2001. MMWR 52(32):764-769.
CDC. 2004a. Trends in intake of energy and macronutrients—United States, 1971-2000. MMWR 53(4):80-82.
CDC. 2004b. Prevalence of no leisure-time physical activity—35 states and the District of Columbia, 1988-2002. MMWR 53(4):82-86.
CDC. 2004c. Youth Risk Behavior Surveillance—United States, 2003. MMWR 53(SS-2):21-24.
Chanmugam P, Guthrie J, Cecilio S, Morton J, Basiotis P, Anand R. 2003. Did fat intake in the United States really decline between 1989-1991 and 1994-1996? J Am Diet Assoc 103(7):867-872.
Child Trends. 2002. Watching Television. [Online]. Available: http://www.child trendsdatabank.org/pdf/55_PDF.pdf [accessed September 3, 2004].
Clauson A. 1999. Share of food spending for eating out reaches 47 percent. Food Rev 22(3):15-17.
Cramer P, Steinwert T. 1998. Thin is good, fat is bad: How early does it begin? J Appl Dev Psych 19:429-451.
Crepinsek MK, Burstein NR. 2004. Maternal Employment and Children’s Nutrition. Volume II, Other Nutrition-Related Outcomes. E-FAN-04-006-1. Washington, DC: Economic Research Service, USDA.
Cutler D, Glaeser E, Shapiro J. 2003. Why Have Americans Become More Fat? NBER Working Paper No. W9446. Cambridge, MA: National Bureau of Economic Research.
DHHS (U.S. Department of Health and Human Services). 1964. Surgeon General Report: Smoking and Health. Washington, DC: Report of the Advisory Committee to the Surgeon General of the Public Health Service.
DHHS. 1996. Physical Activity and Health: A Report of the Surgeon General. Atlanta, GA: USDHHS, CDC, NCCDPHP.
DHHS. 2001. The Surgeon General’s Call to Action to Prevent and Decrease Overweight and Obesity. Rockville, MD: Public Health Service, Office of the Surgeon General.
Ebbeling CB, Pawlak DB, Ludwig DS. 2002. Childhood obesity: Public-health crisis, common sense cure. Lancet 360(9331):473-482.
Economos CD, Brownson RC, DeAngelis MA, Novelli P, Foerster SB, Foreman CT, Gregson J, Kumanyika SK, Pate RR. 2001. What lessons have been learned from other attempts to guide social change? Nutr Rev 59(3 Pt 2):S40-S56.
Enns CW, Mickle SJ, Goldman JD. 2002. Trends in food and nutrient intakes by children in the United States. Fam Econ Nutr Rev 14(2):56-68.
Enns CW, Mickle SJ, Goldman JD. 2003. Trends in food and nutrient intakes by adolescents in the United States. Fam Econ Nutr Rev 15(2):15-27.
Evans WD, Finkelstein EA, Kamerow DB, Renaud JM. June 2-4, 2004. Public Perceptions of Childhood Obesity. Presentation at the Time/ABC News Obesity Summit, Williamsburg, VA.
Fagot-Campagna A, Pettitt DJ, Engelgau MM, Burrows NR, Geiss LS, Valdez R, Beckles GL, Saaddine J, Gregg EW, Williamson DF, Narayan KM. 2000. Type 2 diabetes among North American children and adolescents: An epidemiologic review and a public health perspective. J Pediatr 136(5):664-672.
Federal Interagency Forum on Child and Family Statistics. 2003. America’s Children: Key National Indicators of Child Well-Being, 2003. Washington, DC: U.S. Government Printing Office.
Fee E, Brown TM, Lazarus J, Theerman P. 2002. The smoke nuisance. Am J Public Health 92(6):931.
Field Research Corporation. 2003. A Survey of Californians about the Problem of Childhood Obesity. Conducted for the California Endowment. October-November 2003. [Online]. Available: http://www.calendow.org/obesityattitudes/index.htm [accessed April 9, 2004].
Fontaine KR, Redden DT, Wang C, Westfall AO, Allison DB. 2003. Years of life lost due to obesity. J Am Med Assoc 289(2):187-193.
Food Marketing Institute. 1996. Trends in the United States: Consumer Attitudes & the Supermarket, 1996. Washington, DC: Food Marketing Institute.
Food Marketing Institute. 2003. Trends in the United States: Consumer Attitudes & the Supermarket 2003. Washington, DC: Food Marketing Institute.
Fox MK, Pac S, Devaney B, Jankowski L. 2004. Feeding Infants and Toddlers Study: What foods are infants and toddlers eating? J Am Diet Assoc 104(1 Suppl 1):S22-S30.
Frank LD. 2000. Land use and transportation interaction: Implications on public health and quality of life. J Plan Educ Res 20:6-22.
Freedman DS, Dietz WH, Srinivasan SR, Berenson GS. 1999. The relation of overweight to cardiovascular risk factors among children and adolescents: The Bogalusa Heart Study. Pediatrics 103(6 Pt 1):1175-1182.
French SA, Story M, Jeffery RW. 2001. Environmental influences on eating and physical activity. Annu Rev Public Health 22:309-335.
French SA, Lin BH, Guthrie JF. 2003. National trends in soft drink consumption among children and adolescents age 6 to 17 years: Prevalence, amounts, and sources, 1977/ 1978 to 1994/1998. J Am Diet Assoc 103(10):1326-1331.
Frey WH. 2003. Married with children. Am Demogr 25(2):17-19.
Gleason P, Suitor C. 2001. Children’s Diets in the Mid-1990’s: Dietary Intake and Its Relationship with School Meal Participation. Alexandria, VA: U.S. Department of Agriculture. Report No. CN-01-CD1.
Gross SM, Bronner Y, Welch C, Dewberry-Moore N, Paige DM. 2004. Breakfast and lunch meal skipping patterns among fourth-grade children from selected public schools in urban, suburban, and rural Maryland. J Am Diet Assoc 104(3):420-423.
Guthrie JF, Morton JF. 2000. Food sources of added sweeteners in the diets of Americans. J Am Diet Assoc 100(1):43-51.
Hill JO, Wyatt HR, Reed GW, Peters JC. 2003. Obesity and the environment: Where do we go from here? Science 299(5608):853-855.
Hofferth SL, Sandberg JF. 2001. Changes in American children’s time, 1981-1997. In: Owens T, Hofferth S, eds. Children at the Millennium: Where Have We Come From, Where Are We Going? Advances in Life Course Research. New York: Elsevier Science.
IFIC (International Food Information Council). 2004. Trends in Obesity-Related Media Coverage. Washington, DC. [Online]. Available: http://www.ific.org/research/obesitytrends. cfm [accessed July 26, 2004].
IOM (Institute of Medicine). 1991. Improving America’s Diet and Health. Washington, DC: National Academy Press.
IOM. 1999. Reducing the Burden of Injury: Advancing Prevention and Treatment. Washington, DC: National Academy Press.
IOM. 2003. Weight Management: State of the Science and Opportunities for Military Programs. Washington, DC: The National Academies Press.
Jahns L, Siega-Riz AM, Popkin BM. 2001. The increasing prevalence of snacking among US children from 1977 to 1996. J Pediatr 138(4):493-498.
Jain A, Sherman SN, Chamberlin DL, Carter Y, Powers SW, Whitaker RC. 2001. Why don’t low-income mothers worry about their preschoolers being overweight? Pediatrics 107(5): 1138-1146.
Kennedy E, Blaylock J, Kuhn B. 1999. Introduction. On the road to better nutrition. In: Frazao E, ed. America’s Eating Habits: Changes and Consequences. Washington, DC: USDA.
Kersh R, Morone J. 2002. How the personal becomes political: Prohibitions, public health, and obesity. Stud Am Polit Dev 16:162-175.
Kessler DA. 1995. The evolution of national nutrition policy. Annu Rev Nutr 15:xiii-xxvi.
Kochanek KD, Smith BL. 2004. Deaths: Preliminary data for 2002. Natl Vital Stat Rep 52(13):1-47.
Koplan JP, Dietz WH. 1999. Caloric imbalance and public health policy. J Am Med Assoc 282(16):1579-1581.
Kumanyika S. 2002. The minority factor in the obesity epidemic. Ethn Dis 12(3):316-319.
Lake Snell Perry & Associates. 2003. Obesity as a Public Health Issue: A Look at Solutions. [Online]. Available: http://www.phsi.harvard.edu/health_reform/harvard_forum_release. pdf [accessed January 28, 2004].
Latner JD, Stunkard AJ. 2003. Getting worse: The stigmatization of obese children. Obes Res 11(3):452-456.
Lin BH, Guthrie J, Frazao E. 1999a. Nutrient contribution of food away from home. In: Frazao E, ed. America’s Eating Habits: Changes and Consequences. Washington, DC: USDA.
Lin BH, Guthrie J, Frazao E. 1999b. Quality of children’s diets at and away from home: 1994-96. Food Rev 2-10.
Lobstein T, Baur L, Uauy R, IASO International Obesity TaskForce. 2004. Obesity in children and young people: A crisis in public health. Obes Rev 5(Suppl 1):4-85.
Luckett Clark S, Weismantle M. 2003. Employment Status: 2000. Census 2000 Brief. U.S. Department of Commerce. [Online]. Available: http://www.census.gov/prod/2003pubs/c2kbr-18.pdf [accessed July 23, 2004].
Lyle J, Hoffman HR. 1972. Children’s use of television and other media. In: Rubenstein EA, Comstock GA, Murray JP, eds. Television and Social Behavior. Vol. 4. Washington, DC: U.S. Government Printing Office. Pp. 257-273.
Mokdad AH, Serdula MK, Dietz WH, Bowman BA, Marks JS, Koplan JP. 1999. The spread of the obesity epidemic in the United States, 1991-1998. J Am Med Assoc 282(16):1519-1522.
Mokdad AH, Serdula MK, Dietz WH, Bowman BA, Marks JS, Koplan JP. 2000. The continuing epidemic of obesity in the United States. J Am Med Assoc 284(13):1650-1651.
Mokdad AH, Ford ES, Bowman BA, Dietz WH, Vinicor F, Bales VS, Marks JS. 2003. Prevalence of obesity, diabetes, and obesity-related health risk factors, 2001. J Am Med Assoc 289(1):76-79.
Narayan KM, Boyle JP, Thompson TJ, Sorensen SW, Williamson DF. 2003. Lifetime risk for diabetes mellitus in the United States. J Am Med Assoc 290(14):1884-1890.
Nesbitt SD, Ashaye MO, Stettler N, Sorof JM, Goran MI, Parekh R, Falkner BE. 2004. Overweight as a risk factor in children: A focus on ethnicity. Ethn Dis 14(1):94-110.
Nestle M. 2003. Increasing portion sizes in American diets: More calories, more obesity. J Am Diet Assoc 103(1):39-40.
Nielsen Media Research. 2000. 2000 Report on Television: The First 50 Years. New York: AC Nielsen Company.
Nielsen SJ, Popkin BM. 2003. Patterns and trends in food portion sizes, 1977-1998. J Am Med Assoc 289(4):450-453.
NRC (National Research Council), IOM. 2003. Working Families and Growing Kids: Caring for Children and Adolescents. Washington, DC: The National Academies Press.
NSC (National Safety Council). 1997. Accident Facts. Ithaca, IL: NSC.
Ogden CL, Flegal KM, Carroll MD, Johnson CL. 2002. Prevalence and trends in overweight among US children and adolescents, 1999-2000. J Am Med Assoc 288(14):1728-1732.
Oliver JE, Lee T. 2002. Public Opinion and the Politics of America’s Obesity Epidemic. KSG Working Paper No. RWP02-017. [Online]. Available: http://ksgnotes1.harvard.edu/Research/wpaper.nsf/rwp/RWP02-017?OpenDocument [accessed August 9, 2004].
Panitz B. 1999. Year of the restaurant: Unwrapping what the industry has to offer. Restaurants USA, February, Pp. 26-30. [Online]. Available: http://www.restaurant.org/rusa/magArticle.cfm?ArticleID=338 [accessed December 16, 2003].
Popkin BM, Nielsen SJ. 2003. The sweetening of the world’s diet. Obes Res 11(11):1325-1332.
Population Reference Bureau. 2003. Traditional Families Account for 7 Percent of U.S. Households. [Online]. Available: http://www.ameristat.org/pdf/TraditionalFamiliesAccountfor7Percent.pdf [accessed April 15, 2004].
Population Reference Bureau. 2004a. Going to Work: America’s Commuting Patterns in 2000. [Online]. Available: http://www.prb.org/AmeristatTemplate.cfm?Section=2000Census1 [accessed April 15, 2004].
Population Reference Bureau. 2004b. Record Number of Women in the U.S. Labor Force. [Online]. Available: http://www.prb.org/AmeristatTemplate.cfm?Section=Labor__Employment &template=/ContentManagement/ContentDisplay.cfm&ContentID=7880 [accessed April 15, 2004].
Pratt M, Macera CA, Blanton C. 1999. Levels of physical activity and inactivity in children and adults in the United States: Current evidence and research issues. Med Sci Sports Exerc 31(11 Suppl):S526-S533.
Prevention Institute. 2003. Environmental and Policy Approaches to Promoting Healthy Eating and Activity Behaviors. Oakland, CA: Prevention Institute.
Price JH, Desmond SM, Stelzer CM. 1987. Elementary school principals’ perceptions of childhood obesity. J Sch Health 57(9):367-370.
Public Health Service. 1994. For a Healthy Nation: Returns on Investment in Public Health. Atlanta, GA: DHHS.
Putnam J, Gerrior S. 1999. Trends in the U.S. food supply. In: Frazao E, ed. America’s Eating Habits: Changes and Consequences. Washington, DC: USDA. Pp. 133-160.
Putnam J, Allshouse J, Kantor LS. 2002. U.S. per capita food supply trends: More calories, refined carbohydrates, and fats. Food Rev 25(3):2-15.
Putnam RD. 1995. Tuning in, tuning out: The strange disappearance of social capital in America. Political Science 28:664-683.
Rideout VJ, Foehr UG, Roberts DF, Brodie M. 1999. Kids & Media @ the New Millennium: Executive Summary. Menlo Park, CA: Henry J. Kaiser Family Foundation. [Online] Available: http://www.kff.org/content/1999/1535/KidsExecSum%20FINAL.pdf [accessed November 20, 2003].
Rideout VJ, Vandewater EA, Wartella EA. 2003. Zero to Six: Electronic Media in the Lives of Infants, Toddlers and Preschoolers. Menlo Park, CA: Henry J. Kaiser Family Foundation.
Robert Wood Johnson Foundation. 2003. Healthy Schools for Healthy Kids. Princeton, NJ: Robert Wood Johnson Foundation.
Roberts D, Foehr U, Rideout V, Brodie M. 1999. Kids and Media @ the New Millennium. Menlo Park, CA: Henry J. Kaiser Family Foundation.
Robinson JP, Godbey G. 1999. Time for Life. The Surprising Ways That Americans Use Their Time. 2nd edition. University Park, PA: The Pennsylvania State University Press.
Rolls BJ. 2003. The supersizing of America. Portion size and the obesity epidemic. Nutr Today 38(2):42-53.
San Jose Mercury News/Kaiser Family Foundation. 2004. Survey on Childhood Obesity. Menlo Park, CA: Henry J. Kaiser Family Foundation.
Schwartz MB, Puhl R. 2003. Childhood obesity: A societal problem to solve. Obes Rev 4(1):57-71.
Seidell JC. 1998. Societal and personal costs of obesity. Exp Clin Endocrinol Diabetes 106(Suppl 2):7-9.
Serdula MK, Mokdad AH, Williamson DF, Galuska DA, Mendlein JM, Heath GW. 1999. Prevalence of attempting weight loss and strategies for controlling weight. J Am Med Assoc 282(14):1353-1358.
Siega-Riz AM, Popkin BM, Carson T. 1998. Trends in breakfast consumption for children in the United States from 1965-1991. Am J Clin Nutr 67(4):748S-756S.
Sloan EA. 2003. What, when, and where Americans eat. Food Techn 57(8):48-66.
Smiciklas-Wright H, Mitchell D, Mickle S, Goldman J, Cook A. 2003. Foods commonly eaten in the United States, 1989-1991 and 1994-1996: Are portion sizes changing? J Am Diet Assoc 103(1):41-47.
Strategy One. 2003. Addressing the Obesity Debate: A Consumer Point of View. Washington, DC: International Food Information Council.
Sturm R. 2004. The economics of physical activity: Societal trends and rationales for interventions. Am J Prev Med 27(3S):126-135.
Sturm R. 2005a. Childhood obesity—What can we learn from existing data on societal trends. Part 1. Preventing Chronic Disease [Online]. Available: http://www.cdc. gov/pcd/issues/2005/jan/04_0038.htm.
Sturm R. 2005b (in press). Childhood obesity—What can we learn from existing data on societal trends. Part 2. Preventing Chronic Disease [Online]. Available: http://www.cdc.gov/pcd/issues/2005/apr/04_0039.htm.
Task Force on Community Preventive Services. 2004. Guide to Community Preventive Services. Task Force Recommendations. [Online] Available: http://www.thecommunityguide.org/overview/recs-to-date.pdf [accessed May 25, 2004].
Teachman BA, Brownell KD. 2001. Implicit anti-fat bias among health professionals: Is anyone immune? Int J Obes Relat Metab Disord 25(10):1525-1531.
Tharp MC. 2001. Marketing and Consumer Identity in Multicultural America. Thousand Oaks, CA: Sage Publications.
U.S. Census Bureau. 2001. U.S. Interim Projections by Age, Sex, Race, and Hispanic Origin. [Online]. Available: http://www.census.gov/ipc/www/usinterimproj/ [accessed June 11, 2004].
USDA (U.S. Department of Agriculture). Center for Nutrition Policy and Promotion. 1996. The Food Guide Pyramid. Washington, D.C.: U.S. Government Printing Office.
USDA. 2000. Pyramid Servings Intakes by U.S. Children and Adults: 1994-96, 1998. Agricultural Research Service, Community Nutrition Research Group. Table Set No. 1.
USDA. 2003. Profiling food consumption in America. In: Agriculture Fact Book 2001-2002. Washington, DC: USDA. U.S. Government Printing Office.
U.S. Department of Labor. 2004. Women in the Labor Force: A Databook. Bureau of Labor Statistics. Report 973. [Online]. Available: http://www.bls.gov/cps/wlf-databook.pdf [accessed April 15, 2004].
U.S. Department of Transportation. 1995. Highway Statistics Summary to 1995. Washington, DC: Federal Highway Administration. Office of Highway Information Management. [Online]. Available: http://www.fhwa.dot.gov/ohim/summary95/ [accessed June 18, 2004].
U.S. Department of Transportation. 2004. Fatality Analysis Reporting System (FARS) Web-Based Encyclopedia. Washington, DC: National Center for Statistics and Analysis. National Highway Traffic Safety Administration. [Online]. Available: http://www-fars.nhtsa.dot.gov/ [accessed September 28, 2004].
Waller PF. 2002. Challenges in motor vehicle safety. Annu Rev Public Health 23:93-113.
Whitaker RC. 2004. Informational Report on Evidence-Based Literature for Development of a Childhood Obesity Interactive Tool. Princeton, NJ: Mathematica Policy Research.
WHO (World Health Organization). 2002. World Health Report: Reducing Risks, Promoting Healthy Life. Geneva: WHO.
WHO. 2003. Diet, Nutrition and the Prevention of Chronic Diseases. Technical Report Series No. 916. Geneva: WHO.
Widmeyer Polling & Research. 2003. Summary of Study Findings: Americans’ Attitudes on Fighting Obesity. American Public Health Association Obesity Poll. Washington, DC.


