16
Geography and Racial Health Disparities
Amitabh Chandra and Jonathan S. Skinner
During the past several decades, many studies have documented racial, ethnic, gender, and socioeconomic disparities in both medical care treatments and health outcomes.1 There are no easy economic explanations for such differences: African Americans seem less likely to receive invasive treatments even in the Veteran’s Affairs (VA) system, where doctors’ economic incentives are likely to be blunted (Peterson, Wright, Daley, and Thibault, 1994; Whittle, Conigliaro, Good, and Lofgren, 1993). Nor do differences in insurance coverage seem to eliminate racial or ethnic gaps (Carlisle, Leake, and Shapiro, 1997); indeed Ross and Mirowsky (2000) believe public insurance such as Medicare and Medicaid lead to worse health. More recently, racial differences in cardiac surgery were hypothesized to depend on the race of the physician; however, no significant differences were found (Chen et al., 2001). The Institute of Medicine’s (IOM’s) landmark study (Smedley, Stith, and Nelson, 2002) has conducted a comprehensive survey of the evidence and concluded that racial disparities in medical care treatments and outcomes are pervasive; this topic also has been an integral part of the National Research Council’s research agenda (National Research Council, 1997).
Collectively these papers clearly document important racial differences in treatments, intensity of care, and outcomes. In this chapter, we consider a complicating factor that has implications for both statistical inference and policy recommendations regarding racial disparities: the geography of health care and health outcomes, and its relationship to the measurement of racial
health disparities. This is a broad topic (see for example, Chapter 11, this volume), and so we will organize our contribution along five basic points.
(1) There is considerable variation in the utilization of health care, and in outcomes, by region.
The phenomenon of “small area variation” in utilization rates has been studied for a number of decades. Most recently the Dartmouth Atlas of Health Care has used nearly 100 percent samples of Medicare enrollees to measure such differences across 306 Hospital Referral Regions (HRRs) in the United States (Wennberg and Cooper, 1999). Even after controlling for differences in underlying health status across regions, there is clear evidence of persistent and large differences in treatment patterns, even in contiguous areas. Much of the current debate is how to interpret such differences—are they “demand” driven by patient preferences, or “supply” driven by physician beliefs and historical patterns of hospital location? In addition to disparities in treatment patterns, there are also substantial variations in health outcomes by region. Recent research has documented race-specific and gender-specific variations at the county or state level in overall mortality rates as well as disease-specific mortality rates (Barnett et al., 2001; Casper et al., 2001).2
(2) People who are African American or Hispanic or belong to other minority groups tend to seek care from different hospitals and from different physicians compared to non-Hispanic whites.
It is not surprising that African-American and Hispanic patients tend to see different physicians and are admitted to different hospitals compared to non-Hispanic whites. This is largely the consequence of where people live: there are far fewer African Americans seeking care in eastern Tennessee hospitals than in Mississippi hospitals, and many more Hispanic patients seeking care in hospitals in Florida, Texas, and California than in Maine and New Hampshire. Furthermore, patients of color who live in the same neighborhood as whites may go to different hospitals or (more clearly) see different physicians and in different settings for a variety of reasons, including financial barriers, as well as racial barriers to care (Lillie-Blanton, Martinez, and Salganicoff, 2001). Patients also tend to be seen by physicians of the same race, although one study (Harrison and Thurston, 2001) suggested this matching is in part the consequence of minority physicians being more likely to live near minority neighborhoods.
(3) Racial disparities are pronounced in some areas, but are less so (or may not be present) in other areas.
In most regions of the United States, there are pronounced racial differences in utilization and outcomes. But in other areas, there are no significant racial differences. In some sense, this is welcome news, in that the medical profession is not some monolithic and uniform “system” that treats patients identically regardless of where they live. Such differences, however, are not easily explained, and may rely on one or two surgeons who account for the majority of procedures in their region. In other cases, the differences in racial disparities may arise from spatial “mismatches” of patients and physicians, for example, because of segregation in residential areas or the location of hospital facilities.
(4) These three facts create strong statistical interactions between geography and racial identity: one may falsely diagnose geographical variation as racial disparities, and conversely.
On average, Hispanic Medicare enrollees account for the same level of expenditures as their non-Hispanic elderly counterparts (Centers for Medicare and Medicaid Services, 2000, Table 4.8). Although this might reassure observers that there are no obvious utilization disparities between Hispanic and non-Hispanic Medicare enrollees, there is one complicating factor: geography. Medicare expenditures on average are substantially higher in Florida, Texas, and California (Wennberg and Cooper, 1999). Because a large fraction of Hispanic Medicare patients live in these three states, the researcher might find that within each state, Hispanic patients experience lower utilization rates than their non-Hispanic counterparts.
More generally, in typical regression analysis when minority patients live in regions with systematically different rates of utilization (e.g., African Americans in the south), and the region of residence is not controlled for, one can estimate larger or smaller racial “disparities” that are in fact the consequence of where people live, and not how they are treated or their outcomes within their community. Nor are typical regional measures, such as Metropolitan Statistical Area (MSA), necessarily accurate mirrors of “local” effects.
It is important to note here that we do not argue against the existence of racial disparities, nor do we argue that they are necessarily mitigated by geographical variation. If African Americans live in regions with poor hospital quality, then that in itself represents a valid source of racial disparities. Instead, our central thesis is that ignoring geography (or misspecifying it) will cause the analyst to “cry wolf” when true differences are nonexistent, or to falsely conclude that there are no differences when in fact there are substantial differences in the outcomes of interest. Furthermore, as we
argue next, the policy prescriptions may differ, depending on whether the racial disparities are caused by regional variations instead of by differences in treatment within hospitals or communities.
(5) A potentially large part of overall health disparities in the United States may be the consequence of regional differences in treatment and outcomes. Reducing geographic disparities in quality of care will benefit all Americans, but is likely to yield greater benefits to minority patients.
The policy implications of racial disparities are different depending on their proximate causes. Racial differences arising within a hospital or even within a physician’s practice may reasonably be ascribed to differences in underlying health status, patient preferences, financial barriers, provider biases, or some combination of these four factors. Here, however, the insights of the regional variation literature is relevant; it is not the case that the rate of therapeutic interventions for whites should be necessarily viewed as the “correct” or “desired” rate (Tu et al., 1997; Wennberg, 1986). This is because the white rate might reflect inappropriate care—whites get too much done to them, as discussed by Schneider et al. (2001). Alternatively, preferences for care may differ by race or gender.
When aggregate racial differences in outcomes are the consequence of minority patients being more likely to live in regions where everyone in the region experiences poorer outcomes, then the policy focus should be on disparities in geography—that specific regions be targeted to improve quality of care or reduce “flat of the curve” health care spending.3 Such policies would ensure that disadvantaged racial groups would be the major beneficiaries of quality improvements.
THE GEOGRAPHY OF HEALTH CARE
The measurement of regional variation in health care utilization is difficult for a variety of reasons. First, a great deal of statistical power is necessary to measure utilization at the local level; even a sample of 50,000 observations quickly loses power when the data are partitioned into separate regions, and used to focus on specific diseases. Small sample sizes and inadequate statistical power can generate spurious “area variation” just because of random noise in measured average rates.4 Second, the problem of migration to hospitals must be considered; Boston hospitals accept referrals from all over New England, and if these patients were counted, it might appear falsely that Boston residents are at elevated risk of hospitalization. Third, one needs a sample that is not subject to selectivity bias. For example, the sample of Medicaid patients, or of managed care patients, is not likely to be representative of the general population; Medicaid patients can
become eligible because of serious illness, and managed care patients tend to be healthier than the general population. Finally, the regions should correspond to actual migration patterns of patients rather than artifacts of historical compromises such as state or county boundaries.
In this section, we use data from the Dartmouth Atlas of Health Care that go far to avoid these four shortfalls (Wennberg and Cooper, 1996, 1999). The data comprise a nearly 100 percent sample of Medicare enrollees over age 65, often for 2 years, so the sample sizes are as much as 60 million person-years in a given map or graph; this provides considerable power for regional analysis. Second, the Atlas defines one’s location by the zip code of residence, rather than where one actually gets care. So if a patient from the Burlington, Vermont, region is admitted to a Boston hospital, that hospital stay (and any procedures done there) is assigned to Burlington, not Boston.
Third, the Medicare data provide nearly 100 percent coverage of the population over age 65 and is the nearest thing to a national database of utilization in the United States. There have been increases in the population of risk-bearing Health Maintenance Organizations (HMOs) in the Medicare population (now referred to as Medicare+Choice), but that ratio never exceeded 12 percent and has fallen as many insurance carriers have dropped the Medicare+Choice option. In some urban regions the ratio of HMO patients in the Medicare population has been higher than the national average, and this has engendered more concern about selection bias.5
The Dartmouth Atlas has divided the United States into 306 Hospital Referral Regions (HRRs). An HRR is the unit of analysis at which health care for the elderly is delivered. Its geographic boundaries are computed by examining the complex pattern of commuting patterns to major referral hospitals.6 HRRs are named for the hospital service area containing the referral hospital or hospitals most often used by residents of the region. The regions sometimes cross state boundaries—an attribute that is by its very nature ruled out by cross-state analysis. Intuitively, one may think of HRRs as representing the geographic level at which “tertiary” services such as cardiac surgery are received.
To demonstrate the construction of the HRRs, in Figure 16-1 we detail the construction of the Evansville, Indiana, HRR. This region includes three states: Illinois, Indiana, and Kentucky. In this region, three hospitals provide cardiovascular surgery services: two in Evansville and one in Vincennes, Indiana. The Evansville HRR also demonstrates that the inclusion of simple MSA fixed effects does not account adequately for geography: the U.S. Census’ Evansville-Henderson MSA is actually comprised of three HRRs. This is not a problem in itself. However, if different HRRs have different practice styles, then it blurs the measure of true regional differences in utilization by aggregating up to the state or MSA level. To demonstrate the
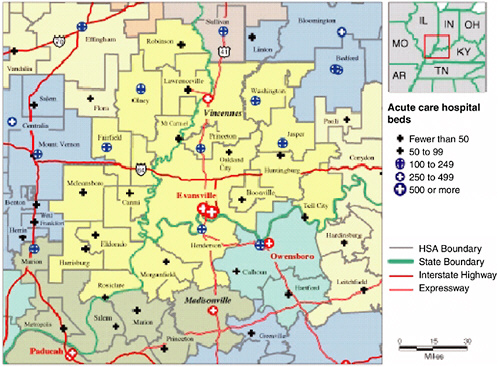
overwhelming degree to which even adjacent HRRs practice different “styles” of medicine, we now draw on the findings of the Dartmouth Atlas of Health Care.
Figure 16-2 demonstrates that there is substantial variation in Medicare payments for services reimbursed on a fee-for-service basis (including non-risk-bearing health maintenance organizations). Even after controlling for age, sex, race, illness patterns, and differences in regional prices, reimbursements per enrollee varied greatly: as noted in the Atlas, even though the average payment was $4,993 per beneficiary, payments ranged from
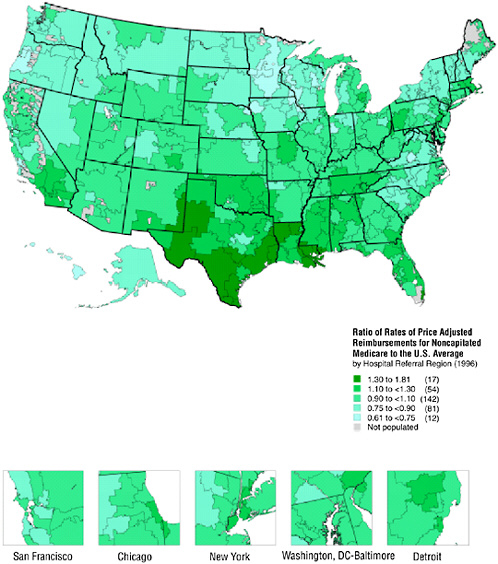
FIGURE 16-2 Geographic variation in illness-adjusted Medicare payments.
$9,033 in the McAllen, Texas, hospital referral region to $3,074 in Lynchburg, Virginia.7
In Figure 16-3 the Atlas illustrates the enormous geographic variation in a relatively standard procedure—Percutaneous Coronary Intervention (PCI), which includes the use of angioplasty and the placement of stents. PCI is an invasive procedure in which a catheter is inserted into the thigh and guided to the narrowed artery, where a balloon is expanded to clear the blockage and improve blood flow. Percutaneous Transluminal Coronary Angioplasty (PTCA) is often used immediately following a heart attack, or shortly thereafter, or to relieve pain for patients with ischemic heart disease. In 1996 more than 200,000 of these procedures were conducted with an average rate of 7.5 per 1,000 Medicare enrollees. As in previous figures, the data have been standardized for demographic characteristics, and the unit of reporting is a HRR. Note how in Texas, Pennsylvania, and California, the ratio of rates (to the U.S. average) can vary drastically even across adjacent HRRs.
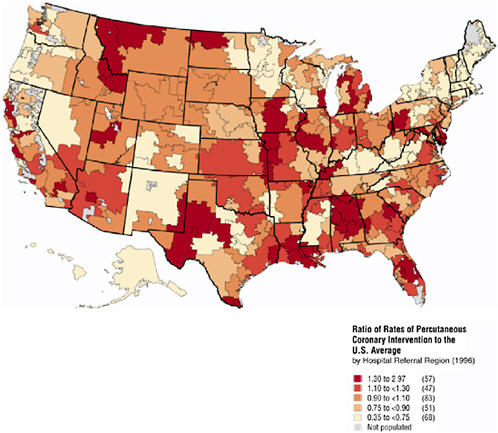
FIGURE 16-3 Geographic variation in PTCA rates.
The same pattern exists for other surgical procedures. Figure 16-4 summarizes the variation in rates (on a log scale) at which 10 common surgical procedures are used relative to the U.S. average (in 1996). Similar results have been documented for the variation in rates at which different diagnostic tests are utilized. Together the ten procedures listed in Figure 16-4 made up 42 percent of Medicare inpatient surgery and accounted for 44 percent of reimbursements for surgical care in 1995-1996. For many of these procedures, regional variation occurs because of fundamental uncertainty about the effectiveness of the procedure and ambiguity about the efficacy of alternatives. For example, variation in rates of radical prostatectomy might be partly attributable to the lack of controlled clinical trials comparing the risks and benefits of surgery, radiation therapy, and watchful waiting. For other procedures, even the best clinical trials are often not sufficient to eliminate variation in procedure rates: physicians vary in how they interpret findings from the carefully controlled settings of clinical trials to decision making for individual patients in other settings. The variation for hip fractures is small because the fracture can be diagnosed easily and virtually all physicians agree on the appropriate treatment therapy. For this procedure, the observed variation more accurately reflects variation in the
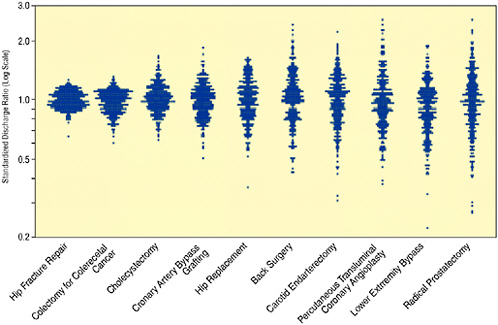
FIGURE 16-4 Surgical variation for ten common procedures. Each data point represents an observation for a Hospital Referral Region relative to the U.S. average standardized for age-gender-race and illness.
SOURCE: Wennberg and Cooper (1996).
actual rate of the hip fractures. Similarly, hospitalizations for colectomy reflect variations in the incidence of colorectal cancer, rather than differences in treatment strategies.
One might suspect these variations may be in part the consequence of differences in underlying patterns of cardiovascular disease. Certainly one might expect that HRR-level rates of PTCA should be associated with HRR-level rates of heart attacks (acute myocardial infarctions, or AMIs). This is because nearly one-third of heart attack patients are treated with PTCA and community rates of AMI should be correlated with true (diagnosed and undiagnosed) levels of ischemic heart disease. However, the correlation coefficient (weighted by the Medicare population) between PTCA rates and AMI rates is essentially zero (correlation = 0.05, p = 0.35) and not significant, meaning that these variations are unlikely to be explained by differences in cardiovascular health status.
The provocative nature of these results has not gone unnoticed, and several hypotheses have been put forward to explain these variations. These include the role of sampling variation, differences in underlying severity, patient preferences, the role of capacity, and the nature of physician learning. Wennberg et al. (2002) demonstrate that higher Medicare spending does not result in more high-quality care, such as flu vaccines, use of beta blockers when appropriate, or better health outcomes. Instead, higher spending is typically associated with more “supply-sensitive services” such as physician visits, specialist consultations, and days in the intensive care unit. Supply-sensitive services are those that are provided in the absence of specific clinical guidelines on frequency of use, and where medical texts provide little guidance. Utilization rates for such services appear to be highly correlated with the supply of resources—the number of physicians, specialists, labs, and beds. As such, there appears to be little support for the notion that costs or inadequate training drive practice variation.
Another class of rationalizations is developed by Phelps and Mooney (1993) and Bikhchandani et al. (2002), who suggest that explanations based on the nature of physician learning are most likely to account for much of the empirically observed locality of treatment. In the Phelps-Mooney model, physicians are Bayesian learners who attempt to reach an optimal rate for the application of a particular treatment. Eventually, as physicians sample both their own and their colleagues’ experiences, the two will converge toward an optimal rate. This hypothesis suggests a number of implications: a physician’s propensity to treat converges toward the community norm, and faster if the community is more informed and the doctor is less informed (e.g., younger). Among the implications of this theory is the hypothesis that the provision of more precise medical information in medical studies can enhance the learning of physicians, and thus offer dramatic social efficiency gains. Bikhchandani and colleagues (2002) consider a modi-
fication of this model and demonstrate that it is possible for physicians to fall into a localized “cascade” because of the difficulty in experimenting with alternative treatment choices.
The message of Figures 16-2, 16-3, and 16-4 is that the practice or “intensity” of medicine varies tremendously across space. But there are also large differences within states and even within cities. Fisher, Wennberg, Stukel, and Sharp (1994) construct cohorts of Medicare beneficiaries on the basis of initial hospitalization for AMI, stroke, gastro-intestinal bleeding, hip fracture, or surgery for breast, colon, or lung cancer. They find substantial differences in the intensity with which beneficiaries were treated (as measured by readmission rates) even across similar teaching hospitals in the Boston area. Specifically, there is substantial variation across readmission rates for Massachusetts General Hospital, Brigham and Women’s Hospital, Beth Israel, and Boston University Medical Center. Most interestingly, there is no relationship between mortality (both 30 day and over the entire study period) and the intensity of hospitalization. Clearly, racial differences in migration patterns to hospitals of patients within Boston could have first-order effects on utilization rates, although in this case, probably not with respect to outcomes.
RACIAL DIFFERENCES IN WHERE (AND FROM WHOM) HEALTH CARE IS PROVIDED
A variety of studies have documented the large differences in insurance status and presence of regular providers (versus emergency room visits) among African Americans, Hispanics, and non-Hispanic whites (e.g., Lillie-Blanton, Martinez, and Salganicoff, 2001). In addition, simple differences in where people live will lead to minority patients being seen at different hospitals, and by different providers, from whites. This is not terribly surprising; clearly, hospitals in Washington, DC, will be more likely utilized by African Americans and Hispanics than those in Minot, South Dakota.
To capture this difference, we use a nearly 100 percent sample of Medicare fee-for-service patients who were admitted for a heart attack, or AMI, in 1998-1999; these data come from the National Bureau of Economic Research Medicare claims panel developed by McClellan and Staiger (1999). There were a total of 468,663 admissions in those two years to 4,737 hospitals. Nonblack admissions totaled 439,350, while black admissions were 29,313. We use a Lorenz curve approach to characterize the extent to which black and nonblack AMI patients tend to be admitted to different hospitals, as shown in Figure 16-5. The 4,737 hospitals were sorted according to the total number of black AMI Medicare patients admitted during 1998-1999, starting with the lowest number (to the left) and ranging to the right of the graph showing hospitals with the largest number
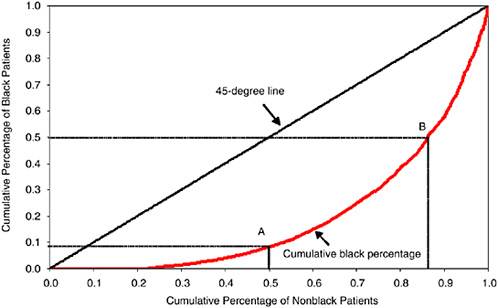
FIGURE 16-5 Lorenz curve showing distribution of black and nonblack AMI patients by hospital of admission.
of black patients. The scale on the horizontal axis is the percentage of total nonblack patients in the sample. The scale on the vertical axis is the percentage of black patients in the sample. Given that we have sorted hospitals in this way, we then plot the cumulative percentage of black admissions on the vertical axis, and the cumulative number of nonblack admissions on the horizontal axis.
The 45-degree line in Figure 16-5 is the hypothetical line one would get if perfect equality held in the distribution of black and nonblack patients by hospital. That is, if every hospital admitted 6.25 black patients per 100 nonblack patients (i.e., 0.0625 = 29,313/468,663), then the hospitals accounting for 50 percent of nonblack patients would also account for the cumulative total of 50 percent of black patients. (The analogy in the economics literature is that the 45-degree line in the Lorenz curve characterizes perfect equality of income.)
As is clear from the graph, however, there is little equality with regard to hospital admissions. Slightly more than one-fifth of nonblack AMI patients are admitted to hospitals with no black AMI patients. Point A shows that 50 percent of nonblack Medicare patients are admitted to hospitals that account for just 9 percent of black patients. Point B shows the converse statistic, that 50 percent of black AMI patients are admitted to hospitals that combined account for just 14 percent of nonblack AMI patients. The Gini coefficient (or the ratio of the area between the 45-degree
line and the curved line, divided by the total area underneath the 45-degree line) is 0.61. Thus, the results of Figure 16-5 suggest that even 35 years after the passage of Title VI and VII of the Civil Rights Act that forbade de jure segregation and discrimination, considerable de facto segregation by race still occurs in the hospitals where whites and blacks seek care.
These patterns are not unique to hospital admissions, and it is likely that differences in where whites and minorities seek care may ultimately reflect differences in where they live. The important work of Massey (2001) on residential segregation confirms our intuition on this fact. Using data on 30 major U.S. cities, Massey finds that dissimilarity indices (the relative number of minorities who would have to migrate in order to establish a uniform distribution of race across neighborhoods) range from 67 in southern cities to 78 in northern ones;8 larger cities such as Chicago, Cleveland, Detroit, and New York had isolation indices of over 80 (implying that in these cities the average African American inhabits a neighborhood that is more than 80 percent black).9
A story similar to racial differences in the hospitals where minorities seek care holds for physicians. In a recent study, Harrison and Thurston (2001) first demonstrated considerable “matching” between minority physicians and minority patients. The degree to which racial matching occurs is striking—in 1991, 47 percent of patients seen by black physicians were black (versus 17 percent for white non-Hispanic physicians), and 30 percent of patients seen by Hispanic physicians were Hispanic (versus 9 percent for white non-Hispanic physicians). However, the differences between white and minority physicians are reduced substantially when the analysis controls for location according to the zip code of the physician’s practice. As the authors suggest, improving health care services for minority populations can be addressed both by increasing the number of physicians (of any race) who live in the area, as well as by increasing the numbers of minority physicians. (See also Cooper-Patrick et al., 1999; however, this study finds greater patient satisfaction and treatment adherence when there is concordance in racial identity between provider and patient.)
These results are useful reminders that when health care more generally exhibits such wide variations across areas, these area differences could be reflected as racial differences at the aggregate level. What is not as well known is how much of the actual differences in where one lives (i.e., the zip code of residence) and selective migration to different hospitals are conditional on where one lives (i.e., whether blacks and whites in a given zip code go to different hospitals).
Furthermore, it is important to put these differences in health care providers in the context of the many other effects of neighborhood on health status more generally. Morenoff and Lynch (see Chapter 11, this volume) have documented the multiple and dynamic causal pathways by
which neighborhood-specific factors can influence long-term health outcomes independent of the type or nature of health care. Thus, access to health care and quality of health care are only two of a variety of factors affecting health that are likely to vary by neighborhood of residence. The work of Oliver and Shapiro (1995) and, more quantitatively, Smith and Kington (1997) provides additional perspective on understanding these facts. Smith and Kingston emphasize noting the difference between income (a relatively transitory measure of socioeconomic status, or SES) and wealth (a more permanent index of SES). Smith and Kington document that wealth disparities across race are substantially larger than income disparities. What is not well understood is the extent to which wealth as well as income can explain racial variations in health care utilization and health care outcomes.
GEOGRAPHIC VARIATIONS IN THE EXTENT OF RACIAL DISPARITIES: AN EXAMPLE
Few studies of racial disparities treat such differences at a regional level. In part, this is the consequence of power considerations; there are not enough observations in most data sets to distinguish racial differences in utilization across regions. In recent work Baicker (2002) utilizes data on heart attack treatments assembled by researchers at Dartmouth College and Stanford University to examine state-level differences in treatment patterns. Figure 16-6 uses these data to provide measures of angioplasty use for several selected states during 1990-1995 using a sample of fee-for-service Medicare patients admitted to hospital for AMI.10 In addition, the U.S. national rates are presented based on a sample size of more than 1 million Medicare patients. These estimates are adjusted for two broad age categories (ages 65 to 80 or greater than 80), gender, and income (whether in the bottom quintile of zip codes as sorted by race-specific income). Generally, sample sizes were very large, and the 95 percent confidence intervals for black PTCA rates were (at most) ±0.025 in the smallest state, Massachusetts, and generally an order of magnitude smaller among nonblacks and in larger states (e.g., ±0.0063 for blacks in New York).
Figure 16-6 shows the remarkable heterogeneity in PTCA rates across selected states and across race in these states. On average, there was a large gap in PTCA rates in the United States, with rates for blacks just 69 percent of those for nonblacks; this result has been established in many other studies. However, a state-by-state analysis suggests some variability in the magnitude of the disparities. In Massachusetts, rates are slightly higher among black Medicare patients, although the results are by no means statistically significant. By contrast, black PTCA rates in Arkansas are just 23 percent of the nonblack rates (p < 0.001). Most states are closer to the national mean difference, such as New York (black rates are 62 percent of
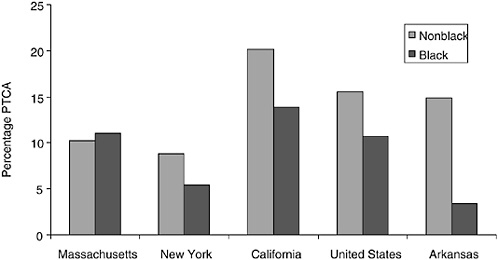
FIGURE 16-6 Ninety-day PTCA rates per AMI patient in the Medicare population, by selected states, 1990-1995.
nonblack rates) and California (69 percent of nonblack rates). Note also the considerable degree of variation across states, so that the PTCA rates for black Medicare patients in California (13.9 percent) are higher than nonblack rates in New York (8.8 percent).
These results are obviously quite preliminary and have not been fully risk adjusted, so they should be interpreted cautiously. Nonetheless, they suggest that racial disparities in utilization are not entirely uniform across regions.
THE INTERACTION BETWEEN GEOGRAPHY AND RACIAL DISPARITIES: STATISTICAL ISSUES
The standard approach to measuring racial disparities in health data makes careful efforts to control for a variety of risk adjusters, including health status, co-morbidities, possibly clinical data on admission, demographic information, and, where possible, income. Often, in quantitative studies, region is not included, either because region is suppressed because of concerns about confidentiality or because of difficulty in how to interpret regional differences.
To see how region can interact with measures of health disparities in a statistical sense, it is useful to begin with a simple example. Table 16-1 shows cardiovascular deaths by race for men in two states, Massachusetts and Mississippi; these statistics were developed by a team of researchers and published by the Centers for Disease Control and Prevention (for details see Barnett et al., 2001). (Results are similar but not as pronounced for
TABLE 16-1 Cardiovascular Deaths per 100,000 Population for Men: Mississippi and Massachusetts
|
|
Black Mortality Rate |
White Mortality Rate |
Ratio: Black/White |
|
Both states combined |
900 |
668 |
1.35 |
|
Mississippi |
1,028 |
835 |
1.23 |
|
Massachusetts |
580 |
616 |
0.94 |
|
SOURCES: Cardiovascular data from Barnett et al. (2001), black and white state population numbers (total, not by sex) and for 1998. |
|||
women.) Were we to combine the data and consider the difference in age-adjusted mortality rates for cardiovascular disease for both states, we would find black mortality rates of 900 per 100,000, and for whites, a corresponding rate of 668.11 In other words, cardiovascular disease is 35 percent higher for blacks than for whites.
However, note that rates of cardiovascular deaths in Mississippi are higher for both blacks and whites. Within Mississippi, rates are 24 percent higher for men, and within Massachusetts, black cardiovascular rates are actually 6 percent below those for white men. Indeed, the overall weighted elevated risk for cardiovascular disease is 15 percent once state-level differences are taken into account. Furthermore, all of the additional mortality is occurring not in Massachusetts, but in Mississippi.
There are many scenarios in which the 35 percent elevated rate would be relevant; for example, how much at risk are African Americans overall to cardiovascular disease? From a policy viewpoint it is useful to decompose that 35 percent difference into two parts: that part attributable to within-state differences (15 percent) and the remaining 20 percent that is caused by African Americans being more likely to live in a state where everyone experiences higher cardiovascular mortality rates. The latter 20 percent (which comprises nearly 60 percent of the total 35 percent disparity) is perhaps best addressed by improving health behaviors and health care for all citizens of Mississippi.
The point of this exercise is not to argue that the 35 percent elevated rate observed in these two states is not the consequence of deep-rooted discrimination, nor does it rule out the presence of disparities in health among blacks even in Massachusetts. Instead, we are trying to suggest that it is useful to decompose overall black-white differences in health outcomes (or health care utilization) into two parts. First, there could be discrimination by providers and hospitals (or the health care system), and second, there could be economic and social discrimination (or a historical legacy) that affects the location decisions of minorities. This chapter focuses on the role of the first source of disparities, not on the second. It is critical to note that ruling out the first does not rule out the second (or for that matter, vice versa).
A similar issue can be seen in evaluating quality of care for blacks and whites as measured by specific treatment regimes for AMI patients. For example, beta blockers are effective in extending survival because they lower blood pressure and reduce the demands placed on a weakened heart following AMI. Most clinicians would agree that the rate of beta blockers among patients who are not contraindicated for such therapy should be near 100 percent. Yet as one important study demonstrated using data from the Cooperative Cardiovascular Project (CCP) during 1993-1994, actual rates of compliance were considerably below 100 percent, and in some states were below 50 percent (Jencks et al., 2000). Figure 16-7 graphs on the vertical axis the percentage of AMI patients for whom chart review indicated that beta blockers were appropriate, while the horizontal axis graphs the percentage of people living in that state who were African American; the lowest rate of compliance was in Mississippi (47 percent). (For the moment, we exclude Washington, DC.) There is a distinct and significant negative correlation between the percentage of the state that is African American and the quality of care as measured by the use of beta blockers.12 A state-level regression implies that black rates of beta-blocker compliance are 32 percentage points lower than for nonblacks.
However, another study that used the same CCP data found little overall difference in the use of beta blockers at discharge by race (Rathore et al., 2000). Unadjusted odds ratios were 0.90, but after adjusting for differences in clinical presentation, the odds ratio was just 0.96, which, although significant, implied just a 1 percentage point lower rate in the use of beta blockers for African Americans.
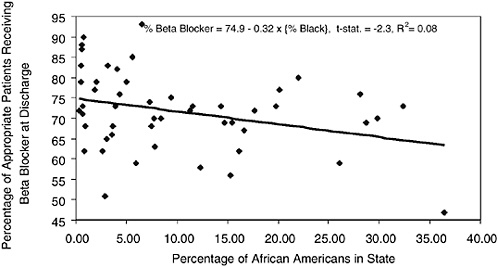
FIGURE 16-7 Percentage of appropriate AMI patients treated with beta blockers at discharge and percentage African American, by state.
Why the difference? One reason may be that the model also adjusts for differences in poverty rates, which do exert a significant influence on beta-blocker use (odds ratio = 0.93). More importantly, however, the regression controlled for Census region and for hospital volume, and while Census regions are crude measures of regional variation, they effectively limit differences in utilization of beta blockers to within-region comparisons. In other words, it is not simply the large African-American population in Mississippi that leads to such low compliance with the use of beta blockers where appropriate; it would appear that white AMI patients in Mississippi are not getting beta blockers either.13 Nonetheless, this example illustrates the risks of making inferences about individual behavior based on aggregated data.
This problem is generally referred to as “ecological fallacy” and is well known in both the public health literature and in the political science literature (King, 1997; Susser, 1994a, 1994b). In theory, one can “solve” the ecological fallacy problem with the use of microlevel data with both race and location identifiers, but in practice that is often difficult. Often one must aggregate data at some level to identify community or region-specific effects that may themselves reflect a variety of unmeasured confounding variables.14
The results shown in Figure 16-8 illustrate state-level performance of general measures of health care quality by Jencks et al. (2000) and are taken from Fisher and Skinner (2001).15 They show a southward progression from the Northeast (New Hampshire and Vermont, ranked numbers 1 and 2 in state-level quality) to the Deep South (Louisiana and Mississippi ranked 49 and 50, respectively; Washington, DC, dropped to 34 in the ranking). The first point is that conventional t-statistics in state-level regressions are overstated; these are not independent draws of 50 states.
Figures 16-8 also displays Medicare spending by state in 1996. The estimated spending values are adjusted for the fact that some states have more elderly people in the population or a sicker population. (The elderly in states such as Louisiana and West Virginia are indeed sicker—and we allow for their greater health needs in calculating per-capita Medicare spending.) The spending data, from the Dartmouth Atlas of Health Care Working Group (http://www.dartmouthatlas.org), do show remarkable differences in per-capita Medicare spending across states, ranging from $2,763 in Oregon to $5,668 in Texas and $6,307 in Alaska. The pattern of the dots, each of which represents a state, shows that more spending per capita does not appear to be related to better quality; if anything, it appears to be associated with worse care (Fisher and Skinner, 2001). We do not believe that increasing spending will reduce the quality of care. Connecticut and Massachusetts are both high-cost states, but ranked in the top 10 in terms of quality. Instead, we think that spending on Medicare is largely indepen-
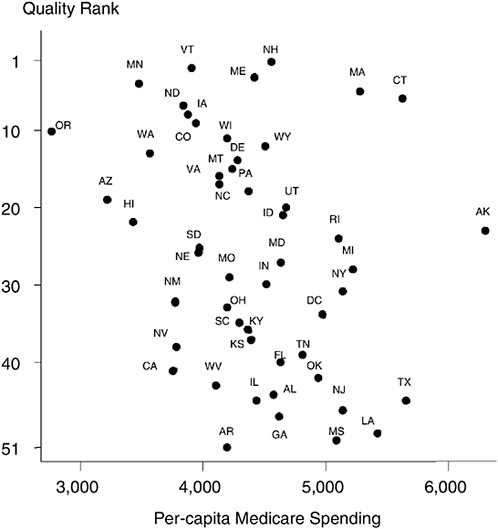
FIGURE 16-8 Geography and the quality of health care.
dent of how well physicians follow clinical guidelines for appropriate care, such as prescribing the right set of drugs for heart attack patients or screening for common and treatable diseases. High-quality care is not necessarily expensive care (Wennberg et al., 2002).
The second point is that this pattern is replicated in other studies showing a correlation between outcomes and percentage African American (Deaton and Lubotsky, 2001), rather than a correlation, as earlier hypothesized, between income inequality and mortality (Kennedy, Kawachi, and Prothrow-Stith, 1996).16 Because there are many factors that seem to align themselves along this geographical dimension from New England to the
South (percentage black, income inequality, quality of health care), the ecological fallacy problem is particularly relevant here. The point to note from Figure 16-8 is that the states where many blacks live—Mississippi, Louisiana, Georgia, and Alabama—are all “low-quality” providers. The Northeast tends to comprise the “high-quality” providers, but as is well known, with the exception of the New York City area, these states have a small African-American population.
Even when researchers do specify regional covariates, they are often not specific to actual geographical patterns of health care use and outcomes; while incorporating state or MSA fixed effects is an improvement over ignoring them, they are still a highly simplistic characterization of the data, because patient migration patterns are not necessarily constrained by state or MSA boundaries. For example, blacks who live in Covington, Kentucky, will find it much easier to seek care in Cincinnati, Ohio (1 mile away across the Ohio river) versus driving to Louisville, Kentucky, or Lexington, Kentucky. The same story can be told for any large urban population center that encompasses several states (consider, e.g., large east coast cities such as Boston, Providence, Philadelphia, New York, Washington, DC).17 Although the Dartmouth Atlas’ use of HRR attempts to circumvent these problems by using zip code location and migration data to assign individuals to hospitals, even these measures likely understate true differences across HRRs in utilization variability.18
We next consider the statistical issues at a more general level: how specification of risk adjusters and geography can dramatically affect the bias in estimated regression coefficients. To illustrate the importance of geography and focus the discussion, we simplify the analysis and assume that high-quality data have been obtained which avoids problems with unmeasured confounding variables; any errors in measuring the “true” relationship arises because of model specification. For the purpose of these pictures, geography may be thought to be a variable such as hospital quality; this link is especially persuasive if we recall the previous discussion on hospital quality and residential segregation.
Figures 16-9a-9c simulate the estimation of simple regressions, where the parameter of interest is the coefficient on race (in our simple example, the coefficient on an indicator variable for “black”). In Figure 16-9a, we illustrate two data “clouds” for blacks and whites. Mortality is plotted on the y-axis and the x-axis measures the quality of health care provided at the relevant regional level. Ideally, this would be at the level of individual HRRs. Blacks are shown to have higher mortality than whites. However, this is entirely shown to be driven by geography—blacks live in regions or seek care at hospitals that provide low-quality care. Blacks and whites who live in the same region have the same outcomes. As we showed earlier, omitting quality or the correct measure of geography from the regression
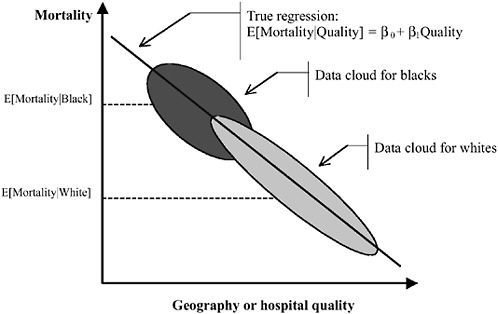
FIGURE 16-9a Geography and the measurement of racial disparities. Omitting quality or the correct measure of geography from the regression and comparing the racial difference in mortality (risk adjusted or otherwise) will yield an estimate of Δ = E[Mortality|Black] − E[Mortality|White]. However, if whites are more likely to be seen at high-quality hospitals than blacks, Δ is overstated. In the true regression, there is no effect of race on mortality within hospitals or geographic area.
and comparing the racial difference in mortality (risk adjusted or otherwise) will yield an estimate of
However, if whites are more likely to be seen at high-quality hospitals than blacks, Δ is overstated. In the true regression, there is no effect of race on mortality within hospitals or geographic area.
In Figure 16-9b we assume that within-area blacks receive worse care than whites, but that this differential is constant over areas. Here, African Americans have worse outcomes even within the same hospitals. This correct race difference is β2 (the distance between the lines for blacks and whites at the same level of quality, or within the same geographical unit). Omitting quality or the correct measure of geography from the regression and comparing the racial difference in mortality (risk adjusted or otherwise) will yield an estimate of Δ = E[Mortality|Black] − E[Mortality|White]. It can be seen that Δ considerably overstates β2.
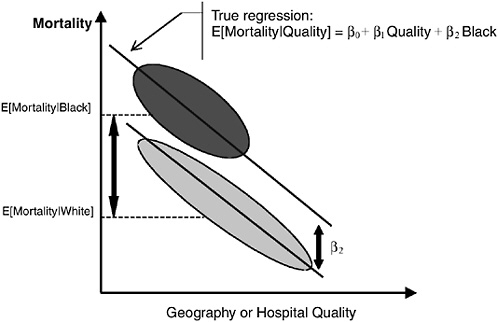
FIGURE 16-9b Geography and the measurement of racial disparities. Here, African Americans have worse outcomes even within the same hospitals. This correct race difference is β2 (the distance between the lines for blacks and whites at the same level of quality, or within the same geographical unit). Omitting quality or the correct measure of geography from the regression and comparing the racial difference in mortality (risk adjusted or otherwise) will yield an estimate of Δ = E[Mortality|Black] − E[Mortality|White]. It can be seen that Δ considerably overstates β2.
An indirect example of estimating this model may be seen in the careful work of Morrison, Wallerstein, Natale, Senzel, and Huang (2000), who study the relationship between the racial composition of neighborhoods in New York and the degree to which pharmacies in these neighborhoods carried opioid supplies.19 After controlling for the fraction of the local population that is elderly at the Census block level, the authors find that only 25 percent of the pharmacies in the largely nonwhite neighborhoods (those with nonwhite populations of 60 percent or larger) carried opioids. In contrast, in predominately white neighborhoods (those where more than 80 percent of the residents are white), over 72 percent of pharmacies carried the requisite supplies. The Morrison studies provide an intuitive description of Figures 16-9a and 16-9b: If the researcher does not control for geography and simply asks whether minorities are less likely to be near a well-stocked pharmacy (relative to whites), the conclusion would be yes. However, the point of Figure 16-9b is to note that whites who live in predominately nonwhite neighborhoods are also not near an adequately stocked pharmacy.
In Figure 16-9c, we illustrate the problems of ignoring differential quality effects. Here, African Americans have worse outcomes even within the same hospitals, and the race difference grows in worse hospitals. This correct race differential is β1Quality + β2. Graphically, this is the height of the larger arrow. Omitting the Quality × Race interaction leads to severely understating the gap (the regression line will be weighted heavily by the white data), and the height of the smaller arrow is incorrectly estimated to be the race difference.
In practice, of course, the problem of unmeasured confounding variables is quite serious, even for very good data sets such as the CCP. Suppose the researcher estimates a model of the form:
Mortality (say 30-day mortality after AMI) for the ith individual is regressed on a vector of risk-adjustment controls (the Z matrix), and an indicator variable for whether the individual was African American. Here, the coefficient on race (here, an indicator variable for whether the respon-
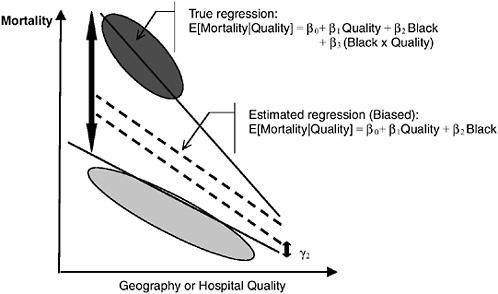
FIGURE 16-9c Geography and the measurement of racial disparities. Here, African Americans have worse outcomes even within the same hospitals and the race difference grows in worse hospitals. This correct race differential is β1Quality + β2. Graphically, this is the height of the larger arrow. Omitting the quality × race interaction leads to severely understating the gap (the regression line will be weighted heavily by the white data), and the height of the smaller arrow is incorrectly estimated to be the race difference.
dent is an African American) is the parameter of interest. If the risk adjusters Z are complete, then it is possible to interpret the estimated coefficient β1 as the effect of being black on mortality. However, the assumptions necessary to justify such a conclusion are very strong. First, as noted earlier, the presumption is that racial differences are the same across regions (as in Figure 16-9b), a finding that does not appear to be true in practice. (One might still interpret the coefficient as a weighted average, of course.)
Second, it presumes that the researcher has controlled for all biological or genetic differences that persist even once measurable risk adjustment has been made. If controls for co-morbidities are not complete and blacks are unobservably sicker than whites, we will overstate the coefficient estimate for β1; otherwise the categorical variable on race will “pick up” all the unmeasured variables that differ by race. For example, in evaluating the use of thrombolytics (medications that dissolve blot clots) for the treatment of coronary disease, it is of first-order importance to know that such interventions are contraindicated for those patients who have had a recent hemorrhagic stroke. If blacks are more likely to have suffered from a stroke, documenting lower thrombolytic prescription rates alone, without appropriate covariates, is not meaningful.
Third, the model as estimated presumes that the influence of either co-morbidities or treatments are the same for both whites and blacks. Barbara McNeil, in her Shattuck Lecture, emphasized the importance of noting clinically relevant drug and race interactions (McNeil, 2001). For example, biological differences between races in receptor polymorphisms will cause different responses to the same drugs. A series of papers in the New England Journal of Medicine reflects these concerns. Among patients with congestive heart failure and left ventricular dysfunction, the use of Enalaprin or Bucindolol (angiotensin-converting enzyme inhibitors) reduced hospitalizations for whites and nonwhites respectively, but not for blacks (Exner et al., 2001). Similarly, Chen et al. (2001) note that African-American patients who have had an AMI are more likely to have negative or oftentimes unclear cardiograms at the moment of presentation, thereby complicating the ensuing diagnoses.
One approach to avoiding such statistical pitfalls is to use the insights of the Oaxaca-Blinder decomposition approach, used previously in the economics literature to evaluate racial wage disparities (Blinder, 1973; Oaxaca, 1973, 1975); more recently this approach has been used to measure racial disparities in health care (Balsa and McGuire, 2002). This approach counsels against pooling patient data across race or ethnic identity, but instead prescribes estimating the type of model above for just (say) whites. One can then ask: What would be the implied results (whether utilization or health outcome) for blacks or Hispanics given their own levels of covariates Z and the set of coefficients estimated for whites, Γw?
Skinner, Staiger, Chandra, Lee, and McClellan (2002), for example, used this approach to measure differences in average hospital quality for African-American AMI patients. They did not attempt to directly measure differences in outcomes between blacks and nonblacks within a given hospital. Instead, they used only nonblack AMI adjusted mortality rates to measure hospital “quality” for both blacks and nonblacks. Thus if blacks tended to be admitted to hospitals with higher nonblack mortality rates, hospital quality was deemed to be lower for blacks than for nonblacks. (The critical assumption in using nonblack mortality rates as a measure of quality is that the authors can adjust for differences in underlying health status for nonblacks living in largely black areas compared to nonblacks living in largely white areas.) This focus on identifying the degree to which the observed racial disparities are explained by hospital quality alone has the strength of not being contaminated by other potentially important factors, such as provider-patient interactions and patient preferences.
In equation form, average 30-day mortality rates for whites at the national level, Mw, can be written as the weighted average of mortality rates for each of the i = 1,…, N hospitals in the United States:
where fw(i) is the transformed mean of Zw, and is equal to the fraction of nonblack Medicare AMI patients who are admitted to hospital i (so that Si f(i) = 1) and Q2w(i) is the quality measure, in terms of differential 30-day mortality, for hospital i among nonblack patients. The alternative counterfactual measure of mortality Mw* is predicted mortality under the assumption that nonblack AMI Medicare patients are admitted to the same distribution of hospitals as are black AMI Medicare patients:
where fb(i) is again the transformed value of Zb, the distribution of hospitals to which black AMI patients are admitted. The difference, Mw − Mw*, is defined to be the component of mortality rates for black AMI patients that is the consequence of differential admission (by race) to high- or low-quality hospitals (see Figure 16-10). Preliminary results by Skinner et al. (2002) suggested lower quality levels among hospitals to which African Americans were admitted, but little difference in mortality within hospitals.
At first glance, this study may appear to contradict many of the findings reviewed in the recent IOM study (Smedley et al., 2002). It seeks to explain the observed racial disparity that has been noted in the countless other studies (reviewed in the IOM report) as a function of differences in where care is sought. It does not rule out the role of provider discrimination
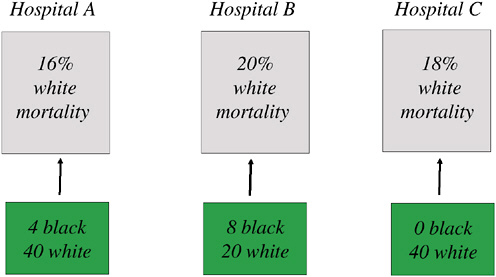
FIGURE 16-10 Differential migration of AMI patients: An example with 100 whites, 12 African Americans.
NOTE: In this example, the “true” mortality rate for whites is determined by the share of white patients going to each hospital times the 30-day mortality rate for whites within each hospital, or M = (16 × 40 + 20 × 20 + 18 × 40)/100 = 17.6 percent. The counterfactual mortality rate is determined by imposing the migration patterns for blacks, who largely are admitted to Hospital B, to whites, leading to an alternative mortality measure M* = (16 × 4 + 20 × 8 + 18 × 0)/12 = 18.7 percent. If whites were to be admitted to the same hospitals as African Americans in this simple example, mortality rates would be predicted to rise by 1.1 percent, or the difference between 18.7 percent and 17.6 percent.
in explaining outcomes, but notes the striking degree to which whites and blacks who are seen at similar hospitals tend to have similar outcomes. In fact, many of the studies reviewed in the IOM report are consistent with the findings of this chapter. Consider, for example, the IOM discussion of the 13 high-quality studies on racial and ethnic disparities in cardiovascular care. Out of the hundreds of studies that IOM reviewed, these 13 are highlighted because they use clinical (chart) data to adjust for co-morbidities, which is superior to the use of administrative data. Furthermore, they accounted for the use of cardiovascular services by including measures of the appropriateness of care. Of these studies, only two, Carlisle et al. (1997) and Leape et al. (1999), and found no racial and ethnic disparities in care after controlling for insurance status, co-morbidities, and severity.
What separates these studies from the others? We note that the Leape study uses data from 13 New York hospitals and tests for racial differences in revascularization. On the basis of the RAND appropriateness criteria, all patients in the study were classified as being proper candidates for the
requisite intervention. However, it is important to note that the analysis also controls for the hospital that the patient was treated at (through the inclusion of a hospital fixed effect). As noted earlier, regions vary substantially with regard to the degree of racial differences in utilization; controlling for hospital effects could have further attenuated such differences.
These studies taken together suggest an additional focus for improving quality of care among the black elderly population. If African Americans are more likely to be seen at low-quality hospitals, public policies that attempt to improve hospital quality would disproportionately benefit African Americans. This conclusion remains consistent with one of the salient conclusions of the IOM report:
Significantly, minority access to better quality facilities is often limited by the geographic distribution of care facilities and patterns of residential segregation, which results in higher quality facilities being less accessible (Smedley et al., 2002, Chapter 3, p. 114).
GEOGRAPHY AND RACIAL DISPARITIES: POLICY IMPLICATIONS AND CONCLUSIONS
Most studies in the literature on health disparities find dramatic differences in utilization by race, but are generally vague on the question of whether differences are driven by demand (e.g., blacks do not want the more intensive care) or supply (e.g., physicians treat blacks with otherwise identical characteristics differently) or perhaps that blacks and whites differ by unmeasured health characteristics (e.g., Johnson, Lee, Cook, Rouan, and Goldman, 1993) or respond to different nonmedical incentives such as insurance coverage. Hence most studies do not provide strong policy prescriptions on how one goes about fixing the problem. It is often useful to characterize such differences into three general categories:
-
Preferences, or the underlying demand “function” by patients.
-
“Supply” or physician, health professional, and hospital behavior.
-
Implicit and explicit “prices,” or differences in insurance coverage, travel time, and other factors without explicit prices such as location of residence that are likely to affect behavior.
A massive body of literature in social science and medicine may be classified under the first two categories. Indeed, the recent IOM report provides a detailed literature review of these two categories. The report concludes that while a small number of studies demonstrate that minority patients are more likely to refuse care, these differences in refusal rates are insufficiently large to explain a significant share of the observed disparities. A smaller subset of studies has also considered the impact of insurance coverage
and travel time on utilization. We group location in this third categorization; in theory, an individual could travel 300 miles to a different hospital, but the costs of travel broadly defined (including the potential for adverse outcomes during the travel) are too high to make it feasible. Most health care is local, and we believe that this third category is critical in evaluating evidence for racial disparities and developing policies to reduce such disparities.
We would suggest that, if possible, racial disparities be decomposed into their proximate causes, for example, with respect to “across hospital” variation (i.e., patients are more likely to be admitted to hospitals with perhaps less aggressive treatment protocol) and “within hospital” variation (i.e., black, Hispanic, and non-Hispanic white patients are treated differently within a hospital). Both variations can lead to lower utilization rates for minority populations; the difference, however, lies in the policy implications. The latter type of variation clearly involves the internal workings of specific hospitals or provider groups, and further inquiry into causes of such differences (financial barriers, preferences of patients, or provider behavior) is clearly warranted. The former type of variation, however, relates less to race per se and more to geographical variations in treatment patterns of all patients.
The research on regional variations, health outcomes, and shared decision making provides illuminating lessons particularly with theses types of variations. For example, a cursory examination of the medical and social science literature on racial disparities in outcomes reveals that for nearly every study, the white treatment rate is seen as the “gold standard” against which to evaluate black outcomes. This may or may not be the right approach: For economists interested in the study of the racial wage gap, for example, it makes sense to view white wages or white test scores as the standard against which black outcomes should be measured (Chandra, 2000, 2002). Increases in incomes, wealth, or test scores are viewed as being desirable, and decreases in these measures are viewed unanimously as being adverse events. However, with medical outcomes there are at least two reasons why the above logic may not translate over.
First, a number of recent studies suggest that “more is not necessarily better.” Simply put, the fact that whites have higher rates of PCI or bypass surgery following AMI does not necessarily mean that blacks should have the same rate (Schwartz et al., 1999).20 This is because it is entirely possible that the white rate of PTCA is a consequence of aggressive medicine and is therefore not the desired benchmark. In the technical jargon of economics, if physicians are operating in a region of negative marginal product on the production function, then scaling back on intensity could actually improve outcomes. Similar issues are considered in asking whether some regions that practice more intensive health care are in fact practicing “flat of the curve” medicine with no observable benefit in terms of better health outcomes (Skinner, Fisher, and Weinberg, 2001).
For example, in a widely publicized study, actors of different races and gender described identical symptoms in videos that were then shown to physicians, who were then asked whether they would prescribe cardiac catheterization (Schulman et al., 1999).21 The results of the study indicated that for the actors who were white males, black males, and white females, prescribed catheterization rates of about 91 percent were identical. For the two actresses who were African American, prescribed catheterization rates were 79 percent. (These findings were reported to the media in a quite different way; see Schwartz et al., 1999.) The researchers suggested such differences were evidence of provider discrimination, but what is not known is whether the 91 percent rate is too high or the 79 percent rate is too low (or both) (Schwartz et al., 1999). This question also has been confronted in studies of geographical variation; we don’t know which rate is correct (Tu et al., 1997; Wennberg, 1986).
This point also constitutes the central thesis of a recent paper by Schneider et al. (2001). In this important paper, the authors use RAND criteria to classify Coronary Artery Bypass Grafting (CABG) and PTCA procedures on a sample of Medicare beneficiaries who had undergone coronary angiography. The sample was drawn from more than 170 hospitals, and each beneficiary’s treatment was classified as being appropriate, uncertain, or inappropriate.22 The authors found that there was substantial cross-state variation in the inappropriate use of both bypass surgery (CABG) and PTCA; for PTCA inappropriate rates were 24 percent in California, 14 percent in Pennsylvania, 8 percent in Georgia, and 12 percent in Alabama. These regional differences clearly have implications for the percentage of Hispanics and African Americans receiving inappropriate care. Furthermore, they find almost all of the measured racial gap in PTCA revascularization is explained by the higher rate of inappropriate care for whites as well as higher rate of PTCA that is viewed as being of “uncertain” legitimacy. By contrast, they found lower rates of CABG use where appropriate among African-American patients.
The null hypothesis in the racial disparities literature always appears to be that there should be no differences in utilization. This is reasonable for procedures where nearly 100 percent of patients should be in favor of such treatments (immunization, eye exams for diabetics) or where 100 percent of patients should be against treatment (inappropriate PTCA as mentioned earlier). It is not unreasonable, however, that preferences for certain types of care may differ across patients, even for demonstrably effective elective surgical procedures (where appropriate) such as hip replacements. It is highly unlikely that observed differences in utilization can be attributed solely to preferences, however. Preferences for a kidney transplant were slightly lower among African-American men and women, but these differences in preferences could explain only a fraction of overall racial differ-
ences in transplant rates (Ayanian, Cleary, Weissman, and Epstein, 1999). When seriously ill patients were asked about preferences for life-sustaining technology, preferences among African Americans were stronger for more intensive care (Hopp and Duffy, 2000). Still, it should be kept in mind that the null hypothesis is not exact equality across racial or ethnic groups, but instead that rates of procedures (by race) match with informed preferences for that procedure.
In summary, this chapter has argued that local area variations need to be taken seriously in considering racial disparities in health care. This is true for two reasons: First, statistical pitfalls can trip up otherwise careful and valid empirical research documenting the existence and prevalence of disparities. Second, the policy solutions to racial disparities that occur because African Americans and Hispanics tend to live in different places from non-Hispanic whites are quite different from the more obvious sources of racial differences in treatment within a hospital or provider group. A potentially important, but not well understood, source of racial disparities cannot be solved by equal access to health care at the local level, or by universal health insurance for everyone. Instead, the disparities that occur when hospital or provider quality is worse in regions with a larger percentage of African Americans can be solved only by addressing the problem of geographic disparities in health care. Furthermore, reducing geographic disparities is likely to have a first-order impact on improving racial disparities in health care and health outcomes.
ACKNOWLEDGMENTS
We have benefited from conversations with Elliott Fisher, Douglas Staiger, Kate Baicker, and Jack Wennberg, and this chapter draws on our work with these individuals. We are grateful to the National Institute of Aging for generous support and to Angus Deaton, Christopher Jencks, Jim Smith, Richard Suzman, two anonymous reviewers, and other participants at the National Research Council Workshop on Ethnic Disparities for useful comments. Chandra also acknowledges support from the Nelson A. Rockefeller Center through the Rockefeller Faculty Fellowship program. All errors are our own.
Annex to Chapter 16
DEFINITIONS USED IN THE DARTMOUTH ATLAS OF HEALTH CARE23
Hospital Service Areas
Hospital Service Areas (HSAs) represent local health care markets for community-based inpatient care. The definitions of HSAs used in the 1996
edition of the Atlas were retained in the 1999 edition. HSAs were originally defined in three steps using 1993 provider files and 1992-1993 utilization data. First, all acute care hospitals in the 50 states and the District of Columbia were identified from the American Hospital Association Annual Survey of Hospitals and the Medicare Provider of Services files and assigned to a location within a town or city. The list of towns or cities with at least one acute care hospital (N = 3,953) defined the maximum number of possible HSAs. Second, all 1992 and 1993 acute care hospitalizations of the Medicare population were analyzed according to zip code to determine the proportion of residents’ hospital stays that occurred in each of the 3,953 candidate HSAs. Zip codes were initially assigned to the HSA where the greatest proportion (plurality) of residents were hospitalized. Approximately 500 of the candidate HSAs did not qualify as independent HSAs because the plurality of patients resident in those HSAs were hospitalized in other HSAs. The third step required visual examination of the zip codes used to define each HSA. Maps of zip code boundaries were made using files obtained from Geographic Data Technologies, and each HAS’s component zip codes were examined. To achieve contiguity of the component zip codes for each HSA, “island” zip codes were reassigned to the enclosing HSA, and/or HSAs were grouped into larger HSAs. This process resulted in the identification of 3,436 HSAs, ranging in total 1996 population from 604 (Turtle Lake, North Dakota) to 3,067,356 (Houston) in the 1999 edition of the Atlas. Intuitively, one may think of HSAs as representing the geographic level at which “front end” services such as diagnoses are received.
Hospital Referral Region
Hospital Service Areas make clear the patterns of use of local hospitals. A significant proportion of care, however, is provided by referral hospitals that serve a larger region. Hospital Referral Regions were defined in the Atlas by documenting where patients were referred for major cardiovascular surgical procedures and for neurosurgery. Each Hospital Service Area was examined to determine where most of its residents went for these services. The result was the aggregation of the 3,436 HSAs into 306 HRRs. Each HRR had at least one city where both major cardiovascular surgical procedures and neurosurgery were performed. Maps were used to make sure that the small number of “orphan” hospital service areas—those surrounded by HSAs allocated to a different HRR—were reassigned, in almost all cases, to ensure geographic contiguity. HRRs were pooled with neighbors if their populations were less than 120,000 or if less than 65 percent of their residents’ hospitalizations occurred within the region. HRR were named for the HSA containing the referral hospital or hospitals used most often by residents of the region. The regions sometimes cross state bound-
aries. Intuitively, one may think of HRRs as representing the geographic level at which “back end” services such as invasive surgery are received.
ENDNOTES
|
1. |
For a partial list of references, see Alter et al. (1999); Blustein and Weitzman (1995); Chen et al. (2001); Gornick et al. (1996); Peterson et al. (1997); Rathore et al. (2000); and references therein. |
|
2. |
Also see Skinner et al. (2001) for measures of morbidity (i.e., heart attacks, stroke, gastrointestinal bleeding, colon cancer, lung cancer) across HRRs as developed in the Dartmouth Atlas of Health Care (Wennberg and Cooper, 1999). |
|
3. |
The “flat of the curve” refers to a region where the marginal health intervention has zero impact on outcomes. For economists, this corresponds to the region of zero marginal product. This notion is formalized by Skinner and colleagues (2001); and Wennberg et al. (2002). |
|
4. |
It is possible that much of the observed variation reflects random deviations from identical practice patterns across communities (Diehr, Cain, Kreuter, and Rosenkranz, 1992). While this possibility must be considered for smaller samples, the very large samples in the Medicare claims data preclude this explanation; also see McPherson, Strong, Epstein, and Jones (1981). |
|
5. |
In statistical analysis, controlling implicitly for selection using the percentage of HMO enrollees in the area has not affected empirical estimates. Beginning in 2000, HMOs were expected to report hospital procedures to the Centers for Medicare and Medicaid Services, suggesting better data on managed care enrollees in the future. |
|
6. |
For further details on the construction methods, see http://www.dartmouthatlas.org/99US/toc8.php. |
|
7. |
Illness has been controlled for by using age-sex-race-specific mortality and hospitalization rates for five conditions: hip fracture, cancer of the colon or lung treated surgically, gastrointestinal hemorrhage, acute myocardial infarction, or stroke. These conditions were chosen because hospitalization for them is a proxy for the incidence of disease. The cost of living indices were computed by using nonmedical regional price measures. Doing so avoids contaminating the analysis with physician workforce or hospital market conditions. |
|
8. |
Values of the index over 60 are considered high. It means that 60 percent of the members of one group would need to move to a different neighborhood in order for the two groups to be equally distributed. |
|
9. |
The isolation index measures the extent to which minority members are exposed only to each other, and is calculated as the minority-weighted average of the minority proportion in each area. |
|
10. |
States are used instead of HRRs to increase statistical power. |
|
11. |
Population weights are for the state-specific African-American and non-African American population for both men and women, not just men alone. |
|
12. |
We are grateful to Melinda Pitts for pointing out this correlation to us. |
|
13. |
Furthermore, the means for beta-blocker use differ substantially between the two studies—56 percent versus 72 percent, suggesting different criteria may have been used to determine appropriateness. |
|
14. |
When Washington, DC, is included in the sample, the observed (unweighted) negative correlation disappears. This is because DC is an “outlier”—the population is 61 percent African American, but exhibits 93 percent beta-blocker use. |
|
15. |
Jenks et al. (2000) rank states on the basis of whether interventions that are known to be correct were administered for conditions such as AMI, heart failure, stroke, pneumonia, screening for breast cancer for women aged over 53, and eye exams and lipid profiles for diabetics. |
|
16. |
Thus, percentage African American may be a better proxy for SES than income or other indirect measures of economic well-being. This interpretation is one that will be consistent with the results presented in this chapter. However, it would not be a proxy for income or social inequality, as is demonstrated conclusively by Deaton and Lubotsky (2001). |
|
17. |
More technically, one might think of this error as being identical to measurement error in a covariate (geography, in our example). For a subset of observations, the wrong state has been included (Kentucky instead of Ohio). In general, measurement error biases the coefficient toward zero, implying that the researcher is prone to incorrectly concluding that geography does not matter. |
|
18. |
For example, if 15 percent of the residents in HRR A seek care in the more aggressive HRR B, then because HRR measures of utilization are based on residence, the measured level of utilization for HRR A would be higher than is the true level of utilization in its local hospitals. |
|
19. |
Opioids refer to codeine, morphine, and other drugs whose effects are mediated by specific receptors in the central and peripheral nervous systems. They are used for severe pain management in cancer patients. |
|
20. |
CABG is surgery in which a vein is harvested from the leg, or an artery is harvested from the internal mammary artery, to bypass the coronary artery that has narrowed because of the buildup of atherosclerotic plaque. |
|
21. |
Cardiac catheterization (or an angiogram) is a nonsurgical procedure performed under X-ray guidance in a cardiac catheterization lab to aid in the diagnosis of coronary artery disease. |
|
22. |
The RAND appropriateness criteria for CABG and PTCA are discussed by Leape et al. (1999). These criteria are not based on the cost of the procedure, and classify a procedure as being appropriate or inappropriate based on the expected health benefit (quality of life or longevity) versus the expected health costs (probability of death or disability). The criteria are constructed for nearly 3,000 clinical scenarios or indications. |
|
23. |
We have duplicated the definitions used by Wennberg and Cooper (1998, 1999). For further details on the construction methods, see http://www.dartmouthatlas.org/99US/toc8.php. |
REFERENCES
Alter, D.A., et al. (1999). Effects of socioeconomic status on access to invasive cardiac procedures and on mortality after acute myocardial infarction. New England Journal of Medicine, 341(19), 1359-1368.
Ayanian, J.Z., Cleary, P.D., Weissman, J.S., and Epstein, A.M. (1999). The effect of patients’ preferences on racial differences in access to renal transplantation. New England Journal of Medicine, 341(22), 1359-1368.
Baicker, K. (2002). The government subsidization of hospital care and health care outcomes. Unpublished, Dartmouth College.
Balsa, A.I., and McGuire, T.G. (2002). Testing for statistical discrimination: An application to health care disparities. Unpublished, Department of Health Care Policy, Harvard Medical School.
Barnett, E., Casper, M., Halverson, J., et al. (2001). Men and heart disease: An atlas of racial and ethnic disparities in mortality. Atlanta: Centers for Disease Control and Prevention.
Bikhchandani, S., Chandra, A., Goldman, D., and Welch, I. (2002). The economics of Iatroepidemics and Quakeries: Physician learning, informational cascades and geographic variation in medical practice. Department of Economics, Dartmouth College, working paper.
Blinder, A.S. (1973). Wage discrimination: Reduced form and structural estimates. Journal of Human Resources, 8(4), 436-455.
Blustein, J., and Weitzman, B.C. (1995). Access to hospitals with high-technology cardiac services: How is race important? American Journal of Public Health, 85, 345-351.
Carlisle, D.M., Leake, B.D., and Shapiro, M.R. (1997). Racial and ethnic disparities in the use of cardiovascular procedures: Associations with type of health insurance. American Journal of Public Health, 87, 263-267.
Casper, M., Barnett, E., Halverson, J., et al. (2001). Women and heart disease: An atlas of racial and ethnic disparities in mortality. Atlanta: Centers for Disease Control and Prevention.
Centers for Medicare and Medicaid Services. (2000). Health and health care of the elderly population: Data from the 1996 Current Beneficiary Survey. Washington, DC: U.S. Department of Health and Human Services.
Chandra, A. (2000). Labor market dropouts and the racial wage gap. American Economic Review, 90(2), 333-338.
Chandra, A. (2002). Is the convergence in the racial wage gap illusory? Unpublished, Department of Economics, Dartmouth College.
Chen, J., Rathore, S.S., Radford, M.J., Wang, Y., and Krumholz, H.M. (2001). Racial differences in the use of cardiac catheterization after acute myocardial infarction. New England Journal of Medicine, 344(19), 1443-1449.
Cooper-Patrick, L., Gallo, J.J., Gonzales, J.J., Vu, H.T., Powe, N.R., Nelson, C., and Ford, D.E. (1999). Race, gender and partnership in the patient-physician relationship. Journal of the American Medical Association, 282(6), 583-589.
Deaton, A., and Lubotsky, D. (2001). Mortality, inequality and race in American cities and states. (NBER Working Paper No. 8370). Cambridge, MA: National Bureau of Economic Research.
Diehr, P., Cain, K.C., Kreuter, W., and Rosenkranz, S. (1992). Can small area analysis detect variation in surgery rates? The power of small area variations analysis. Medical Care, 30(6), 484-502.
Exner, D.V., Dries, D.L., Domanski, M.J., and Cohn, J.N. (2001). Lesser response to angiotensin-converting-enzyme inhibitor therapy in black as compared with white patients with left ventricular dysfunction. New England Journal of Medicine, 344, 1351-1357.
Fisher, E.S., and Skinner, J. (2001). Geography and the debate over Medicare reform. Health Affairs, 21(1).
Fisher, E.S., Wennberg, J.E., Stukel, T.A., and Sharp, S. (1994). Hospital readmission rates for cohorts of Medicare beneficiaries in Boston and New Haven. New England Journal of Medicine, 331, 989-995.
Gornick, M.E., Eggers, P.W., Reilly, T.W., et al. (1996). Effects of race and income on mortality and use of services among Medicare beneficiaries. New England Journal of Medicine, 335, 791-799.
Harrison, M., and Thurston, N.K. (2001). Racial matching among African-American and Hispanic physicians and patients: Causes and consequences. Journal of Human Resources, 37(2), 410-428.
Hopp, F.P., and Duffy, S.A. (2000). Racial variations in end-of-life care. Journal of the American Geriatrics Society, 48(6), 658-663.
Jencks, S.F., Cuerdon, T., Burwen, D.R., Fleming, B., Houck, P.M., et al. (2000). Quality of medical care delivered to Medicare beneficiaries: A profile at state and national levels. Journal of the American Medical Association, 284(13), 1670-1676.
Johnson, P.A., Lee, T.H., Cook, E.F., Rouan, G.W., and Goldman, L. (1993). Effect of race on the presentation and management of patients with acute chest pain. Annals of International Medicine, 118, 593-601.
Kennedy, B.P., Kawachi, K.I., and Prothrow-Stith, D. (1996). Income distribution and mortality: Cross-sectional ecological study of the Robin Hood Index in the United States. British Medical Journal, 312, 1004-1007.
King, G. (1997). A solution to the ecological inference problem. Princeton, NJ: Princeton University Press.
Leape, L.L., Hilborne, L.H., Bell, R., Kamberg, C., and Brook, R.H. (1999). Underuse of cardiac procedures: Do women, ethnic minorities, and the uninsured fail to receive needed revascularization? Annals of International Medicine, 130(3), 183-192.
Lillie-Blanton, M., Martinez, R.M., and Salganicoff, A. (2001). Site of medical care: Do racial and ethnic differences persist? Yale Journal of Health Policy, Law, and Ethics, 1(1), 1-17.
Massey, D.G. (2001). Residential segregation and neighborhood conditions in US metropolitan areas. In N.J. Smelser, W.J. Wilson, and F. Mitchell (Eds.), America becoming: Racial trends and their consequences (Vol. I). Washington, DC: National Academy Press.
McClellan, M., and Staiger, D. (1999, revised 2000). The quality of health care providers. (NBER Working Paper #7327). Cambridge, MA: National Bureau of Economic Research.
McNeil, B.J. (2001, November). Shattuck Lecture: Hidden barriers to improvement in the quality of care. New England Journal of Medicine, 345(22).
McPherson K, Strong, P.M., Epstein, A, and Jones, L. (1981). Regional variations in the use of common surgical procedures: Within and between England and Wales, Canada and the United States of America. Social Science and Medicine, 15A, 273-288.
Morrison, R.S., Wallerstein, S., Natale, D.K., Senzel, R.S., and Huang, L. (2000). We don’t carry that—failure of pharmacies in predominately non-white neighborhoods to stock opioid analgesics. New England Journal of Medicine, 342(14), 1023-1026.
National Research Council. (1997). Racial and ethnic differences in the health of older Americans. L.G. Martin and B.J. Soldo (Eds.), Committee on Population, Commission on Behavioral and Social Sciences and Education. Washington, DC: National Academy Press.
Oaxaca, R. (1973). Male-female wage differentials in urban labor markets. International Economic Review, 14(3), 693-709.
Oaxaca, R. (1975). Estimation of union/nonunion wage differentials within occupational/ regional subgroups. Journal of Human Resources, 10(4), 529-537.
Oliver, M.L., and Shapiro, T.M. (1995). Black wealth/white wealth: A new perspective on racial inequality. New York: Routledge.
Peterson, E.D., Wright, S.M., Daley, J., and Thibault, G.E. (1994). Racial variation in cardiac procedure use and survival following AMI in the Department of Veterans Affairs. Journal of the American Medical Association, 271, 1175-1180.
Peterson, E.D., Shaw, L.K., DeLong, E.R., Pryor, D.B., Califf, R.M., and Mark, D.B. (1997). Racial variation in the use of coronary-revascularization procedures: Are the differences real? Do they matter? New England Journal of Medicine, 336, 480-486.
Phelps, C.E., and Mooney, C. (1993). Variations in medical practice use: Causes and consequences. In R.J. Arnauld, R.F. Rich, and W. White (Eds.), Competitive approaches to health care reform. Washington, DC: The Urban Institute Press.
Rathore, S.S., Berger, A.K., Weinfurth, K.P., et al. (2000). Race, sex, poverty, and the medical treatment of acute myocardial infarction in the elderly. Circulation, 102(6), 642-648.
Ross, C.E., and Mirowsky, J. (2000). Does medical insurance contribute to socioeconomic differentials in health? The Millbank Quarterly, 72(2), 291-321.
Schneider, E.C., Leape, L.L., Weissman, J.S., Piana, R.N., Gatsonis, C., and Epstein, A.M. (2001). Racial differences in cardiac revascularization rates: Does “overuse” explain higher rates among white patients? Annals of Internal Medicine, 135(5), 328-337.
Schulman, K.A., et al. (1999). The effect of race and sex on physicians’ recommendations for cardiac catheterization. New England Journal of Medicine, 340(8), 618-626.
Schwartz, L.M., et al. (1999). Misunderstandings about the effects of race and sex on physicians’ referrals for cardiac catheterization. New England Journal of Medicine, 341(4), 279-283.
Skinner, J., Fisher, E., and Wennberg, J.E. (2001). The efficiency of Medicare. (NBER Working Paper 8395). Cambridge, MA: National Bureau of Economic Research.
Skinner, J., Staiger, D., Chandra, A., Lee, J., and McClellan, M. (2002). Racial differences in hospital quality for the treatment of acute myocardial infarction: Evidence from the Medicare population (Unpublished). Dartmouth Medical School.
Smedley, B.D., Stith, A.Y., and Nelson, A.R. (2002). Unequal treatment: Confronting racial and ethnic disparities in health care. Washington, DC: National Academies Press.
Smith, J.P., and Kington, R.S. (1997). Race, socioeconomic status, and health in late life. In L.G. Martin and B.J. Soldo (Eds.), Racial and ethnic differences in the health of older Americans. Committee on Population, Commission on Behavioral and Social Sciences and Education, National Research Council. Washington, DC: National Academy Press.
Susser, M. (1994a). The logic in ecological. The logic of analysis. American Journal of Public Health, 84(5), 825-829.
Susser, M. (1994b). The logic in ecological. The logic of design. American Journal of Public Health, 84(5), 830-835.
Tu, J.V., Naylor, C.D., Kumar, D., DeBuono, B.A., McNeil, B.J., and Hannan, E.L. (1997). Coronary artery bypass graft surgery in Ontario and New York State: Which rate is right? Annals of Internal Medicine, 126(1), 13-19.
Wennberg, J. (1986). Which rate is right? New England Journal of Medicine, 314(5), 310-311.
Wennberg, J.E., and Cooper, M. (Eds.). (1996). Dartmouth atlas of health care. Chicago: Dartmouth Medical School and American Hospital Association.
Wennberg, J.E., and Cooper, M. (Eds.). (1999). Dartmouth atlas of health care 1999. Chicago: Dartmouth Medical School and American Hospital Association.
Wennberg, J.E., Fisher, E., and Skinner, J. (2002). Geography and the debate over Medicare reform. Health Affairs, February, 1-19.
Whittle, J., Conigliaro, J., Good, C.B., and Lofgren, R.P. (1993). Racial differences in the use of invasive cardiovascular procedures in the Department of Veterans Affairs medical system. New England Journal of Medicine, 329, 621-627.