
3
The National Weather Service and Flash Floods
The National Oceanic and Atmospheric Administration’s (NOAA’s) National Weather Service (NWS) is the federal organization charged with protecting the nation from extreme weather events, including flash floods. Specifically, the mission of the NWS is to provide “… weather, water, and climate forecasts and warnings for the United States, its territories, adjacent waters and ocean areas, for the protection of life and property and the enhancement of the national economy” (NWS, 2003a). There are 122 NWS Weather Forecast Offices (WFOs)—116 in the continental United States, 3 in Alaska, 1 in Hawaii, 1 in Puerto Rico, and 1 in Guam (Figure 3.1)—divided into six regions. Each WFO serves a designated group of counties, ranging from a few to more than 20, termed the county warning area (CWA). For example, the Salt Lake City WFO serves 25 counties, whereas the Los Angeles-Oxnard WFO is responsible for only 4 counties; the Los Angeles-Oxnard WFO, however, serves a much greater population than Salt Lake City’s WFO. The WFOs are responsible for providing flash flood forecasts, watches, and warnings for their specified CWAs. In addition to the WFOs, there are 13 River Forecast Centers (RFCs) and 9 national specialized centers that provide support to NWS functions. In particular, the Hydrometeorological Prediction Center (HPC) is especially relevant for supporting the NWS prior to and during heavy precipitation events. This chapter gives additional information about the NWS and its role pertaining to flash floods, including a brief description of the modernization effort that led to the development of the NEXRAD network and of the extensive process that local NWS meteorologists go through to forecast and warn of flash flood events.
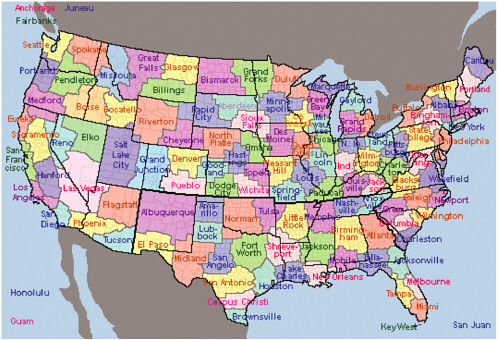
FIGURE 3.1 Distribution of the 122 National Weather Service WFOs in the continental United States, Alaska, Hawaii, Guam, and Puerto Rico. The CWAs that each WFO serves are shaded. The Southern California coastal area shaded in pink is the CWA served by the Los Angeles-Oxnard WFO. SOURCE: National Weather Service.
THE MODERNIZATION AND ASSOCIATED RESTRUCTURING OF THE NATIONAL WEATHER SERVICE
Vast improvements in instrumentation, computer, communications, and data processing technologies since the 1950s led to much improved weather observing technologies in the 1970s and 1980s. These advances, together with a better scientific understanding of atmospheric processes, allowed for major improvements in NWS capabilities to accurately observe, forecast, and warn of severe weather. To capitalize on the scientific and technological advances for improving its services, the NWS underwent a major modern-
ization and associated restructuring (MAR) during the 1990s. This modernization was the most important development in operational meteorology in the past 50 years (for details of the MAR, see Friday, 1994). A major outcome of the MAR was that it improved local data and guidance analyses available to WFOs. Because local forecasters know best the local topography and weather conditions that produce hazardous weather in their regions, the improved data and guidance allowed for increased accuracy and timeliness of their service to the public and reduced losses of lives and property. Each WFO has four major responsibilities, including:
-
issuing forecasts, watches, and warnings for severe local weather hazards, flash floods, floods, heat waves, winter storms, fire weather conditions, agricultural weather conditions, and all other local weather information;
-
issuing local aviation weather forecasts and warnings as well as forecasts for en route pilots in the United States;
-
issuing marine forecasts, watches, and warnings for all U.S. coastal areas and the Great Lakes; and
-
providing hydrologic services, including issuing watches and warnings for flash floods and slow-rising floods, identifying flash flood-prone areas, and monitoring local hydrological surveillance systems.
The modernization also led to a change in staffing nationwide by creating a core of professional meteorologists and hydrologists at the WFOs and RFCs to most effectively utilize the new data. Each WFO has a Science and Operations Officer, and the RFC has a corresponding Development and Operations Hydrologist. Their jobs are to oversee the expedient transfer of emerging scientific and technical discoveries from researchers to daily NWS and WFO operations, by collaborating with local universities and research laboratories. Each WFO also has a Warning and Coordination Meteorologist who maintains close contacts with local emergency managers to effectively disseminate watches and warnings to local government officials responsible for alerting the public and other users of all existing and potential weather-related hazards. A Service Hydrologist at each WFO manages the hydrological warning program and coordinates closely with the regional RFC and the HPC for hydrological guidance.
The MAR focused on many major new technologies to exploit the improved scientific and technological capabilities. In the computing arena, National Centers for Environmental Prediction (NCEP) supercomputers were slated to perform four-dimensional data assimilation techniques and to run numerical weather prediction (NWP) models that provide forecasts and
guidance for periods beyond 36 hours. A new, high-speed computer workstation, termed the Advanced Weather Interactive Processing Systems (AWIPS), was developed and now serves as the nerve center of operations at all WFOs and RFCs. AWIPS receives all observational data and guidance analyses from the national centers and provides an array of current and forecast information for use by local WFO forecasters to assess the need for forecasts and warnings. Once the forecaster makes a decision, AWIPS formulates and disseminates warnings and forecasts automatically through a communications system, making them available at all NWS sites and to emergency managers, private weather firms, and universities.
Expanding the spatial network of atmospheric observations was an important objective of the MAR, and because of the significant effects of weather on aviation and defense, these efforts were supported greatly by the Federal Aviation Administration (FAA) and the Department of Defense (DoD). To accomplish this, the Automated Surface Observing System and wind profilers were developed, instrumentation on geostationary and polarorbiting satellites was improved, and most relevant to this study, the Weather Surveillance Radar-1988 Doppler (WSR-88D) radar called the Next Generation Radar (NEXRAD) was deployed. NEXRAD is the pioneering technology used for detecting and tracking of severe mesoscale storms, such as tornadoes and severe thunderstorms, that often lead to flash floods. It can detect mesocyclones within clouds aloft, identifying a precursor to subsequent tornadic activity and thereby providing longer tornado warnings. NEXRAD can also track more widespread precipitation and give precipitation estimates, increasing the accuracy and timeliness of flash flood forecasts. Chapter 4 provides details of the NEXRAD network and its utility.
THE PROCESS OF ISSUING FLASH FLOOD FORECASTS, WATCHES, AND WARNINGS
The NWS serves as the sole official voice for issuing warnings during life-threatening weather situations. The flash flood forecasts, watches, and warnings are issued only by the WFOs, but the RFCs and the national centers—such as the NCEP, the HPC, the Storm Prediction Center, and the National Hurricane Center—provide essential supporting information and guidance to the WFOs. Each warning is issued for a specific time period and for a specific CWA, although a given warning statement may cover more than one CWA. The warning statements, however, often identify specific threatened subareas within a large CWA, such as those in the Los Angeles area. Additional flash flood statements may provide supplementary updates
about ongoing events, and it is common to have a series of extensions to an initial warning if a rainy period covers many hours.
The NWS process for issuing flash flood forecasts, watches, and warnings has changed markedly in the last 10 to 15 years, largely as a consequence of the NWS modernization. In the past, forecasters simply analyzed past weather and hydrological data to determine how much precipitation fell in a given area (e.g., to assess current soil moisture conditions) as well as what happened to that rainfall (e.g., to see if flash floods recently occurred). Then the forecaster would compare that information with predictions of future rainfall and attempt to subjectively assess flash flood potential. Although the general idea remains the same, the collection of more and newer remotely sensed and in situ data, combined with continually improving probabilistic and deterministic tools, has greatly improved NWS procedures and lead times for issuing flash flood forecasts, watches, and warnings during the past 15 years.
Successful forecasts of a heavy rainfall event depend on interpretation of the meteorological and hydrological aspects of a particular situation. Forecasters must first determine how much precipitation will fall, where, when, and of what intensity. Then this information is paired with knowledge of the antecedent moisture conditions of the soil and the stages of streams and rivers in the forecast area to gauge the likelihood of flooding.
Output data and forecast fields from NWP models are key tools that allow the forecasting process to begin several days before an event occurs. A variety of NWP models are run on an operational basis by the NWS, and their output is used as guidance by weather forecasters. The models have somewhat different numerical formulations of the various atmospheric processes and, hence, sometimes arrive at significantly different forecasts. One of these numerical models—the Global Forecast System model—is run more than once, and sometimes several times, per set of input data in what is called an ensemble approach. The ensemble approach allows small modifications to the input data or other small intentional changes to the initial conditions to test the sensitivity of the forecasts to small changes in initial conditions or model formulations. Statistical packages are used to post-process NWP model forecast data to eliminate potential numerical model biases, adjust for local factors, and output additional quantities not directly predicted by the numerical models. Other numerical models are run operationally at least daily by the U.S. Navy and U.S. Air Force, by foreign government weather services, by local NWS weather forecast offices, and by university research programs. All of this output can be examined by local NWS forecasters. Forecasters then assess the predicted values of numerous
weather variables and their model-to-model variations and determine the most probable upcoming weather. Forecasters will usually draw on their experience of how the numerical models handle different weather situations, along with their experience of how various weather situations tend to evolve, especially in their local forecast regions, given the initial weather pattern.
A multitude of types of data, collected around the world, provide input to the NWP models. Measurements are made of air pressure, temperature, humidity, wind direction and speed, cloud coverage, and cloud base heights from observations at surface weather stations, buoys, and ships. Some of these measurements are available several times per hour. Information about conditions more than a few meters above the ground is obtained from a variety of platforms. Twice per day, nearly 100 rawinsondes are launched on weather balloons with instrument packages that transmit temperature, humidity, pressure, and wind data at numerous altitudes back to the NWS office as they ascend. As part of the Aircraft Communication Addressing and Reporting Systems, some commercial aircraft are instrumented to transmit wind, temperature, and humidity data while they ascend and descend near airports and during their cross-country transits. Vertically pointing radar wind profilers at more than three dozen locations nationwide measure winds hourly up to 16-km altitude and down to 500 m above the ground (i.e., for 400-MHz band profilers) or, when combined with Doppler sodars, down to 30 m (i.e., for 900-MHz band profilers). When combined with radio acoustic sounding systems, wind profilers also provide vertical temperature profiles at hourly intervals. Doppler weather radar data also can be used to determine the average vertical profile of winds above the radar sites in many situations. Many types of data are available from geostationary and polar-orbiting satellites that serve as the best sources of data over the oceans in terms of spatial and temporal resolution. Often, satellite information is used to assess the accuracy of analyses used in the numerical model initialization process and to obtain a rough assessment of the character of the approaching weather system. Visible and infrared satellite imagery can be used to determine the locations and altitudes of clouds. Water vapor imagery is used to measure the middle- and upper-level water vapor content of the atmosphere. Microwave data are used to determine the water content of the cloud and precipitation systems, especially over oceans, and satellite sounder data, using radiation measurements at a host of wavelengths, are used to obtain temperature profiles.
All of these data then are assimilated into the numerical models, in a procedure that simultaneously invokes a measure of quality control. New
observed data values are examined against values from a previous numerical model forecast—a “first-guess” value for the observation time. If a new measurement is within reasonable agreement with the first-guess value, it is used to modify the first-guess value in the data assimilation process. Most numerical models make computations at dozens of levels in the vertical and at grid points spaced about 40 km apart in the horizontal (varying among NWP models). Forecasters use precipitation forecasts from the numerical models as guidance in making a forecast of the timing and amount of upcoming precipitation. Although the skill of the models in forecasting heavy rainfall in the warm season is extremely low (Fritsch and Carbone, 2004), the models often give reasonable portrayals of upcoming storms in the cool season. In any case, human forecasters typically adjust and improve on the numerical guidance by using their experience, including dealing with the influence of regional terrain on the upcoming weather system.
When it is determined that rainfall is imminent, forecasters must assess flash flood potential in order to decide whether and when to issue flood and flash flood watches and warnings. The regional RFC and the HPC are important sources for assessing the hydrologic situation, with their combined knowledge of the local topography and soil and stream conditions. They provide daily flash flood guidance to the WFOs on hydrologic conditions, including information such as localized assessments of the amount of rainfall that will lead to flooding in a given area. This guidance, combined with anticipated and current rainfall rates, helps WFOs to best gauge local flood potential.
Use of a decision matrix is another way to assess flash flood potential. For example, inputs for convective storms might include such parameters as precipitable water amounts in various categories, the 500-mb steering-level wind speed, the existence of a cap on a stable layer aloft (i.e., at approximately 500 mb), and the existence of a trigger mechanism such as a front, outflow boundary, or topography. Table 3.1 shows an example of a flash flood potential decision matrix. For nonconvective storms, other weather variables also are important, but precipitation amounts and intensities still are key parameters. The speed of the upper-level winds normal to mountain barriers is an important determinant of a lifting mechanism that often produces rain in stratiform clouds near mountains. Sometimes convective elements are embedded in stratiform clouds, so both the convective and the stratiform weather parameters must be examined.
Because rainfall patterns often move across an area rather than develop locally, measurements from Doppler radars such as NEXRAD generally are the most valuable information for monitoring approaching rainstorms. Sat-
TABLE 3.1 Decision Matrix to Assess Flash Flood Potential
|
500-mb Wid (knots) |
Cap |
Trigger |
PW > 1.00 |
0.80 < PW < 1.00 |
0.50 < PW < 0.80 |
PW < 0.50 |
|
<15 |
No |
Yes |
Very high |
High |
Moderate to high |
Low |
|
|
|
No |
High |
Moderate to high |
Moderate |
Low |
|
|
Yes |
Yes |
Moderate to high |
Low to moderate |
Low |
Low |
|
|
|
No |
Low to moderate |
Low |
Low |
Low |
|
15–25 |
No |
Yes |
High |
Moderate to high |
Moderate |
Low |
|
|
|
No |
Moderate to high |
Moderate |
Low to moderate |
Low |
|
|
Yes |
Yes |
Moderate to high |
Low to moderate |
Low |
Low |
|
|
|
No |
Low to moderate |
Low |
Low |
Low |
|
≥ 25 |
No |
Yes |
Moderate to high |
Moderate |
Low to moderate |
Low |
|
|
|
No |
Moderate |
Low to moderate |
Low |
Low |
|
|
Yes |
Yes |
Low to moderate |
Low |
Low |
Low |
|
|
|
No |
Low |
Low |
Low |
Low |
|
SOURCE: Brian McInerney, NWS Salt Lake City WFO. |
||||||
ellite data also can be used, but the temporal and spatial resolutions are not as high and precipitation estimates are less reliable. Networks of rain gauges at the surface are used to measure how much rain has fallen, but the gauges generally are spaced dozens of miles or more apart. Small-scale heavy rain cores and bands that often lead to flash flooding can occur between gauge locations and, thus, result in undersampling of the actual rainfall. Moreover, only a subset of gauges provides real-time reporting of the observations. For these reasons, forecasters rely heavily on radar estimates of current and approaching rainfall intensities and accumulated amounts—ground-truth-checked against available rain gauge data when and where possible—in the warning process, particularly to identify small-scale areas of maximum precipitation. However, radar measurements of rainfall rate and accumulation must be considered only estimates. The radar actually measures the power returned to its receiver, as reflected back by whatever targets were in the path of the beam, and uses this information to infer precipitation rate by assuming an idealized (i.e., typical) relationship to the distribution of number and sizes of raindrops within the beam.
In situ rainfall measurements are acquired by various types of rain gauges. Some are buckets (i.e., standard 8-inch rain gauges) that require a human to insert a ruler-like instrument to measure the depth of the accumulated rainfall. Others include tipping buckets and weighing gauges, which may include a moving chart that records the amount of precipitation that
has fallen as a function of time. The tipping bucket is so-called because a small bucket on an arm-like device tips and empties each time 0.01 inch of rain accumulates. The weighing and tipping-bucket types of rain gauges can be equipped to report automatically to the NWS each hour or more frequently, whereas many gauges staffed by human observers may report only once per day unless special provisions are made for additional reporting in heavy rain situations.
Although it may seem that rain gauges should provide exact rainfall amounts, in practice their values can be in error or unrepresentative. During high rainfall rates, the tipping bucket may not be able to keep up with the intensity of the rain and result in an underestimate. In high wind conditions, some rain may blow over the gauge, even if wind shields are positioned around it. Spatial variations in rainfall due to topographic or other factors may also make the gauge value unrepresentative of the basin-average rainfall that contributes to flood conditions. Thus, the blending of radar and rain gauge data tends to give the most complete picture of the basin-average rainfall.
During a rain event, operational meteorologists and hydrologists also monitor measurements of streamflow and stage that are available at strategic locations on streams and rivers. Streamflow indicates the volume of water flowing down the channel in a fixed amount of time, such as cubic meters per second. Stage indicates the water level in the stream or river and is compared against flood stage values, beyond which the water overflows the banks and flooding begins. In the case of slower-evolving stream and river floods, as opposed to flash floods, NWS forecasters have used floodplain mapping and experience to determine what areas will be affected for various stage values, and they are able to convey this information to the public in flood warning messages. Reports also are received from trained spotters and observers, emergency managers, law enforcement officials, and the public to indicate where flooding has begun or is imminent.
In summary, NWS forecasters go through an extensive, multiday process of assessing the flash flood potential of approaching weather systems. They monitor numerous data from a myriad of sources and assess models and real-time observations in order to determine whether a flash flood situation is developing. The forecast process is highly regionalized in that forecasters’ assessments are based on their local knowledge and experience, which often serve as the most valuable and effective forecasting tools.


