
5
Source Remediation Technology Options
Many aggressive source remediation technologies have become increasingly popular in the last five years, which partly underlies the Army’s request for this study. This chapter presents those technologies that have surfaced as leading candidates for source zone remediation, including a description of each technology, a discussion of the technology’s strengths and weaknesses, and special considerations for the technology. The following sections are not necessarily equivalent because information on each technology is complete to varying degrees. For example, numerous case studies are available for surfactant flooding, chemical oxidation, and steam flushing, while almost none exist for chemical reduction. The uneven treatment of the innovative technologies in this chapter is thus largely a reflection of the amount of data available.
Because source zone remediation is the focus of this discussion, technologies that target remediation of the dissolved plume are not discussed. Thus, for example, permeable reactive barriers, which primarily treat the plume, are not included. In addition, excavation, containment, and monitored natural attenuation are only briefly touched upon. While they may well be used in combination with a source zone remedial activity, these remedies are not considered to constitute in situ source zone remediation.
In addition to describing the state of the art for each individual technology, the chapter provides a qualitative comparison of the technologies, first by assessing the types of contaminants for which each technology is suitable, and then by qualitatively evaluating each technology’s relative potential for mass removal, concentration reduction, mass flux reduction, source migration, and changes in toxicity—physical objectives discussed extensively in Chapter 4. It should be
noted that effectiveness data that would be pertinent to these objectives and others discussed in Chapter 4 are infrequently gathered. Most pilot- and field-scale studies of source remediation measure effectiveness in terms of mass removal and occasionally concentration reduction (although these latter data can be very difficult to interpret). Mass flux and source migration measurements have rarely been documented. Indeed, virtually no data exist on the life cycle costs associated with the technologies. Furthermore, most reports of case studies are not published in the peer reviewed literature. These facts should be kept in mind throughout this chapter, especially when interpreting summary tables. The qualitative comparison is conducted for each of the hydrogeologic settings described in Chapter 2. Because these settings are generalizations, whether a certain technology will work for a given site depends on a complex integration of a wide range of site and contaminant properties.
The two contaminant types of concern in this report—dense nonaqueous phase liquids (DNAPLs) and chemical explosives—have varying characteristics and have been handled differently with respect to source remediation. This chapter covers DNAPLs in greater detail than explosives because most of the research to date has focused on DNAPL contamination. However, when a certain technology has been used or is applicable to chemical explosives, it is mentioned. The discussion of DNAPL treatment focuses on contamination of the saturated zone, as this medium presents the greatest difficulties in terms of site cleanup. Thus, technologies that target the unsaturated zone (e.g., soil vacuum extraction, bioventing, biosparging, etc.) are not discussed here.
Table 5-1 provides an overview of the technologies discussed in this chapter. Although excavation, containment, and pump-and-treat are considered conventional approaches for addressing DNAPL contamination, they are discussed here
TABLE 5-1 Source Remediation Technologies in This Chapter
|
Technology |
Approach |
Page # |
|
Excavation |
Extraction |
180 |
|
Containment |
Isolation |
182 |
|
Pump-and-Treat |
Extraction/Isolation |
185 |
|
Multiphase |
Extraction Extraction |
187 |
|
Surfactant/Cosolvent |
Extraction |
194 |
|
Chemical Oxidation |
Transformation |
206 |
|
Chemical Reduction |
Transformation |
218 |
|
Steam Flushing |
Extraction/Transformation |
224 |
|
Conductive Heating |
Extraction/Transformation |
236 |
|
Electrical Resistance Heating |
Extraction/Transformation |
242 |
|
Air Sparging |
Extraction |
250 |
|
Enhanced Bioremediation |
Transformation |
256 |
|
Explosives Technologies |
Extraction/Transformation |
288 |
to provide a baseline for the more innovative technologies that follow. Multiphase extraction is an approach for removing as much of the mobile DNAPL as possible. The remaining technologies target residual or trapped DNAPL, and their approach is categorized as either extraction, transformation, or both. An extraction technology seeks to improve the rate at which the DNAPL can be recovered from the subsurface, while transformation technologies seek to alter the form of the DNAPL in situ. Many technologies do both. The final section in this chapter discusses technologies for treating explosive contaminants.
CONVENTIONAL TECHNOLOGIES
The conventional technologies that play a significant role in managing source areas at hazardous waste sites include excavation, containment, and pump-and-treat. To a certain extent, excavation (if completely successful) and containment represent the extreme ends of what is possible with source remediation, in that one technology completely removes the source, while the other removes no mass whatsoever. Pump-and-treat and all of the innovative technologies discussed subsequently fall between these two extremes in their intent.
Source Area Excavation
Excavation is commonplace for source remediation at hazardous waste sites, and is thus mentioned briefly for completeness. Excavation is carried out by heavy construction equipment that can dig out the source materials and place them into shipping containers. The containers are then shipped to an appropriate site for treatment or disposal, which may include designated onsite locations. Backfilling the excavation is required and necessitates having available clean backfill material and carefully and safely placing the backfill so that cross-contamination is avoided. All of these activities require extensive physical access to the source area.
For excavation to succeed it is essential to know the areal extent, depth, and general distribution of source materials, which suggests an intensive source characterization effort prior to the commencement of excavation. Indeed, if pre-excavation investigations are flawed, then some portion of the source zone may be unintentionally left in place. These same characterization tools are also used later to verify that all of the source material has been removed and to classify materials encountered during the excavation as contaminated or uncontaminated. In addition to information on the size and shape of the source zone, basic geotechnical information is also important to predicting the success of excavation. For example, one should determine whether bedrock is present, as it is hard to excavate. Excavation below the water table is difficult due to the influx of groundwater, which is contaminated by contact with the source material and must be treated. Saturated sandy soils tend to liquefy during excavation (the jargon for
this phenomenon is running sands) and can dramatically raise the complexity of excavation—in some cases sheet piling or dewatering systems must be employed around the source materials to reduce the water flow and to stabilize the side walls and bottoms of excavations. Finally, the ability to completely excavate a source is highly dependent on having adequate physical access to the source zone. If physical access is restricted by nearby foundations or buildings, complete removal may not be possible without serious damage to surrounding structures. In any case where an excavation is planned near a foundation or a building, it is particularly important to have a high quality-investigation before excavation begins. It is also difficult to excavate on steep slopes with a thin layer of contaminated soil because the construction equipment tends to slip in dangerous ways.
Certain hydrogeologic settings are more amenable to excavation as a remedial action. Shallow source zones in hydrogeologic settings I, II, and III can readily be excavated with standard equipment. Some Type IV sedimentary bedrock—for example, soft sandstone or shale—can be excavated. However, excavation of source zones in bedrock that falls into hydrogeologic settings IV and V is generally difficult, especially if the source zone is in igneous or metamorphic rock. Overall, experience has shown that excavation works best and is most cost-competitive at sites where confining layers are shallow, soil permeabilities are low, the volume of source materials is under 5,000 m3, and the contaminants do not require complex treatment or disposal. Many other references, including NRC (2003), discuss innovative and adaptive ways of excavating sites to ensure more complete capture of the entire source zone.
As suggested in Chapter 2, excavation is the principal remediation measure for near-surface explosives source areas. When there is risk of detonation, tele-robotic remote excavation equipment can be used to increase the standoff distance between the field teams and the source areas. For very high explosives concentrations, removed soil must be blended with clean soil as a pretreatment, followed by incineration or composting, the latter of which has become the principal technology for treating soils highly contaminated with explosives.
The primary advantage of excavation is that source materials are taken out of the groundwater system very quickly. Migration of contaminants out of the source area is cut off as soon as excavation is finished. Excavation may be inexpensive compared to in situ treatments, and is often preferred by potentially responsible parties (PRPs) and stakeholders because of its perceived simplicity. There are also many disadvantages to excavation, especially the need for an area that can receive the excavated material, the dangers of working with heavy excavation equipment, worker exposure to potential volatile organic compound (VOC) releases, and the inability to predict source area volumes. Indeed, experience with excavation is that projects often remove up to twice the volume of source material predicted before the excavation began because of faulty initial source characterization. Deep excavations may require benching, which greatly increases the volume of soil excavated. Furthermore, when water tables are lowered for exca-
vation, it is likely that DNAPL will be remobilized and will flow into the excavation, creating a worker exposure hazard. Finally, cost can be a disadvantage if the excavated volume is large or if the source materials removed are subject to land disposal restrictions that lead to high ex situ treatment costs (e.g., incineration of Resource Conservation and Recovery Act/Toxic Substances Control Act wastes).
A properly planned and executed excavation carried out in an appropriate hydrogeologic setting should completely remove all mass in a source zone. In these cases, mass flux reduction, concentration reduction, and reduction of source migration potential will also be complete. Excavation produces no change in contaminant toxicity because the contaminants are transported offsite for treatment or disposal, so that is shown as “not applicable” in the comparison table presented at the end of the chapter.
Containment
Containment, both physical and hydraulic, is a common remedy applied to contaminant source areas. This section discusses physical containment of a source zone, while the following section on pump-and-treat technology encompasses hydraulic containment. The goal of a containment remedy is to reduce risks by greatly minimizing contaminant migration via containment of the source so that there can be no direct route of exposure to the source. Physical containment is accomplished by creating impermeable barriers on all sides of the source zone with standard heavy construction methods and equipment. Thus, a typical containment remedy consists of a very low-permeability vertical barrier surrounding the source on all sides, a clay aquitard below the source, and a low-permeability cap on top. Vertical barriers can be constructed using bentonite slurries, slurries combined with polymer sheets, sheet pilings with sealed joints, pressurized injection methods, or cryogenic systems that freeze the soil. Constructed-bottom barriers can be emplaced by several drilling methods, but such barriers are uncommon.
Top barriers are used to minimize infiltration of rain water and subsequent dissolution of contaminants. Most top barriers are multilayer systems that include polymer sheeting and drainage layers. Typical operating practice for a containment system is to keep groundwater levels inside the container low relative to the adjacent aquifer by operating a small pump-and-treat system that withdraws groundwater from inside the system. This creates an inward groundwater gradient that helps ensure that contaminants will not migrate outward. Top barriers are very helpful in maintaining an inward gradient and in lowering pumping and treating costs. More recently vegetative/evaporative caps are becoming popular for controlling infiltration.
Applicability of the Technology
Contaminants. Containment systems are broadly applicable to organic contaminants. They can be used to contain any contaminants that are not expected to react with or leach through the components of the containment system. Source materials with extreme pH values are the most likely to create problems.
Hydrogeology. Two types of characterization related to hydrogeology are essential to containment: the areal extent and the depth of source areas to be contained, which must be known so that all source materials are indeed inside the containment system. There is no need to understand the internal structure of the source materials or the mass or concentration of contaminants present. Knowing the depth and thickness of the underlying aquitard is critical to making the vertical barriers deep enough to key into the aquitard. The aquitard topography must also be known so that any depth variations can be taken into account during barrier construction. Subsurface obstructions should be carefully mapped in advance so that barrier construction is not interrupted and so that they do not cause worker safety concerns.
Groundwater modeling is necessary during the designing of a containment system because the flow of groundwater will be changed by the new barrier. Adjacent sites could be affected as water diverts around the barrier, and some groundwater mounding will happen upgradient of the barrier. If modeling predicts that mounding will be substantial, then groundwater overflowing the top of the barrier and flooding of low areas or basements up gradient would be significant concerns, and a diversion/drainage method might have to be implemented.
Containment systems typically work well in unconsolidated soil (hydrogeologic settings I, II, and III) due to the relative ease of construction. Environmental conditions that can limit the applicability of containment include the presence of boulders or cobbles in soil, which can make installing vertical barriers difficult and costly. Containment is difficult in Type IV and V bedrock environments, and often relies on grout curtains. Grout curtains are difficult to install and do not yet provide the same level of assurance as vertical barriers constructed by trenching in unconsolidated soils. Verification of construction quality is also more difficult in Type IV and V settings. At sites where no natural bottom exists, there is little experience in constructing bottom barriers. Finally, it should be noted that a containment system creates a permanent subsurface wall that eliminates that part of the aquifer as a potential water source.
Barriers and other structural enhancements used for containment can be constructed to depths of approximately 30 meters, using such equipment as augers, draglines, clamshells, and special excavators with extended booms. As with all technologies discussed in this chapter, the cost of containment rises as the depth of treated subsurface increases.
Health, Safety, and Environmental Considerations. The main safety concerns of containment are those associated with operation of the heavy equipment necessary for construction. Once a containment system is in place, it is paramount that it remain effective in order to avoid potential health or other problems in the surrounding areas. This requires continuous and rigorous inspections during the construction of the remedy and subsequent long-term monitoring. Even though there is a loss of the use of the area for any intrusive activities, alternative land uses such as parks and golf courses built on top of containment systems are becoming more common, and newer construction technologies such as jetting are reducing land-use restrictions around contained systems. If the source materials have the potential to generate gasses, a system to control gas migration should be built to avoid future exposures.
Potential for Meeting Goals
Compared to most of the technologies discussed in this chapter, containment is simple and robust. When constructed well, a containment system almost completely eliminates contaminant transport to other environmental compartments and thus prevents both direct and indirect exposures. In Type I, II, and III environments, containment systems provide a very high degree of mass flux reduction and a very high reduction of source migration potential. Nonetheless, monitoring of containment systems is essential for assuring no migration of the contaminants. Containment systems do not reduce source zone mass, concentration, or toxicity unless they are deliberately used with treatment technologies. (In most cases only limited treatment will be provided by the pump-and-treat systems installed to control groundwater infiltration.) It is possible to combine containment systems with in situ treatment, since most in situ technologies that can clean up a free-range source can operate inside a contained zone—for example, the Delaware Sand & Gravel cometabolic bioventing system. In some cases, containment may allow for the use of treatments that would constitute too great a risk (e.g., with respect to migration of either contaminants or reagents) in an uncontrolled aquifer, though there would need to be substantial drivers to cause installation of two remedies in the same source zone.
Cost Drivers
The cost drivers for containment all relate to the types and quantities of construction necessary. They are the depth to aquitard, the total length of vertical barrier necessary, the type of barrier wall construction selected, the type of cap selected, and the need (if any) to construct a bottom. Monitoring systems are necessary, but they are not complex or costly. Containment systems are typically inexpensive compared to treatment, especially for large source areas.
Technology-Specific Prediction Tools and Models
Containment systems are very predictable because they are basically standard construction projects. Their long-term performance is currently predicted by models. The same techniques have been used in the construction industry for water control for some time, and have a good track record. Bench studies are typically used to define the best components of slurry mixtures.
Research and Demonstration Needs
Given its status as a conventional technology, the research needs of containment are minimal. However, better monitoring techniques would be helpful, and better ways to confirm the integrity of vertical barriers and the bottom containment would raise confidence. More information on the longevity of barrier materials in contact with contaminants would be helpful in the design of better barrier materials.
Hydraulic Containment
Hydraulic containment is one of the most widely used methods to limit the movement of contaminants from DNAPL source zones. Through the use of extraction wells, contaminated groundwater emanating from source zones can be captured and treated ex situ, a technique commonly referred to as pump-and-treat (NRC, 1994, 1999). To reduce ex situ treatment costs, injection wells can be used in conjunction with extraction wells to hydraulically isolate contaminant source zones. It is generally accepted that in most cases, hydraulic containment will not be very effective for source remediation due to the limited solubilities of most contaminants of concern and due to limitations in mass transfer to the aqueous phase (NRC, 1994, 1999; EPA, 1996; Illangesekare and Reible, 2001). Therefore, the current discussion is focused only on hydraulic containment of source zones, rather than their remediation. (Some small measure of source depletion may result from the water flow through the source zone that may accompany hydraulic containment.)
Case Studies
Because pump-and-treat is the most widely used technology applied at contaminated sites, detailed case studies are numerous and are best summarized elsewhere (e.g., NRC, 1994, and EPA, 1998a). At most sites where pump-and-treat has been used, decreases in contaminant concentrations in extracted water were observed during pumping, but cleanup targets were not met. However, at almost all sites hydraulic containment was achieved, demonstrating that the technology can be effective in simply halting the spread of contaminants from source zones to groundwater.
Applicability of the Technology
Contaminants. Hydraulic containment is not limited to a particular contaminant type. However, any concomitant mass removal from the source zone that might occur during pump-and-treat operations will be greater for contaminants with higher solubilities.
Hydrogeology. The effective design of hydraulic containment systems requires a thorough understanding of site hydrogeology in order to choose the optimal locations of and pumping rates for wells. Incomplete hydrogeologic characterization can lead to systems that do not achieve complete containment or that pump excessive amounts of groundwater, leading to increased pump-and-treat costs. Thus, the more complex the hydrogeologic setting, the more challenging will be the design of an optimal hydraulic containment system. There are no depth limitations associated with hydraulic containment other than those associated with well drilling, although costs are expected to increase as well depth increases.
In systems with high hydraulic conductivities (such as gravel or coarse sand), hydraulic containment may be difficult to achieve because high pumping rates may be required from closely spaced wells. In low-permeability formations (such as clays, silts) it may also be difficult to obtain effective hydraulic containment due to the high gradients required to achieve significant capture zone size. In highly heterogeneous systems, effective hydraulic containment is limited by the lack of hydraulic connectivity resulting from the presence of lower-permeability zones. This may be particularly problematic for fractured systems and karst, for which the connectivity can be difficult to determine.
Health, Safety, and Environmental Considerations. The primary health, safety, and environmental considerations for hydraulic containment relate to the treatment and disposal of contaminants removed from the subsurface. Precautions must be taken to ensure that exposure to extracted contaminated groundwater does not occur, particularly due to off-gassing of contaminant vapors. Typical ex situ treatment technologies involve activated carbon, catalytic oxidation, and biological treatment. When contaminants are transferred to another medium, as with activated carbon treatment, the additional steps that are involved in the ultimate disposal of the contaminants may present health and safety risks.
Potential for Meeting Goals
Given its widespread use, the effectiveness of hydraulic containment for meeting various objectives for different types of sites is widely known. Regardless of hydrogeologic setting, hydraulic containment will not achieve significant mass removal due to the low aqueous phase solubilities of most contaminants of concern relative to the amounts of mass typically present in the organic phase
(Illangasekare and Reible, 2001) and sorbed to the soil. These solubilities are primarily controlled by the slow mass transfer from the organic and soil phases to the aqueous phase. For some highly soluble contaminants such as DCA (solubility of 8,600 mg/L), hydraulic containment that maximizes water flow through the source zone may produce significant mass removal in homogeneous permeable settings. In heterogeneous media settings, removal of contaminants from the permeable zones may also contribute to a reduction in contaminant flux, while local average concentrations may not be significantly reduced due to the channeling of water through the high-permeability regions.
Due to the low mass removal expected with hydraulic containment, reduction of source migration potential is not significant, although maintenance of upward gradients has been proposed as a means of preventing downward migration of DNAPL in fractured rock (Chown et al., 1997).
Cost Drivers
The costs of hydraulic containment are associated with the operation and maintenance of a pumping system and with treatment of extracted water.
Technology-Specific Prediction Tools and Models
In the majority of cases, the design of the hydraulic containment system and the associated modeling are focused on simulating water flow, not on contaminant transport and removal. There are a large number of tools and models that can be used to design hydraulic containment systems. These range from simple analytical solutions for homogeneous steady-state systems (EPA, 1996) to complex numerical models that can incorporate heterogeneities and transient boundary conditions.
EXTRACTION TECHNOLOGIES
Two technologies commonly used for source remediation work primarily by physically extracting the contaminants from the subsurface. Multiphase extraction employs a vacuum or pump to extract NAPL, vapor, and aqueous phase contaminants, which may then be disposed of or treated. Surfactant and cosolvent flushing are somewhat akin to pump and treat (discussed earlier) in that a liquid is introduced into the subsurface into which the contaminant partitions, and then the mixture is extracted out of the subsurface and subsequently treated.
Multiphase Extraction
Multiphase extraction involves the extraction of water, gas, and possibly NAPL from the subsurface through the application of a vacuum to wells. In one
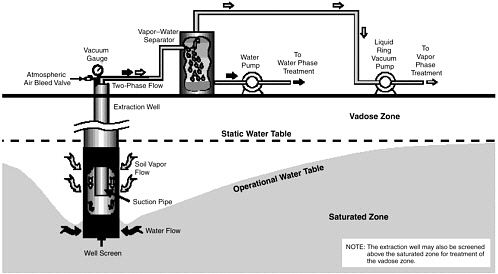
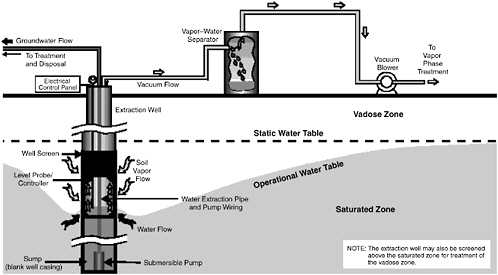
variant referred to as two-phase extraction (EPA, 1997), a high vacuum of 18–26 inches (46–66 cm) of Hg is applied to the extraction well through a suction pipe (slurp tube) to extract a mixture of soil vapor, groundwater, and possibly NAPL (see Figure 5-1). Turbulent multiphase fluid flow in the suction pipe may enhance transfer of VOC vapors to the gas phase. The second variant, referred to as dual-phase extraction, uses a submersible, or pneumatic, pump to extract the liquids from the well, while a vacuum (3–26 inches or 8–66 cm of Hg) extraction blower is used to remove soil vapor (see Figure 5-2). Because application of a vacuum in multiphase extraction induces atmospheric air infiltration that can stimulate aerobic biodegradation, it is sometimes also referred to as bioslurping.
Multiphase extraction wells are usually installed with at least a portion of their screened sections in the vadose zone. Thus, the vacuum applied creates vapor flow through the vadose zone to the multiphase extraction wells, thereby removing volatile organic vapors in the soil gas. The extraction of water lowers the water table, and therefore exposes a greater portion of the subsurface to vapor stripping. The extraction of groundwater also removes dissolved contaminants from the subsurface. The application of a high vacuum to the extraction well enhances groundwater flow to the well by increasing pressure gradients around the well, without substantial drawdown of the water table. If LNAPL is present at the site, this can reduce the smearing of LNAPLs in the soil around the well that can occur when there is significant water table lowering. NAPL present in the zone of influence of the multiphase extraction well may also be captured, particularly in the case of LNAPL pools sitting on the water table.
Design of a multiphase extraction system requires determining the zones of influence of wells for given vacuum levels, determining gas and liquid extraction rates, and determining optimal well spacing. Preliminary design can be done with hydraulic models for gas and water flow, but pilot tests are advisable. The required aboveground equipment includes pumps, gas–liquid separators, and gas and liquid treatment trains. A variety of proprietary designs for multiphase extraction have been developed (EPA, 1999), which typically involve variations in the details of fluid extraction from the wells.
Overview of Case Studies
Multiphase extraction has been applied to a variety of sites contaminated with either halogenated or nonhalogenated VOCs. The only documented examples of using this technology specifically for NAPL recovery have been sites where the contaminant was an LNAPL (and these cases are not described further). There are a limited number of chlorinated solvent case studies available (as described below), and there appears to have been little monitoring for contaminant concentration rebound after treatment.
A one-year multiphase extraction treatability study was conducted at the Defense Supply Center in Richmond, Virginia, during 1997–1998. The contaminants were
primarily PCE (3.3 mg/L in groundwater) and TCE (0.9 mg/L in groundwater), extending from the ground surface to a depth of 25 feet (7.6 m) below the ground surface (bgs). Soil layers included silty clay, fine-grained sand, coarse-grained sand, and interlayered gravel. The water table was 10–15 feet (3–4.6 m) bgs. Twelve dual-phase extraction wells and six air injection wells were installed at the site on a rectangular grid to depths of 22–28 ft (6.7–8.5 m) bgs. Water was removed from wells using submersible recovery pumps. Vacuum applied was approximately 11 kPa. The zone of influence of the well as indicated by water table drawdown was 600–800 ft (183–244 m) downgradient and 1,800–2,500 ft (549–762 m) upgradient, with an average water extraction rate of 37 gpm. A total of 117 pounds (53 kg) of VOC were removed in the vapor phase, and 28 pounds (13 kg) were removed in extracted water. At the end of the study, parts of the treatment area were below the remedial goals of 5 mg/L for PCE and TCE, while other areas on the outer edge of the treatment zone remained above this level. The treatment was deemed to be successful, and continued operation to meet the remedial goals was recommended.
Multiphase extraction was implemented at a manufacturing facility in Santa Clara, California, in 1996 to remediate TCE (46 mg/kg in soil, 37 mg/L in groundwater) in silts and clays to depths of 20 ft (6 m) bgs. Pneumatic fracturing was conducted to increase air flow rates. Twenty dual-phase single-pump extraction wells were installed at the site. Groundwater extraction rates were 35 gpm, which was much higher than expected due to the presence of high-permeability lenses in the treatment area. Total VOC removal was 382 lb (173 kg) in extracted groundwater and 785 lb (356 kg) in extracted vapor. Extraction rates declined significantly after about two months of operation, which continued for two years. After a six-month shutdown, little rebound in concentrations in extracted water and vapor was observed, indicating effective removal of contaminants from the treatment zone. VOC concentrations in one well declined from 4 mg/L to 0.7 mg/L by the end of treatment.
Multiphase extraction at Tinkham’s Garage Superfund Site, in Londonderry, New Hampshire, was implemented to treat 9,000 cubic yards (6,881 m3) of soil contaminated with PCE, TCE, and benzene, toluene, ethylbenzene, and xylene (BTEX) (maximum total VOC contamination of 652 ppm in soil, 42 ppm in groundwater). The site geology consisted of inorganic and organic silty clay and sand overlying weathered metamorphic bedrock at 14 ft (4.3 m) bgs. The extraction system consisted of 25 shallow wells screened in the overburden, and eight wells screened in the upper bedrock and overburden. A dual-pump configuration was used. Vapor extraction flow rates averaged 500 standard ft3/min (scfm) (14 m3/min) at a vacuum of 68 inches (173 cm) water column (WC), while water extraction rates averaged 2.5 gpm. At the end of the ten-month treatment period, all soil borings had been remediated below the targets of 1 ppm total VOCs. Total VOC concentrations in groundwater averaged 82 ppb at the end of the treatment period. A total of 48 lb (22 kg) VOC were removed in the vapor phase, and 5 lb
(2.3 kg) were removed in the aqueous phase. The treatment was judged to have been successful in meeting the remedial goal of lowering soil total VOC concentrations to below 1 ppm, and a long-term migration control remedy involving pump-and-treat is now in operation.
The three case studies cited indicate that multiphase extraction can achieve some removal of VOCs from shallow source zones. In particular, multiphase extraction was judged to be more effective than individual application of either soil vapor extraction or pump-and-treat. In all cases, contamination remained at the end of the treatment period, and continued treatment or control remedies were recommended.
Applicability of the Technology
Contaminants. Multiphase extraction is most effective for volatile organic compounds (i.e., organic compounds with a vapor pressure > 1 mm Hg at 20°C), as contaminant vapor stripping is one of the primary removal mechanisms. Highly viscous NAPLs, such as creosotes and coal tars, are not effectively recovered during multiphase extraction. In the case of semivolatile organic compounds (SVOCs), multiphase extraction may enhance aerobic biodegradation through increased supply of oxygen to the contaminated zone, but other methods for enhancing bioremediation may be more effective.
Hydrogeology. Multiphase extraction is most appropriate for soils of moderate permeability (10-5 to 10-3 cm/sec) (EPA, 1996). If the permeability is too low, there are difficulties in dewatering the soils due to high air entry pressures (Baker et al., 1999), and the flow rates and zones of influence will be too low. If the permeability is too high, then water withdrawal and corresponding water treatment costs will be high. This was shown during pilot tests at three Comprehensive Environmental Response, Compensation, and Liability Act (CERCLA) sites that involved single-pump extraction wells with slurp (suction) tubes for the removal of both gas and water (Baker et al., 1999). At high-permeability sites, the single-pump wells with suction tubes flooded with water, reducing their effectiveness.
The effectiveness of the technology is also reduced in highly heterogeneous soils due to channeling. The two-phase extraction configuration of multiphase extraction, whereby both gases and liquids are removed by the vacuum pump, is limited to depths of approximately 50 ft (15 m) (EPA, 1997). In theory, the multiphase extraction configurations that employ separate pumps for liquid recovery can operate at any depth. However, if the contaminated zone is too deep, the influence of the vacuum on recovery may be limited, and the system will essentially be a pump-and-treat system. Thus, the technology is only applicable to source zones near the water table.
Placement of wells for optimal recovery of DNAPL is a major challenge to the effective implementation of multiphase extraction. The wells must be located
close to, or in the zone of, mobile DNAPL, and site stratigraphy must be characterized to determine appropriate pumping rates and capture zones.
Health, Safety, and Environmental Considerations. The major concern with the use of multiphase extraction is the proper treatment of extracted gases and liquids. Vapors extracted may be treated by activated carbon, catalytic oxidation, or other technologies for gas phase treatment. The water phase may be treated by air stripping, activated carbon, or biological treatment. Vapor–liquid separation facilities are required to separate the gas and liquid streams, and if NAPL recovery is also expected, then NAPL–water separation will also be required.
Potential for Meeting Goals
Although the goals of multiphase extraction were met in the three examples reviewed above, these goals were usually partial mass removal to reduce source migration potential and provide some reduction in aqueous and vapor concentrations. In all cases, it was acknowledged that subsequent treatment by, for example, pump-and-treat and natural attenuation would be required. In one case, pneumatic fracturing was used to increase air flow rates and VOC removal, while difficulties in predicting groundwater extraction rates were encountered in another case. With respect to reductions in the potential for DNAPL movement, such reductions can be very difficult to ascertain, especially where the source is not well characterized. Usually one can only infer that as DNAPL flow rates to the well decrease with time, and as DNAPL thicknesses in monitoring wells decrease, that DNAPL mobility in the capture zone is being reduced.
The effectiveness of this technology depends on the well spacing, flow rates, channeling due to soil heterogeneities, and mass transfer limitations. As with most flushing technologies, the risk of failure increases with increasing site heterogeneity. Water table lowering has the potential to spread NAPL contamination downward, although this is more of a concern with LNAPLs than with DNAPLs (which would have likely existed below the water table prior to the application of multiphase extraction). Iron precipitation due to increased subsurface aeration has also been reported as a problem (Rice and Weston, 2000). Finally, difficulties in balancing applied vacuum and liquid extraction rates may occur. Emulsification of liquid–gas mixtures can create problems for aboveground treatment.
Although there is little reported experience with multiphase extraction in fractured media, this technology would not be expected to be very effective in achieving any of the objectives listed in the comparison table at the end of the chapter (Table 5-7), due to severe flow channeling along high-permeability fractures.
Cost Drivers
The capital costs for multiphase extraction are associated with well installation, pump equipment, gas–liquid separators, and water and gas treatment systems. Costs are also associated with energy for pump operation and for operation of the treatment systems.
Technology-Specific Prediction Tools and Models
The multiphase extraction process involves multiphase flow and transport of water, gas, and possibly organic phases, with interphase mass transfer. Biodegradation may also occur. The flow rates generated may be quite high, and nonequilibrium interphase mass transfer effects may be significant. Numerical models exist for simulation of multiphase flow and transport with either equilibrium (Sleep et al., 2000) or kinetic mass transfer and biodegradation (McClure and Sleep, 1996). However, these processes are highly nonlinear and are difficult to model, particularly under conditions of high flow rates. Multiphase models also require many soil parameters that can be very difficult and costly to measure for the different soils present at a site, such as parameters for capillary pressure–saturation constitutive relationships. It is not surprising that these multiphase models are primarily in the research domain, rather than in a format amenable to usage by nonspecialists. Simplified models for gas or water flow may be used to predict zones of influence of extraction wells, although these models may be of limited accuracy, as they ignore the multiphase nature of the flow system.
Research and Demonstration Needs
There is limited understanding of the applicability of multiphase extraction specifically for DNAPL removal from the subsurface. At many field sites where DNAPL is suspected to be present, DNAPL is never found in wells, so it is unlikely that DNAPL would be recovered from a multiphase extraction well. In general, the impacts of DNAPL distribution, soil permeabilities, heterogeneities, and rate-limited interphase mass transfer on the effectiveness of multiphase extraction are not well understood.
Surfactant/Cosolvent Flushing Systems
Surfactants (commonly known as soaps or detergents) and alcohols (cosolvents) are amphiphilic molecules, having both water-like and oil-like parts. Because they are amphiphilic, surfactants and alcohols are surface-active molecules, and thus accumulate at interfaces of multiphase systems, with the water-like part of the molecule in the polar water phase and the oil-like part of the molecule in the nonpolar oil or less polar air phase. In this way, both parts of the molecule are in a
preferred phase, and the free energy of the system is minimized (Rosen, 1989; Myers, 1999).
Although they are in some ways similar, there is a unique characteristic that differentiates surfactants from alcohols. When the aqueous surfactant concentration exceeds a certain level—called the critical micelle concentration or CMC—surfactant molecules self-aggregate into clusters known as micelles, which contain 50 or more surfactant molecules (Rosen, 1989; Myers, 1999; Holmberg et al., 2003). Micelle formation is unique to surfactant molecules; alcohols do not form such aggregates. Surfactant micelles, with a polar exterior and nonpolar interior, can increase the aqueous concentration of low-solubility organic compounds by providing a hydrophobic sink into which the organic compound partitions. Thus, by adding surfactant at concentrations above the CMC, the micelle concentration increases, as does the contaminant’s apparent solubility. It is therefore desirable to be well above the CMC (e.g., 10 or even 100 times the CMC, or more) in order to maximize the contaminant solubility and thus extraction efficiency.
Alcohols can also increase the solubility of organic compounds, albeit in a somewhat different manner. As opposed to forming aggregates with nonpolar interiors, water-miscible alcohols render the aqueous phase less polar, thereby increasing the aqueous concentration of sparingly soluble organic compounds. This can be understood by realizing that a sparingly soluble organic compound will dissolve to a much higher degree in ethanol than in water. Thus, as more and more ethanol is added to the water, the solution takes on more of the properties of ethanol and the contaminant solubility increases above the water-only case—a process referred to as cosolvency (Rao et al., 1985). The solubility enhancement is less dramatic for alcohols than for surfactants, such that much higher alcohol concentrations are required to achieve high contaminant solubility (nominally an order of magnitude or more alcohol is required than surfactant). At the same time, alcohol costs per unit mass are often much lower than surfactant costs, helping to equalize the economics of these two approaches.
Using a single surfactant or alcohol to achieve higher solubility of organic contaminants is referred to as enhanced solubilization. While this is a fairly straightforward approach, it is not necessarily the most efficient. Using a mixture of surfactants, alcohols, and/or other cosolvents, it is possible to further enhance solubility while also further reducing the water–NAPL interfacial tension (Martel and Gelinas, 1996; Jawitz et al., 1998; Dwarakanath et al., 1999; Falta et al., 1999; Sabatini et al., 1999; Knox et al., 1999; Dwarakanath and Pope, 2000; Jayanti et al., 2002). The former is certainly desirable, but the latter may be undesirable, especially for DNAPLs that, if released, may settle or penetrate into deeper regions not previously contaminated. Approaches in which the interfacial tension is intentionally lowered so as to displace the trapped NAPL are referred to as mobilization approaches. Mobilization is particularly effective in the remediation of LNAPLs because vertical migration will tend to be upward. Laboratory research has investigated using alcohols that partition into the DNAPL and con-
vert it into an LNAPL prior to surfactant flooding, thereby mitigating the vertical migration concerns (Ramsburg and Pennell, 2002); however, this concept has yet to be demonstrated at the field scale. The more efficient process of mobilization has been successfully demonstrated at sites where there was a sufficient flow barrier below the source zone to prevent the DNAPL from migrating downward (Hirasaki et al., 1997; Delshad et al., 2000; Holzmer et al., 2000; Londergan et al., 2001; Meinardus et al., 2002). However, a much greater degree of site characterization is required in such cases to satisfy both technical and regulatory requirements.
Although the main mechanisms underlying surfactant/cosolvent flooding are typically thought of as being either solubilization or mobilization, an alternate approach exists between these two extremes—supersolubilization. Here, the solubility enhancement is maximized while still maintaining a sufficiently high interfacial tension so as to mitigate the potential for mobilization and vertical migration (Jawitz et al., 1998; Sabatini et al., 2000). Site-specific conditions help dictate the best approach for a given site.
When designing a surfactant/alcohol system, one should consider the compatibility of the additive with the subsurface environment, including the porous medium, the groundwater, and the NAPL itself. Failure to consider these interactions may result in excessive loss of the additive (e.g., surfactant sorption or precipitation, phase separation, or even partitioning into the NAPL), rendering the system highly inefficient. When designing these systems, one must also consider factors such as the viscosity and density of the flushing solutions, both prior to and after contacting the NAPL, the temperature and salinity/hardness impacts on the system, the biodegradability of the additive and its metabolites, and the potential impacts of the additive, both in the zone of flushing and in other regions that may be impacted (Fountain et al., 1996; Jawitz et al., 1998; Falta et al., 1999; Holzmer et al., 2000; Sabatini et al., 2000). The additive must also be introduced in such a way that it efficiently contacts the trapped NAPL. In highly heterogeneous systems (e.g., Type III hydrogeologic settings), special design features (e.g., use of polymers, foam, or unique hydraulic schemes, such as vertical circulation wells) may be required. Finally, when conducting multiple pore-volume flushes, economic considerations may mandate decontaminating the surfactant/ alcohol system aboveground prior to reinjection (Sabatini et al., 1998). Whatever approach is used, the site is flooded with water following remediation to flush out surfactant/cosolvent and associated contaminants. There have been two manuals published on best practices and design of surfactant/cosolvent systems (AATDF, 1997; NFESC, 2002).
Overview of Case Studies
According to a recent U.S. Environmental Protection Agency (EPA) survey, there have been at least 46 field demonstrations of surfactant/cosolvent flooding,
with roughly three-fourths of these studies being surfactant-based approaches (www.cluin.org). Of these sites, roughly one-third were LNAPLs, one-third were DNAPLs, one-sixth were mixtures of LNAPLs and DNAPLs, and the remainder were non-liquid organic contaminants. Roughly two-thirds of the sites were federally funded, with the remainder being largely state funded. The majority of the sites (roughly half) were 25–50 ft (7.6–15 m) in depth and less than 3,000 cubic feet (85 m3) in volume.
Table 5-2 summarizes results from 12 different surfactant and cosolvent projects. These studies cover a range of locations (including Utah, California, North Carolina, Hawaii, and Canada) and thus a range of hydrogeologic conditions and contaminant matrices. The swept pore volume ranged from five to a few hundred cubic meters. The mass removed, as estimated by pre- and post-core and partitioning interwell tracer tests, was in the mid 70 percent to the high 90 percent range. The high removal efficiencies experienced in field studies conducted in the 1990s are in contrast to early field studies conducted in the 1980s, where little of the surfactant or contaminant was recovered (e.g., Nash, 1987). The poor performance of these early studies can be attributed in part to poor surfactant selection—for example, failure to consider surfactant behavior under field conditions. These early studies are not included in Table 5-2 because insufficient characterization does not allow comparison with the thoroughly characterized tests listed in the table. Thus, the successes listed in Table 5-2 should not mislead the reader into thinking that this technology is easy to design and implement. It is only because of thorough site characterization, experienced design, and careful implementation that the studies in Table 5-2 were successful, unlike previous efforts. Nonetheless, the relatively high efficiency of the systems reported in Table 5-2 is very encouraging, especially given that the studies were conducted by a range of investigators, addressing a variety of contaminant matrices in a range of hydrogeologic conditions. Case studies of surfactant and cosolvent flooding are presented in Boxes 5-1 and 5-2, respectively, as well as in Box 3-4.
Applicability of the Technology
Contaminants. Both surfactant and cosolvent flushing have been successfully applied to a wide range of contaminants. The NAPLs at the sites listed in Table 5-2 range from PCE and TCE to mixtures of chlorinated solvents, and in some cases include mixtures of widely varying contaminants (DNAPL and LNAPL mixtures). While insights can be garnered from previous studies, such as those cited in Table 5-2, to maximize performance the surfactant or cosolvent system must be designed for the site-specific contaminant of interest. Weathering and alteration of the NAPL will impact this optimization; thus, design of the surfactant or alcohol system should be made using actual NAPL and geological material from the site in laboratory batch and column studies (e.g., Sabatini et al., 2000; Dwarakanath and Pope, 2000; Rao et al., 2001).
TABLE 5-2 Summary of Well-Designed Field Tests of Surfactant and Cosolvent Flooding
|
Year |
Location/Additive |
Geology |
NAPL |
Swept Pore Volume (m3) |
Reduction in NAPL Mass (%) |
Post-NAPL Saturation (%) |
Reference |
|
1991 |
Borden, Ontario 14 PV, 2% Surf. |
Sand |
PCE |
9.1 |
77 |
0.2 |
Fountain et al., 1996 |
|
1994 |
L’Assomption, Quebec 0.9 PV, Surf./Alcohol/Solvent |
Sandy Gravel |
DNAPL |
6.1 |
86 |
0.45 |
Martel et al., 1998 |
|
1995 |
Hill AFB, UT, OU1 9 PV, 82% Alcohol |
Sandy Gravel |
LNAPLa |
4.5 |
85 |
0.9 |
Rao et al., 1997 |
|
1996 |
Hill AFB, UT, OU1 9.5 PV, 3% Surf. / 2.5% Alcohol |
Sandy Gravel |
LNAPLa |
4.5 |
78 |
0.8 |
Jawitz et al., 1998 |
|
1996 |
Hill AFB, UT, OU1 6.5 PV, 4.3% Surf. |
Sandy Gravel |
LNAPLa |
4.5 |
86 |
0.4 |
Knox et al., 1999 |
|
1996 |
Hill AFB, UT, OU2 2.4 PV, 8% Surf. |
Sand |
DNAPL |
57 |
99 |
0.03 |
Brown et al., 1999 |
|
1996 |
Hill AFB, UT, OU1 4 PV, 95% Alcohol |
Sandy Gravel |
LNAPLa |
4.5 |
80 |
0.4 |
Falta et al., 1999 |
|
1997 |
Hill AFB, UT, OU2 4% Surf. & Foam |
Sand |
DNAPL |
31 |
90 |
0.03 |
Szafranski et al., 1998 |
|
1999 |
Camp Lejeune, NC 5 PV, 4% Surf. |
Silt |
PCE |
18 |
72 |
0.5 |
Holzmer etal., 2000 |
|
1999 |
Alameda Point, CA 6 PV, 7% Surf. |
Sand |
DNAPL |
32 |
98 |
0.03 |
Hasegawa et al., 2000 |
|
1999 |
Pearl Harbor, HI 10 PV, 8% Surf. |
Volcanic Tuff |
Fuel Oil |
7.5 |
86 |
0.35 |
Dwarakanath et al., 2000 |
|
2000 |
Hill AFB, UT, OU2 2.4 PV, 4% Surf. |
Sand |
DNAPL |
188 |
94 |
0.07 |
Meinardus et al., 2002 |
|
NOTE: PV = pore volume; Surf = surfactant aLNAPL means an LNAPL with sufficient DNAPL components present, such that in the absence of the LNAPL, the waste would be a DNAPL |
|||||||
|
BOX 5-1 In 1996, a surfactant field test was conducted at Hill Air Force Base Operational Unit 2 to remediate DNAPL contamination. The DNAPL consisted primarily of trichloroethylene, 1,1,1-trichloroethane, and tetrachloroethylene. Sheet piling was installed to isolate the treatment zone, which was 6.1 by 5.4 m in cross section, with a treatment zone thickness of 6.2 m. The subsurface geology includes an alluvial sand aquifer that is confined on its sides and below by thick clay deposits that form a capillary barrier to DNAPL migration. The hydraulic conductivity of this alluvium is in the range of 10–2 to 10–3 cm/s. Based on extensive field characterization, laboratory testing, and simulation efforts using UTCHEM, the remedial system was designed and implemented. The design called for a NaCl pre-flood (0.7 pore volumes) followed by 2.4 pore volumes of the surfactant flood and finishing with post-water flooding. Treatment performance was assessed by pre- and post-partitioning interwell tracer tests. The surfactant system consisted of 7.55% sodium dihexyl sulfosuccinate, 4.47% isopropanol, and 7,000 mg/L of NaCl. The surfactant removed approximately 99 percent of the DNAPL from the swept zone, leaving a residual DNAPL saturation of about 0.0003. The concentration of dissolved contaminants was reduced from 1,100 mg/L to 8 mg/L in the central monitoring well (Londergan et al., 2001; Brown et al., 1999). Overall, the model simulations were able to predict the trends observed in the field results, although the actual concentrations varied somewhat, as shown in Figure 5-3. Nonetheless, use of the model to design the field implementation resulted in excellent system performance. 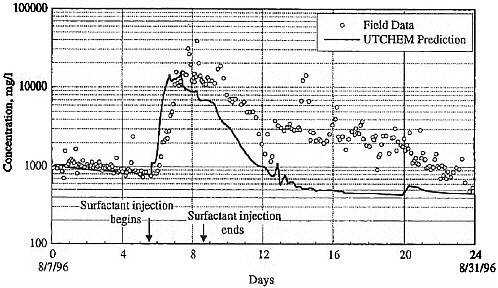 FIGURE 5-3 Contaminant concentration produced at extraction well SB-1 during Phase II test. Comparison of UTCHEM predictions with field data. SOURCE: Reprinted, with permission, from Brown et al. (1999). © 1999 American Chemical Society. |
|
BOX 5-2 In 1997, a cosolvent field test was conducted at Hill Air Force Base Operational Unit 1 to remediate LNAPL contamination. The original LNAPL spill resulted from disposal of petroleum hydrocarbons (e.g., jet fuel) and spent solvents (e.g., chlorinated hydrocarbons) into chemical disposal pits. The aged LNAPL is now a complex mixture of aromatic and aliphatic hydrocarbons and chlorinated solvents. Sheet piling was installed to isolate the treatment zone, which was 3 by 5 m in cross section, with a treatment zone thickness of 2 m. The subsurface geology is a sandy gravel with a lower clay layer. The hydraulic conductivity of this material is as high as 10–1 cm/s. The cosolvent flood consisted of injecting four pore volumes (one pore volume equals 7000 L) of the cosolvent mixture, which was 80% tert-butanol and 15% n-hexanol. Treatment performance was assessed by pre- and post-coring and partitioning interwell tracer tests. The cosolvent removed more than 90 percent of the more soluble compounds (tricholorethane, toluene, ethylbenzene, xylenes, trimethylbenzene, naphthalene) and upwards of 80 percent of the less soluble constituents (decane and undecane), with an overall NAPL removal of 80 percent. The unextracted NAPL mass was highly insoluble, resulting in extremely low contaminant concentrations after the remedial effort (Falta et al., 1999). These results are similar to those of a previous study conducted in a different portion of the same formation. The previous study used a 70% ethanol, 12% pentanol, and 18% water flushing solution, and an 85 percent removal of the NAPL mass was achieved (Rao et al., 1997). |
Failure to design for the site-specific contaminant can cause poor performance (low solubility enhancements), or even result in system failure (significant loss of the additive(s) into the trapped oil phase, or formation of a gel phase with the oil). More hydrophobic oils (e.g., coal tar or creosote) may require a mixture of surfactants, alcohols, or other solvents, or even a combination of surfactants/ alcohols with increased temperature (Dwarakanath et al., 2000), to maximize system performance.
Design and implementation of this technology requires careful site characterization to assess the potential impacts of vertical migration of the contaminant. The better the resolution of contaminant distribution, the more effectively the surfactants/cosolvents can be targeted to the contaminant and the more economical will be the design.
Hydrogeology. Site hydrogeology can pose at least two challenges to implementing surfactant and cosolvent flushing: low flow and flow bypassing. In tight formations such as fine silt or clay (Type II hydrogeologic settings), flushing any solution, even water, will be challenging. At the same time, surfactants and
cosolvents have been successfully applied in silty formations, although the time scale is obviously extended. Flow bypassing occurs when the heterogeneous nature of the geology causes preferential flow paths (e.g., due to layering as in a Type III hydrogeologic setting). The flow bypassing can be further amplified during the remedial effort as regions that are cleaned up first will attract even more flushing solution through them, thereby bypassing the remaining contaminant. Flow bypassing can be addressed by increasing the viscosity of the flushing solution (e.g., with polymers) or by intermittently injecting air to create foam in the preferential pathways, thereby temporarily blocking off these pathways and forcing the flow through the less-preferred regions (Hirasaki et al., 1997; Dickson et al., 2002; Meinardus et al., 2002; Jackson et al., 2003). Since alcohols act as antifoams, their use should be avoided when designing a foam-augmented surfactant system. If they are not properly designed, mobilization systems can significantly increase viscosity, which may make it difficult to flush contaminants through the porous media; at the same time, when they are properly designed and implemented, this concern can be mitigated. Like multiphase extraction, there are no depth limitations associated with surfactant flooding other than those associated with drilling wells.
Health, Safety, and Environmental Considerations. Although at low concentrations both surfactants and alcohols are relatively innocuous, at higher concentrations they can pose a risk to health, safety, and the environment. For example, very high surfactant concentrations, typical of the form in which the surfactant might be delivered, can be harsh to skin. Alcohols can pose a flammability risk that must be accounted for. Accidental releases of surfactant to surface waters can result in fish kills. As described above, mobilization (excess lowering of the interfacial tension) can result in vertical migration of the DNAPL into previously uncontaminated zones, which is obviously an environmental concern. In contrast, solubilization (with minimal reduction in interfacial tension) helps mitigate this concern. All these risks can be avoided when the system is properly designed and implemented, as evidenced by the successful field-scale studies summarized above.
Potential for Meeting Goals
As summarized in Table 5-2, properly designed surfactant and cosolvent systems have achieved greater than 85 percent to 90 percent mass removal in the relatively homogeneous hydrogeological settings reported in Table 5-2, with a number of cases exceeding 97 percent removal. Concentration and mass flux reductions have generally not been documented, although mass flux reductions are expected in more heterogeneous systems even though the mass removal is lower. This is because a portion of the remaining mass in heterogeneous systems is expected to exist in diffusion-limited stagnant regions. These concepts have
been demonstrated in modeling efforts that are described in Box 5-3. Field efforts to validate these models have only recently been attempted. Because surfactant/ cosolvent technologies are extraction or mass removal technologies, they do not transform the contaminants into less toxic forms. Finally, it should be noted that while surfactant/cosolvent technologies have been widely evaluated in porous media systems, much less is known about the performance of these systems in fractured media systems.
Assuming that proper design considerations have been addressed (e.g., making sure that the surfactant does not phase separate or that the alcohol does not override the contamination due to density considerations), both surfactant and cosolvent systems are fairly robust. Even when the goal is to achieve a mobilization system, which is more sensitive to implementation conditions than solubilization, good performance can still be realized even when optimal conditions are not achieved.
One must consider how surfactants and alcohols impact other aspects of the overall remediation strategy (e.g., impacts on aboveground treatment processes). While the increased contaminant solubility produced by the surfactant/alcohol is highly desirable in removing contaminants from the subsurface, this same phenomenon will decrease the stripping efficiency in commonly used air stripping processes. In addition, the presence of certain surfactants will cause significant foaming in the air stripper. These issues have been successfully addressed where the surfactant system is properly designed (or modified, for an existing system) and operated (Brown et al., 1999; Hasegawa et al., 2000). For example, one can modify the air stripper design equations to account for the surfactant reduction in system performance, as corroborated in field-scale studies (Sabatini et al., 1998). In addition, modification of the air stripper, use of antifoams in the air stripper, or use of hollow-fiber-membrane air stripping can mitigate foam formation in the air stripper (Sabatini et al., 1998; O’Haver et al., 2004).
It is important to consider how the presence of these additives might impact follow-on activities at the site (e.g., natural or enhanced bioremediation). The answer is strongly dependent on the surfactant/alcohol concentration present. Whereas the high concentrations present during the remedial activity are likely to inhibit microbes, the lower concentrations present after post-remediation water flushing may not inhibit microbes and may even stimulate them. In fact, several recent field activities have successfully used lower surfactant or alcohol concentrations as a carbon source to stimulate post-remedial bioactivity (Rao et al., 2001; Abriola et al., 2003).
As evidenced in Table 5-2, the percentage of mass removed is a common metric for evaluating the success of surfactant/cosolvent technologies, although other metrics such as concentration reduction or mass flux reduction may be more appropriate. Indeed, the relationship between mass removal and mass flux reduction, first mentioned in Chapter 4, has been best explored for surfactant flushing technologies (see Box 5-3). Two additional metrics that should be
|
BOX 5-3 Depletion profiles, first introduced in Box 4-1, are receiving increasing attention as a means for assessing and designing source zone remedial systems. Depletion profiles seek to demonstrate the relationship between mass flux (mass leaving a source zone per unit area per time) and mass removed at a site. Mass flux is selected as the parameter of interest because it has a significant impact on the risk experienced by a downgradient receptor. Higher fluxes have a greater likelihood of overpowering any natural attenuation processes, and thus have a greater likelihood of causing an undesirable contaminant exposure. Removal of contaminant mass from the source zone may reduce the mass flux, and thus the risk, emanating from the source zone. However, until recently, there has been little information on the relationship between mass removed and mass flux reductions. Figure 5-4 shows several possibilities for the relationship between mass removal and mass flux reduction during surfactant flushing, which have been determined in 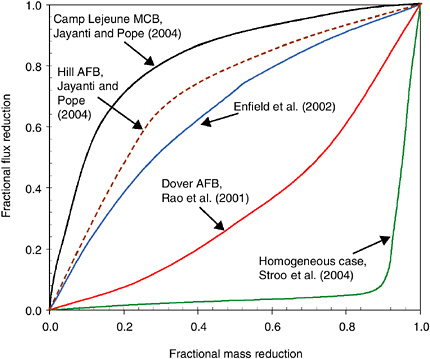 FIGURE 5-4 Depletion profiles from modeling of different cases of surfactant flushing. |
|
different modeling studies. As can be seen, the relationship is very site-specific and is clearly highly dependent on the nature of the contaminant distribution and the level and type of heterogeneities at a given site. The uppermost curve would apply to a site that is highly heterogeneous. In this case, mass is initially removed from the more permeable and mobile regions of the source zone, leaving the remaining mass behind in diffusion-limited regions that make little contribution to the overall mass flux. Thus, in such systems a significant reduction in mass flux can be experienced even though the mass removal is not so dramatic. At the other extreme is the case where a site is more homogeneous and all of the contaminant is equally accessible by the chosen technology. In this situation, almost all of the mass must be removed before a noticeable change in mass flux levels is observed. These two depletion curves define the extremes, with the reality for a given site likely to fall someplace in between. Part of the challenge of using this approach is defining the particular curve that applies to a given site. With the addition of field data to corroborate these modeling results, it may be possible to establish a general relationship between heterogeneity of a site and the approximate depletion curve, or range of curves, that could apply to a particular site. Ongoing research is evaluating this approach for several sites that have been remediated with surfactant/cosolvent technologies (Jayanti and Pope, 2004). Depletion profiles have yet to be developed for other source remediation technologies. Another challenge associated with using the depletion curves is that one must know exactly how much mass existed prior to the remedial activity, and how much mass has been removed, or will be removed, during a given remedial activity, which is extremely difficult. Again, with the development of new characterization techniques, and as additional data and experience with the remedial activities are gained, our ability to determine the mass flux reduction will improve. The availability of such tools and data will make it much easier to take advantage of the depletion profiles as a way to assess the extent to which a given remedial activity will achieve risk reduction at a given site. |
considered during surfactant flushing are (1) verifying that uncontrolled vertical migration has not occurred and (2) verifying that the surfactants/cosolvents do not negatively impact another water resource.
Cost Drivers
The costs of surfactant and cosolvent systems have steadily declined as these technologies have progressed, with costs being competitive with the long-term pump-and-treat systems (although economic discounting can favor these longer-term projects). While not necessarily as efficient or cost-effective, the solubilization
approach is somewhat less complex to design and implement than is mobilization. Surfactant costs can be a significant component of the total cost, especially if surfactant concentrations of 4 to 8 wt% are used. However, as surfactant concentrations are lowered toward 1 wt% or lower, and as surfactant recovery and reuse are implemented (which has been demonstrated—e.g., Sabatini et al., 1998; Hasegawa et al., 2000), costs become more economical.
Technology-Specific Prediction Tools and Models
Experience has shown that laboratory treatability studies and modeling efforts can successfully be used in designing field-scale surfactant/cosolvent systems. This section, which provides a brief overview of several of these simulators, is in no way intended to be exhaustive.
Abriola et al. (1993) discuss the development of a simulator to describe surfactant-enhanced solubilization of NAPLs. The model incorporates transport equations for organic and surfactant constituents, as well as a mass balance for the organic phase. The rate-limited surfactant-enhanced solubilization process is described by a linear driving force expression. The surfactant sorption is described by a Langmuir isotherm. The model is implemented in a Galerkin finite element simulator, where the trapped oil is idealized as a collection of spherical globules. This code was later extended to consider geologic heterogeneities (e.g., low-permeability lenses), as described in Rathfelder et al. (2001).
Delshad et al. (1996) describe a three-dimensional, multicomponent, multiphase compositional finite-difference simulator for evaluating surfactant-enhanced aquifer remediation. An important feature of this simulator is the ability to describe the many types of micellar/microemulsion phases that are possible with mixtures of surfactant, water, and NAPL, and to capture the dependence of these phases on system properties such as temperature and salinity/hardness. Additional surfactant properties that are incorporated into this simulator include adsorption, interfacial tension, capillary pressure, capillary number, and microemlusion viscosity. In addition to its widespread application in subsurface remediation, this simulator was first developed for and has been widely used to model surfactant-enhanced oil recovery. Brown et al. (1999) and Londergan et al. (2001) describe the use of this simulator for the case study presented in Box 5-1. Delshad et al. (2000) used this same simulator to design and interpret the surfactant-enhanced aquifer remediation (SEAR) to remove PCE DNAPL at the Camp Lejeune site. The largest and most significant use of this simulator to date has been its use to design the full-scale SEAR applications to the DNAPL source zone at Hill Air Force Base (AFB) (Meinardus et al., 2002).
Mason and Kueper (1996) developed a one-dimensional numerical model that simulates surfactant-enhanced solubilization of pooled DNAPLs. Two nonequilibrium expressions were used for capturing mass transfer processes. The nonwetting phase saturation distribution is calculated as a function of the hydraulic
gradient, allowing determination of the local velocity. The simulator was applied in an upward flow fashion in an attempt to overcome the potential for downward pool migration in response to a lowering of the interfacial tension. Model predictions agreed well with experimental results.
Thus, several simulators exist for predicting the efficiency of surfactant/ cosolvent flushing technologies. These tools have been validated against and have been used to predict both laboratory and field data. In the hands of a skilled user, these simulators can be used to design and assess the field implementation of surfactant/cosolvent technologies.
Research and Demonstration Needs
One of the great challenges facing surfactant/alcohol systems is achieving good sweep efficiency—that is, making sure the injected solution flows uniformly through the media. Effective sweep efficiency becomes more difficult as the hydrogeology and the contaminant distribution become more heterogeneous. A number of methods already mentioned have been proposed for addressing this challenge (e.g., foams, polymers, vertical circulation wells) and have received limited research at the demonstration level. Additional studies are necessary to further demonstrate the viability and increased efficiency of these methods.
Additional research is also necessary to optimize the implementation of surfactant/cosolvent technologies in karst and fractured bedrock formations, to evaluate the combination of these technologies with other source zone and/or plume remedial technologies, and to evaluate the long-term impact of the mass removal on such activities as post-flushing water flooding and natural attenuation. Many of these research needs are germane to most of the source remediation technologies.
CHEMICAL TRANSFORMATION TECHNOLOGIES
Two technologies that attempt to transform subsurface contaminants in situ include chemical oxidation and chemical reduction. In both cases, chemicals introduced into the subsurface react with the compounds of concern, leading to their transformation or degradation into less toxic breakdown products.
In Situ Chemical Oxidation
In situ remediation of groundwater contamination by chemical oxidation (ISCO) involves the addition of strong oxidants such as peroxide, ozone, permanganate, or persulfate to the subsurface (GWRTAC, 1999; ITRC, 2001). These compounds can oxidize a wide variety of dissolved contaminants including halogenated and nonhalogenated aliphatic and aromatic compounds to compara-
tively less harmful compounds, thereby promoting mass transfer from sorbed or NAPL phases to the aqueous phase and consequently shrinking the source mass.
Hydrogen peroxide, in the presence of added or naturally occurring ferrous iron, produces Fenton’s reagent (Glaze and Kang, 1988; Ravikumar and Gurol, 1994; Gates and Siegrist, 1995; Watts et al., 1999; Tarr et al., 2000). The ferrous iron catalyzes the breakdown of hydrogen peroxide into a hydroxide ion and a hydroxyl radical in what known as the Fenton’s reaction:
The hydroxyl radicals are very reactive toward organic compounds, with final breakdown products being carbon dioxide, water, and, in the case of chlorinated solvents, hydrochloric acid. For example, the reaction of Fenton’s reagent with TCE is:
Typically, hydrogen peroxide is added to the subsurface as an aqueous solution (10–50 wt % H2O2) with ferrous sulfate. The greatest reactivity occurs in the pH range of 2–4, so pH amendment is often included in application of Fenton’s reagent to in situ remediation.
Ozone (O3) gas is another typical oxidant, and it is added to the subsurface through sparge wells. Ozone is very reactive and can oxidize contaminants directly or via formation of reactive hydroxyl radicals (Liang et al., 1999, 2001). For example, the reaction of ozone with TCE is:
Like hydrogen peroxide, ozone is most effective under acidic conditions. Ozone is the most complex of the common oxidants, requiring the use of onsite ozone generation and operation of sparge wells, some variants of which involve specialized equipment.
Permanganate (MnO4–) is most commonly used as an aqueous solution of potassium or sodium permanganate. The permanganate ion can oxidize a variety of organic compounds; for example, the reaction of potassium permanganate with TCE is:
The MnO2 produced by this reaction precipitates in the soil. The reaction rates of permanganate with organic compounds are slower than rates of reaction of ozone and Fenton’s reagent (see kinetic studies of Yan and Schwartz, 1999; Hood et al.,
1999; and Huang et al., 1999, 2002). Permanganate is an effective oxidant over a pH range of 4–8 (Yan and Schwartz, 1999).
Persulfate (S2O82–) has been proposed as an oxidant suitable for remediation of chlorinated solvents (Liang et al., 2003), but research and field implementations of persulfate are quite limited compared to hydrogen peroxide, ozone, and permanganate. At ambient temperatures, oxidation of chlorinated organics such as TCE by persulfate is not expected to be significant (Liang et al., 2003). However, at temperatures above 40°C, persulfate ions may be transformed to highly reactive sulfate free radicals:
The sulfate free radicals can oxidize chlorinated organics such as TCE, producing carbon dioxide, water, chloride ions, and sulfate ions. Liang et al. (2003) found that half-lives for TCE decreased from 385 hours at 20°C to 1.44 hours at 40°C and to 0.15 hours at 60°C.
Overview of Case Studies
There have been many field applications of chemical oxidation technologies in recent years (see Table 5-3 for select cases and EPA, 1998b) that allow some generalizations to be made about the technology. For the studies summarized in Table 5-3, the contaminants treated include chlorinated ethenes, BTEX, polycyclic aromatic hydrocarbons (PAHs), and methyltertbutylether (MTBE), and DNAPL presence is inferred from high dissolved contaminant concentrations. Sites include highly permeable settings, as well as some silt/clay soils and fractured rock. At most sites, reductions in contaminant concentrations were achieved, but complete cleanup was not reported at any site. In many of the case studies in Table 5-3, performance is based on reductions in dissolved concentrations of contaminants measured within or near the treatment area shortly after completion of the treatment. In most cases initial and final contaminant masses were not determined.
The greatest difficulties in the application of chemical oxidation were encountered in heterogeneous soils and low-permeability soils. In the Kansas City example from Table 5-3, soil mixing was used to overcome limitations associated with the low permeability of the clay soils. Siegrist et al. (1999) investigated the effectiveness of permanganate oxidation in low-permeability silty clay soil by emplacing permanganate in hydraulic fractures. After ten months, they demonstrated that the reactive zone had extended only about 40 cm into the matrix from the fracture. As TCE loadings were increased, removal efficiencies declined. There have been very few applications of in situ chemical oxidation in fractured rock, although application of permanganate to remediation of TCE in fractured rock at Edwards Air Force Base (Morgan et al., 2002) resulted in reductions in TCE and DCE concentrations to below detection in the treatment zone.
TABLE 5-3 Field Applications of Chemical Oxidation
|
Location |
Oxidant |
Media and Contaminants |
Application Method |
Results |
|
Anniston Army Depot |
H2O2 |
TCE (1,760 mg/kg) in shallow clay backfill (1997) and in soil, epikarst, and bedrock (1999). |
The shallow project (1997) involved 109,000 gal (413,000L) of 50% H2O2 injected through 255 injectors [8- to 26-ft (2.4- to 8-m) depth] over 120 days for remediation below lagoons (EPA, 1998b). The deeper full-scale project (1999) involved 20 days of injection, followed by another 7 days of injection two months later (Abston, 2002). |
The 1997 full-scale project was considered to be successful, with soil concentrations of TCE reduced to below detection (EPA, 1998b). 1999 full-scale implementation was not successful, as 11 of 42 wells [31–81 ft (9.4–24.7m)] remained above target of 28,000 ppb TCE (Abston, 2002). |
|
Swift Cleaners Jacksonville, FL |
H2O2 |
PCE, TCE, DNAPL reported. Dissolved concentrations of 4,400 to 10,000 µg/L for PCE, and 24 to 382 µg/L for TCE. |
400 to 600 gal (1,514 to 2,271 L) of 14%–15% hydrogen peroxide (plus catalyst) injected in two separate areas (12 wells in one area, 13 in second area, 2 injections per well). Radius of influence was 7.5 ft (2.3 m). In third injection, a total of 600 gal (2,271L) of 15% hydrogen peroxide was injected in 11 wells. Treatment area was 4,500 ft2 (418m2). Treatment depth was 35 to 45 ft (10.6 to 13.7 m). |
PCE concentrations were reduced to below 200 µg/L in the first quarter. In the second quarter, PCE concentrations rose to 1,050 µg/L. Contaminant rebound continued in third quarter. |
|
Former News Publisher, Framingham, MA |
H2O2 |
1,1,1-TCA, 1,1-DCE, and VC in groundwater, fine-grained silty sand. |
Solution of H2O2, iron catalyst, and acid injected through two 4-in-diameter PVC wells. |
In 3 weeks TCA dropped from 40,600 to 440 µg/L and DCE from 4,800 to 2,300 µg/L. VC dropped to below 85 µg/L. |
|
Location |
Oxidant |
Media and Contaminants |
Application Method |
Results |
|
Active Industrial Facility, Clifton, NJ |
H2O2 |
TCA in groundwater, fill. |
H2O2, iron catalyst, and acid applied through 12 4-in-diameter PVC wells into the fractured bedrock. |
TCA dropped in the most contaminated well from 101 mg/L to 2 mg/L. Average total VOC dropped from 44 mg/L to 15 mg/L. |
|
Westinghouse Savannah River Site, Aiken, SC |
H2O2 |
600 lb (272 kg) DNAPL (TCE, PCE) in sand, clay. |
H2O2, ferrous sulfate added over a 6-day period over 27-ft (8.2-m) radius. One batch (500–1000 gal or 1,893–3,785L) injected per day. |
94% of DNAPL destroyed in treatment zone. Average final [PCE] = 0.65 mg/L, [TCE] = 0.07 mg/L. |
|
Cape Canaveral Air Force Station, Launch Complex 34 |
KMnO4 |
6,122 kg of TCE in test plot area, with 5,039 kg as DNAPL. Test plot size was 75 ft by 50 ft by 45 ft (23 m by 15 m by 13.7 m). Sandy soils, heterogeneous. |
842,985 gal (3.2 million L) of permanganate solution (1.4–2%) injected into test plot in 3 phases over 8 months. After first injection, monitoring showed local heterogeneities limited oxidant distribution in some areas. Second and third injection phases focused on areas where monitoring showed insufficient oxidant delivery. |
Mass of TCE and DNAPL reduced by 77% and 76%, respectively. The best distribution of the oxidant was in upper sandy soils. Distribution of oxidant more difficult in finer-grained soils. Local geologic heterogeneities and native organic matter content may have limited oxidant distribution in some regions. |
|
U.S. Army Cold Regions Research and Engineering Lab, Hanover, NH |
KMnO4 |
TCE (170 mg/kg at one site, 60,000 mg/kg at another site) in sand, silt. |
1.5% KMnO4 solution (15 g/L) injected via two direct-push wells. Site 1:200 gal (757 L) in 53 days; Site 2:358 gal (1,355 L) in 21 days. |
Chloride concentrations increased from 20 to 6,420 mg/L. More oxidant required for complete cleanup. |
|
Canadian Force Base Border Ontario |
KMnO4 |
TCE (1,200 mg/kg), PCE (6,700 mg/kg), DNAPL in sand. |
Six injection and five oxidant recovery wells used to flush DNAPL source zone with a solution of 8 g/L KMnO4 for 500 days. |
99% reduction in peak concentrations for both PCE and TCE. Mass flux of dissolved contaminants reduced by 4–5 orders of magnitude. |
|
Kansas City Plant |
KMnO4 |
TCE (81 mg/kg), 1,2-DCE (15 mg/kg), VC, TPH (7,000 mg/kg), PCBs (10 mg/kg) in clay. |
Soil mixing using 8- to 10-ft (3-m) diameter blades and a 4–5% KMnO4 solution over 15 soil columns, treated to 25- to 47-ft (7.6- to 14.3-m) depth. |
Results showed 83% TCE removal from unsaturated soil, 69% removal from saturated soil. |
|
Portsmouth Gaseous Diffusion Plant, Piketon, OH |
KMnO4 |
TCE (maximum 300 mg/kg in soil, 800 mg/L in groundwater) in sand and gravl. |
Parallel horizontal wells, 90 ft (27 m) apart, 200-ft (61-m) screened sections. Water from up-gradient well amended with 1.5–2.5% KMnO4, reinjected into downgradient well. |
TCE reduced to below detection in treated areas; heterogeneities impacted treatment coverage. |
|
Edwards Air Force Base |
KMnO4 |
TCE in fractured rock. |
7,500 gallons (28,391 L) of 1.8% KMnO4 injected into bedrock over 4 days from 8 wells. A 40:1 ratio of KMnO4 to VOC was used. |
TCE, DCE fell to below detection in treatment zone. Acetone, elevated metals were detected. |
|
Former Service Station, Commerce City, CO |
O3 |
TPH (90–2,380 mg/kg), BTEX (7,800–36,550 µg/kg) in sand/gravel. |
50-ft (15-m)-deep C-Sparge wells (14–20 psi sparge pressure). |
TPH reduced from free product to 37 mg/L in one well. TPH and BTEX below detection in all other monitoring wells. |
|
Location |
Oxidant |
Media and Contaminants |
Application Method |
Results |
|
Dry Cleaning Facilities, Hutchinson, KS |
O3 |
PCE (30–600 µg/L in groundwater) in sand, silt, clay. |
C-Sparge well at 35-ft (11-m) depth |
PCE was reduced from 34 to 3 µg/L. Air-only injections gave a 71% reduction, in-well stripping an 87% reduction, and air sparging/SVE a 66% reduction. Many operational problems with C-Sparge wells. |
|
Former Industrial Facility, Sonoma, CA |
O3 |
PAHs (1,800 mg/kg), PCE (3,300 mg/kg) in sand, clay. |
4 multilevel ozone injection wells in vadose zone, SVE wells were used outside the treatment areas to control fugitive ozone emissions. |
PAHs reduced 67–99.5%, PCE reduced 39–98%. 90% ozone utilization achieved. |
|
Park, Utrecht, Netherlands |
O3 |
Halogenated VOCs (HVOCs) at 1,450–14,500 µg/L; BTEX at 62–95 µg/L in fine sand. |
C-Sparge well. |
In a 10-day field test, HVOC was reduced from 14,500 to below 1,000 µg/L. Mean BTEX levels fell from 54 to 17 µg/L. |
|
SOURCE: EPA (1998b, 2003). |
||||
Two case studies are presented in Boxes 5-4 and 5-5. The first case study, at NAS Pensacola, involved the use of Fenton’s reagent to remediate TCE in a fairly homogenous soil. In this case, rebound of TCE after the first round of treatment was observed. At some locations in the treatment zone, TCE concentrations were still above maximum contaminant levels (MCLs), but the treatment was deemed to have met remediation objectives. The second study, at the Portsmouth Gaseous Diffusion Plant, involved potassium permanganate addition to remove TCE. This study demonstrates the difficulties encountered in using chemical oxidation in heterogeneous soils, as some areas of the treatment zone were not effectively remediated by the permanganate.
Applicability of the Technology
Contaminants. Peroxide and ozone are suitable for oxidation of BTEX, PAHs, phenols, and alkenes, while permanganate is suitable for BTEX, PAHs, and alkenes. All are suitable for treatment of NAPLs. Some classes of contaminants such as alkanes and polychlorinated biphenyls (PCBs) are resistant to chemical oxidation. Highly reactive chemicals such as explosives are also not
|
BOX 5-4 The site was the Wastewater Treatment Plant Sludge Drying Bed at NAS Pensacola, Florida. The source area was estimated to be 50 ft by 50 ft (15 m by 15 m) in fairly homogeneous sands. TCE concentrations were 3,600 µg/L, and an estimated 5,000 pounds (2,268 kg) of chlorinated hydrocarbons existed in the source area. In the first phase of remediation, 14 injections wells (10- to 40-ft or 3- to 12-m depth) were used to inject 4,000 gallons (15,141 L) of H2O2 and 4,000 gallons (15,141 L) of 100 ppm ferrous sulfate over one week. TCE concentrations were reduced from 3,000 to 130 ppb in one well and from 1,700 ppb to below detection limits in another well. One month later, TCE concentrations at the non-detect well had rebounded to pretreatment levels in several locations. A second week of Fenton’s reagent injection [6,000 gallons (22,712 L) of H2O2] at the 35- to 40-ft (10.6- to 12-m) depth was conducted, bringing maximum TCE concentrations down to 90 ppb. Thirty (30) days later, maximum TCE concentrations had rebounded to 180 µg/L, and then to 198 µg/L eight months after treatment. It was concluded that this met the remediation objectives and that natural attenuation would be sufficient to control this level of TCE. The cost of the remediation was $250,000. SOURCE: enviro.nfesc.navy.mil/erb/erb_a/support/wrk_grp/raoltm/case_studies/rao_pensacola.pdf and NAVFAC (1999). |
|
BOX 5-5 A well-documented application of permanganate to treat TCE present as DNAPL and as a dissolved plume (54 mg/kg in soil, as high as 820 mg/L in groundwater) occurred at the Portsmouth Gaseous Diffusion Plant in 1997 (DOE, 1999). A 2% permanganate solution was injected into the subsurface for one month through two parallel horizontal wells [200-ft (61-m) screened sections] installed in the center of the plume located in a 5-ft (1.5-m)-thick silty, gravel aquifer. The site stratigraphy consisted of a 25- to 30-ft (7.6- to 9.1-m)-thick silt and clay layer, overlying a 2- to 10-ft (0.6- to 3-m)-thick layer of sand and gravel above bedrock. The sand and gravel aquifer was the target for treatment [a volume of 90 ft by 220 ft by 6 ft (27 m by 67 m by 1.8 m) deep]. It was later found that vertical heterogeneities in the aquifer led to channeling that reduced the effectiveness of treatment. Possible plugging of the midsection of one of the well screens was also suspected to have caused additional delivery problems. An additional vertical well was used to inject additional permanganate. A total of 206,000 gal (780,000 L) of oxidant solution (12,700 kg of KMnO4) was injected into the treatment region. Good treatment was achieved (< 5 ppb TCE) in treated areas, while little change in TCE concentration was observed in areas not swept by oxidant. The average TCE groundwater concentrations in the treatment area were 176 mg/L before treatment, 110 mg/L at completion of treatment, and 41 mg/L two weeks after recirculation. TCE concentrations increased to 65 mg/L and 103 mg/L at 8 and 12 weeks after recirculation, respectively. The gradual increase in TCE concentrations was attributed to dissolved TCE flowing into the area or diffusing out from finer-grained, less-permeable regions. |
candidates for oxidation technologies due to the potential for causing explosions and fires and for creating hazardous byproducts.
Source zones with high saturations of NAPL may not be good candidates for in situ chemical oxidation, as they will have a very large oxidant demand. The reaction of oxidizing compounds with the NAPL may lead to the generation of excessive amounts of heat in the case of Fenton’s reagent or ozone, and to the generation of excessive MnO2 in the case of permanganate. In the case of chlorinated solvents, high levels of acidity may also be generated. Generation of large amounts of carbon dioxide, chemical precipitation, and other geochemical and physical changes may lead to reduced mass transfer from the NAPL to the water phase, limiting the effectiveness of chemical oxidation (Schroth et al., 2001; Mackinnon and Thomson, 2002; Lee et al., 2003).
Hydrogeology. Hydrogeologic considerations are perhaps the most important factor for the design of in situ chemical oxidation treatment systems. Peroxide and permanganate are delivered as aqueous solutions through horizontal or vertical
wells or vertical injection probes (which control the depth to which in situ chemical oxidation can occur). Rates of injection are therefore limited by soil permeability. In low-permeability soils such as clays, soil mixing may be necessary, as was done at Kansas City (Table 5-3). Hydraulic fracturing has also been used to allow emplacement of oxidants in low-permeability soils (Siegrist et al., 1999).
Treatment effectiveness is also highly influenced by heterogeneities in soils due to layering or fracturing. As peroxide reacts very rapidly, effectiveness of peroxide treatment is particularly sensitive to flow channeling. Permanganate is more stable and reacts more slowly, allowing time for diffusion into low-permeability zones. Ozone is injected as a gas through sparge wells in the vadose or saturated zones. In the saturated zone, channeling of sparged ozone due to viscous instabilities and soil heterogeneities may significantly reduce effectiveness of treatment.
Natural organic matter, reduced minerals, carbonate, and other free radical scavengers in the subsurface consume oxidant, thereby reducing the amount available to degrade the target compounds. Thus, the background oxidant demand must be considered when determining dosage requirements for oxidants. Background oxidant demand should be determined from laboratory tests with soil from the site and the same oxidant dosages as planned for the field.
Health, Safety, and Environmental Considerations. Peroxide, permanganate, persulfate, and ozone are all hazardous chemicals that must be handled properly. Application of ozone or Fenton’s reagent can generate excessive amounts of heat and a significant amount of gas (Nyer and Vance, 1999). In particular, ozone, being a gas, requires special precautions. The oxidation of soil organic matter and of contaminants generates acidity, and can therefore reduce the pH of the groundwater if sufficient buffering capacity is not present naturally or is not added. There is also the potential for mobilization of redox-sensitive and exchangeable sorbed metal ions. This was observed at Pueblo, Colorado, where application of Fenton’s reagent for remediation of TNT, 1,3,5-trinitrobenzene (TNB), and RDX resulted in increases in concentrations of Cr, Se, Mn, and Hg (May, 2003).
Many of these by-products of oxidation reactions may have detrimental effects on the environment. If natural attenuation is desired as a polishing step after the source remediation phase, oxidants may not be the best choice of technology, as they may destroy indigenous microbial populations, particularly redox-sensitive anaerobic microbial communities associated with chlorinated solvent biodegradation. Kastner et al. (2000) found that application of Fenton’s reagent reduced microbial populations in groundwater and soil, particularly methanotrophs. There has been very little additional study of the impact of oxidation technologies on subsurface indigenous microbial activity.
Reductions in permeability as a result of in situ chemical oxidation may be caused by the formation of colloidal materials. Permanganate reaction with
organics leads to the precipitation of manganese dioxide, which can reduce soil permeability, remain as a long-term source of manganese in the soil, and cause problems in some sensitive environments.
Potential for Meeting Goals
The likely effectiveness of oxidation technologies with respect to various objectives for different hydrogeologic conditions is summarized in Table 5-7. Oxidation technologies have the potential for achieving significant mass destruction of organics in the subsurface. However, as demonstrated by the field applications listed in Table 5-3, and by a variety of laboratory-scale studies (Schnarr et al., 1998; Gates-Anderson et al., 2001; MacKinnon and Thomson, 2002; Lee et al., 2003), complete removal of contaminants is not likely to be achieved with oxidation technologies even under optimal conditions.
The installation and operation of in situ chemical oxidation technologies is relatively straightforward, once subsurface conditions are defined, injection well locations are determined, and oxidant requirements are estimated. Of the various technologies employed, ozone sparging is the most difficult to operate due to the reactivity of ozone and the difficulties in operating sparging wells. The use of bench- and pilot-scale tests is recommended to evaluate the potential effectiveness of oxidants for the soils and contaminants to be treated.
Assessment of the effectiveness of chemical oxidation should include monitoring of groundwater geochemistry (pH, redox, dissolved metals), oxidant concentrations, reaction products such as chloride, and temperature. In addition, post-oxidation monitoring should be conducted to evaluate possible rebound of contaminant concentrations, release of metals, dissipation of oxidants, and rebound of microbial populations.
Chemical oxidation technologies most often fail because of ineffective delivery of oxidants caused by subsurface heterogeneities or by poor delineation of contaminant distribution in the subsurface. In heterogeneous soils, the transfer of oxidants into low-permeability zones where contaminants reside may be problematic, resulting in very low efficiency of contaminant destruction. There has been very little study of the use of chemical oxidants in fractured clay and rock, but these technologies are not expected to be very effective in these environments due to the diffusion-limited mass transfer rates of oxidants into the clay and rock matrices, particularly in the case of the unstable ozone and peroxide oxidants (Struse et al., 2002). In the case of permanganate, the use of oxidation emplacement technologies may offer some promise (Siegrist et al., 1999), but treatment times are expected to be lengthy, with significant difficulties in emplacing oxidants with any certainty. Alteration of subsurface permeability due to formation of gases or colloidal materials, or from manganese dioxide precipitation in the case of permanganate, may further reduce the efficiency of in situ chemical oxidation.
Cost Drivers
The major costs of oxidation technologies are associated with injection well installation, chemical (oxidant) costs, and post-treatment sampling and monitoring. The costs will therefore be highly influenced by the well depths, the size of the treatment zone, the background oxidant demand, the amount of contaminant to be oxidized, and the effectiveness of delivery of oxidant to the contaminant. Costs and the likelihood of failure are likely to increase with increasing heterogeneity of the subsurface. Treatment costs are also likely to be higher if the subsurface is poorly characterized and the contaminant distribution is poorly delineated.
Technology-Specific Prediction Tools and Models
Design of in situ chemical oxidation systems requires selection of injection well spacing and injection rates, as well as prediction of rates of removal of target contaminants. For peroxide and permanganate, injection systems can be designed with conventional groundwater models, as these oxidants are injected in aqueous solution. For injection of ozone into the vadose zone, vapor flow models can be used. However, for ozone sparging into the saturated zone, reliable models for accurate prediction of movement of sparged gases do not exist. Predicting the rates of contaminant oxidation requires modeling the distribution of contaminants, the movement of injected oxidants, and the contact and kinetic reactions between oxidants and contaminants. A few conference proceedings of the modeling of these processes have been published (Hood and Thomson, 2000; Reitsma and Dai, 2000; Zhang and Schwartz, 2000). In the case of dissolved contaminants, the modeling of the processes is straightforward mathematically, although accounting for the impact of small-scale soil heterogeneities on subsurface transport of oxidants and target contaminants can be challenging. In the case of oxidation of NAPLs, complex models may be required to account for the effective kinetics changing as the amount of NAPL, and thus the contact area, is reduced. Changes in soil permeability due to oxidant reactions, such as the formation of manganese dioxide from permanganate, also present a significant modeling challenge that has not been addressed.
Research and Demonstration Needs
Continued research on the effectiveness of oxidation technologies is required. In particular, continued research is needed on the interactions of the oxidants with subsurface media (soil, rock), and on the impact of oxidants on soil permeability and on mass transfer from NAPL phases (e.g., impact of MnO2 precipitation on soil permeability and on NAPL dissolution and reaction). The ultimate removal levels possible for the various oxidants in various hydrogeologic settings (particularly fractured media) have not been well demonstrated. In addition, little
research has been conducted on the impact of oxidants on metal release and on microbial activity and related intrinsic bioremediation after oxidant flushing.
Chemical Reduction
Source treatment by chemical reduction consists of mixing granular iron (also known as zero valent iron or ZVI) and clay into a source zone to react with and treat chlorinated solvents, typically at a 95:5 weight ratio of clay to ZVI. The treatment mechanism is the well-documented reductive dehalogenation process used in permeable reactive barrier applications. The purpose of mixing of clay into the source zones is to create a stagnant hydrologic environment to inhibit transfer of contaminants from the source zone to groundwater while the reaction with ZVI occurs inside the source zone. To date, there are a very small number of sites where this technology has been used and none have been documented in peer-reviewed literature. DuPont completed one project using high-pressure jetting as the slurry delivery method and another project using an auger-based soil mixing process. This case study of chemical reduction is presented in Box 5-6.
Applicability of the Technology
Contaminants. ZVI has been demonstrated in column and field studies to dechlorinate a wide variety of chlorinated and fluorinated compounds (EPA, 1998c). Reaction with ZVI degrades carbon tetrachloride to chloroform and then to dichloromethane, with some of the original completely degrading to unknown non-toxic products. In long exposures at Martinsville VA, dichloromethane appears to degrade to chloromethane and then methane. PCE and TCE are dechlorinated by ZVI to dichloroethene and vinyl chloride and then to a mixture of ethene and acetylene. Although ZVI is known to react with highly chlorinated ethane compounds (e.g., hexachloroethane and 1,1,1-trichloroethane), ZVI/clay treatment is unlikely to be effective for treatment of source zones containing dichloroethane.
The essential site characterization parameter is the extent of the source area, both vertically and horizontally. Because chemical reduction can be used both above and below the water table, the source zone needs to be defined in both environments. A detailed knowledge of the DNAPL or adsorbed solvent distribution is not necessary because the whole source zone will be homogenized during treatment. However, if a potentially mobile pool of DNAPL is present, the disruption of any confining layers that may occur during treatment should be considered. A rough estimate of the contaminant mass is useful for selecting the amount of ZVI, though engineers may choose to be conservative and inject an excess of ZVI.
Hydrogeology. Chemical reduction is practical in any hydrogeologic environment where soil mixing is economically feasible. It has not been practiced in
|
BOX 5-6 Combined chemical reduction/containment technology uses granular iron to degrade chlorinated solvents via reduction and dechlorination reactions, and clays to reduce the permeability of the soils. This combination both treats the source area and reduces groundwater flow through the source area. A field trial of chemical reduction/containment was carried out at DuPont’s Martinsville, Virginia, site. Several patents on this technology were granted to the DuPont company. DuPont donated all rights to this technology to Colorado State University in August 2003. The test was carried out at a former acid neutralization area known as Unit I, which received various laboratory wastes including spent nitric and formic acids, phenol, and carbon tetrachloride (CT). The laboratory waste pits were used between 1958 and 1974. They were closed in 1974 by backfilling with soil. The pits had concrete walls and a concrete cover with two surface openings, one used to discard spent acid and one used to discard solvents. The pits were approximately 12 ft (3.7 m) deep and had open bottoms that were lined with limestone cobbles. A detailed site assessment showed that the pit area was a continuing source of CT in groundwater. The source area was then carefully delineated. The surface footprint of the source area was approximately 70 ft (21 m) by 100 ft (30 m), and the unsaturated contaminated soil depth extended to approximately 30 ft (9 m) below grade. The source area volume was estimated to be approximately 88,000 cubic yards (67,281 m3). Soil concentrations of CT as high as 30,000 ppm were observed. Much lower concentrations of PCE, TCE, and dichloromethane were found. Based on the site assessment data, DuPont estimated that the source area contained about 22,000 kg of CT. The highest CT concentrations were generally near the contact between alluvial soils and saprolites, located approximately 15–20 ft (4.6–6 m) below grade. The ultimate goal for remediation in this area was to improve the quality of down gradient groundwater. Groundwater is not used as a potable source, but eventually discharges to the Smith River. The decision was made to remediate the pit rather than contain it. A number of remedial technologies were considered. Laboratory studies were carried out on chemical reduction, and field pilot evaluations were conducted for soil vapor extraction (SVE) and chemical reduction with containment. The decision was made to proceed with chemical reduction with containment because the laboratory results were promising and because there was a perceived need for a field trial of that technology. The laboratory studies were conducted with up to 30,000 ppm CT. They showed that the iron reacted rapidly with the carbon tetrachloride and degraded it to about 1,500 ppm of dichloromethane. The dichloromethane appeared to persist in the laboratory studies. A surprise in the laboratory studies was the appearance of up to 1,500 ppm of tetrachloroethene, and trace amounts of hexachlorobutadiene. Because dichloromethane biodegrades very rapidly in soil (NRC, 2000), it was predicted to be a transient compound in field implementation. Tetrachloroethene is well known to react with iron, so it was also predicted to degrade in the field. |
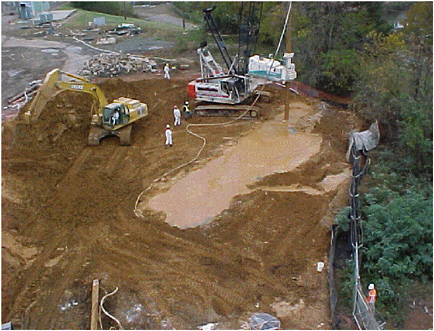
|
Quality control was maintained by sampling each mixed column at several depths using a push tube. The concentrations of clay and iron were measured at each depth. If not enough iron was found, more iron was added and the column was re-mixed. The only operating problem encountered was that the augers were unable to penetrate and mix a thin boulder layer that was encountered in a small area at the south side of the source area. The boulders had to be excavated before treatment could continue. Some additional soil volume was created during the project, so a small mound was left in place at the end of the project. The amounts of additives injected were 225 tons of granular iron, 340 tons of kaolinite, and 250,000 gallons (946,353 L) of water. Cement was added to the top five feet (1.5 m) of each column to improve the soil’s bearing properties. The remedy required 10 weeks to construct and cost roughly $700,000. This cost includes site preparation, utility location and removal, mobilization, start-up, materials, oversight, quality control, air monitoring, demobilization, paving, and report preparation. A series of soil cores were collected from the treated area one year after treatment to monitor the progress of the treatment. Forty-four (44) pretreatment cores had been analyzed; 18 posttreatment core samples were collected and analyzed. The following table summarizes the observed average concentrations and estimated contaminant masses observed before and after treatment. As with all DNAPL sites, these estimates are based on the best information available. The posttreatment estimates are thought to be more rigorous than the pretreatment estimates because the site was homogenized by the mixing equipment.
|
||||||||||||||||||||||||||||||||||||||||
any bedrock environments to date, as it is anticipated that bedrock environments would be very difficult to mix adequately and economically. The bearing properties of the soil should be known, both before and after treatment. If the bearing capacity will be too low after treatment, a small amount of cement can be mixed into the soil during treatment in order to restore the bearing properties. There are no physical limits on the area or volume that could be treated with chemical reduction, although there may be limits imposed by economics and the relative costs of competing technologies like containment. The ease of soil mixing decreases with depth, such that soil mixing is rarely used at depths greater than 35 meters.
It should be noted that the mechanical process of soil mixing will first increase local permeability before clay is added to reduce permeability. Thus, there is the potential for mobilizing DNAPL by removing capillary barriers during the mixing process. The mixing process may also induce local pressure gradients, potentially increasing DNAPL mobility. With virtually no data available on the mechanics of the process under saturated conditions, the resulting risks are largely unknown and must be evaluated on a site-specific basis.
Health, Safety, and Environmental Considerations. The primary health and safety considerations are the dangers of working with the heavy construction equipment used to conduct the mixing essential to this treatment. Prior to mixing, all underground utilities should be identified and either deactivated, or preferably removed. Worker exposure to potential VOC releases during the mixing process must be monitored and controlled. Once mixing is completed, the potential for VOC release is very low. Neither the ZVI nor the clay used in this process is believed to present a hazard to worker health.
Potential for Meeting Goals
Chemical reduction is believed to have a high potential for meeting a variety of remediation goals when it is used on appropriate sites. Both the chemistry of the contaminant degradation reactions that this technology depends upon and soil mixing are well-documented and established. In unconsolidated media of Types I, II, and III, the potential for this technology is high for achieving mass removal, concentration reduction, mass flux reduction, reduction of source migration potential, and a substantial reduction in toxicity. However, this technology is being rated based on a very small number of field studies, and without peer-reviewed documentation.
The technology should only be used at sites where there is reason to believe that soil mixing can be successful. Soil mixing works best when there are no large objects in the subsurface (e.g., large cobbles or boulders) and when there are no surface structures. Mixing of bedrock (Types IV and V) is very difficult, such that this technology would not be appropriate in these hydrogeologic settings.
Finally, the simplicity of chemical reduction makes it a very robust technology. However, it must be noted that it cannot be easily combined with technologies other than containment or excavation because of the loss of permeability that is a consequence of chemical reduction.
Cost Drivers
The volume and depth of the source zone are the primary drivers of treatment cost for chemical reduction. The depth of the necessary mixing is key—shallow mixing can be done more rapidly than deep mixing, so the productivity of the mixing equipment in cubic meters mixed per hour will be considerably higher at shallow sites. The amount of ZVI that will need to be added during mixing contributes to costs.
Technology-Specific Prediction Tools and Models
At this time there are no modeling tools specifically adapted to predict the success or failure of chemical reduction using ZVI and clay, though some parts of the treatment can be modeled. The residence time of water within the treated zone can easily be predicted assuming homogeneous mixing is accomplished. Simple kinetic models of ZVI may roughly predict the rates of treatment. Laboratory treatability studies appear to be good tools for designing treatment mixtures and for predicting the success of this treatment on a site-specific basis.
Research and Demonstration Needs
The impacts of soil type and composition on chemical reduction are not known. Whether contaminant mixtures present a problem has not been tested, especially for cases where hydrocarbons are a co-contaminant. Catalysis of the ZVI degradation reactions has been examined for permeable reactive barriers, but little is known about the ability or impact of catalysis on a ZVI/clay treatment. A detailed knowledge of the kinetics of reaction and of the impacts of mass transfer kinetics would be useful in predicting the performance of chemical reduction remedies. Finally, the potential for mobilizing DNAPL by mechanical disruption of confining layers or by hydraulic displacement resulting from pressure gradients induced during mixing needs to be the subject of future studies.
SOIL HEATING TECHNOLOGIES
The three most widely applied soil heating methods used for source remediation are steam flushing or flooding, thermal conduction heating, and electrical resistance heating. All of these technologies are intended to increase the partitioning of organic chemicals into the vapor or gas phase where they can be
extracted under vacuum, which is a form of enhanced soil vapor extraction (SVE). In addition, there is evidence that some organic contaminants can be destroyed in situ at sufficiently high temperatures.
The three heating methods draw on different physical processes to transport energy in the soil, and as a result each is particularly appropriate for certain site conditions. Steam flooding uses a hot fluid to carry heat into the subsurface. Steam follows high-permeability pathways through the subsurface, however, so it preferentially heats those paths and leaves the less conductive soil relatively cool. Thermal conduction creates the highest temperatures and is relatively insensitive to soil properties. Electrical resistance heating passes an electrical current through the soil, heating formations where the electrical current flow is the greatest. Electrical current flows through clays and silts more readily than through sand, so electrical resistance heating preferentially warms the clay-bearing horizons that are not swept or are poorly swept during steam injection.
All thermal methods rely on contaminant flow and transport in the gas phase. While control of the gas phase above the water table usually is not a problem, gas flows below the water table may be strongly dominated by buoyancy forces. In cases where high temperatures are required for DNAPL evaporation (above 100°C), the inflow of groundwater into the thermal treatment zone is potentially a problem. This could be a limiting factor in high-permeability aquifers unless barrier walls or other means are used to prevent such inflow.
Steam Flushing
Steam injection was first used for tertiary petroleum recovery in 1933 (White and Moss, 1983), and it is still widely used today, particularly for recovery of heavy oil from tar sands. Steam injection assists in recovery of viscous oils, primarily by reducing oil viscosity and allowing more effective displacement of oil toward recovery wells. In addition, production is increased by thermal swelling of oil, by steam distillation of light components of oil, by a gas drive resulting from the steam flush, and from a solvent dilution effect caused by the condensation of light ends in front of the steam zone (Butler, 1991). In recent years, steam injection has been identified as a promising technique for removing NAPL contaminants from the subsurface (Hunt et al., 1988), but has not yet been widely used on a commercial scale for remediation.
The groundwater remediation process differs from the petroleum recovery process in a number of ways. Essentially complete contaminant removal is required for groundwater remediation, rather than an incremental increase in oil recovery. Remobilization of NAPL leading to increased groundwater contamination is not an acceptable consequence of NAPL remediation. In addition, most NAPLs have viscosities near that of water, and many have relatively low boiling points. These factors must be considered when determining whether to remediate NAPL by steam injection.
Mechanisms of Steam Treatment
The mechanisms operative in steam flushing include volatilization of water and organic fluids, formation of a steam zone, and hydraulic displacement of organic compounds in front of the steam zone. The relative importance of these mechanisms depends on the nature of the organic compounds present and on the distribution of the compounds in the soil.
Volatilization of Organic Compounds. When steam is injected into soil, the steam initially condenses, giving up latent heat to raise the temperature of the soil and pore fluids. (Radio frequency heating or electrical resistance heating, discussed later, produce a similar in situ temperature increase.) As the temperature of the soil increases, the vapor pressures of the pore fluids are increased. In the vadose zone, increasing temperatures result in an increase in the vapor phase concentrations of water and of other liquids, such as organics, present in the soil. In liquid-saturated soil, a vapor phase is formed at a particular location when the sum of the vapor pressures of the liquid phases present exceeds the in situ liquid pressure. The efficiency of thermal remediation technologies for mobilizing a particular organic compound through the volatilization mechanism is thus a function of the compound’s vapor pressure.
Formation of a Steam Zone. When steam is injected continuously into the subsurface, it volatilizes water and organic compounds (distillation), and a steam zone is formed with a propagating condensation front. In the steam zone the amount of water remaining in the soil pores depends on the injected steam quality, temperature, and pressure. At the condensation front, a bank of condensed organic contaminant forms and moves ahead of the steam front toward a withdrawal well (see Figure 5-5). Although the organic compound may have originally been distributed at residual saturation levels and was thus immobile, the organic saturations in the bank will generally be above residual levels, and the organic bank will be mobile.
As the steam zone expands and the condensation front moves toward the extraction well, heat is transferred through the soil with fluid flow (convection) and also by conduction, as a result of temperature gradients. Heat conduction occurs in both the longitudinal and transverse directions with respect to the direction of flow. Since steam is much lighter than water, the steam zone tends to rise as it travels horizontally. This steam override, or gravity segregation, can be a significant problem in designing a steam injection program. In addition to the low density, steam also has a much lower viscosity than water, such that channeling can be a significant problem. Transverse heat conduction is an important mechanism in damping steam channeling in heterogeneous soils.
In the case of a mixture of low- and high-volatility NAPL, steam injection will result in preferential distillation of the more volatile compounds. These
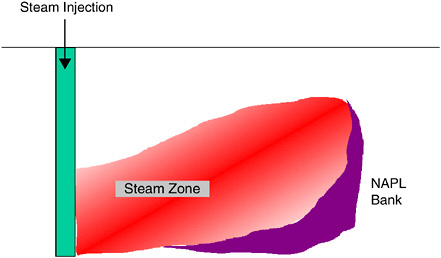
FIGURE 5-5 Steam zone and NAPL bank formation.
compounds will recondense at the front of the steam zone in the organic fluid bank. This will result in the formation of a bank of mobile organic fluid that moves ahead of the steam zone. This mobile bank will reunite stranded blobs and ganglia of NAPL and will produce a solvent drive effect. For example, in the case of a mixture of TCE and PCBs, the TCE will be preferentially stripped from the trapped blobs and ganglia and recondense in a bank at the front of the steam zone. This will result in a form of solvent drive, resulting in improved removal of the trapped PCBs as well as the TCE.
Hydraulic Displacement of Organic Fluids. Injection of hot water or steam can lead to hydraulic displacement of DNAPL due to the aqueous phase pressure gradients that develop. The extent of hydraulic displacement as an important mechanism during steam injection or hot water flooding depends on the DNAPL being displaced and on the nature of the porous medium, or fractures, in which the DNAPL was located. Organic fluids that are trapped as pools on low-permeability, fine-grained layers or in fractures may exist as a continuous phase at saturations above residual levels. In the case of organic fluids with low vapor pressures and high boiling points relative to steam injection temperatures, removal rates through distillation will be very low. For these fluids, such as heavy oils and PCBs, hydraulic displacement may be the major removal mechanism operative during steam injection. If the organic fluid exists in the soil at saturations above the residual level, then injection of steam will lead to hydraulic displacement of the organic ahead of the condensation front associated with the expanding steam
zone. The efficiency of this hydraulic displacement will depend on the reduction in organic phase viscosity that occurs as the temperature is increased, and on changes in residual saturation resulting from reductions in viscosity, reductions in interfacial tension, and changes in wettability. It has been found that increasing temperature leads to decreases in residual saturation in both consolidated sands (Sinnokrot et al., 1971) and unconsolidated sands (Poston et al., 1970). Thus, steam (or hot water) flooding would be expected to remove more organic fluid than water flooding at ambient aquifer temperatures.
A major concern in the displacement of viscous liquids by less viscous liquids is viscous channelling. The less viscous displacing fluid will tend to break through the more viscous in-place fluid in a few channels, resulting in very ineffective subsequent contaminant removal. The decrease in organic fluid viscosity that occurs with the increased temperatures associated with steam or hot water flooding or electrical heating may reduce the extent of fingering that might otherwise occur in an ambient temperature hydraulic displacement process. These decreases in viscosity and interfacial tension with steam injection would be expected to result in lower remaining residual saturations than would be expected after water flooding (Poston et al., 1970; Sinnokrot et al., 1971).
Steam injection would not normally be expected to provide much additional hydraulic displacement of trapped blobs and ganglia of organic fluids left by infiltrating organic fluid, or left by steam or water flooding. This is because organic and water viscosities both decrease as temperature increases. Organic–water interfacial tensions also decrease as temperature increases. PCE–water interfacial tensions decrease by about 10 percent as the temperature is increased from 10°C to 90°C (Ma and Sleep, 1997). The ratio of viscous to capillary forces is called the capillary number. NAPL trapped by capillary forces can be displaced hydraulically if the critical capillary number, a function of the fluids and the soil structure, is exceeded. Decreasing interfacial tensions increases capillary numbers, while decreasing water viscosity decreases capillary numbers. During steam injection where one might expect water to displace NAPL, the increase in temperature is likely to decrease the water viscosity more quickly than it decreases the interfacial tensions, so that overall, raising the temperature decreases the capillary number. Thus, steam injection does not lead to any direct enhancement of hydraulic displacement of residual NAPL. Some swelling of the DNAPL occurs on heating, but this does not result in significant DNAPL mobilization.
Hydrous Pyrolysis/Oxidation. At the elevated temperatures (100°C–140°C) associated with steam flushing, it has been claimed that hydrous pyrolysis and oxidation of contaminants is a significant destruction mechanism. Knauss et al. (1999) examined the aqueous oxidation of TCE over a temperature range of 20°C–100°C, and determined Arrhenius activation energies. From this analysis, they concluded that increasing temperatures from 20°C to 100°C would increase TCE oxidation rates by a factor of 3,000. However, oxidation rates are still lower
than those expected from reductive dehalogenation by anaerobic bacteria. At the Visalia field site, it was estimated that hydrous pyrolysis and oxidation accounted for 17 percent of the total removal of creosote from the subsurface, an estimate based on monitoring of carbon dioxide extracted from the subsurface (U.S. DOE, 2000).
Regardless of the operating mechanism, extraction wells are needed to recover fluids and vapors during steam flushing. In the vadose zone, vapor extraction wells may be used. In the saturated zone, the extraction wells will initially recover water, then a mixture of NAPL and water, and finally steam and organic vapors. The spacing of injection and extraction wells must be carefully chosen to ensure capture of displaced water and NAPL, steam, and organic vapors.
Overview of Case Studies
A variety of field-scale implementations of steam injection are summarized in Table 5-4. Many of these cases involved hydrocarbons, presumably present as LNAPL. Some of the cases involve mixtures of hydrocarbons and chlorinated solvents, but it is not clear whether the mixtures are LNAPL or DNAPL. The only reported case of steam flushing for chlorinated solvents is at the Savannah River Site, but no performance data are given. Two field-scale applications of steam flushing are described in Boxes 5-7 and 5-8. The field examples indicate that steam flushing can be very effective for removing VOCs from relatively homogeneous permeable soils. As contaminants become less volatile and soils become more heterogeneous or less permeable, the effectiveness of steam flushing decreases. There is limited field experience using steam flushing for DNAPLs located below the water table and for NAPLs in fractured rock and clay. In addition, the reported performance metrics for many of the case studies are based on mass removed rather than on mass remaining, reductions in dissolved contaminant concentrations, or contaminant fluxes—all of which are better indicators of treatment efficacy than is mass removed.
Applicability of the Technology
Contaminants. Steam injection is most effective, in comparison with other remediation techniques, for removing separate phase NAPL, rather than organic contaminants dissolved in the aqueous phase. Steam injection is equally suited to remediating petroleum and chlorinated hydrocarbons. The most important characteristic of the compound that should be determined is its vapor pressure over the temperature range typical of steam injection. Compounds with boiling points below that of water are readily vaporized by steam injection. As the compound’s vapor pressure decreases, the mole fraction of contaminant in the vapor phase decreases, and the removal rate from vaporization decreases proportionally. For
TABLE 5-4 Field Applications of Steam Flushing
|
Location |
Contaminants |
Hydrogeology |
Volume Treated |
Results |
|
Former Hazardous Waste Disposal Site, Muehlacker, Germany |
TCE; BTEX; Volatiles-halogenated; Volatiles-nonhalogenated. |
Highly heterogeneous, weathered sandy marl in the unsaturated zone. |
3,000 cubic meters, to 49 ft (15 m) bgs |
Ten months of steam injection; 2,500 kg of TCE removed, approximately 95% in gas phase, with the rest dissolved in H2O. |
|
Lawrence Livermore National Laboratory, Gasoline Spill Site, Livermore, CA |
BTEX; Petroleum hydrocarbons; Volatiles-nonhalogenated; Gasoline (likely free-phase). |
Layered system, sandy gravel and gravelly sand, clayey silts to silty clays, sandy to clayey gravels and gravelly to silty sands, etc. |
100,000 cubic yards (76,455 m3) |
Over 7,600 gallons (28,769 L) of gasoline removed, most as vapor over 10 weeks, conducted in phases over a 1-year period. |
|
Lemoore NAS, Lemoore, CA |
JP-5; Petroleum hydrocarbons; Volatiles-nonhalogenated. |
Sands and silts with hydraulic conductivity of 3.9 × 10⁻³ to 1.4 ×10⁻² cm/s. Water table at 4.9 m. |
|
190,000 gallons (719,228 L) recovered; final vadose zone concentration of 20–50 mg/kg total petroleum hydrocarbons (TPH) |
|
North Island NAS, San Diego, CA |
TCE; Petroleum hydrocarbons; Volatiles-halogenated; Volatiles-nonhalogenated; JP-5; Semivolatiles-nonhalogenated; LNAPL floating on groundwater |
Soil |
1,100 square yards (920 m2) |
28,600 lb (12,973 kg) removed, consisting of 14,600 lb (6,622 kg) of fuel hydrocarbons and TCE in liquid phase and 14,000 lb (6,350 kg) of TCE in vapor phase. |
|
Location |
Contaminants |
Hydrogeology |
Volume Treated |
Results |
|
Rainbow Disposal, Huntington Beach, CA |
Diesel Fuel; Petroleum hydrocarbons; Volatiles-nonhalogenated. |
Perched water to a depth of 40 ft (12 m) bgs; sand lens at 35–40 ft (10.6–12 m) bgs. |
15,000 square yards (12,542 m2) |
45,000 gallons (170,343 L) recovered; concentration reduced from 17,000 to 1,500 mg/kg (average). |
|
Savannah River Site, Aiken, SC |
PCE; TCE (mixed contaminants, DNAPL dominant); Volatiles-halogenated. |
Interbedded clay, silt, sand; target zone bounded by clay layers. |
100 ft (30 m) × 100 ft (30 m) on surface; to depth of 165 ft (50 m); PCE at depths of 20–165 ft (6–50m) bgs, above clay aquitard |
31,000 kg of contaminants were removed [30,000 kg of PCE (26%) and 1,000 kg of TCE (62%)]. Some removal attributed to hydrous pyrolysis, but was not quantified. |
|
Site 5, Alameda Point, Alameda, CA |
Volatiles-halogenated; TCE; Total extractable petroleum hydrocarbons (TEPH); Petroleum hydrocarbons; Volatiles-nonhalogenated. |
Sand to silty sand, silty clays interlayered with sands and silty sands. |
180 cubic yards (138 m3) of soil; 100–200 gallons (379–757L) of NAPL; LNAPL found at depths of 3–10 ft (0.9–3 m) bgs |
600 gallons (2,271 L) of NAPL removed (84% as separate phase with 242 kg TCE). Concentrations reduced “many orders of magnitude” during treatment; TCE in soil after treatment from below detection limits (ND) to 20 mg/kg. TCE in groundwater after treatment from ND to 295 mg/L. |
|
A.G. Communications Systems, Northlake, IL |
TCE; cis-1,2-DCE; xylene; benzene; Dissolved TCE concentration of 45,000 mg/L. |
Unsaturated and saturated zone, 330,000 cubic yards (252,303 m3). |
65 steam injection wells [39 screened at depth of 35 ft (11 m) bgs, 26 wells screened at 46 ft (14 m) bgs], 186 shallow SVE wells and 76 combination groundwater/vapor extraction wells (15 to 30 gpm) |
Average dissolved TCE concentrations reduced from 20,000 mg/L to 1,000 mg/L, reductions of 90% for TCE and DCE over two years. 33,000 lb (14,969 kg) of hydrocarbons removed. |
|
Visalia Pole Yard NPL Site, Visalia, CA |
Semivolatiles-nonhalogenated; Semivolatiles-halogenated; Polycyclic aromatic hydrocarbons (PAHs); Pesticides/herbicides; Creosote; Pentachlorophenol (PCP). |
Three distinct water-bearing zones. |
75–105 ft (23–32 m) bgs |
June 1997–June 1999, approximately 1,130,000 pounds (512,559 kg) of creosote removed or destroyed (50% removed as NAPL, 16% as vapors, 16% in aqueous phase, 17% destroyed by hydrous pyrolysis/ oxidation in situ). |
|
SOURCE: http://www.clu-in.org/products/thermal. EPA (2003). |
||||
|
BOX 5-7 At the Visalia pole storage yard, steam flushing was used to remediate creosote and pentachlorophenol. During 25 months of operation, a total of 1,130,000 lb (141,000 gal or 533,743 L) of creosote were removed or treated (10,400 lb/wk or 4,717 kg/wk). Approximately 50 percent of the contaminants were removed in free phase—16 percent removed as vapors, 16 percent removed in an aqueous phase, and 17 percent destroyed by hydrous pyrolysis in situ (U.S. DOE, 2000). However, there were no accurate estimates of pretreatment conditions, so the removal efficiency cannot be determined. Furthermore, none of the available reports on this site discuss the impact of the remediation on contaminant concentrations, mass fluxes, or other metrics that may have been of interest. |
|
BOX 5-8 Steam flushing was used at Site 5, Alameda Point, Alameda, California, to remediate a NAPL source in shallow fill soils. The NAPL source consisted of a mixture of petroleum hydrocarbons (diesel and motor oil) and TCE and was less dense than water. The site stratigraphy consisted of a surface sealed by asphalt and concrete slabs, 1.5 m of sandy silt fill, 2.5 m of fine silty sand, 0.2 m of clay, and 2–3 m of Bay mud. The water table was 1.7 m bgs. The steam flushing implementation consisted of six injection wells located around the outside of the source zone, and an extraction well located in the source zone. To prevent NAPL condensation below the cap, steam was first injected into the vadose zone for 10 days until hot vapors were recovered in the extraction well. Steam was subsequently injected into the vadose and saturated zones for 40 days. A total of 1,950 kg of organic liquid was recovered (83% as NAPL, the remainder as adsorbed material from water and vapors recovered) in the extraction well during the 40 days of steam flushing. The TCE was primarily in the gas leaving the last vapor/liquid separator (192 kg), with an additional 22 kg being recovered from the water phase and only 18 kg measured in recovered NAPL. VOC concentrations in the source area were reduced by two orders of magnitude, and soil concentrations of extractable hydrocarbons were reduced by an order of magnitude, with remaining compounds being mostly low-volatility compounds. Trace amounts of chlorinated compounds were found in the shallow soils just below the surface cap. Upon cooling, microbial populations in the treated soils rebounded. SOURCE: http://www.containment.fsu.edu/cd/content/pdf/511.pdf. |
compounds with very high boiling points, such as creosote and PCBs, viscosity lowering and hydraulic displacement may be the most significant removal modes operative in steam flushing.
Hydrogeology. The permeability and the degree of heterogeneity existing at a contaminated site will be important factors influencing the effectiveness of thermal technologies. As with most flushing technologies, very high pressure gradients are required to achieve reasonable rates of steam flow and subsequent contaminant removal from low-permeability soils. Butler (1991) recommends that steam injection not be used for petroleum recovery in formations with permeabilities below 10–13 m2. The use of hydraulic and pneumatic fracturing techniques is being considered to enhance the permeability of low-permeability soil such as massive clays. In some cases parallel planes of horizontal fractures are created. Steam is injected into some fractures, and heated fluids and gases are withdrawn from adjacent fractures.
In sites with substantial contrasts in permeabilities between soil layers, significant channelling of steam along the high-permeability layers will occur. This will lead to the bypassing of contaminants trapped in the low-permeability layers. Eventually the steam zone will expand into the lower-permeability layers through transverse heat conduction. Thus, the relative efficiency of steam injection in layered systems depends on the location of the NAPL, on the permeability contrasts in the system, on the relative thickness of the layers, and on the rates of transverse heat conduction.
Steam injection can be used to access contamination under buildings provided that there is no danger of steam and organic vapors entering the building. This is most likely if the soil zone to be cleaned is an adequate depth below the bottom of the building. Deeper source zones also experience fewer problems with steam short-circuiting through permeable soil layers that are usually placed below building foundations. The building must be small enough to allow adequate spacing of injection and extraction wells, unless angle drilling technologies are used. Pavement does not pose any special problems for steam injection, and can actually help avoid breakthrough of steam and organic vapors at the ground surface.
Steam injection can theoretically be used at any depth accessible by wells. It is used at depths as great as 900 meters for tertiary petroleum recovery.
Health, Safety, and Environmental Considerations. The steam injection process produces heated organic vapors, which in the case of some contaminants may lead to fire or explosion hazards. It is important to control the migration of the steam and organic vapors during the remediation of near-surface NAPL contamination to avoid steam breakthrough at unexpected locations in the ground surface.
When attempting to remove DNAPL from the subsurface using thermal methods, particular attention must be paid to the potential for increasing the
extent of DNAPL contamination (She and Sleep, 1999). The formation of a condensation bank of mobile DNAPL ahead of the steam zone may lead to vertical remobilization of DNAPL. It is also possible that DNAPL immobilized on fine-grained lenses could be displaced laterally off the lens by steam and could sink below the steam zone and cause contamination at deeper levels in the aquifer. Increases in temperature also decrease interfacial tensions and proportionately decrease entry pressures associated with fine-grained soil lenses. Steam injection programs must be designed so that vertical remobilization of DNAPL does not occur. This is usually accomplished by ensuring that the steam zone extends well below the source zone. When low-permeability layers are present at the bottom of the source zone, the use of electrical heating technologies may be required.
Potential for Meeting Goals
The expected effectiveness of steam flushing for meeting various objectives for different types of sites is summarized in Table 5-7. The entries in this table are based on available case studies and on the current understanding of the mechanisms of steam flushing. The most commonly reported performance metric for steam flushing from case studies is the amount of mass removed, as this is the easiest to measure. Removal of large amounts of mass would be expected to reduce source migration potential. Reductions in local aqueous phase concentration and contaminant mass fluxes would also be expected with reductions of mass, but the extent of these reductions would depend greatly on the hydrogeology, the initial mass present (which in many cases is not known), and the distribution of this mass. Decreases in local aqueous phase contaminant concentrations or reductions in contaminant mass fluxes do not appear to have been reported very frequently for steam flushing. Although hydrous pyrolysis has been reported as a process that may destroy some contaminants in situ at the elevated temperatures associated with steam flushing, there are no studies in which the extent of this process has been quantified from a rigorous mass balance on contaminants.
Despite these qualifications, for well-defined source zones consisting of volatile organic compounds in low-heterogeneity permeable soils, steam flushing has the potential for achieving substantial mass removal. This is expected to produce large decreases in contaminant concentrations in the treatment zone and large decreases in contaminant fluxes from the treatment zone. As soil permeability decreases, higher steam injection pressures are required to achieve the same rate of steam propagation through the soil. As the degree of heterogeneity increases, the efficiency of steam flushing decreases, with the steam channeling through high-permeability pathways. In this case, heat conduction from the steam channels to the lower-permeability zones will eventually lead to contaminant removal from these zones, but more steam, more energy for steam production, and more time will be required.
There is little laboratory or field experience with steam flushing in highly heterogeneous, low-permeability, or fractured media. However, it is clear that the risk of incomplete source removal increases with increasing subsurface heterogeneity, with the greatest risks for fractured media. In addition, as heterogeneity increases, the ability to predict and control steam movement in the subsurface decreases. Control of steam movement is important in avoiding undesired downward mobilization of DNAPLs.
Assessment of the success of steam flushing usually includes monitoring of in situ temperatures to ensure that elevated temperatures are reached throughout the source zone. As a significant amount of time (weeks) may be required for subsurface temperatures to decline to preflushing levels, temperatures and contaminant concentrations should be monitored for some time following the cessation of steam flushing.
Cost Drivers
Costs for a steam injection program may include a boiler for steam production, injection wells, extraction wells, vacuum extraction equipment, condenser equipment, and treatment trains for off-gas and condensate treatment. A source of feedwater for steam generation will be required, and a treatment system may be required for pretreatment of feedwater to remove dissolved solids and to prevent excessive scaling of the boiler tubes. In most cases the boiler would be fired by natural gas. The deeper the steam is injected, the greater the pressure and temperature of the steam must be, entailing higher energy costs for steam production as well as higher equipment costs. In the case of steam injection in the vadose zone, vacuum extraction is required to remove vapors, which necessitates the use of vapor extraction equipment. The vapors and condensate recovered from steam injection operations are normally passed through a condenser to condense water and organic vapors. The remaining noncondensible gas fraction will require treatment with activated carbon. The water and organic fractions of the condensate can be separated gravimetrically, with the water fraction requiring treatment to remove dissolved organics before disposal.
At the recovery wells associated with steam injection, heated organic fluids and water will be produced before steam breakthrough, and water and organic vapors will be produced after steam breakthrough. The produced fluids and condensed vapors may be separated into organic and water phases. The organic phase may be pure enough to be recycled. The water phase will be saturated with organic compounds and will require further treatment before it can be disposed of. The volume of water produced will be much lower than that produced by conventional pump-and-treat techniques since the recovery rates of DNAPL will be much higher with steam injection by virtue of the steam distillation removal mechanism.
The deeper the steam is injected, the greater must be the pressure and temperature of the steam, which entails higher costs for steam production as well as for equipment.
Technology-Specific Prediction Tools and Models
Several models of steam injection for petroleum recovery have been developed. Unfortunately, these models are not generally applicable to modeling DNAPL remediation by steam injection because most of the models neglect dissolution of organics in the water phase, and they neglect capillary pressures. Falta et al. (1992) described a one-dimensional model for simulation of steam injection in NAPL remediation. The model, which included three-phase flow and transport of a single-component organic phase, compared favorably with laboratory steam injection experiments conducted by Hunt et al. (1988). Sleep (1993) presented a three-dimensional three-phase multicomponent model for steam injection. Modeling steam injection is very difficult and computationally demanding due to the highly nonlinear nature of the equations of nonisothermal multiphase flow and transport, and it requires considerable modeling and numerical expertise. Determination of the parameters for the various constitutive relationships involved in these models—such as how capillary pressure, saturation, and permeability are functions of temperature (e.g., see She and Sleep, 1998)—is difficult and costly.
Research and Demonstration Needs
Little research has been conducted on the effectiveness of steam flushing in heterogeneous porous media, including fractured rock and clay. There is a need for further research in this area, including studies of NAPL displacement by hot water and steam flushing, of the impact of temperature on sorption processes, of mass transfer rates in heterogeneous systems, of the role of hydrous pyrolysis for various contaminants, of the potential for DNAPL remobilization in complex subsurface environments, and of the effect of elevated temperatures on soil properties and microbial activity (Richardson et al., 2002).
Conductive Heating
Conductive heating, sometimes referred to as thermal conduction heating or in situ thermal desorption (ISTD), refers to the warming of the subsurface by heat conduction from electrical heating elements. Two configurations of heating elements have been used for conductive heating—thermal blankets and thermal wells (Stegemeier and Vinegar, 2001). Thermal blankets typically consist of a wire mesh woven into a ceramic cloth and may be as large as 2.4 m by 6 m. The thermal blankets are usually covered with 5–30 cm of insulation to minimize heat loss to the atmosphere. An impermeable layer placed above the insulation pro-
vides a surface seal to allow the application of a vacuum below the heater blanket to capture volatilized contaminants. Application of current to the thermal blankets increases the temperature of the blanket to as high as 800°C or 900°C. Heating of the subsurface is produced by radiation and conduction of heat downward from the thermal blankets. Because of their placement, thermal blankets are limited to shallow applications (< 1 m).
Thermal wells are used for contamination at depths greater than 1 meter. The thermal wells, oriented vertically, contain heater elements consisting of nichrome wires in ceramic insulators. As with thermal blankets, application of current to the heating elements heats the thermal wells to temperatures approaching 900°C, leading to heating of the adjacent subsurface region through heat conduction. The rate of heat transfer, or heat flux, during heat conduction is proportional to the temperature gradient in the soil according to Fourier’s law of heat conduction. Water near the heaters may be vaporized, and the resulting steam will cause some convective heat transfer into the formation until all of the soil becomes dry. Thermal wells may be configured with heating elements only, or they may be configured so that a vacuum can be applied to the well to withdraw vapors and liquids from the subsurface (Stegemeier and Vinegar, 2001).
Temperatures in the vicinity of a thermal well will depend on the power of the heating element, the radiant heat transfer between the element and the soil, the thermal conductivity and the heat capacity of the soil, and the distance to neighboring heaters. The heating rate increases with thermal conductivity and decreases with heat capacity of the heated material. Both of these quantities depend on water content, but they are relatively insensitive to grain size or mineral content. As a result, temperature changes resulting from conductive heating will be relatively independent of the type of soil or rock being heated. Moreover, the change in temperature will be relatively uniform even in formations that are heterogeneous, such as interbedded sands and clays or fractured rock. At high temperatures achievable with conductive heating, soil near the heaters may become desiccated, allowing even tight clays to become permeable enough for adequate vapor extraction.
When the subsurface temperature adjacent to thermal wells or thermal blankets is raised by conductive heating, vapor pressures of water and contaminants are increased until boiling of the water and contaminants occurs. When boiling occurs there may be a significant increase in pressure due to the expansion associated with phase change from liquid to gas. This can produce a flow of gases and liquids away from the heat source, leading to convective heat transfer. In the case of thermal blankets, the movement of gases and liquids is usually controlled by application of a vacuum below the blanket. In the case of remediation using thermal wells, a vacuum is usually applied at a subset of the thermal wells in order to capture the vapors and liquids. Thus, the effectiveness of conductive heating depends particularly on the ability to recover vaporized water and contaminants produced by heating.
As conductive heating can produce very high temperatures near the heating elements, it is capable of volatilizing even very high boiling point compounds such as PCBs. The high temperatures will also accelerate desorption of contaminants from soils. Furthermore, at these high temperatures, organic contaminants may be subject to oxidation or pyrolysis (Stegemeier and Vinegar, 2001). In order to reach temperatures high enough to effectively remove PCBs (approximately 500°C), all water in the soil must be boiled off. In some cases the inflow of water into the heated area may be great enough that temperatures cannot be raised much above 100°C, severely limiting the effectiveness for low-volatility contaminants. In addition, very close well spacing (1.5–2 meters) is required to achieve adequate heating. For more volatile compounds, such as PCE and TCE, it is not necessary to reach temperatures above 100°C, and less energy input and more distantly spaced wells may be sufficient.
Overview of Case Studies
Laboratory treatability studies and field project experience at seven ISTD sites, summarized in Table 5-5, have confirmed that elevated temperatures applied over a period of time result in significant destruction and removal of even high boiling point contaminants such as PCBs, pesticides, PAHs, and other heavy hydrocarbons.
The effects of heating by conduction are illustrated by an example of the desiccation form of the ISTD process where 12 thermal wells were used to heat PCB-contaminated soil at Cape Giradeau, Missouri (Vinegar et al., 1998). An array of 14 temperature monitoring wells with thermocouples spaced every 0.3 m with depth was used to determine heating effectiveness. The process was operated for 42 days, and there were three distinct periods of heating. Temperatures increased from ambient conditions to 100°C as the soil and water were heated during the first nine days of the project. Boiling of pore water occurred throughout the region for the next 12–16 days, during which temperatures remained around 100°C. The temperatures increased again between days 22 and 26, after liquid water was removed completely, leaving desiccated soil throughout the treatment zone. Temperatures increased to more than 400°C during the last two weeks of the project.
Applicability of the Technology
Contaminants. Conductive heating can be used for a wide range of organic contaminants, ranging from volatile organics such as the chlorinated ethenes to low-volatility compounds such as PCBs. One of the advantages of conductive heating compared to other thermal remediation methods is the capability of generating the high subsurface temperatures conducive to the removal of very low volatility compounds. As the volatility of the contaminants decreases,
TABLE 5-5 Summary of ISTD Field Results
|
Location |
Treatment Zone |
Treatment Method |
Contaminant |
Initial Concentration |
Final Concentration |
|
Cape Girardeau, MO |
Vadose zone, treated to depth of 12 ft (3.7 m) bgs, weathered and unweathered loess |
Thermal blanket for upper 1.5 ft (0.5 m), and 12 heater wells [to 12 ft (3.7 m) bgs on 5-ft (1.5 m) centers], 10–45 days of heating. |
PCB 1260 |
20,000 ppm |
< 0.033 ppm |
|
Vallejo, CA |
Vadose zone, 500 ft2 (46 m2) area, treated to depth of 12 ft (3.7 m) bgs |
Thermal blanket for upper 1 ft (0.3 m), and 14 heater wells [to 14 ft (4.3 m) bgs], 10–45 days of heating. |
PCB 1254/1260 |
2,200 ppm |
< 0.033 ppm |
|
Portland, IN |
Vadose zone, silty clay soil |
130 heater wells on 7.5-ft (2.3-m) centers, to depth of 19 ft (5.8 m) bgs, 9 weeks of treatment. |
1,1-DCE PCE TCE |
0.65 ppm 3,500 ppm 79 ppm |
0.053 ppm < 0.5 ppm 0.02 ppm |
|
Eugene, OR |
Vadose zone, gravel [1–4 ft (0.3–1.2 m) bgs], silt [11–16 ft (3.4–4.9 m) bgs], gravel/sand/clay (below silt) |
277 vacuum/heater wells and 484 heater-only wells [7 ft (2.1 m) centers to 10–12 ft (3–3.7 m) bgs] within and outside a building and adjacent to residences. |
Benzene Gasoline Diesel |
33 ppm 3,500 ppm 9,300 ppm + free product |
< 0.044 ppm 250,000 lb (113,398 kg) free product removed |
|
Ferndale, CA |
Vadose zone, 40 × 30 × 15 ft (12 × 9.1 × 4.6 m) deep, silty and clayey colluvial soils |
Heater-only and vacuum/heater wells in hexagonal pattern, with 6-ft (1.8-m) spacing. |
PCB 1254 |
800 ppm |
< 0.17 ppm |
|
SOURCE: Stegemeier and Vinegar (2001). |
|||||
increasingly higher subsurface temperatures must be reached, requiring closer well spacing, limited water inflow, and greater energy inputs.
Hydrogeology. Conductive heating has the potential to be effective over a fairly wide range of geologic conditions, including saturated zones. Thermal wells have no depth limitations other than those of typical well drilling. However, most applications of conductive heating to date have been in the vadose zone. For contamination in the saturated zone, water recharge can be a concern if it is necessary to desiccate the soil to achieve high temperatures, since much more heat is required to boil large quantities of water. More experience is needed to better evaluate the potential of conductive heating in saturated zones and to develop methods of stopping or minimizing water recharge, if necessary. In addition, the extent to which subsurface heterogeneity impacts the ability to capture vapors and control contaminant migration needs to be further explored. This method will be infeasible at some sites, however, where sensitive structures at the ground surface preclude the installation of either thermal wells or blankets.
Health, Safety, and Environmental Considerations. Conductive heating involves the use of large quantities of electric power and produces high temperatures, requiring very stringent safety measures. The potential for underground fires is not expected to be significant. Studies indicate that the formation of dioxins and furans in the soil is not significant (Stegemeier and Vinegar, 2001). Stack gas testing is required to ensure that hazardous gas emissions do not occur. At most sites recovered gas streams are further treated with thermal oxidizers and carbon adsorbers. The presence of buried drums in the vicinity of the source zone would be problematic, as the high temperatures may cause explosion of these drums; measures should be taken to ensure that sealed drums are not present in the treatment area.
The migration of contaminants away from the treatment area due to pressure increases associated with heating and liquid vaporization is controlled through the application of a vacuum at thermal wells. If complete capture is not achieved, there is potential for outward spread of contaminant vapors and contaminated water and for downward mobilization of DNAPLs. As soil heterogeneity increases, achievement of complete capture could be more problematic.
Potential for Meeting Goals
Conductive heating is a very aggressive technology, typically involving close well spacing, high energy inputs, and high subsurface temperatures. Most applications have been in the vadose zone for removal of low-volatility contaminants. Under these conditions for almost any type of geology, it would be expected to be very effective at mass removal and at achieving reductions in contaminant concentrations, fluxes, and source migration potential.
There is limited field experience applying conductive heating below the water table. If water inflow can be limited, then conductive heating would be expected to be effective in all granular media. However, achieving adequate capture of vapors and liquids and limiting water inflow may be more difficult as heterogeneity increases. There is no experience with conductive heating in saturated fractured media or karst. As control of water inflow may be problematic in fractured media and karst, and capture of contaminants may be difficult, effectiveness is expected to be limited in these settings.
Assessment of the success of conductive heating usually includes monitoring of in situ temperatures to ensure that design temperatures are reached throughout the source zone. As a significant amount of time (weeks) may be required for subsurface temperatures to decline to pretreatment levels, temperatures and contaminant concentrations should be monitored for some time following the cessation of heating.
Cost Drivers
Costs for conductive heating include the costs of thermal blankets or thermal wells, temperature monitoring, vacuum extraction equipment, treatment trains for off-gas and condensate treatment, and electrical power for heating. As very close well spacing is typically used, well installation costs will increase significantly as the depth to the source zone increases. As contaminant volatility decreases, higher temperatures must be generated, increasing power input requirements. Similarly, if there is significant water inflow, energy consumption increases.
Technology-Specific Prediction Tools and Models
Subsurface heating due to conductive heating can be simulated with simple models when phase change and fluid flow do not significantly impact subsurface heating. Comprehensive modeling of conductive heating, including phase change in a multiphase (gas–water–NAPL) system is a complex nonlinear process and requires the use of sophisticated numerical models such as those of Falta et al. (1992). Elliott et al. (2004) used a multiphase flow and transport simulator to investigate the design of conductive heating in the saturated zone.
Research and Demonstration Needs
Compared to many other remediation technologies, there is very limited experience with conductive heating, and very little has been published in the refereed scientific and engineering literature. In particular, there has been little application of conductive heating below the water table. Little is known about the permeability increases that occur when low-permeability soils are desiccated by
heating, and there has been no significant evaluation of the potential for increased contaminant spreading due to application of conductive heating.
Electrical Resistance Heating
Electrical resistance heating (ERH) was originally developed as an enhanced oil recovery technique (Harvey et al., 1979; Wattenbarger and McDougal, 1988). In recent years it has been proposed as a method for remediation of subsurface contamination (Buettner et al., 1992; Gauglitz et al., 1994; McGee et al., 1994). Application of ERH at a site involves installation of electrodes into the ground in hexagonal or triangular arrays. Typically, three-phase or six-phase electricity is applied to the electrodes. The resulting electric field set-up results in heating of the subsurface. The heating rate is equivalent to the power dissipated in the subsurface, so heating will be greatest where the current flow is greatest (McGee et al., 1994). The applied voltage, rather than the current, is adjusted in the field to produce the current that is needed to induce resistive heating at whatever rate is required. Electrical resistance heating can raise the temperature of the subsurface to the boiling point of water, which creates an in situ source of steam to strip contaminants from the subsurface. As the contaminants are converted to vapors, they are captured and removed using soil vapor extraction, which is applied at the electrodes and through additional wells in the vadose zone.
The ability to produce steam in situ between electrodes can produce a more uniform distribution of temperatures than steam flooding and conductive heating, where heat moves outward from wells. The configuration of electrodes is critical to creating a uniform distribution of heat. The six-phase configuration uses six metal electrodes placed in a circle around a central neutral electrode (Gauglitz et al., 1994). The six metal electrodes are connected in a spatially phase-sequenced pattern so that each electrode conducts to every other electrode in the array—a configuration that can produce a fairly uniform heating pattern. Electrical resistance heating can also be employed using three-phase heating or even by using a single phase. The most commonly employed configuration of electrical resistance heating for treatment of large areas is three-phase heating, in which each of the electrodes of a repeating triangular pattern is wired to one of three phases (McGee et al., 2000).
Because electrical conductivities of soils vary much less than soil permeabilities, ERH is able to produce more uniform heating of heterogeneous soils than steam flushing. In particular, low-permeability clay layers may be preferentially heated due to the presence of ions in clay that increase the current flow and thus increase the heat deposition in the clay zones. However, as soils dry out due to conversion of liquid water to steam, the electrical conductivity decreases. Thus, it is necessary to retain some liquid water in the soil to maintain conduction of current and heating (McGee et al., 2000). For this reason, in contrast to conductive heating, ERH is limited to temperatures in the 100°C range (depending on depth). Dry-out
around electrodes and electrode overheating are particular problems that are usually dealt with through the use of a water drip at the electrodes.
Overview of Case Studies
A number of case studies of ERH application for source zone remediation are summarized in Table 5-6. Most of these applications are for shallow contamination by volatile chlorinated solvents with soil types ranging from sands to clays. 6-phase heating is more common than 3-phase heating, most likely due to vendor specialization rather than to technical considerations. Remedial objectives, which were not reached at two of the sites, ranged from removal of contaminant mass (e.g., Cape Canaveral, Portland) to reductions in soil and groundwater contaminant levels. At all sites it is not clear whether posttreatment contaminant concentration rebound occurred. Many of the applications were plagued by problems with electrodes and by inadequate heating.
Applicability of the Technology
Contaminants. The primary means of contaminant removal with ERH is through volatilization and recovery by soil vapor extraction. As it is necessary to maintain liquid water in the soil to allow current conduction, ERH temperatures are limited to the boiling point of water (McGee et al., 2000), which limits the effectiveness of ERH to volatile contaminants (boiling points below 150°C), similar to steam flushing. As contaminant volatility decreases, removal rates will decrease correspondingly, and the risks of DNAPL remobilization increase.
Hydrogeology. Most applications of ERH have been to unsaturated and shallow saturated zones, although there are no technical limitations to how deep electrodes can be placed. Although ERH shows promise for removal of contaminants from low-permeability clays due to the preferential heating of these electrically conductive soils, there has been limited application of ERH to these soils. In particular, the difficulties with contaminant vapor recovery in low-permeability soils and the consequences for SVE well spacing have not been very thoroughly investigated. ERH has the potential to be more effective than steam flushing in moderately heterogeneous soils due to more uniform heating than is possible with steam flushing. In addition, through control of the power supplied to electrodes, it is possible to focus the heating to make efficient use of energy input. There have not been any applications of ERH in fractured rock or karst systems. ERH is not expected to be particularly effective for these settings due to the low conductivity of low-porosity rocks and the difficulty in maintaining control of fluid migration.
Health, Safety, and Environmental Considerations. The ERH process involves high-voltage electrical systems, requiring extensive safety precautions
TABLE 5-6 Case Studies Using Electrical Resistance Heating
|
Location |
Media and Contaminants |
Application Method |
Results |
|
Savannah River, GA |
Dissolved PCE and TCE (100–200 ppm) in a 10-ft (3-m)-thick clay layer 40 ft (12 m) bgs. |
6-phase ERH. Electrodes placed in 30-ft (9.1-m)-diameter circle, 25 days of heating. |
100°C reached in 10 days. After 25 days, 99.99% removal of contaminants in treatment zone. (EPA, 1995a) |
|
Avery Dennison Site, Waukegan, IL |
Methylene chloride (MeCl) source (16,000 yd3 or 12,233 m3) in the vadose zone. |
6-phase ERH. 20 treatment cells with perimeter electrodes to a depth of 24 ft (7.3 m). Total of 95 copper electrodes, including 6 installed below an active street and 16 installed inside the existing building. Treatment goals: 24 mg/kg MeCl in soil. |
After four weeks of operation, there was inadequate heating due to electrode deterioration. 1-inch (2.5-cm) galvanized steel pipes were installed around each electrode. Concentrations of MeCl were reduced to below the treatment goals (24 mg/kg in soil) after 5 months, except for 4 treatment cells. Addition of extra galvanized steel pipe electrodes and another month of operation met remedial goals. Average MeCl concentrations in soil were reduced to 2.51 mg/kg. (EPA, 2003) |
|
Skokie, IL, Site |
TCE (130 mg/L maximum; 54.4 mg/L average), TCA (150 mg/L maximum; 52.3 mg/L average), and DCE (160 mg/L maximum; 37.6 mg/L average). DNAPL present. Heterogeneous silty sands with clay lenses to 18 ft (5.5 m) bgs (10–5–10–4 cm/s); underlain by dense clay till aquitard (10–8 cm/s). Depth to groundwater 7 ft (2.1 m) bgs. |
6-phase ERH. ERH (13.8 kV local service at 1,250 kW) combined with soil vapor extraction. Tier III remedial goals were TCE (17.5 mg/L); TCA (8.85 mg/L); and DCE (35.5 mg/L). 23,100 cubic yards (17,661 m3) treated in 6 months. Additional 11,500 cubic yards (8,792 m3) treated. |
In five to six months of operation, Tier III cleanup goals were achieved for TCE, TCA, and DCE in all wells in the initial area of contamination. Average groundwater concentrations reduced by more than 99% for TCE (54.4 mg/L to 0.4 mg/L); more than 99% for TCA (52.3 mg/L to 0.2 mg/L), and more than 97% for DCE (37.6 mg/L to 0.8 mg/L). (EPA, 2000) |
|
ICN Pharmaceuticals Incorporated Site, Portland, OR |
TCE, cis-1,2-DCE, and VC. DNAPL suspected based on presence of contaminants in groundwater at >1% of solubility. Source zone (saturated and unsaturated) of 48,000–65,000 yd3 (36,699–49,696 m3) at a depth of 40 ft (12 m). |
6-phase ERH. 60 electrodes (hexagonal arrays of 6 electrodes each, with a 7th neutral electrode in the middle of each array) ` directing power to 3 zones: 20–30 ft (6–9 m) bgs, 34–44 ft (10–13 m) bgs, and 48–58 ft (15–18 m) bgs. Initial heating limited to bottom interval to create a hot floor to prevent downward contaminant migration. 53 vapor extraction wells installed in unsaturated region above heated region (5–10 ft or 1.5–3 m bgs). Remedial objectives: prevent and contain migration of separate-phase DNAPL during treatment and reduce contaminant groundwater concentrations to levels that indicate DNAPL has been removed or treated. |
System expanded after steam and hot water outside treatment area. As of December 2001, maximum groundwater contaminant concentrations in one layer had been reduced to 100 µg/L for TCE, 1,300 µg/L for DCE, and 50 µg/L for VC with concentrations above Oregon MCLs as of June 2002. In another, lower layer, concentrations of VC were reduced, but concentrations of DCE and benzene increased as a result of a possible compromise in the well casings; these wells were abandoned in April 2002 because dissolved phase VOCs remained above the Department of Environmental Quality’s generic risk-based screening levels at various locations at the site. (EPA, 2003) |
|
Poleline Road Disposal Area, Arrays 4, 5, and 6, Fort Richardson, AK |
Soil: PCE - 120 mg/kg; TCE - 640 mg/kg. Pentachloroethane (PCA) -12,000 mg/kg. Groundwater: PCE - 0.30 mg/L; TCE - 7.8 mg/L; PCA - 18 mg/L. DNAPL present. 7,300 yd3 (5,581 m3) treatment area 36 ft (11 m) deep. |
6-phase ERH. Electrode arrays (7 electrodes installed to a depth of 38 ft or 11.6 m), three SVE wells installed in each of 3 phases. Remedial goals: PCE - 0.005 mg/L groundwater, 4 mg/kg soil; TCE - 0.005 mg/L groundwater, 0.015 mg/kg soil; PCA - 0.052 mg/L groundwater and 0.1 mg/kg soil. |
Estimated mass of PCE, TCE, and PCA removed in the off-gas was 1,385 lb (628 kg)
|
|
Location |
Media and Contaminants |
Application Method |
Results |
|
Launch Complex 34, Cape Canaveral Air Force Station, FL |
TCE - Estimated mass of 11,313 kg in test plot, with 10,490 kg as DNAPL. Source zone test plot was 75 ft by 50 ft by 45 ft (23 m by 15 m by 14 m) deep. |
6-phase ERH. 13 electrodes, each with two conductive intervals [25–30 ft (7.6–9 m) bgs and 38–45 ft (11.6–13.7 m) bgs]. Lower heating interval configured to provide a hot floor. 12 SVE wells installed with 2-ft (0.6-m) screens to depth of 4–6 ft (1.2–1.8 m) bgs. Remedial objective of 90% TCE mass removal. |
Excessive rainfall from a hurricane caused water table rise, resulting in insufficient heating of the shallow portion of the test plot. Ground rods were installed near the electrodes to heat the 5–10 ft (1.5–3 m) bgs interval. TCE and DNAPL in the soil in the test plot were reduced by 90% and 97%, respectively. Heating was more efficient in deeper portion of the aquifer. Sampling hot cores of soil (90°C) may have resulted in some losses of chlorinated VOCs. (EPA, 2003). |
|
Navy Base in Charleston, SC |
Total VOCs (PCE, TCE, cis-DCE) in groundwater of 70,000 mg/l in silty sand with a thin clay layer at approximately 10 ft (3 m) bgs. Groundwater at 5 ft (1.5 m) bgs. Treatment area of 18,000 ft2 (1,672 m2), volume of 8,000 yd3 (6,116 m3). |
90 electrodes and co-located vapor recovery (VR) wells. The cleanup objective was to reduce the total chlorinated VOCs (CVOCs) in groundwater by an average of 95%. Heated interval was from 2 to 11 ft (0.6–3.4 m) bgs, 1 ft (0.3 m) into the clay layer. |
After 9 months of ERH operations, average total CVOC concentrations in groundwater reduced by approximately 86%. (Source: Thermal Remediation Services), http://www.thermalrs.com/TRSPages/Projects/CProj3NavalBase.html#) |
|
Lowry Landfill, Aurora, CO |
PCE DNAPL and xylene LNAPL in landfill waste pit. Large amount of metallic debris in the form of buried 55-gallon drums and miscellaneous metal including automobile bodies and mattress springs. Also wood debris, car tires, and municipal waste in the landfill. A plenum consisting of a layer of gravel covered by a clay cap is at the surface. Soil lithology consists of clay, silt, sand, and bedrock with groundwater at about 20 ft (6 m) bgs. |
ERH combined with multiphase extraction. 107 electrodes, 7 multiphase extraction wells. Performance criteria: heat treatment zone to an average 90°C for 120 days, maintain vapor capture and control of ambient air emissions, and reduce xylene concentrations by 90%. The heating interval was to be 9 ft (2.7 m) and 24 ft (7.3 m) bgs, with hot floor in the lower heated interval and sweeping the heat up toward the top of the interval in two phases, capturing vapors, steam, and liquids at the surface. |
After four months of ERH and multiphase extraction operations, treatment zone temperature was > 75°C. 15,000 kg of total VOCs were recovered (70% average reduction). 4,000 kg of total xylenes were recovered (80% average reduction). 2,500,000 kW-hrs of electricity input. (Source: Thermal Remediation Services) |
|
Air Force Plant 4, Fort Worth, TX |
TCE 95 mg/L in groundwater and 91 mg/kg in heterogeneous interbedded silt, clay, gravel under building. |
ERH and SVE. 60 electrodes and co-located vapor recovery wells covering an area of about 0.5 acre (0.2 hectares) inside a building. Remediation objective: 90% reduction of TCE in groundwater and soil. |
Soil temperatures in 60°C–90°C range. Final average TCE concentration in soil was 391 µg/kg. TCE concentrations in groundwater reduced by an average 93%. |
|
Chicago, IL |
PCE, at maximum of 13,600 mg/kg and average of 5,424 mg/kg in silt and clay under building. |
ERH and SVE. 17 electrodes, vertical and horizontal vapor recovery wells. Cleanup objective: 529 mg PCE/kg in soil. |
77% to 99.6% reduction in PCE in soil, all below cleanup goals. |
and specialized expertise for design and operation. The heating process produces heated organic vapors, which in the case of some contaminants could lead to fire or explosion hazards. It is important to control the migration of the steam and organic vapors in the remediation of near-surface NAPL contamination to avoid steam breakthrough at unexpected locations in the ground surface. As with steam flushing, attention must be paid to the potential for increasing the extent of DNAPL contamination (She and Sleep, 1999). With the ability to focus heating with ERH, hot floors below the source zones have been created to volatilize and capture any vertically remobilized DNAPL. The effectiveness of this strategy has not been very widely investigated for the range of contaminants and site conditions that could be encountered.
Potential for Meeting Goals
At ERH sites, measures of remedial effectiveness have typically been contaminant mass removal or groundwater or soil contaminant concentrations in the treatment zone. The monitoring of decreases in aqueous phase contaminant concentration and of reductions in contaminant mass flux does not appear to have been reported very frequently for ERH. For volatile DNAPLs, ERH has the potential to remove significant quantities of mass from unconsolidated media. The relatively small variation in subsurface electrical conductivities, compared to soil permeabilities, can produce more uniform heating than steam flushing, and ERH therefore has the greater potential to remove contaminants from heterogeneous soils, provided vaporized contaminants can be captured. As soil permeability decreases, steam zone expansion and recovery of vaporized contaminants will become more difficult, increasing remediation times and potentially reducing effectiveness. In highly permeable soils, influx of water may lead to problems in attaining target temperatures, thereby limiting effectiveness of mass removal.
Characterization of the subsurface and of the DNAPL distribution is required for effective design and implementation of ERH at a site. Problems with ERH typically have occurred due to electrode corrosion or poor design of the ERH system, resulting in inadequate or uneven heating. Buried metal objects can also distort heating patterns. Although hydrous pyrolysis has been reported as a process that may destroy some contaminants in situ at the elevated temperatures associated with ERH, there are no studies in which the extent of this process has been quantified from a rigorous mass balance on contaminants.
There is limited experience with ERH in fractured media, particularly consolidated media. The difficulties of installation of electrodes in consolidated media, and the low water contents and therefore low electrical conductivities of many consolidated media, would be problematic. There has not been any application of ERH in karst media. Given the difficulty in characterizing karst and of installing an ERH system in karst, ERH has little potential in such a hydrogeologic setting.
Assessment of the success of ERH usually includes monitoring of in situ temperatures to ensure that steam temperatures are reached throughout the source zone and monitoring of vapor composition in the SVE system. Monitoring should include subsurface gases or water pressures to ensure adequate contaminant capture. Provision of adequate drip water at electrodes to prevent soil desiccation around the electrodes and monitoring of electrodes to ensure there is no overheating are required. A significant amount of time (weeks) may be required for subsurface temperatures to decline to preflushing levels, so temperatures and contaminant concentrations should be monitored for some time following the cessation of ERH.
Cost Drivers
The costs for ERH are associated with the elements of the electrical system (electrodes, electrical network, power controls), SVE system, electrode and SVE well installation, power provision, and off-gas treatment.
Technology-Specific Prediction Tools and Models
Prediction of ERH processes requires modeling of current flow and the resulting heat generation in situ. This requires knowledge of both electrical and hydraulic soil properties and of how these properties change as steam forms and as moisture content changes. There have been some publications in the petroleum industry of simplified models for modeling current flow from ERH application, based on assumptions of constant electrical and hydraulic properties (Vermuelen et al., 1979; Vinsome et al., 1994). There are no published applications of these models for DNAPL remediation. In order to be comprehensive, these ERH models should be coupled to thermal models such as those of Falta et al. (1992).
Research and Demonstration Needs
There have been very few refereed journal publications on the ERH process. The variability of soil heating due to variations in soil types and to changes in water content needs to be investigated. The potential for microcrack formation of low-permeability materials during heating has been anecdotally reported but never fully analyzed. The effectiveness of vapor and liquid recovery with ERH in heterogeneous soils also should be studied. There is a need for laboratory and field studies of ERH in fractured rock to evaluate its potential effectiveness. Improved modeling capability is also needed, particularly the capability to predict changes in heating as a result of changes in moisture content.
BIOLOGICAL TECHNOLOGIES
The final two source remediation technologies either directly or indirectly invoke biological processes to degrade contaminants in situ. Air sparging accomplishes contaminant removal primarily by stripping volatile compounds from the subsurface while simultaneously supporting in situ biodegradation of contaminants. Enhanced bioremediation refers to any in situ treatment in which chemicals are introduced into the subsurface with the goal of stimulating microorganisms that can degrade or transform the contaminants of concern.
Air Sparging
Air sparging is an in situ remedial technology for volatile solvents that utilizes injection wells to pump air below the water table, stripping contaminants from the dissolved, sorbed, and nonaqueous phases by volatilization. Commonly, contaminant-laden air is simultaneously extracted from the unsaturated zone in a process equivalent to soil vapor extraction. Although the primary removal mechanism for this technology is physical, the introduction of oxygen into the contaminated zone associated with the injection of air often promotes substantial removal of contaminants by biodegradation in both the saturated and unsaturated zones of the aquifer (EPA, 1995b). This technology is also sometimes referred to as in situ air stripping or in situ volatilization. It must be followed by capture and treatment of the waste vapor stream. Air sparging is less aggressive than chemical transformation or thermal treatment options, and may be especially suitable for pairing with bioremediation options. It is considered a mature technology when it is applied to dissolved contaminants and innovative when it is applied to source zones.
Air sparging is based upon the principle that injected air moving through saturated porous media will volatilize contaminants that are present in NAPLs, dissolved in the aqueous phase, and sorbed onto solids (Figure 5-6). Partitioning of contaminants into the vapor phase is a complex function of vapor pressures, Henry’s Law constants, and sorption equilibrium constants (NRC, 1999). Understanding how injected air is distributed within the aquifer and how this affects partitioning of contaminants is critical to the success of this technology. A large number of flow visualization and characterization studies have been conducted to improve our understanding of air distribution in saturated porous media. The effects of flow rate, injection pressure, and pulsing schemes have been studied in laboratory and field studies (summarized in Johnson et al., 2001). Consensus is that (1) air flow is irregular in shape and is sensitive to very subtle changes in soil structure (see Figure 5-7), (2) increased airflow rates generally produce more dense flow field patterns, (3) vertical wells in homogeneous soils generally result in an airflow distribution radius of less than 3 m, and (4) heterogeneous soils may have either a positive or negative effect on air distribution. Contaminant removal
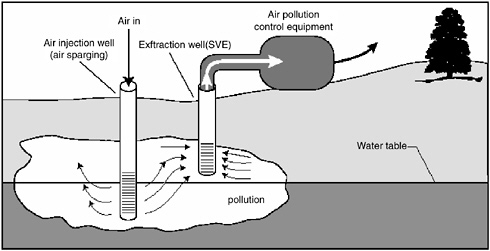
FIGURE 5-6 Typical application of in situ air sparging coupled with soil vapor extraction. SOURCE: EPA (2001).
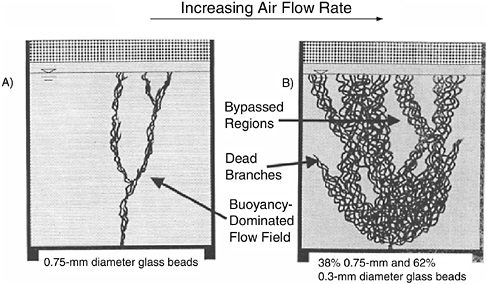
FIGURE 5-7 Effects of flow rate and grain size on channelization produced by air injected into saturated porous media. Panels (A) and (B) show columns packed with different grains sizes and experiencing different air flow rates. SOURCE: Reprinted, with permission, from Ji et al. (1993). © 1993 National Ground Water Association.
during air sparging is initially dominated (over a timeframe of months) by volatilization into the discrete air channels generated by the injection wells. Subsequently, contaminant removal is controlled by mass transfer through the liquid phase surrounding the air channels (Leeson et al., 2002). Biodegradation may also play a role in subsequent removal; however, for most chlorinated solvents aerobic biodegradation will not be a significant removal process.
Overview of Case Studies
To date, air sparging has been chosen as a component of remediation strategies at 48 Superfund sites (EPA, 2001). Fluor Daniel GTI compiled information on 32 field applications of air sparging to remediate chlorinated solvents or petroleum hydrocarbons (Brown, 1998). Of these 32, four were designed to treat dissolved contaminants alone, while the remainder were designed to address source areas. Seven of the sites were chlorinated solvent sites and 25 were hydrocarbon sites. Of the solvent sites, none were thought to contain mobile DNAPL. The field sites represented a wide range of hydrogeologic conditions and were distributed across 13 states. Injection well spacing ranged from 3.6 to 24 m, flow rate per well ranged from 85 to 1,000 standard liters per minute, and injection networks ranged from 1 to 16 wells. Both horizontal and vertical wells were represented; some were continuous injection systems and others were pulsed injection. Sparging duration ranged from several months to over four years. Remediation success was measured in terms of percent reduction in contaminant mass. Mass reductions were estimated from rebound concentrations in groundwater samples taken months after sparging was discontinued. Of the 28 source area sites, 20 achieved estimated reductions of ≥ 80 percent, while 12 were estimated at ≥ 95 percent. In general, sparging at solvent sites was more successful than at hydrocarbon sites, and dissolved phase contaminants were more effectively removed than sorbed contaminants. Not surprisingly, sites with closely spaced wells (average spacing of 8 m) performed better than sites with widely spaced wells (average spacing of 13 m). Box 5-9 describes a site where air sparging was used in combination with soil vapor extraction for source remediation of DNAPLs and other compounds.
Applicability of the Technology
Contaminants. Air sparging was developed in the late 1980s for in situ remediation of volatile contaminants. It has most commonly been used to treat petroleum hydrocarbons and chlorinated solvents. In fact, it can be applied to any contaminant that is sufficiently volatile, and is most effective with contaminants that have dimensionless Henry’s constants much greater than 0.01.
|
BOX 5-9 A large-scale application of air sparging coupled with soil vapor extraction (AS/ SVE) was performed to treat a chlorinated solvent site in Burlington County, New Jersey (Gordon, 1998). The contamination covered 1.7 acres (0.7 hectares) in a coastal plain, with medium to coarse sand and an unconfined aquifer with a water table 1–9 ft (0.3–2.7 m) below ground surface. The contamination was bounded underneath by a clay layer. A variety of contaminants were present at the site, including TCE, 1,1,1-TCA, and 1,1-DCA in both DNAPL and dissolved phase. Following an extensive site characterization and development of a site conceptual model, an AS/SVE pilot test was conducted to estimate the radii of influence of air sparging and vapor extraction wells. Pilot test results were used to design the full-scale system, including the number and spacing of wells and the optimal airflow and vacuum rates. The full-scale system included 134 air sparging wells and 58 SVE wells distributed across 1.7 acres (0.7 hectares), designed for full coverage in the presumed source area and for plume interception downstream. To avoid hydraulic mounding and reduce channelization of air bubbles, 15 individual sections of the system were operated in sequential pulsing, with 30 minutes of operation followed by 60 minutes of down time. Pulsing cycles were coordinated across the entire site. During the first two years of operation, more than 500 kg of vapor phase VOCs were removed, and VOC concentrations in downstream wells declined to below detection limits for most solvents. TCE concentrations in the downstream wells declined by a factor of 30–500. However, in the source area wells, solvent concentrations remained high throughout the two years, suggesting that AS/SVE was continually volatilizing DNAPL masses. Direct recovery of DNAPL by pumping in the source area was stimulated by the AS/SVE process for the first seven months, and subsequently declined. In addition, vapor phase solvent removal declined during the first eight months with a characteristic tailing effect thereafter. Potential contaminant rebound subsequent to discontinuation of the AS/SVE system was not reported. |
Hydrogeology. Aquifer heterogeneities can significantly hinder contaminant transport and the effective zone of influence of the sparging vapors via plugging and the formation of preferential pathways. These conditions can be difficult to predict or monitor, making the performance of the technology highly empirical in nature (Leeson et al., 2002). Nonetheless, given a fairly homogenous aquifer with a high hydraulic conductivity, air sparging is expected to be effective for removing significant mass within a three- to five-year time span. The level of site characterization required to implement this technology successfully, and the depth limitations of the technology, are similar to that required for application of aqueous pump-and-treat (i.e., hydraulic containment).
Health, Safety, and Environmental Considerations. Since air sparging does not involve the active pumping of groundwater, human health risks associated with the contaminants are limited to the potential for exposure to sparging vapors. Further, since no additional chemicals are involved in the application of air sparging, chemical exposure is not an issue. If sparging is accomplished with compressed air, the presence of a compressed gas cylinder may pose a slight hazard. However, the major exposure route would be with extracted vapors containing the contaminants as they move through the aboveground treatment train.
Potential for Meeting Goals
Designing the zone of influence to target the entire volume of the contaminant source is extremely important in order to attain cleanup goals. The zone of influence is a function of the number and placement of injection wells, the airflow to injection wells, and the hydrogeology of the site. Precipitation or bio-fouling can lead to the plugging of injection wells, resulting in decreased airflow rates and a decreased the zone of influence. Increased injection pressures and redevelopment of wells are actions applied to counteract plugging. Sparging vapors generated by this technology may be laden with sufficiently high concentrations of contaminants to necessitate vapor extraction with associated gas treatment. Also, control of sparging vapors may be necessary to limit further contaminant migration in the subsurface. Heterogeneities in the hydrologic condition of the subsurface can cause short-circuiting of the sparge vapors, decreasing the effectiveness of the technology (Leeson et al., 2002). Thus, due to the large number of potential variables associated with the application of this technology in the subsurface, achieving success with in situ air sparging requires significant engineering judgment and expertise. Consequently, even within homogenous media with high transmissivity, it is problematic to predict effectiveness, as the values for likely effectiveness in Table 5-7 reflect. Indeed, in a recent review of air sparging advances, Johnson et al. (2001) voice the opinion that many sparging systems are operated inefficiently and that conventional monitoring techniques are inadequate to assess effectiveness. They go further to state, “In brief, [in situ air sparging] system design remains largely empirical with an apparent lack of appreciation for the complexity of the phenomena and the sensitivity of the technology to design and operating conditions.” Since there have been few well-documented applications of air sparging for treatment of DNAPL source zones in fractured, heterogeneous, or impermeable media, little is known about its effectiveness in those settings; consequently, likely effectiveness ratings in Table 5-7 have been listed as low.
Cost Drivers
The major costs of air sparging are associated with the injection of air under the water table, possibly coupled with the extraction and treatment of subsurface vapors. The cost of the oxygen delivery will primarily be affected by the depth to the contaminant zone (well drilling cost and energy cost), the areal distribution of contaminant, the hydraulic conductivity and heterogeneities of the subsurface (which control the number of wells required to provide adequate coverage), and the mass and volatility of the contaminant (which control the amount of time required for site closure). The cost of the soil vapor extraction will be driven by the mass and volatility of the contaminant (which control the extraction flow rate and duration) and the hydraulic conductivity (which controls the number of extraction wells). The cost of vapor treatment at the surface will be driven by the nature and mass of contaminant (which control the treatment method, loading rate, and duration). Generated vapors are generally dilute, resulting in high per unit mass costs for treatment.
Technology-Specific Prediction Tools and Models
A great number of numerical models have been developed to predict air sparging effectiveness and to aid in the design of air sparging systems (e.g., Marley et al., 1992; van Dijke et al., 1995; Lundegard and Andersen, 1996; McCray and Falta, 1997; Philip, 1998; Rabideau and Blayden, 1998; van Dijke et al., 1998; Elder et al., 1999). Despite this, the intense complexity of the process still necessitates a strong reliance on pilot-scale and feasibility testing for effective application (Johnson et al., 2001). Therefore, the technology is not highly predictive, and field-testing is essential for evaluating the potential for success.
Research and Development Needs
A recent review of air sparging summarizes the key research needs associated with this technology (Johnson et al., 2001):
-
Improved understanding of air flow distributions and the effects of geology and injection flow rate.
-
Development of better characterization methods for air flow distributions at the pilot and field scales.
-
Improved predictions of how transient operating conditions such as pulsing can affect performance and reduce equipment costs.
-
Development of innovative monitoring approaches that are capable of accurately assessing system performance.
Enhanced Bioremediation
Many contaminants can be transformed in some fashion by subsurface microorganisms. Indeed, these processes take place during natural attenuation, which is considered a suitable remediation technology when it results in contaminants disappearing more rapidly than they migrate, resulting in a stable or shrinking contaminant plume. When natural attenuation occurs too slowly or is inhibited by a lack of substrates or nutrients or by some other condition, enhanced bioremediation may be an appropriate technology to pursue. Enhanced bioremediation involves the stimulation of contaminant-degrading microorganisms within a subsurface aquifer or vadose zone by delivering chemical amendments to the contamination zone. Subsurface microorganisms are stimulated by delivery of substrates, electron acceptors, and/or nutrients by means of subsurface injection or surface infiltration (Figure 5-8). The major advantage associated with in situ bioremediation is that the contaminants are destroyed largely in place, minimizing contaminant transport to the surface and preventing transfer of the contaminant to a new medium for subsequent treatment or disposal. It should be noted that the amount of time required to completely remediate a source zone using biological processes
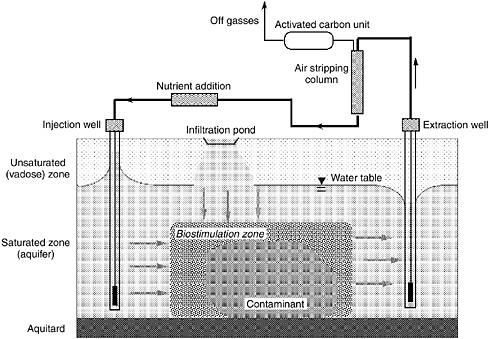
FIGURE 5-8 Enhanced bioremediation employing an injection well and infiltration pond for nutrient delivery and air stripping with activated carbon for treatment of extracted water.
will likely be greater than that required for more aggressive options such as thermal or (to a lesser extent) chemical treatments.
For remediation of chlorinated solvents, enhanced bioremediation can be achieved either by metabolic reactions, with the contaminant serving as either an electron donor or electron acceptor for energy generation, or by cometabolic reactions, with the contaminant degrading fortuitously due to the presence of an alternate substrate. Under strictly anaerobic conditions and in the presence of a reduced electron donor, chlorinated solvents will undergo a metabolic reaction known as reductive dechlorination (McCarty, 1997). Reductive dechlorination generally occurs in a series of reaction steps, with transient production of lesser-chlorinated intermediates. For example, reductive dechlorination of PCE results in the generation of TCE followed sequentially by DCE and VC prior to complete dechlorination to ethene. In some cases, dechlorination does not proceed to completion, and intermediates such as DCE build up.
Substrates that are suitable for promoting reductive dechlorination include hydrogen gas, a wide variety of defined organics such as lactate, methanol, butyrate, and sugars, as well as complex organics such as molasses and vegetable oil (Lee et al., 1998; Yang and McCarty, 1998). Slow-release polymers that result in a long-term source of lactate are commercially available for this application. The subsurface introduction of these reduced substrates results first in microbial consumption of all available electron acceptors; this can occur within days of the initial application. Subsequently, the reduced organics are fermented, generating fermentation products that include hydrogen gas. The hydrogen gas is then used by reductive dechlorinating bacteria to degrade the chlorinated solvents. Observable reductive dechlorination may require months to achieve (e.g., see the case study described in Box 5-10).
Conversely, cometabolic reactions for the degradation of chlorinated solvents are generally aerobic reactions that involve the delivery of cosubstrates such as methane, propane, toluene, or butane to the subsurface along with a source of oxygen (reviewed by Alvarez-Cohen and Speitel, 2001). For chlorinated solvent applications, the cometabolic reactions have a number of disadvantages compared to the metabolic reactions, including the difficulties associated with achieving proper mixing of the cosubstrate, oxygen, and contaminants, competition between cosubstrate and contaminant for the active enzyme, and potential for product toxicity. However, observable degradation can be achieved within months of application, and with careful control of injection strategies, long-term effectiveness is possible (McCarty et al., 1998). In some cases, it may be advantageous to create anaerobic zones followed by aerobic zones to ensure more complete removal of contaminants and their daughter products.
Bioremediation of a contaminant that provides energy to microorganisms for growth can be highly efficient since it involves a built-in termination mechanism: when the contaminant is consumed, growth of the microbial population ceases. On the other hand, bioremediation of contaminants that do not provide growth or
energy to microorganisms (e.g., cometabolized compounds) requires an alternate growth substrate to stimulate microbial activity. In addition, achieving the appropriate mixing and transport of substrates to the zone of contamination to promote cometabolism can be highly challenging, and generally requires more hydrologic control than bioremediation of an energy-yielding substrate.
Overview of Case Studies
Although enhanced bioremediation has primarily been applied to dissolved plumes of contaminants rather than to source zones, there have been a number of recent laboratory studies suggesting that source zones could potentially be treated with this technology (Isalou et al., 1998; Nielsen and Keasling, 1999; Carr et al., 2000; Cope and Hughes, 2001; Yang and McCarty, 2000). For example, Nielsen and Keasling (1999) reported that a mixed microbial culture enriched on TCE was capable of degrading PCE and TCE in the presence of DNAPL in a batch system and that degradation kinetics increased at high solvent concentrations. Isalou et al. (1998) showed that rapid degradation of high concentrations of PCE could be achieved in continuous-flow columns. Demonstrations have shown that active microbial communities could lead to the enhanced dissolution of PCE DNAPL in continuous-flow liquid reactors (Carr et al., 2000) and columns (Cope and Hughes, 2001). In fact, Seagren et al. (1994) used a modeling approach to demonstrate that biodegradation reactions could increase the concentration gradient near NAPL sources, resulting in increased dissolution rates. Further, Yang and McCarty (2000) demonstrated that saturation concentrations of PCE inhibit the activity of cells within the dechlorinating community that compete for hydrogen, thereby increasing the utilization efficiency of the delivered electron donor (e.g., lactate). As a whole, these laboratory studies suggest that enhanced bioremediation is a promising technology for application to chlorinated solvent source zones. However, well-characterized field demonstrations and a better understanding of the specific relationship between DNAPL dissolution and biodegradation is needed in order to fully exploit this promise. Two field case studies are presented in Boxes 5-10 and 5-11.
Applicability of the Technology
The feasibility of applying in situ bioremediation at a specific site depends upon a number of factors, including aquifer hydrologic and geochemical characteristics, the indigenous microbial population, and the nature and distribution of the contaminants. The fundamental requirement for bioremediation is that the contaminant, the microorganisms, and any other required reactant are brought into contact so that the biodegradation reaction can proceed. For contaminants that exert microbial toxicity at high concentrations, the application of in situ bioremediation in source zones would involve additional challenges.
Contaminants. A wide variety of contaminants are amenable to bioremediation, including chlorinated solvents, hydrocarbons, creosote, polychlorinated phenols, nitrotoluenes, and PCBs. Nonetheless, there are a number of potential limitations associated with the application of enhanced bioremediation to source zones containing these compounds. The high concentrations of solvents associated with source zones may inhibit robust microbial growth. However, as discussed above for the case of chlorinated ethenes, there is some evidence that reductive dechlorinating communities may be capable of surviving and indeed flourishing under source zone conditions. Chemical explosives can be the target of enhanced bioremediation, as discussed in Chapter 2 (for Badger AP) and in a subsequent section.
|
BOX 5-10 In 1999, a field pilot study was performed to evaluate the potential for enhanced in situ bioremediation to treat a TCE-contaminated source zone at the Idaho National Environment and Engineering Laboratory (INEEL) Test Area North (TAN) site (Song et al., 2002). A mixture of waste materials, including low-level radioactive isotopes, sewage, and chlorinated solvents, was injected into the aquifer from the 1950s to the 1970s, resulting in a 2-km plume of TCE with concentrations as high as 2.3 mM (300 ppm). Lesser amounts of cis-1,2-DCE and trans-1,2-DCE were also observed prior to the pilot study. The aquifer consists of permeable basalts with a 61-m-thick saturated zone under a 64-m-thick vadose zone (Figure 5-9). The pilot study began with the injection of 76 L/min. of clean water into TSF-05 (day 0–day 25). Lactate was introduced into the aquifer through TSF-05 via pulsed injections of 907 kg of sodium lactate dissolved in 1,140 L water at 38 L/min. (day 52–day 77), in 2,270 L at 76 L/min. (day 78–day 105), in 11,400 L at 95 L/min. (day 106–day 204), and in 22,700 L at 95 L/min. (day 205–day 296). Lactate was not injected between days 296 and 449, but resumed on day 450. Chlorinated solvents, organic acids, and ions were all monitored during the study. In addition, stable carbon isotope ratios of the chlorinated organics were measured to track treatment progress. Concentration data indicated that lactate injection promoted the degradation of TCE to ethene with transient generation of cis-DCE and VC. Compound-specific stable isotope monitoring of the solvents was used to differentiate the effects of groundwater transport, dissolution of DNAPL at the source, and enhanced bioremediation. Within the zone of lactate influence, the carbon isotope ratio of ethene at the end of the study matched the ratio of the initial dissolved TCE, confirming the complete conversion of dissolved TCE to ethene (see Figure 5-10). Observed shifts in TCE isotope ratios in the source zone indicated that dissolution of DNAPL was promoted during the lactate injection. |
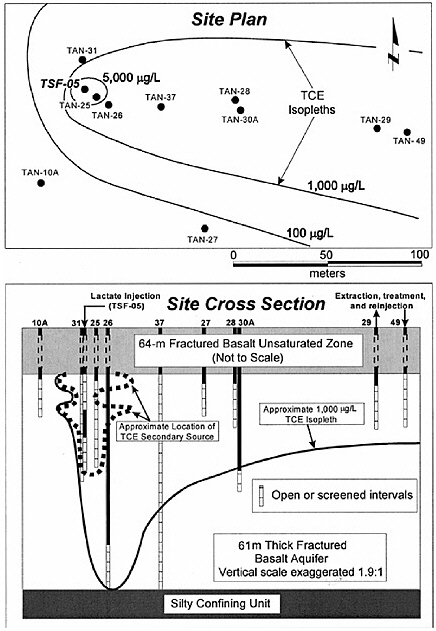
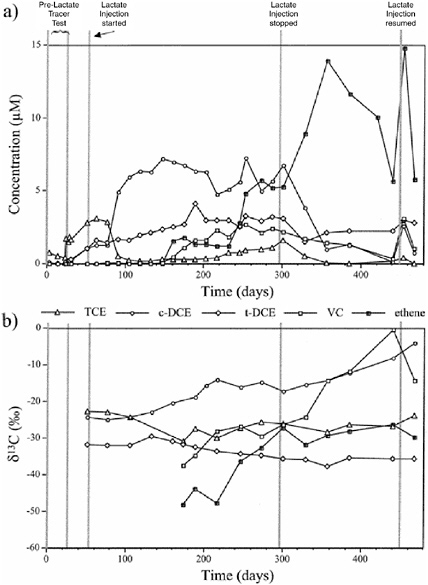
An important factor that can limit the feasibility of in situ bioremediation is the availability of the contaminant for microbial attack. That is, contaminants that have extremely low solubilities (e.g., PCBs), are present in NAPL phases (e.g., PCE and TCE), or are otherwise physically inaccessible will be more difficult to degrade than dissolved phase contaminants, and they will tend to persist in the environment. Interestingly, recent studies with chlorinated solvent NAPLs have shown that microorganisms are capable of facilitating dissolution of the contaminants into the aqueous phase. Further, since the aqueous solubility increases as the chlorinated ethenes become more reduced, the daughter products partition more favorably into the aqueous phase, potentially increasing removal rates (Carr et al., 2000). Methods to enhance the bioavailability of contaminants by employing surfactants or elevated temperatures to increase solubilities are currently under study.
Hydrogeology. Aquifer heterogeneities can significantly hinder transport of contaminants and reactants to the microorganisms, severely limiting remediation rates. In general, aquifers with extremely low hydraulic conductivities ( ≤ 10–6 cm/s) are not suitable for this technology. The level of site characterization required to implement this technology successfully is similar to that required for application of pump-and-treat, but bioremediation also requires information on the physical-chemical properties of the groundwater (e.g., ions, organics, potential electron donors and acceptors, redox potential, and pH). As with many other technologies discussed in this chapter, there are no depth limitations associated with enhanced bioremediation other than those associated with well drilling.
Health, Safety, and Environmental Considerations. One of the major advantages of enhanced in situ bioremediation is that most of the reaction takes place in the subsurface, so human exposure to the contaminants is minimized. In fact, contaminants are only transported to the surface if groundwater extraction is required to hydrologically control the plume or to deliver substrates. The chemicals used for reductive dechlorination reactions are generally benign, while some of those used for cometabolic applications may be somewhat toxic (e.g., toluene, phenol). Finally, application of enhanced bioremediation is gentle to the environment, utilizing naturally occurring microorganisms and biological reactions. Contamination of additional quantities of groundwater, as would be caused by pump-and-treat operations, are avoided with this technology.
Potential for Meeting Goals
Proving that contaminant destruction by microbial degradation is occurring can be challenging due to the inaccessibility of the subsurface, aquifer heterogeneities, the complexity of differentiating biological from nonbiological processes, and the wide range of potential contaminant fates. Overlapping lines of evidence
|
BOX 5-11 The Caldwell Trucking Superfund Site is an 11-acre (4.5-hectare) property of a former sewage-hauling firm in Fairfield, Essex County, New Jersey. From the 1950s until 1973 the owners hauled industrial waste and discharged it into unlined lagoons. The sludge in the lagoons contained, among other things, TCE, chloroform, and lead. Groundwater contaminants include chlorinated ethenes, ethanes, and methanes up to 1,200 m downgradient of the source zone. Groundwater flows through a glacial sand and gravel aquifer that overlies a fractured basalt aquifer. Over 50 wells have been closed in the area because of contamination. Prior source remediation activities included removal of underground storage tanks and of highly contaminated soils, soil vapor extraction (SVE) for VOCs, and stabilization/solidification of metal-contaminated soils. An SVE system was operated for six months and removed about 12,000 kg of VOCs. SVE was discontinued due to sewage odors even though significant mass removal was occurring. Recent analyses in the source zone show TCE levels up to 700 mg/L (about 60% of TCE solubility) due to the presence of residual DNAPL in the basalt bedrock. Low levels of natural TCE biodegradation had been occurring over much of the site. A full-scale field test of source zone bacterial reductive dechlorination was started in 2001 (Finn et al., 2004). The test goals were to accelerate the dissolution and treatment of source material and reduce the overall lifetime and impact of the source, rather than to achieve specific concentrations of parent and daughter compounds in groundwater. The test design included six nutrient injection wells screened in glacial deposits and bedrock, and seven monitoring wells. The initial substrate feed was a mixture of lactate, acetate, and methanol, later modified to lactate, methanol, and ethanol. The injection wells were also bioaugmented with a microbial consortium that included Dehalococcoides ethenogenes. Gene probes were used to verify initial and continued survival and propagation of D. ethenogenes. Figure 5-11 shows concentration vs. time for chlorinated ethenes in selected wells. Well MW-B23 is an overburden monitoring well that showed complete disappearance of PCE and TCE concomitant with ethene production. Well MW-C22 is the bedrock well that exhibited the highest initial concentrations of contaminants. Analyses show that PCE and TCE in bedrock have been degraded to a mixture of cis-1,2-DCE, VC, and ethene. Overall results of the test include average net reductions in PCE and TCE concentrations across the treatment zone of 95% and 93%, respectively, over a 30-month monitoring period. After 30 months, two monitoring wells contained no PCE, and one well had no detectable TCE. Significant solvent reductions occurred in both injection wells and monitoring wells accompanied by large increases in ethene concentrations, indicating that a continuous treatment zone was present across the test area. The average observed ethene concentration was 723 µg/L, which exceeds the average PCE concentration (131 µg/L) and is similar to the average TCE concentration (790 µg/L). The test results indicate that in situ bioremediation is a viable source treatment/ control technology for Caldwell Trucking. A formal Record of Decision (ROD) change from pump-and-treat to in situ bioremediation is currently under consideration by EPA. |
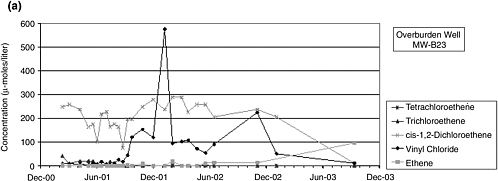
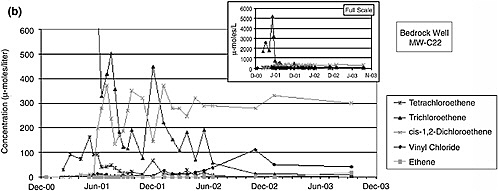
from a range of field monitoring techniques are required for indication of successful in situ bioremediation (NRC, 1993). Examples of monitoring observations that provide evidence for in situ bioremediation include contaminant disappearance in the bioactive zone, increased biological activity, generation of degradation intermediates, depletion of electron acceptors, and changes in stable isotope ratios of degradation products.
In some cases, it is possible that the physical–chemical and biological conditions of the subsurface are not conducive to enhanced bioremediation. Conditions that may limit microbial growth rates such as low permeability, low temperature, or high metals concentrations may also hinder remediation rates. Since indigenous microbial populations in the majority of aquifers are capable of degrading a wide range of contaminants including chlorinated solvents, there generally is no need for the introduction of exogenous microorganisms for bioremediation applications. However, in cases where the appropriate indigenous strains are not present, injection of laboratory-enriched microbial populations to bioaugment the site may be possible. Successful bioaugmentation for treatment of chlorinated solvents has been documented at a number of field sites (Ellis et al., 2000; Major et al., 2002).
Microbial metabolism is significantly affected by temperature, that is, the microbial reactions tend to decelerate with decreasing subsurface temperatures. Although temperatures within the top ten meters of the subsurface may fluctuate seasonally, subsurface temperatures down to 100 m typically remain within 1°C–2°C of the mean annual surface temperature (Freeze and Cherry, 1979), suggesting that bioremediation within the subsurface would occur more quickly in temperate climates. Additional factors that may limit microbial activity include pH values outside the range of neutral (pH < 6, pH > 8), desiccating moisture conditions, and extreme redox potentials.
Experience with the use of enhanced bioremediation for the treatment of source zones containing DNAPLs is extremely limited. More often, enhanced bioremediation is applied as part of a permeable reactive barrier to intercept and treat a contaminant plume. Although there have recently been studies that suggest bioremediation in the vicinity of DNAPLs is possible (Isalou et al., 1998; Nielsen and Keasling, 1999; Carr et al., 2000; Cope and Hughes, 2001; Yang and McCarty, 2000), there have been limited numbers of well-documented field studies to demonstrate this. For the few demonstrations that have been published, success is generally reported in concentration reduction rather than mass removal or mass flux reduction. Further, the long-term effectiveness of source zone bioremediation in heterogeneous or low permeability media has not been demonstrated. Consequently, the likely effectiveness values in Table 5-7 are primarily “low” or “low-medium” in low-permeability and heterogeneous settings. Entries in the table for change in toxicity reflect the strong probability that significant biodegradation of chlorinated solvents to intermediates having extremely different toxicities (e.g., the carcinogenic vinyl chloride vs. the relatively harmless
ethane) would result in toxicity changes. Finally, entries for reduction in source migration potential have a specific notation reflecting the fact that microorganisms are known to generate surfactants that could potentially increase the mobility of DNAPLs in the subsurface (Carr et al., 2000; Cope and Hughes, 2001).
Cost Drivers
Since enhanced bioremediation involves the use of injection and/or extraction of subsurface fluids, it has higher costs associated with it than natural attenuation. However, enhanced bioremediation involves less reliance upon naturally occurring subsurface conditions and growth factors than does natural attenuation and is therefore applicable over a broader range of site and contaminant characteristics. In addition, enhanced bioremediation may be the more appropriate option when time constraints or liability constraints are a concern, or when it is necessary to show good faith to the surrounding community or regulators by “engineering” a solution.
The costs of enhanced bioremediation are driven primarily by delivery of the stimulants to the subsurface, cost of the stimulants themselves, and the monitoring required to demonstrate the treatment’s effectiveness. The cost of the stimulant delivery will primarily be affected by the depth to the contaminant zone (well drilling cost and energy cost) and by the areal distribution of contaminant and the hydraulic conductivity (which affect the number of wells required to provide adequate coverage). The cost of the stimulants will be driven by the nature of the contaminant (which determines the type of stimulant) and the mass of contaminant (which controls the amount of stimulant required). Finally, the cost of monitoring is also driven by the mass of contaminant, as well as by all of the factors listed above for delivery of stimulants.
It should be noted that because the contaminants are not brought to the surface for treatment during bioremediation, the costs associated with pumping large quantities of water and with treating that water at the surface, which are common to other remedies, are avoided.
Technology-Specific Prediction Tools and Models
Numerous reactive transport models have been developed to simulate in situ bioremediation of plumes downgradient of DNAPL sources. Semprini and McCarty developed a single-phase two-dimensional reactive transport model to simulate TCE degradation by methane-stimulated bacteria at Moffett Field, California; the model incorporated microbial growth, cometabolic transformation, and competitive inhibition (Semprini and McCarty, 1991, 1992). Subsequently, the TRAMPP model was developed to simulate the same process at Savannah River, Tennessee; this two-dimensional model built upon the Semprini and McCarty model by integrating gas phase transport and predation of the methane-oxidizing bacteria
(Travis and Rosenberg, 1997). More recently, Gandhi et al. (2002) modeled the cometabolic biodegradation of TCE by toluene oxidizers that were stimulated at Edwards Air Force Base in California using two recirculating wells. This reactive transport model incorporated oxygen outgassing as well as hydrogen peroxide inhibition into the microbial growth kinetics. Cirpka and Kitanidis (2001) modeled the same system using a simplified one-dimensional travel-time approach to evaluate effective substrate pulsing methodologies. Hossain and Corapcioglu (1996) developed a reactive transport model to simulate the sequential reductive dechlorination of PCE in the presence of excess stimulating substrate, and predicted pulsing methodologies that would be more effective than continuous injection. While each of these models could be calibrated and adequately fit to the field data for bioremediation within chlorinated solvent plumes, none of them incorporated bioremediation within the source zone or the effects of DNAPLs.
Several reactive transport models that have been developed explicitly incorporate source zones containing NAPLs into simulations of bioremediation. For example, Gallo and Manzini (2001) developed a one-dimensional model that incorporates dual-phase transport with biodegradation of a single contaminant that is degraded as a growth substrate. This single-substrate model has not yet been calibrated and validated with field data. Malone et al. (1993) also developed a one-dimensional dual-phase model applicable to aerobic bioremediation in the presence of LNAPLs that differentiated between oil fractions with high and low mass transfer potential. SEAM3D is a three-dimensional reactive transport model that incorporates biodegradation of multiple substrates and electron acceptors along with NAPL dissolution (Brauner and Widdowson, 2001). To date, this model has been applied only to hydrocarbon mixtures and has been shown to be especially sensitive to NAPL dissolution rates.
Reactive transport models that explicitly incorporate DNAPL sources include RT3D, a three-dimensional multisubstrate model that is capable of integrating DNAPL dissolution with contaminant transport and first-order sequential solvent degradation (http://bioprocess.pnl.gov/rt3d.htm). This model has been calibrated and validated at the Area-6 site at Dover Air Force Base in Delaware (Clement et al., 2000), among others. Not surprisingly, a sensitivity analysis of this model showed that the shape of the solvent plume was most sensitive to the aquifer transmissivity and that the mass of TCE in the resultant plume was most sensitive to biodegradation estimates.
Although a wide variety of comprehensive reactive transport models have been developed to predict in situ bioremediation in both single and multiple dimensions, few of them incorporate DNAPL presence and dissolution, and all of them are plagued by imprecise hydrologic information and by in situ biodegradation rates that are difficult to estimate. There is limited information available on microbial kinetics in the subsurface, especially with respect to dehalogenating communities, and this hinders the predictive abilities of even the most comprehensive models. Further, the limited information on the effects of DNAPL on
subsurface microbial ecology hinders the development of appropriate microbial kinetic expressions.
Research and Demonstration Needs
There are two extremely important research needs associated with the application of enhanced bioremediation for the treatment of source zones. The first is a better understanding of the specific relationship between DNAPL dissolution and biodegradation. That is, it is important to better understand the potential toxic effects of DNAPLs on microbial communities, the potential for biosurfactants or microbial uptake to enhance DNAPL dissolution, and the interactions between cell community dynamics and DNAPL presence. The second critical research need is to evaluate the microbial kinetics associated with DNAPL and dissolved solvent concentrations in the field. Improving understanding of field-associated microbial kinetics will allow improved reactive transport models to better design and predict the performance of enhanced in situ bioremediation processes. The major demonstration needs follow on directly from the research needs, with well-characterized field-scale demonstrations of enhanced bioremediation within source zones containing DNAPLs topping the list.
INTEGRATION OF TECHNOLOGIES
Integration of technologies can be critical to effectively treating multiple contaminants (e.g., organics and heavy metals), to treating contaminants in multiple compartments (e.g., vadose and saturated zones), and to optimizing the treatment of a given contaminant in a single compartment. This discussion focuses on technology integration for optimizing remediation of a given source zone, as well as for optimizing the overall treatment of the source zone and the dissolved plume. Integration of technologies is most effective when the weakness of one technology is mitigated by the strength of another technology, thus producing a more efficient and cost-effective solution. This topic is considered briefly here, with more information available in a recent NRC report (NRC, 2003).
An example of optimizing source zone remediation includes coupling of thermal and surfactant/cosolvent technologies for addressing an extremely challenging NAPL (e.g., coal tar). Dwarakanath et al. (2000) evaluated surfactant-enhanced remediation of a highly viscous (1,000 cP) heating oil, and determined that it would be more efficient to integrate surfactant and thermal technologies. A field study conducted at 50°C demonstrated that this approach was able to achieve 88 percent removal of the NAPL.
Research has also evaluated a combination of surfactant and chemical oxidation processes. The concept is that surfactants can be used to remove the bulk of the residual contamination, followed by low-concentration chemical oxidation as a polishing step. By removing the bulk of the mass with the surfactants, a much
lower contaminant load remains to be attacked by the chemical oxidation, allowing the implementation of a much lower-concentration chemical oxidation process (Shiau et al., 2003). Using lower concentrations of chemical oxidants has the advantages of being safer to implement, generating lower levels of heat and gas, and being more economical.
In an interesting innovation on the classical application of air sparging, Jeong et al. (2002) have proposed the concurrent injection of air and cosolvent for remediation of chlorinated solvent DNAPLs. Their proposed strategy is to use the preferential flow paths produced by air injection to enhance contact between the injected cosolvent and the DNAPL, resulting in enhanced contaminant dissolution into the cosolvent. Although they demonstrated promising results with this technique in laboratory studies, it has not yet been tested in the field. Similarly, Kim et al. (2004) investigated the use of low-concentration (below the CMC) surfactants to improve the size of source zones swept by air sparging. In laboratory experiments with homogeneous sand, they found that the swept zone created by air sparging was 5.2 times larger in the presence of sodium dodecyl benzene sulfonate than in its absence.
In situ thermal processes such as steam flushing or soil heating generally promote bulk removal of contaminants. Therefore, it would be useful to integrate a cost-effective follow-on technology capable of remediating the residual contaminants. For example, a logical combination would have in situ bioremediation following thermal treatment. A series of bench- and field-scale studies have been conducted with creosote- and solvent-contaminated soils to evaluate the effects of steam-enhanced extraction on soil microbial activity (Richardson et al., 2002). Results demonstrated that mesophilic subsurface microorganisms survive in situ steam treatment and that the surviving community has the potential for post-steam bioremediation.
Abriola et al. (2003) also coupled “biopolishing” to a source zone remediation activity, in this case surfactant-enhanced aquifer remediation. The study was conducted at a former dry cleaning facility in Oscoda, Michigan, and the target contaminants were chlorinated solvents and BTEX. Acetate production in the formation was consistent with fermentation of the surfactant, Tween 80, which was believed to have stimulated reductive dechlorination microorganisms in the aquifer. This was also consistent with substantial degradation of the low-level PCE concentrations remaining after the surfactant-based remedial efforts. Ongoing activities are seeking to isolate microbial populations at the site responsible for this reductive dechlorination.
The above discussion has focused on coupling technologies within the source zone. It is also important to make sure that the technologies implemented in the source zone do not negatively impact processes occurring in the downgradient dissolved plume. At the same time, it is possible that downgradient processes may be enhanced by activities taking place in the source zone. One example of the latter case is where amendments added to the source zone may enhance
downgradient biodegradation processes. For example, when alcohol is used to flush the source zone, residual alcohol remaining after source zone remediation may serve as an electron donor to promote natural attenuation within the dissolved plume (Rao et al., 2001). This is analogous to the processes reported above by Abriola et al. (2003) and Richardson et al. (2002) within the source zone. At the same time, there is a danger that the source zone remediation technique may actually hinder the ensuing natural attenuation (e.g., by changing redox conditions due to chemical oxidation). Thus, the integrated technologies must be carefully selected to both maximize the synergism while avoiding undesirable side effects.
One specific question the committee was asked to address was whether and how monitored natural attenuation (MNA) should be used following more aggressive source zone remediation. Indeed, a commonly expressed goal at sites the committee is familiar with is to reduce concentrations of source zone contaminants enough to “allow MNA to take over.” There is very little scientific evidence to address this question.
The scientific understanding of and experience with MNA of chlorinated compounds is growing and changing very quickly (see NRC, 2000, and the more up-to-date summary in Major et al., 2002). MNA relies on a variety of processes that transform or reduce contaminant concentrations in the subsurface, although MNA is most closely associated with microbial degradation. If source zone treatments are successful in lowering contaminant mass and concentration, several conditions are required for using MNA as a follow-on activity: presence of the necessary bacteria, electron donors and acceptors, and the necessary macro- and trace nutrients.
Because there have been no documented cases of using MNA as a follow-on to source remediation, one can only surmise about its potential, which is done here using reductive dechlorination as an example. Bacterial reductive dechlorination requires a reducing aquifer environment, which is maintained by fermentative bacteria that degrade carbon compounds and release hydrogen. There are three main posttreatment possibilities. If after a source treatment there are no carbon sources remaining that can support fermentation and maintain reduced aquifer conditions, infiltrating groundwater will carry oxygen into the source zone and the plume. This oxygen will kill dechlorinating bacteria and halt the primary natural attenuation processes. Alternatively, there could be enough biodegradable carbon sources remaining after source remediation to maintain anaerobic conditions, but the required bacteria may not be present if the source remedy has reduced their numbers. It is not known whether dechlorinating bacteria routinely survive source zone treatments. They would be least likely to survive treatments that rely on aggressive oxidation (see Box 5-12 for a description of recent work in this area). Treatments that introduce air, heat, or surfactants are also likely to kill bacteria. If the bacteria do not survive in numbers large enough to support MNA, or if they were not naturally present before treatment,
bioaugmentation (adding bacterial cultures to the subsurface, also see Box 5-12) can be used to assure that the contaminant-biodegrading capacity is present when needed (Ellis et al., 2000; Major et al., 2002; He et al., 2003). In this case, MNA would be less effective and a plume of partially dechlorinated compounds would continue to migrate. The best-case scenario for MNA is if both the required
|
BOX 5-12 Soon-to-be-published work describes the use of in situ chemical oxidation using permanganate to rapidly remove DNAPL mass in a source zone. Because VOC rebound can occur after treatment, a secondary polishing technology such as enhanced bioremediation was considered. Bioremediation is potentially a highly effective technology for containing the residual groundwater plume, although it can be limited by the slow rate of microbially mediated reductive dechlorination, microbial inhibition by high chloroethene concentrations, and accumulation of more toxic degradation products (i.e., cis-1,2-dichloroethene and vinyl chloride). Furthermore, the prior addition of an oxidant may have severe impacts on the indigenous microbial population and may result in an ambient redox potential inhibitory to reductive dechlorination. To date, while some work has evaluated the sequential application of in situ chemical oxidation using Fenton’s reagent with aerobic degradation, no published studies have assessed coupling permanganate addition with anaerobic dechlorination. The potential consequences of sequencing these technologies have been evaluated in an ongoing laboratory optimization study prior to implementing sequential chemical oxidation/bioremediation at a pilot site in the United States. TCE was placed in six columns packed with soil collected from a site with an existing VOC plume, and the columns were flushed with distilled water. The study then evaluated the effects of short-term permanganate addition on the indigenous microbial activity and the groundwater geochemistry. The permanganate flushing was followed by biostimulation of four columns, and then bioaugmentation of two of these biostimulated columns with an enriched PCE/TCE dechlorinating consortium. Residual TCE concentrations following permanganate flushing were approximately 1 mg/L in the flushed columns. Initial biostimulation was conducted with distilled water containing acetate and ethanol. Two of these biostimulated columns were also bioaugmented. No biodegradation of acetate or ethanol, and no transformation products of TCE, were detected in any of the biostimulated or bioaugmented columns. Three weeks after switching from distilled water to site groundwater, the column became gradually reduced due to degradation of acetate and ethanol, followed by commencement of TCE dechlorination to cis-1,2-DCE and methanogenesis. Under reduced conditions significant dissolution of MnO2 was observed, both visually and through increases in dissolved Mn. Subsequent rebioaugmentation of one column led to dechlorination to ethene. The study thus illustrates the feasibility of sequential in situ chemical oxidation and bioaugmentation. |
bacteria and biodegradable carbon sources are present following the source treatment. In that case, the essential question will be whether a sufficient supply of electron donors remains after treatment to support bacteria until the contaminants of interest are completely destroyed. Accurate posttreatment site assessment and mass estimates of both carbon sources and DNAPLs are essential and are required to address this issue.
At this time no general statement can be made about the ability of MNA to contain plumes after mass removal due to the very site-specific physical and chemical nature of individual releases and the uncertain presence or absence of bacteria. Site-specific analyses of natural attenuation potential—done by qualified and experienced experts—will be required in all cases.
* * *
The limited work done to date on integrating source remediation technologies with one another and with MNA suggests that coupling of technologies has the potential to significantly improve the overall treatment of source zone systems. The obvious challenge is to find an optimal combination that both maximizes remediation efficiency while minimizing remedial costs. Integration of technologies may require modification to one or both technologies. For example, coupling of thermal and bioremediation technologies may require use of lower-temperature thermal processes to prevent inactivation of the microbial population. Nonetheless, some of the greatest advances yet to be realized may well result from the integration of source zone remedial technologies, which ongoing research should continue to explore.
COMPARISON OF TECHNOLOGIES
Table 5-7 summarizes the DNAPL source remediation technologies covered in this chapter. Since a detailed comparison of the technologies depends on a complex integration of a wide range of site and contaminant properties, the table provides a qualitative comparison only. It lists the types of contaminants for which each technology is applicable. The table then provides a rank of “high,” “medium,” “low,” or “not applicable” relative to each technology’s ability to achieve (1) mass removal in the source zone, (2) local aqueous concentration reduction in the source zone, (3) mass flux reduction from the source zone, (4) reduction of source migration potential, and (5) changes in the toxicity of the source area contaminants. “High,” “medium,” and “low” are qualitative terms that describe the likelihood that a given technology would be effective at achieving the listed objective. While a score of high suggests that a given technology is likely to achieve the source zone remedial objective, a score of medium suggests that progress might be realized, depending on specific circumstances. A score of
TABLE 5-7 Comparison of DNAPL Source Remediation Technologies
|
Likely Effectiveness at Appropriate Sites |
|||||||||
|
Technology |
Applicable Contaminant Types |
Media Settingsa |
Mass Removal |
Local Aqueous Concentration Reduction |
Mass Flux Reduction |
Reduction of Source Migration Potential |
Change in Toxicity |
Limitations |
Comments |
|
Physical Containment |
All compounds |
I |
Not Applicable |
Not Applicable |
High |
High |
Not Applicable |
Usually used with sources < 200 feet (61 m) deep. Difficult to use in karst. |
The most commonly approved remedy for source areas containing DNAPL. Failure rates are low for properly constructed systems, but all projects should be monitored long-term. |
|
|
|
II |
Not Applicable |
Not Applicable |
High |
High |
Not Applicable |
||
|
|
|
III |
Not Applicable |
Not Applicable |
High |
High |
Not Applicable |
||
|
|
|
IV |
Not Applicable |
Not Applicable |
Low-High* |
Low-High* |
Not Applicable |
||
|
|
|
V |
Not Applicable |
Not Applicable |
Low-High* |
Low-High* |
Not Applicable |
||
|
|
|
|
|
|
|
|
|
*Effectiveness depends on the fracture network |
|
|
Excavation |
All compounds |
I |
High |
High |
High |
High |
Not |
Applicable Site assessment must clearly define depth and area. Contaminant mass and concentration is not a factor. Technology is difficult when source is in bedrock (Type IV, V), but see discussion for exempting circumstances. |
The most aggressive of all source remediation methods. Source materials must be treated or disposed of after excavation. |
|
|
|
II |
High |
High |
High |
High |
Not Applicable |
||
|
|
|
III |
High |
High |
High |
High |
Not Applicable |
||
|
|
|
IV |
Not Applicable |
Not Applicable |
Not Applicable |
Not Applicable |
Not Applicable |
||
|
|
|
V |
Not Applicable |
Not Applicable |
Not Applicable |
Not Applicable |
Not Applicable |
||
|
Hydraulic Containment (Pump-and-Treat) |
All organics |
I |
Low |
Low |
High |
Low |
Low |
Hydraulic containment effective for managing plumes, but it must be assumed to operate continually. |
Very commonly used, design requires good site characterization, not well suited to highly permeable or low permeability sites. |
|
|
|
II |
Low |
Low |
Low |
Low |
Low |
||
|
|
|
III |
Low |
Low |
Medium-High |
Low |
Low |
||
|
|
|
IV |
Low |
Low |
Low |
Low |
Low |
||
|
|
|
V |
Low |
Low |
Low |
Low |
Low |
|
Likely Effectiveness at Appropriate Sites |
|||||||||
|
Technology |
Applicable Contaminant Types |
Media Settingsa |
Mass Removal |
Local Aqueous Concentration Reduction |
Mass Flux Reduction |
Reduction of Source Migration Potential |
Change in Toxicity |
Limitations |
Comments |
|
Multiphase Extraction |
Organics with low to moderate viscosity |
I |
Low-Medium |
Low |
Low-Medium |
Low |
Low-Medium |
Difficult to find DNAPL pools precisely enough for extraction. Residual NAPL will not be recovered. This technology only applies to shallow source zones. |
While commonly used for LNAPL recovery, has not been successfully demonstrated on DNAPL. |
|
|
|
II |
Low |
Low |
Low |
Low |
Low |
||
|
|
|
III |
Low |
Low |
Low-Medium |
Low |
Low |
||
|
|
|
IV |
Low |
Low |
Low |
Low |
Low |
||
|
|
|
V |
Low |
Low |
Low |
Low |
Low |
||
|
Surfactant/ Cosolvent Flushing |
All organics |
I |
High |
High |
High |
High |
Low-Medium |
Must avoid undesirable downward migration of DNAPL. |
Limited experience in fractured media. Foam may be needed if heterogeneity is high. |
|
|
|
II |
Low |
Low |
Low |
Low |
Low-Medium |
||
|
|
|
III |
Medium-High |
Low-Medium |
Medium-High |
High |
Low-Medium |
||
|
|
|
IV |
Low-Medium |
Low-Medium |
Low-Medium |
Low-Medium |
Low-Medium |
||
|
|
|
V |
Low-Medium |
Low-Medium |
Medium |
Low-Medium |
Low-Medium |
|
Likely Effectiveness at Appropriate Sites |
|||||||||
|
Technology |
Applicable Contaminant Types |
Media Settingsa |
Mass Removal |
Local Aqueous Concentration Reduction |
Mass Flux Reduction |
Reduction of Source Migration Potential |
Change in Toxicity |
Limitations |
Comments |
|
Chemical Oxidation |
Halogenated ethenes and ethanes |
I |
Medium-High |
Medium |
Medium |
Low |
Medium-High |
May be large heat release, soil fouling (MnO2 ppt from KMnO4), or metals released due to pH changes. Delivery of chemical oxidants will be poor in all but high-permeability media. Significant natural organic matter will limit efficacy. |
Only applicable to immobilized sources (low NAPL saturation, or sorbed). Limited experience in fractured media, most failures attributed to channeling in heterogeneous media. May require multiple injections. |
|
|
|
II |
Low |
Low |
Low |
Low |
Low |
||
|
|
|
III |
Low-Medium |
Low-Medium |
Medium-High |
Low |
Low-Medium |
||
|
|
|
IV |
Low |
Low-Medium |
Low-Medium |
Low-Medium |
Low |
||
|
|
|
V |
Low |
Low |
Low |
Low |
Low |
||
|
Soil Mixing/ Chemical Reduction |
Chlorinated and fluorinated compounds, primarily chlorinated ethanes |
I |
High |
High |
High |
High |
Medium-High |
The source area has to be defined, and be located in a soil that is amenable to mixing. Has not been used in bedrock. |
Rapid cleanup and site reuse, as little as one day for a small source, several weeks for a larger one. Developing technology with extremely limited experience to date. |
|
|
II |
High |
High |
High |
High |
Medium-High |
|||
|
|
III |
High |
High |
High |
High |
Medium-High |
|||
|
|
IV |
Not Applicable |
Not Applicable |
Not Applicable |
Not Applicable |
Not Applicable |
|||
|
|
V |
Not Applicable |
Not Applicable |
Not Applicable |
Not Applicable |
Not Applicable |
|||
|
Steam Flushing |
Volatile organic compounds and the more volatile end of the semivolatile organic compounds |
I |
High |
High |
High |
High |
Medium-High |
Steam over-ride, vertical remobilization may be problems. Steam generation, vapor–liquid capture and treatment require significant infrastructure. |
Few examples in fractured rock/ clay. No research on rate limitations. Some evidence that limited contaminant transformation may occur due to hydrous pyrolysis |
|
|
II |
Low |
Low |
Low |
Low |
Low |
|||
|
|
III |
Medium |
Medium |
Medium-High |
Medium |
Medium-High |
|||
|
|
IV |
Low |
Low |
Low |
Low |
Low |
|||
|
|
V |
Low |
Low |
Low |
Low |
Low |
|
Likely Effectiveness at Appropriate Sites |
|||||||||
|
Technology |
Applicable Contaminant Types |
Media Settingsa |
Mass Removal |
Local Aqueous Concentration Reduction |
Mass Flux Reduction |
Reduction of Source Migration Potential |
Change in Toxicity |
Limitations |
Comments |
|
Conductive Heating (ISTD) |
All organics and some metals |
I |
High |
High |
High |
High |
Medium-High |
High water flux below water table increases energy requirements. Migration into interval below heating is a concern. Close well spacing required. |
Little documentation on demonstrations in saturated media or fractured media. |
|
|
|
II |
Medium-High |
Medium-High |
High |
High |
Medium-High |
||
|
|
|
III |
Medium-High |
Medium-High |
High |
High |
Medium-High |
||
|
|
|
IV |
Low-Medium |
Medium |
Medium |
Medium |
Low-Medium |
||
|
|
|
V |
Low-Medium |
Medium |
Medium |
Medium |
Low-Medium |
||
|
Electrical Resistance Heating |
Compounds with boiling points less than that of water |
I |
Medium-High |
Medium-High |
High |
Medium-High |
Medium-High |
Cold temperatures increase energy requirements. Otherwise, limitations are the same as ISTD |
Little documentation on demonstrations in saturated media or fractured media. |
|
|
II |
Low-Medium |
Low-Medium |
Medium |
Low-Medium |
Low-Medium |
|||
|
|
III |
Medium |
Medium |
Medium-High |
Medium |
Medium-High |
|||
|
|
IV |
Low |
Low |
Low |
Low |
Low |
|||
|
|
V |
Low-Medium |
Low-Medium |
Low-Medium |
Low-Medium |
Low-Medium |
|||
|
Air Sparging (sometimes with SVE) |
Volatile compounds such as organic solvents and gasoline aromatics |
I |
Low-Medium |
Low-Medium |
Low-Medium |
Low |
Low-Medium |
High potential for rebound following cessation of pumping. Heterogeneities result in channeling and decreased effectiveness. |
Good potential to promote concurrent aerobic bioremediation. Only applicable to immobilized sources (low NAPL saturation, or sorbed). |
|
|
II |
Low |
Low |
Low |
Low |
Low |
|||
|
|
III |
Low |
Low |
Low-Medium |
Low |
Low-Medium |
|||
|
|
IV |
Low |
Low |
Low |
Low |
Low |
|||
|
|
V |
Low |
Low |
Low |
Low |
Low |
|
Likely Effectiveness at Appropriate Sites |
|||||||||
|
Technology |
Applicable Contaminant Types |
Media Settingsa |
Mass Removal |
Local Aqueous Concentration Reduction |
Mass Flux Reduction |
Reduction of Source Migration Potential |
Change in Toxicity |
Limitations |
Comments |
|
Enhanced Bioremediation |
Most volatile, semivolatile and nonvolatile organics, some metals, some inorganic ions, some explosives |
I |
Low-Medium |
High |
High |
Low** |
Medium-High |
Good potential for contaminant destruction. Difficult to completely predict/control. May take a long time to see effects. May require multiple treatments. |
Performance will be limited by dissolution rates and can be a function of geochemical conditions and indigenous microbial population. Limited experience in DNAPL proximity or in fractured media. |
|
|
II |
Low |
Low |
Low |
Low** |
Low |
|||
|
|
III |
Low-Medium |
Medium |
Medium |
Low** |
Medium-High |
|||
|
|
IV |
Low-Medium |
Low-Medium |
Low-Medium |
Low** |
Low-Medium |
|||
|
|
V |
Low |
Low-Medium |
Low-Medium |
Low** |
Low-Medium |
|||
|
|
|
|
|
|
|
|
|
**In cases where microbes make biosurfactants, DNAPL mobility can be enhanced. |
|
low suggests that the technology is unlikely to be effective in meeting the specific objective. “Not applicable” is used in cases where the technology cannot, by design, accomplish the particular objective. For example, containment purposely has no effect on mass removal. Similarly, excavation is unable to bring about any change in toxicity. It should be kept in mind that the performance of a given technology is extremely site specific, as are the objectives associated with any remediation strategy. Thus, the scores of high, medium, and low are somewhat subjective, and are intended for guidance purposes rather than as an absolute ranking.
To try to capture some of the site-dependent performance of the technologies, a rank is given for each of the five hydrogeologic settings presented in Chapter 2. While these five hydrogeologic settings are intended to provide structure to the discussions, they have limitations. At times a single site may encompass several media settings, or it may not clearly fall into one of the five settings. In addition, inadequate site characterization may place the site into one type of setting whereas in actuality, the site may better fit into another setting. All of this points to the importance of successive source characterization by experienced professionals at each stage of the remedial process.
The five physical objectives listed in Table 5-7 (mass removal, local aqueous concentration reduction, mass flux reduction, reduction of source migration potential, and change in toxicity) correspond to those discussed in detail in Chapter 4, and each are briefly reviewed here. The time scale for evaluating progress toward meeting the objective is immediately after the source zone remedial effort ceases. The one exception is pump-and-treat, which is considered as a continuous process, since it is so inefficient for source zone removal.
The first physical objective is mass removal, which refers to destruction or extraction of contaminant mass from the source zone. For example, while containment isolates the mass from contact with the groundwater, it does not extract the mass from the subsurface; therefore, containment is deemed to be “not applicable” for mass removal.
The second physical objective is local aqueous concentration reduction. This parameter refers to a weighted average of local contaminant concentrations in the zone of interest, and can thus deviate from concentrations measured a well sample, especially in a heterogeneous system (Type III media). In a heterogeneous system, during well purging the removed water will preferentially flow through the high conductivity zones, resulting in sample concentrations that are skewed toward the concentration found in this high conductivity zone. Thus, the resulting sample concentration is a function of the well itself (screened length and screened interval) and the way in which the well is sampled (amount and rate of purging, etc.). In addition, since the high conductivity zone tends to be well swept during flushing-based remedial activities, the resulting sample will have lower contaminant concentrations than expected from the contaminant remaining in the system. For these reasons, we choose instead to define the objective of reducing “local
aqueous concentration”—that is, the concentration that would be realized if point sampling could be conducted at the pore level and could be averaged over a zone of interest. While this parameter cannot be measured at the field scale, it removes the ambiguity of how the well is constructed and/or sampled. Furthermore, as defined here, this objective provides insight into the efficiency of each technology because it can be clearly distinguished from the third physical objective (mass flux reduction), which reflects groundwater flow-averaged concentrations. Mass flux reduction and volume averaged concentration reduction would differ in cases in which there is significant heterogeneity in the source zone and a significant fraction of the contamination is contained in the low-permeability portions. Cases where the scores on these two parameters differ are cases where postremediation rebound in contaminant concentrations may be more likely to occur.
The third physical objective in Table 5-7 is mass flux reduction, which refers to the mean mass of contaminant that is flowing past an imaginary plane at the downgradient side of the source zone. This parameter can be determined by integrating concentration measurements from several wells located along this imaginary plane, as discussed further in Chapter 4. Thus, while similar to concentrations commonly measured in a downgradient monitoring well, mass flux provides a more complete picture by accounting for spatial variability in contamination and flow fields.
The fourth physical objective is reduction of source migration potential. This parameter refers to an actual reduction in DNAPL migration potential, which primarily results from removal of source zone mass. Selective removal of components from the NAPL might also impact the source migration potential by changing properties of the NAPL (e.g., viscosity). Nevertheless, some technologies have the potential to inadvertently promote downward mobility of the DNAPL (e.g., by reducing the oil–water interfacial tension), and these effects are noted in the “limitations” column.
The final physical objective in Table 5-7 is potential for change in toxicity, which comes from the Superfund criteria. Since this report focuses on source zone contamination, toxicity here refers to aqueous phase contaminants in the source zone area (as opposed to contamination at a downstream receptor). For common DNAPLs, change in toxicity can result from changes in the compound itself or in the composition of the DNAPL. For example, enhanced biodegradation of chlorinated ethenes generally occurs by a progressive series of dechlorinations—PCE to TCE to 1,1-DCE to vinyl chloride to ethene—although the toxicity of these compounds does not follow the same order. When a complex mixture is present in a source zone, and the constituent chemicals are differentially affected by the treatment, there may be a change in the effective toxicity of the mixture. These changes may increase or decrease the overall toxicity. Such effects would be extremely difficult to predict without detailed information on subsurface conditions during treatment. Because of this inherent uncertainty, the entries are
provided as a range (e.g., low–medium) of potential for change in toxicity (either increasing or decreasing), and should not be considered as an absolute indication of the toxicity after remediation.
The final two columns in Table 5-7 document limitations and provide additional comments for each technology. It should be noted that plume size reduction is not listed as an objective in Table 5-7 even though it was discussed in Chapter 4 along with the other five physical objectives. Plume size reduction was omitted here because during the course of source zone remediation, contaminant concentrations and the plume size may initially increase prior to a long-term decrease—a subtlety that is not well reflected in such a simple table.
One common absolute objective of source zone remediation is risk reduction, which is not explicitly listed in Table 5-7. Instead, the objectives of mass removal, concentration reduction, and mass flux reduction attempt to capture the temporal and spatial nature of exposure. Which of these three objectives is best related to risk reduction is dependent on site type and other factors. For example, in spite of significant mass removal, heterogeneities may still cause there to be locally high concentrations. However, this can be accounted for by considering mass flux rather than discrete concentrations. Ultimately, risk assessment requires integration of these parameters with fate and transport simulators to determine the downgradient exposure level. Risk assessment also allows consideration of the temporal nature of the exposure. For example, in certain cases the long-term exposure may be more significantly impacted than the near-term exposures, as when mass removal does not result in significant concentration reduction but does greatly reduce the duration of exposure.
The goal of this table is to help guide the professional considering source zone remediation at a given site. Under no circumstance should this table be used to make the final selection of a technology (as discussed in Chapter 6). Rather, this table can help identify a list of the most viable technologies that should be thoroughly evaluated for use under site-specific conditions. In the end, the scoring in Table 5-7 should be considered more relative (one technology compared to another) than absolute.
The Table 5-7 entries are based on results from reported case studies as well as the committee’s best professional judgment (where there is a lack of comprehensive full-scale demonstrations). Few of the objectives in Table 5-7 have been measured in the field for the technologies. Where full-scale demonstrations have been done, success is most frequently reported in terms of mass removal, such that many of the entries under this column reflect field data. However, the committee’ best professional judgment was also critical to determining this column’s entries because statements about the percent of mass removed during remediation rely on estimates of the original mass in place, which are subject to considerable uncertainty. With regards to the concentration column, there have occasionally been successes reported using concentration data from wells, but these are very hard to interpret and may not represent local groundwater concentrations. Virtu-
ally no field data exist for the third, fourth, and fifth objectives listed in Table 5-7, necessitating that the committee judge the technologies’ likely effectiveness based the known operative mechanisms and the characteristics of the hydrogeologic settings. The lack of full-scale studies in all of the five hydrogeologic settings makes it very difficult to make generalizations about source remediation technologies. Nonetheless, in comparing the technologies in Table 5-7 and their individual descriptions in previous sections, it becomes apparent that certain site limitations apply to most of the technologies. For example, low-permeability materials pose serious challenges to almost all of the technologies. Most, if not all, of the technologies will struggle in certain hydrogeologic settings, such as karst (a variant of a Type V setting). Karst formations are characterized by large fractures and solution cavities, such that characterization and remediation of source zones in karst are extremely challenging and involve a large risk of reaching erroneous conclusions.
In lieu of full-scale demonstration projects, our ability to predict the effectiveness of source remediation is dependent on technology-specific mathematical models, bench-scale tests, and field pilot projects. The successful use of mathematical models is highly dependent on the quality of the site assessment and on the level of sophistication of the models and the model users. Flow models that encompass the movement of groundwater to carry the active agents of remediation are well developed and frequently used. When adequate site assessment and hydrogeologic information is available, these models can be quite accurate in their predictions (e.g., Brown et al., 1999). A typical use of modeling is to discover which subsurface properties are likely to have the largest influence on the remediation outcome, and then to investigate these properties in the field in sufficient detail to understand whether the proposed remedial action could succeed. One significant challenge is that many of the processes that are important for source remediation are highly nonlinear and thus difficult to model. The available models that incorporate this type of behavior are generally difficult for the nonspecialist to use successfully. At the present time, surfactant flushing appears to have the most successful predictive models available.
For those technologies that lack adequate mathematical models, bench studies and field-scale pilot studies can be used to evaluate their potential for success and to obtain key design parameters. Bench-scales test are helpful for evaluating chemical oxidation, chemical reduction, thermal techniques, and enhanced bioremediation. In these cases one must choose samples to be evaluated from a representative part of the source zone, and collect, transport, and handle those samples in ways that preserve their essential characteristics.
Field-scale pilot studies are defined as those done at a scale large enough to encompass likely variation in the hydrogeologic and chemical properties of the source zone. It was the committee’s collective judgment, based on experience as well as ITRC (1998) and Morse et al. (1998), that a useful size for a pilot study at most sites is between 5 percent and 10 percent of the volume of the source zone.
At sites with exceptional complexity this rule-of-thumb may not hold, and a larger pilot test or multiple pilot tests may be necessary. The pre- and posttreatment contaminant masses and the mass and fate of treated or removed contaminants should be well documented during a field-scale pilot study. A successful pilot test also must be run long enough for problems that could be caused by variability in the subsurface or by unanticipated reactions—for example, poor reaction rates, fouling, or contaminant rebound—to be clearly observed. Three to six months should be long enough for most pilot studies, though pilot studies in source zones with exceptional volume or contaminant mass may have to be operated for longer times. Enhanced bioremediation studies may need to be conducted for longer periods due to the relatively slow growth rates of some bacteria. Even with pilot testing results in hand, substantial care should be taken to ensure that treatment systems are scaled up in a manner that is both practical and appropriate for the individual site in question.
Even at sites where mathematical models and bench-scale tests have been conducted, field-scale pilot studies are still very helpful before full-scale source remediation projects are started. They can help refine the full-scale activity in ways that save time and money.
EXPLOSIVES REMOVAL TECHNOLOGIES
Historically, source remediation for explosives contaminated sites has focused on near-surface soils because of the tendency of these compounds to readily precipitate out of solution following disposal (see Chapter 2). Excavation to remove highly contaminated soils followed by ex situ treatment has been most common. Initially, incineration was the preferred ex situ treatment; however, composting has emerged as the standard for large volumes of explosives contaminated soils. Alternative technologies to composting (e.g., bioslurry) have been evaluated in pilot tests, but have not shown a competitive advantage (Craig et al., 1999). Among Army sites, incineration was the chosen ex situ treatment at Louisiana Army Ammunition Plant (AAP), Cornhusker AAP, Savanna Army Depot (AD), and Alabama AAP, while composting was performed at Newport AD, Hawthorne AAP, Iowa AAP, Milan AAP, Camp Navajo AD, Joliet AAP, and Umatilla AD. Lesser used technologies include capping where contaminated vadose zone soils extend deeper than conventional excavation depth, in situ flushing (e.g., water flooding), and enhanced bioremediation.
For the most part, other source area treatment alternatives for explosives have not been evaluated. Most of the aggressive technologies discussed for DNAPLs (such as chemical oxidation and electrical resistance heating) have been avoided due to concerns that localized temperature increases could initiate a detonation. Cosolvent or steam flushing appears attractive because explosives are highly soluble in the typical cosolvents used for DNAPLs (alcohols) and in hot water, but these technologies have not yet been considered.
Table 5-8 shows the limited number of Army sites contaminated with explosives where source area remedies have been completed or are in progress. In situ flushing at Umatilla has shown good progress, as evidenced by decreased concentrations of RDX and HMX in the regional groundwater. Remedial project managers (RPMs) at the site have considered enhancing the desorption of bound nitroaromatic residues from soil using induced cation exchange (calcium chloride injections); however, field tests have not been funded. At Badger, the treatment of the DNT source area via enhanced bioremediation is being optimized in field tests. RPMs have found that controlling soil moisture (low-grade in situ flushing), nutrients (phosphate), and waste products (nitrite) is important to optimizing treatment kinetics (Fortner et al., 2003; Rubingh, 2003).
Volunteer AAP is unique in that it is located in a hydrogeologically complex environment (karst bedrock with fractured residuum, a Type V setting). Extensive site characterization has been completed, yet there is still a lack of understanding regarding the nature of the explosive material released and the distribution of source areas within the residuum and/or bedrock. Site environmental managers
TABLE 5-8 Source Area Remedies for Explosives Contaminated Sites at Army Installations
|
Site |
Operable Unit |
Contaminants |
Source Area Remedy |
Plume Remedy |
|
Umatilla, OR |
Washout lagoons |
TNT, RDX |
Excavation, composting, in situ flushing |
Pump-and-treat |
|
Badger, WI |
Propellant burning ground waste pits |
DNT |
Excavation, incineration, in situ flushing/enhanced bioremediation |
Pump-and-treat |
|
Volunteer, TN |
North TNT manufacturing valley |
TNT, DNT |
Monitored natural attenuation |
Monitored natural attenuation |
|
Louisiana |
Lagoons |
TNT, RDX |
Excavation, incineration, capping |
Pump-and-treat |
|
Milan, CO |
Ditch E/ Wolf Creek |
TNT, RDX, HMX |
Source area not identified |
ISCO-Fenton’s |
|
Pueblo, CO |
TNT washout facility and discharge system |
TNT, RDX, TNB |
Excavation, composting |
ISCO-Fenton’s |
are considering the benefits of additional site characterization and extensive excavation. Pump-and-treat has been attempted, but is not now considered a viable alternative for containment of either the source area or the plume. Given the extreme hydrogeologic complexity at this site, MNA is being considered as an attractive remedy. Biodegradation in the residuum, dilution in the bedrock, and mass flux will be used to measure the extent of attenuation. An explosives-specific MNA protocol has been developed by the U.S. Army Corps of Engineers Engineer Research and Development Center (Pennington et al., 1999).
Development and deployment of technologies for treating explosives-contaminated plumes have been much more extensive than for source areas. Bioremediation, chemical oxidation, and chemical reduction have been the principal treatment alternatives to pump-and-treat for managing plumes. For the principal explosive compounds in this study (TNT, DNT, RDX, and HMX), there are several key chemical features that influence the efficacy of these different types of plume treatment. For example, the electrophilic nitro groups of TNT are susceptible to microbial reduction under both oxidative and reductive conditions (Rieger and Knackmuss, 1995). The cyclic nitramine RDX structure, however, is more easily biodegraded under strong reducing conditions than under aerobic conditions (McCormick et al., 1981, 1985; Speitel et al., 2001). HMX follows a similar pattern as RDX, but at a much slower rate. In contrast to the cometabolism of TNT and RDX, DNT appears to be oxidatively metabolized and used as a carbon, nitrogen, and energy source (Fortner et al., 2003).
Research on in situ chemical oxidation of TNT and RDX with Fenton’s reagent has shown good results in laboratory studies (Li et al., 1997; Bier et al., 1999); however, much less work has been completed for HMX (Zoh and Stenstrom, 2002). In one study, a systematic evaluation of potassium permanganate oxidation of RDX was done by determining the degradation and mineralization kinetics using 14C-labeled RDX (Comfort, 2003); results showed that permanganate produces slow but sustained rates of RDX destruction and mineralization in the presence of aquifer solids.
Abiotic reduction of RDX has been explored using both zero valent iron and in situ geochemical reduction. Zero valent iron (ZVI) has been shown to effectively destroy RDX in aqueous solution and in soil slurries (Hundal et al., 1997), and recent work has shown that ZVI may be used in excavated soil windrows as an alternative to composting (Comfort et al., 2003). In situ geochemical reduction uses a chemical reductant (sodium dithionite) to reduce the iron present in aquifer solids (Fruchter et al., 2000). The structural ferrous iron in the reduced zone then reacts with RDX, dissolved oxygen, and other electron acceptors. Laboratory tests have shown that in the presence of dithionite-reduced sediments, RDX transformation occurs rapidly; however, mineralization is small. Follow-on studies showed that secondary biotreatment of the residuals emerging from a permeable treatment barrier significantly improved the total mineralization (Comfort, 2003).
* * *
Because the characterization of explosive source materials and their interactions with geologic media lag far behind the knowledge base that exists for DNAPLs, fewer innovative source remediation technologies have been developed for explosives. The potential for dangerous explosions during remediation of explosives source areas has also been a major impediment. Indeed, whether for characterization or treatment technology development, laboratory and field assessment of explosives source zones must be performed with utmost care within specialized facilities.
TECHNOLOGY COST CONSIDERATIONS
Although anecdotal cost data are available for some source remediation technologies (particularly surfactant flooding and thermal technologies), actual cleanup costs are highly dependent on site-specific hydrogeologic, geochemical, and contaminant conditions (NRC, 1997), such that absolute statements regarding the relative costs of different technologies are of limited utility. For example, some technology costs are independent of depth, while others (like soil mixing) go up exponentially with depth. The cost of in situ chemical oxidation is controlled primarily by the amount of contaminant in the subsurface and has little to do with the size of the site, unlike the cost of surfactant flooding. Furthermore, different analysts often use different assumptions to estimate costs, which can lead to different conclusions regarding the relative financial merits of competing technologies. For example, estimates obtained from technology vendors may include vendor costs, but not the additional costs that must be incurred by the site in order to utilize the technology.
Of the wide variety of cost measures reported in the literature, the life cycle cost metric is recommended because it represents the total cost resulting from a course of action over the entire period of time affected by the action, and it therefore avoids the problems of suboptimization presented by other cost metrics. It is recommended that life cycle cost analyses be performed at individual sites, taking into consideration all of the costs associated with deployment of the specific technology at the specific site. For example, life cycle cost estimates should include research, development, test, and evaluation costs; preparation and mobilization costs; capital costs; operation and maintenance costs; site restoration costs; and long-term management costs including potential costs associated with future liabilities. Finally, cost estimates should be probabilistic to reflect the uncertainties inherent in the estimates. Chapter 4 presents a general life cycle cost analysis approach that can be used to compare the costs of competing technologies at a particular site.
To the committee’s knowledge, the only example of a comprehensive life cycle cost analysis for a site undergoing source remediation is from Hill AFB (see
Box 4-3). The decision-making framework and commensurate life cycle cost estimate used at Hill will include an updated geosystem model of the OU2 DNAPL source zone and a numerical model that can assist in the quantitative evaluation of the fate of the contaminant given a variety of possible management strategies. The goal is to use the site conceptual model, quantitative tools, and predictive contaminant transport modeling to provide the technical basis for a life cycle cost analysis that measures the effect of aggressive DNAPL removal operations on the dissolved phase plume and predicts plume dynamics into the future. Furthermore, these tools will be used to analyze various modifications to the current remedial strategy, including such possibilities as further source zone treatment (e.g., biopolishing) and/or decommissioning of existing remedial systems, and to aid in the determination of life cycle costs associated with each scenario. Life cycle cost estimates will most likely be probabilistic and will incorporate both capital and operation costs along with certain externalities. Examples of externalities that may be included are potential costs associated with mitigation of indoor air contamination, natural resource damage liability, and changes in regulatory standards.
CONCLUSIONS AND RECOMMENDATIONS
The committee’s review of source remediation technologies, both within the Army and at other sites, is based primarily on pilot-scale tests because the number of full-scale demonstrations across the country is quite small (unlike more established technologies such as pump-and-treat, for which an evaluation of 77 full-scale sites is summarized in NRC, 1994). Only thermal technologies and surfactant-flushing technologies have undergone multiple, carefully documented full-scale tests. The results of pilot-scale projects typically do not provide quantitative information on the ability of the various technologies to meet most remediation objectives. For example, although it is relatively easy to measure mass removal during a pilot test, such tests are rarely if ever designed to enable measurement of the objectives likely to be important when a remedy has gone to full-scale, such as concentration reduction at a downstream compliance point, mass flux reduction, or risk reduction. Furthermore, for the limited performance data available, usually only positive results are reported.
This lack of data and information upon which to make definitive statements about source remediation is echoed in a recently completed survey of 53 source remediation projects conduct-ed for the Navy (GeoSyntec, 2004). At 36 of the sites (68 percent) the RPM reported “success,” even though mass removal was not estimated at 33 of these sites (63 percent), mass flux was unknown at more than half the sites, and rebound was unevaluated at 60 percent of the sites. Thus, it was not clear for the majority of cases what the perception of success was based on. Indeed, it is due to the lack of adequate, full-scale performance data that many
of the entries in Table 5-7 are based on the committee’s best professional judgment regarding the underlying physical processes of certain treatment technologies rather than on documented case studies.
The following conclusions and recommendations are made regarding current technologies for source remediation.
Some source remediation technologies have been demonstrated to achieve substantial mass removal across a range of sites and contaminants. A number of these studies have also demonstrated concentration reductions (at only one or a few wells), but the meaning of these measurements is highly debatable and few of these cases include long-term data on postremediation concentrations. Mass flux reduction, reduced migration of the source, and changes in toxicity have not yet been demonstrated at any of the source remediation case studies reviewed. This is partly because of the difficulty in making such measurements. Furthermore, there are few field data to support both the hypothesis and existing laboratory data that suggest that partial mass removal can affect local concentration and downgradient mass flux (see Box 4-1). Thus, available data from field studies do not demonstrate what effect source remediation is likely to have on water quality.
Although ongoing research is developing a depletion profile approach for assessing mass flux reduction, to date these profiles have only been developed for surfactant/cosolvent technologies. A substantial body of theoretical work suggests that mass removal could result in a mass flux reduction, but field evidence to support or contradict this is sparse. This and related approaches should be further developed in future research.
Performance of most technologies is highly dependent on site heterogeneities. All remediation technologies are affected by site-specific heterogeneities that should be taken into account for effective use of the technology, but some technologies are much more sensitive to heterogeneities than others. In general, the efficiency of flushing methods decreases as the heterogeneity increases, although the degree of impact depends on the specific site characteristics and on the operative processes. In the case of surfactant flushing, foam generated by air injection has emerged as a viable way to mitigate heterogeneities. Steam flushing is affected by preferential flow of the steam, but conduction mitigates this impact to some degree. Soil heating by conduction is least sensitive to heterogeneities because thermal conductivity varies very little with media properties. Chemical oxidation and enhanced bioremediation are more sensitive to heterogeneities than are thermal methods, and air sparging is the most sensitive to heterogeneity because there are no mitigating factors preventing the preferential flow of air and the bypassing of the target DNAPL. Heterogeneities are more likely to affect one’s ability to achieve mass removal and local aqueous concentration reductions compared to mass flux from the source zone.
Most of the technologies are not applicable in, are negatively impacted by, or have not been adequately demonstrated in low-permeability or fractured materials. The effectiveness of flushing technologies in low-permeability settings (Type II) is limited due to the difficulty in moving flushing solutions (surfactants, oxidants, reductants, steam) through low permeability formations. Technologies which do not use fluid flow as a delivery mechanism, such as conductive heating and electrical resistance heating, have greater potential in Type II settings. Applications of source remediation technologies in fractured media (Types IV and V) have been limited due to difficulties in and cost of characterizing the fracture networks and delineating the source zone. Design and control of most source remediation technologies in these difficult-to-characterize systems is problematic. In addition, channeling along high-permeability fractures results in poor removal of mass from lower-permeability matrix zones for most technologies, with the possible exception of conductive heating since heat can be conducted efficiently through the rock matrix.
Each technology has the potential to produce negative side effects that need to be accounted for in the design and implementation of that technology. Examples of potential side effects include surfactant/cosolvent/steam-induced vertical migration of DNAPL, alteration of the redox potential by chemical oxidants or reductants (potentially serving to release previously bound nontarget compounds into the groundwater), and changes in the indigenous microbial population due to chemical or thermal treatment. These side effects can at times be avoided by an experienced design/implementation team. In other cases, the negative side effects should be factored into the design/implementation process.
Additional research is needed to determine how different source remediation technologies can be combined to achieve greater overall effectiveness. Examples of potential synergism include combining surfactants and low-level thermal processes to solubilize high-viscosity oils, following contaminant extraction with low-level chemical oxidation as a polishing step, allowing posttreatment levels of surfactants or alcohols to promote biotransformation of remaining contaminants, and allowing the elevated temperatures characteristic of thermal processes to promote the rate of biodegradation.
Almost all of the source remediation technologies evaluated require more systematic field-scale testing to better understand their technical and economic performance. Of the innovative technologies reviewed, only surfactant flooding has amassed a substantial number of field-scale studies in the peer-reviewed literature. Because full-scale applications of source remediation technologies are scarce, there is insufficient information to thoroughly evaluate most technologies, especially with regard to the long-term impact of mass reduction in the source zone. Furthermore, due to insufficient economic data and the site-
specific nature of both performance and cost, it is not possible to generically predict the impact of source remediation technologies on life cycle costs.
The level and type of source zone characterization required to design, implement, and monitor the performance of remedies is dependent on the chosen objectives and the remediation technology. For example, in situ chemical oxidation requires accurate estimates of source zone mass and composition and matrix oxygen demand, or else the remedy could be plagued by stoichiometric limitations or by the consumption of oxidant by unidentified co-contaminants. The properties of the source material (e.g., composition, viscosity, density, interfacial tension) should be determined for field-weathered samples in order to assess such remedies as surfactant-enhanced flushing. The location and geometry of source zone materials should be known to some level of certainty in order to design containment systems. For example, the most effectively designed slurry wall will have less effect on downstream mass flux if it is placed across the source zone rather than around it. With respect to performance monitoring, judging the effectiveness of in situ chemical oxidation by monitoring mineralization products or by monitoring the consumption of oxidant could overestimate treatment effectiveness in cases where alternate contaminants are present.
Development of treatment technologies for explosives source zones is in its infancy because the characterization of explosive source materials and of their interactions with geologic media lags far behind the knowledge base that exists for DNAPLs. Before one can understand the utility or performance characteristics of treatment technologies for explosives contamination, one should understand the chemical and physical nature of the explosives source zones. Furthermore, source areas containing high concentrations of explosives have the potential for dangerous explosions during remediation, which will necessitate laboratory and field assessment of explosives source zones within specialized facilities.
REFERENCES
Abriola, L. M., T. J. Dekker, and K. D. Pennell. 1993. Surfactant-enhanced solubilization of residual dodecane in soil columns: 2—mathematical modeling. Environ. Sci. Technol. 27(12):2341–2351.
Abriola, L. M., C. A. Ramsburg, K. D. Pennell, F. E. Loeffler, M. Gamache, and E. A. Petrovskis. 2003. Post-treatment monitoring and Biological Activity at the Bachman Road Surfactant-enhanced Aquifer Remediation Site. 43(1) Extended Abstract, American Chemical Society Meeting, New Orleans, LA, March 23–27, 2003.
Abston, S. 2002. U.S. Army. Presentation to the NRC Committee on Source Removal of Contaminants in the Subsurface. August 22, 2002.
Alvarez-Cohen, L., and G. E. Speitel. 2001. Kinetics of aerobic cometabolism of chlorinated solvents. Biodegradation 12(2):105–126.
AATDF. 1997. Technology Practices Manual for Surfactants and Cosolvents. CH2MHILL. http://clu-in.org/PRODUCTS/AATDF/Toc.htm.
Baker, R., D. Groher, and D. Becker. 1999. Minimal desaturation found during multi-phase extraction of low permeability soils. Ground Water Currents, 33, EPA 542-N-99-006.
Bier, E. L., J. Singh, Z. Li, S. D. Comfort, and P. J. Shea. 1999. Remediating RDX-contaminated water and soil by Fenton Oxidation. Environ. Toxicol. Chem. 18:1078–1084.
Brauner, J. S., and M. A. Widdowson. 2001. Numerical Simulation of a Natural Attenuation Experiment with a Petroleum Hydrocarbon NAPL Source. Groundwater 39:939–952.
Brown, C. L., M. Delshad, V. Dwarakanath, R. E. Jackson, J. T. Londergan, H. W. Meinardus, D. C. McKinney, T. Oolman, G. A. Pope, and W. H. Wade. 1999. Demonstration of surfactant flooding of an alluvial aquifer contaminated with dense nonaqueous phase liquid. Pp. 64–85 In: Innovative Subsurface Remediation: Field Testing of Physical, Chemical and Characterization Technologies. M. L. Brusseau, D. A. Sabatini, J. S. Gierke, and M. D. Annable (eds.). American Chemical Society Symposium Series 725. Washington, DC: ACS.
Brown, R. A. 1998. An analysis of air sparging for chlorinated solvent sites. Pp. C1.5:285–291 In: Physical, Chemical and Thermal Technologies. G. B. Wickramanayake and R. E. Hinchee (eds.). Columbus, OH: Battelle Press.
Buettner, H. M., W. D. Daily, and A. L. Ramirez. 1992. Enhancing cyclic steam injection and vapor extraction of volatile organic compounds in soils with electrical heating. Proc., Nuclear and Hazardous Waste Mgmt., Spectrum 1992:1321–1324.
Butler, R. M. 1991. Thermal Recovery of Oil and Bitumen. Englewood Cliffs, NJ: Prentice Hall.
Carr, C. S., S. Garg, and J. B. Hughes. 2000. Effect of dechlorinating bacteria on the longevity and composition of PCE-containing nonaqueous phase liquids under equilibrium dissolution conditions. Environ. Sci. Technol. 34:1088–1094.
Chown, J. C., B. H. Kueper, and D. B. McWhorter. 1997. The use of upward hydraulic gradients to arrest downward DNAPL migration in rock fractures. Journal of Ground Water 35(3):483–491.
Cirpka, O. A., and P. K. Kitanidis. 2001. Travel-time based model of bioremediation using circulation wells. Groundwater 39(3):422–432.
Clement, T. B., C. D. Johnson, Y. Sun, G. M. Klecka, and C. Bartlett. 2000. Natural attenuation of chlorinated ethene compounds: model development and field-scale application at the Dover site. Journal of Contaminant Hydrology 42:113–140.
Comfort, S. D. 2003. Evaluating in-situ permanganate oxidation and biodegradation of RDX in a perched aquifer. Project Report, University of Nebraska, October 2003.
Comfort, S. D., P. J. Shea, T .A. Machacek, and T. Satapanajaru. 2003. Pilot-scale treatment of RDX-contaminated soil with zerovalent iron. J. Environ. Qual. 32:1717–1725.
Cope, N., and J. B. Hughes. 2001. Biologically-enhanced removal of PCE from NAPL source zones. Environ. Sci. Technol. 35:2014–2021.
Craig, H. D., W. E. Sisk, M. D. Nelson, and W. H. Dana. 1999. Bioremediation of explosives-contaminated soils: a status review. Proceedings of the 10th Annual Conference on Hazardous Waste Research. Great Plains-Rocky Mountain Hazardous Substance Research Center, Kansas State University, Manhattan, Kansas. May 23–24, 1995.
Delshad, M., G. A. Pope, and K. Sepehrnoori. 1996. A compositional simulator for modeling surfactant enhanced aquifer remediation: 1—formulation. Journal of Contaminant Hydrology 23(4):303–327.
Delshad, M., G. A. Pope, L. Yeh, and F. J. Holzmer. 2000. Design of the surfactant flood at Camp Lejeune. The Second International Conference on Remediation of Chlorinated and Recalcitrant Compounds, Monterey, CA, May 22–25, 2000.
Dicksen, T., G. J. Hirasaki, and C.A. Miller. 2002. Mobility of foam in heterogeneous media: flow parallel and perpendicular to stratification. SPE Journal, June 2002.
Dwarakanath, V., and G. A. Pope. 2000. Surfactant phase behavior with field degreasing solvent. Environ. Sci. Technol. 34(22):4842.
Dwarakanath, V., K. Kostarelos, G. A. Pope, D. Shotts, and W. H. Wade. 1999. Anionic surfactant remediation of soil columns contaminated by nonaqueous phase liquids. J. Contaminant Hydrology 38(4):465–488.
Dwarakanath, V., L. Britton, S. Jayanti, G. A. Pope, and V. Weerasooriya. 2000. Thermally enhanced surfactant remediation. In: Proceedings of the Seventh Annual International Petroleum Environmental Conference. Albuquerque, NM, November 7–10, 2000.
Elder, C. R., C. H. Benson, and G. R. Eykholt. 1999. Modeling mass removal during in situ air sparging. J. Geotech. Geoenviron. Eng. 125(11):947–958.
Elliott, L. J., G. A. Pope, and R. T. Johns. 2004. Multi-dimensional numerical reservoir simulation of thermal remediation of contaminants below the water table. In: Proceedings of the Fourth International Conference on Remediation of Chlorinated and Recalcitrant Compounds, Monterey, CA, May 24–27, 2004.
Ellis, D. E., E. J. Lutz, J. M. Odom, R. J. Buchanan, C. L. Bartlett, M. D. Lee, M. R. Harkness, and K. A. Deweerd. 2000. Bioaugmentation for accelerated in situ anaerobic bioremediation. Environ. Sci. Technol. 34:2254–2260.
Enfield, C. G., A. L. Wood, M. C. Brooks, and M. D. and Annable. 2002. Interpreting tracer data to forecast remedial performance. Pp. 11–16 In: Groundwater Quality: Natural and Enhanced Restoration of Groundwater Pollution. S. Thornton and S. Oswald (eds.). Sheffield, UK: IAHS.
Environmental Protection Agency (EPA). 1995a. In Situ Remediation Technology Status Report: Thermal Enhancements. EPA/542-K-94-009. Washington, DC: EPA Office of Solid Waste and Emergency Response and Technology Innovation Office.
EPA. 1995b. How to Evaluate Alternative Cleanup Technologies for Underground Storage Tank Sites: A Guide for Corrective Action Plan Reviewers. EPA 510-B-95-007. Washington, DC: EPA.
EPA. 1996. Pump-and-Treat Ground-Water Remediation, A Guide for Decision Makers and Practitioners. EPA/625/R-95/005. Washington, DC: EPA Office of Research and Development.
EPA. 1997. Presumptive Remedy: Supplemental Bulletin Multi-Phase Extraction Technology for VOCs in Soil and Groundwater. Directive No. 9355.0-68FS, EPA 540-F-97-004 PB97-963501. Washington, DC: EPA.
EPA. 1998a. Abstracts of Remediation Case Studies, Volume 3. EPA 542-98-010. Washington, DC: EPA Federal Remediation Technologies Roundtable.
EPA. 1998b. Field Applications of In Situ Remediation Technologies: Chemical Oxidation. EPA 542-R-98-008. Washington, DC: EPA.
EPA. 1998c. Permeable Reactive Barrier Technologies for Contaminant Remediation. EPA/600/R-98/125. Washington, DC: EPA Office of Research and Development and Office of Solid Waste and Emergency Response.
EPA. 1999. Multi-Phase Extraction: State-of-the-Practice. EPA 542-R-99-004. Washington, DC: EPA.
EPA. 2000. Abstracts of Remediation Case Studies, Volume 4. EPA 542-R00-006. Washington, DC: EPA Federal Remediation Technologies Roundtable.
EPA. 2001. A Citizen’s Guide to Soil Vapor Extraction and Air Sparging. EPA 542-F-01-006. Washington, DC: EPA.
EPA. 2003. Abstracts of Remediation Case Studies, Volume 7. Washington, DC: EPA Federal Remediation Technologies Roundtable.
Falta, R. W., K. Pruess, I. Javandel, and P. A. Witherspoon. 1992. Numerical modelling of steam injection for the removal of nonaqueous phase liquids from the subsurface. I. Numerical formulation. Water Resources Research 28(2):433–449.
Falta, R. W., C. M. Lee, S. E. Brame, E. Roeder, J. T. Coates, C. Wright, A. L. Wood, and C. G. Enfield. 1999. Field test of high molecular weight alcohol flushing for subsurface nonaqueous phase liquid remediation. Water Resources Research 35(7):2095–2108.
Finn, P. S., A. Kane, J. Vidumsky, D. W. Major, and N. Bauer. 2004. In-situ bioremediation of chlorinated solvents in overburden and bedrock using bioaugmentation. In: Bioremediation of Halogenated Compounds. V. S. Magar and M. E. Kelley (eds.). Columbus, OH: Battelle Press.
Fortner, J. D, C. Zhang, J. C. Spain, and J. B. Hughes. 2003. Soil column evaluation of factors controlling biodegradation of DNT in the vadose zone. Environ. Sci. Technol. 37(15):3382–3391.
Fountain, J. C., R. C. Starr, T. Middleton, M. Beikirch, C. Taylor, and D. Hodge. 1996. A controlled field test of surfactant-enhanced aquifer remediation. Ground Water 34(5):910–916.
Freeze, R. A., and J. A. Cherry. 1979. Groundwater. Englewood Cliffs, NJ: Prentice Hall.
Fruchter, J., C. Cole, M. Williams, V. Vermeul, J. Amonette, J. Szecsody, J. Istok, and M. Humphrey. 2000. Creation of a subsurface permeable treatment barrier using in situ redox manipulation. Ground Water Monitor. Rev. 66–77.
Gallo, C., and G. Manzini. 2001. A fully coupled numerical model for two-phase flow with contaminant transport and biodegradation kinetics. Communications in Numerical Methods in Engineering 17:325–336.
Gandhi, R. K., G. D. Hopkins, M. N. Goltz, S. M. Gorelick, and P. L. McCarty. 2002. Full-Scale demonstration of in situ cometabolic biodegradation of trichloroethylene in groundwater. II. Comprehensive analysis of field data using reactive transport modeling. Water Resources Research 38:1040.
Gates, D. D., and R. L. Siegrist. 1995. In situ chemical oxidation of trichloroethylene using hydrogen peroxide. J. Environ. Eng. September:639–644.
Gates-Anderson, D. D., R. L. Siegrist, and R. L. Cline. 2001. Comparison of potassium permanganate and hydrogen peroxide as chemical oxidants for organically contaminated soils. ASCE Journal of Environmental Engineering 127(4):337–347.
Gauglitz, R. A., J. S. Roberts, T. M. Bergsman, R. Schalla, S. M.Caley, M. H. Schlender, W. O. Heath, T. R. Jarosch, M. C. Miller, C. A. Eddy Dilek, R. W. Moss, and B. B. Looney. 1994. Six-phase soil heating for enhanced removal of contaminants: volatile organic compounds in non-arid soils integrated demonstration, Savannah River Site, PNL-101 84. Battelle Pacific Northwest Laboratory.
GeoSyntec Consultants. 2004. Assessing the Feasibility of DNAPL Source Zone Remediation: Review of Case Studies. Port Hueneme, CA: Naval Facilities Engineering Service Center.
Glaze, W. H., and J. W. Kang. 1988. Advanced oxidation processes for treating groundwater contaminated with TCE and PCE: laboratory studies. J. Amer. Water Works 80(5):57–63.
Gordon, M. J. 1998. Case history of a large-scale air sparging soil vapor extraction system for remediation of chlorinated volatile organic compounds in ground water. Ground Water Monitoring and Remediation 18(2):137–149.
Ground-Water Remediation Technology Analysis Center (GWRTAC). 1999. In situ chemical oxidation. Technology Evaluation Report TE-99-01. http://www.gwrtac.org.
Harvey, A. H., M. D. Arnold, and S. A. El-Feky. 1979. Selective electric reservoir heating. J. Cdn. Pet. Tech. (July–Sept. 1979):45–47.
Hasegawa, M. H., B. J. Shiau, D. A. Sabatini, R. C. Knox, J. H. Harwell, R. Lago, and L. Yeh. 2000. Surfactant-enhanced subsurface remediation of DNAPLs at the former Naval Air Station Alameda, California. Pp. 219–226 In: Treating Dense Nonaqueous-Phase Liquids (DNAPLs). G. B. Wickramanayake, A. R. Gavaskar, and N. Gupta (eds.). Columbus, OH: Battelle Press.
He, J., K. M. Ritalahti, M. R. Aiello, and F. E. Loeffler. 2003. Complete detoxification of vinyl chloride by an anaerobic enrichment culture and identification of the reductively dechlorinating population as a Dehalococcoides species. Appl. Environ. Microbiol. 69(2):996–1003.
Hirasaki, G. J., C. A. Miller, R. Szafranski, D. Tanzil, J. B. Lawson, H. Meinardus, M. Jin, R. E. Jackson, G. Pope, and W. H. Wade. 1997. Field demonstration of the surfactant/foam process for aquifer remediation. In: Proceedings - SPE Annual Technical Conference, San Antonio, TX, SPE 39292.
Holmberg, K., B. Jonsson, B. Kronberg, and B. Lindman. 2003. Surfactants and Polymers in Aqueous Solution. 2nd ed. New York: Wiley.
Holzmer, F. J., G. A. Pope, and L. Yeh. 2000. Surfactant-enhanced aquifer remediation of PCE-DNAPL in low permeability sands. Pp. 187–193 In Treating Dense Nonaqueous-Phase Liquids (DNAPLs). G. B. Wickramanayake, A. R. Gavaskar, and N. Gupta (eds.). Columbus, OH: Battelle Press.
Hood, E. D., and N. R. Thomson. 2000. Numerical simulation of in situ chemical oxidation. In: Proceedings from the Second International Conference on Remediation of Chlorinated and Recalcitrant Compounds, Monterey, CA, May 22-25, 2000.
Hood, E. D., N. R. Thomson, D. Grossi, and G. J. Farquhar. 1999. Experimental determination of the kinetic rate law for oxidation of perchloroethylene by potassium permanganate. Chemosphere 40(12):1383–1388.
Hossain, M. A., and M. Y. Corapcioglu. 1996. Modeling primary substrate controlled biotransformation and transport of halogenated aliphatics in porous media. Transport in Porous Media 24(2):203–220.
Huang, K. C., G. E. Hoag, P. Chheda, B.A. Woody, and G. M. Dobbs. 1999. Kinetic study of oxidation of trichloroethylene by potassium permanganate. Environ. Eng. Sci. 16(4):265–274.
Huang, K. C., G. E. Hoag, P. Chheda, B. A. Woody, and G. M. Dobbs. 2002. Kinetics and mechanism of oxidation of tetrachloroethylene with permanganate. Chemosphere 46(6):815–825.
Hundal L., J. Singh, E. L. Bier, P. J. Shea, S. D. Comfort, and W. L. Powers. 1997. Removal of TNT and RDX from water and soil using iron metal. Environ. Pollut. 97:55–64.
Hunt, J. R., N. Sitar, and K. S. Udell. 1988. Nonaqueous phase liquid transport and cleanup. I. Analysis of mechanisms. Water Resources Research 24(8):1247.
Illangasekare, T. H., and D. D. Reible. 2001. Pump-and-treat remediation and plume containment: applications, limitations, and relevant processes. Pp. 79–119 In: Groundwater Contamination by Organic Pollutants: Analysis and Remediation. Reston, VA: American Society of Civil Engineers.
Interstate Technology and Regulatory Council (ITRC). 2001. Technical and regulatory guidance for in situ chemical oxidation of contaminated soil and groundwater. Washington, DC: ITRC In Situ Chemical Oxidation Work Team.
ITRC. 1998. Technical and regulatory requirements for enhanced in situ bioremediation of chlorinated solvents. Washington, DC: ITRC In Situ Bioremediation Subgroup.
Isalou, M., B. E. Sleep, and S. N. Liss. 1998. Biodegradation of high concentrations of tetrachloroethene in a continuous column system. Environ. Sci. Technol. 32(22):3579–3585.
Jackson, R. E.; V. Dwarakanath, H. W. Meinardus, C. M. Young. 2003. Mobility control: how injected surfactants and biostiumulants may be forced into low-permeability units. Remediation, Summer:59–66.
Jawitz, J. W., M. D. Annable, P. S. C. Rao, and R. D. Rhue. 1998. Field implementation of a Winsor Type I surfactant/alcohol mixture for in situ solubilization of a complex LNAPL as a single-phase microemulsion. Environ. Sci. Technol. 32(4):523–530.
Jayanti, S., and G. A. Pope. 2004. Modeling the benefits of partial mass reduction in DNAPL source zones. In: Proceedings of the Fourth International Conference on Remediation of Chlorinated and Recalcitrant Compounds, Monterey, CA, May 24-27, 2004.
Jayanti, S., L. N. Britton, V. Dwarakanath, and G. A. Pope. 2002. Laboratory evaluation of custom designed surfactants to remediate NAPL source zones. Environ. Sci. Technol. 36(24):5491–5497.
Jeong, S.-W., A. L. Wood, and T. R. Lee. 2002. Enhanced contact of cosolvent and DNAPL in porous media by concurrent injection of cosolvent and air. Environ. Sci. Technol. 36:5238–5244.
Ji, W. A., A. Dahmani, D. Ahlfeld, J. D. Lin, and E. Hill. 1993. Laboratory study of air sparging: air flow visualization. Ground Water Monitor. Remed., Fall:115–126.
Johnson, P. C., R. L. Johnson, C. L. Bruce, and A. Leeson. 2001. Advances in in situ air sparging/ biosparging. Bioremediation Journal 5(4):251–266.
Kastner, J. R., J. A. Domingo, M. Denham, M. Molina, and R. Brigmon. 2000. Effect of chemical oxidation on subsurface microbiology and trichloroethene (TCE) biodegradation. Bioremediation Journal 4(3):219–236.
Kim, H., H.-E. Soh, M. D. Annable, D.-J. Kim. 2004. Surfactant-enhanced air sparging in saturated sand. Environ. Sci. Technol. 38(4):1170–1175.
Knauss, K. G., M. J. Dibley, R. N. Leif, D. A. Mew, and R. D. Aines. 1999. Aqueous oxidation of trichloroethene (TCE): a kinetic analysis. Applied Geochemistry 14:531–541.
Knox, R. C., B. J. Shiau, D. A. Sabatini, and J. H. Harwell. 1999. Field Demonstration of Surfactant Enhanced Solubilization and Mobilization at Hill Air Force Base, UT. Pp. 49–63 In: Innovative Subsurface Remediation: Field Testing of Physical, Chemical and Characterization Technologies. M. L. Brusseau, D. A. Sabatini, J. S. Gierke and M. D. Annable (eds.). American Chemical Society Symposium Series 725. Washington, D.C.: ACS.
Lee, E. S., Y. Seol, Y. C. Fang, and F. W. Schwartz. 2003. Destruction efficiencies and dynamics of reaction fronts associated with the permanganate oxidation of trichloroethylene. Environ. Sci. Technol. 37:2540–2546.
Lee, M. D., J. M. Odom, and R. J. Buchanan Jr. 1998. New perspectives on microbial dehalogenation of chlorinated solvents. Annu. Rev. Microbiol. 52:423–425.
Leeson, A., P. C. Johnson, R. L. Johnson, C. M. Vogel, R. E. Hinchee, M. Marley, T. Peargin, C. L. Bruce, I. L. Amerson, C. T. Coonfare, R. D. Gillespie, and D. B. McWhorter. 2002. Air sparging design paradigm. ESTCP technical document CU-9808. Washington, DC: ESTCP.
Li, Z. M., S. D. Comfort, and P .J. Shea. 1997. Destruction of 2,4,6-Trinitrotoluene (TNT) by Fenton Oxidation. J. Environ. Qual. 26:480–487.
Liang, S., L. S. Palencia, R. S. Yates, M. K. Davis, J.-M. Bruno, and R. L. Wolfe. 1999. Oxidation of MTBE by ozone and peroxone processes. J. Amer. Water Works Assoc. 91(6):104–114.
Liang, S., R. S. Yates, D. V. Davis, S. J. Pastor, L. S. Palencia, and J. M. Bruno. 2001. Treatability of MTBE contaminated groundwater by ozone and peroxone. J. Amer. Water Works Assoc. 93:110–120.
Liang, C., C. J. Bruell, M. C. Marley, and K. L. Sperry. 2003. Thermally activated persulfate oxidation of trichloroethylene (TCE) and 1,1,1-trichloroethane (TCA) in aqueous systems and soil slurries. Soil & Sediment Contamination 12(2):207–228.
Londergan, J. T., H. W. Meinardus, P. E. Mariner, R. E. Jackson, C. L. Brown, V. Dwarakanath, G. A. Pope, J. S. Ginn, and S. Taffinder. 2001. DNAPL Removal from a Heterogeneous Alluvial Aquifer by Surfactant-Enhanced Aquifer Remediation. Ground Water Monitoring and Remediation, Fall:57–67.
Lundegard, P. D., and G. Andersen. 1996. Multi-phase numerical simulation of air sparging performance. Groundwater 34 (3):451–460.
Ma, Y., and B. E. Sleep. 1997. Thermal variation of organic fluid properties and impact on thermal remediation feasibility. J. Soil Contamination 6(3):281–306.
MacKinnon, L. K., and N. R. Thomson. 2002. Laboratory-scale in situ chemical oxidation of a perchloroethylene pool using permanganate. J. Contam. Hydrol. 56:49–74.
Major, D. W., M. L. McMaster, E. E. Cox, E. A. Edwards, S. M. Dworatzek, E. R. Hendrickson, M. G. Starr, J. A. Payne, and L. W. Buonamici. 2002. Field demonstration of successful bioaugmentation to achieve dechlorination of tetrachloroethene to ethene. Environ. Sci. Technol. 36:5106–5116.
Malone, D. R., C. M. Kao, and R. C. Borden. 1993. Dissolution and biorestoration of nonaqueous phase hydrocarbons—model development and laboratory evaluation. Water Resources Research 29:2203–2213.
Marley, M. C., L. Fengming, and S. Magee. 1992. The application of a 3-D model in the design of air sparging systems. Ground Water Manag. 14:377–392.
Martel, R., and P. Gelinas. 1996. Surfactant solutions developed for NAPL recovery in contaminated aquifers. Ground Water 34:143–154.
Martel, R., P. J. Gelinas, and L. Saumure. 1998. Aquifer washing by micellar solutions: field test at the Thouin Sand Pit, L’Assomption, Quebec, Canada. Journal of Contaminant Hydrology 30:33–48.
Mason, A. R., and B. H. Kueper. 1996. Numerical simulation of surfactant-enhanced solubilization of pooled DNAPL. Environ. Sci. Technol. 30(11):3205–3215.
May, I. 2003. Army Environmental Center. Presentation to the Committee on Source Removal of Contaminants in the Subsurface. January 30, 2003.
McCarty, P. L. 1997. Breathing with chlorinated solvents. Science 276:1521–1522.
McCarty, P. L., M. N. Goltz, G. D. Hopkins, M. E. Dolan, J. P. Allan, B. T. Kawakami, and T. J. Carrothers. 1998. Full-scale application of in situ cometabolic degradation of trichloroethylene in groundwater through toluene injection. Environ. Sci. Technol. 32:88–100.
McClure, P., and B. E. Sleep. 1996. Simulation of bioventing for remediation of organics in groundwater. ASCE. J. Env. Eng. 122(11):1003–1012.
McCormick, N. G., J. H. Cornell, and A. M. Kaplan. 1981. Biodegradation of hexahydro-1,3,5-trinitro-1,3,5-triazine. Appl. Environ. Microbiol. 42:817–823.
McCormick, N. G., J. H. Cornell, and A. M. Kaplan. 1985. The anaerobic biotransformation of RDX, HMX and their acetylated derivatives. AD Report A149464 (TR85-007). Natick, MA: U.S. Army Natick Research and Development Center.
McCray, J. E., and R. W. Falta. 1997. Numerical Simulation of Air Sparging for Remediation of NAPL. Ground Water 35(1):99–110.
McGee, B. C. W., F. E. Vermeulen, P. K. W. Vinsome, M. R. Buettner, and F. S. Chute. 1994. In-situ decontamination of soil. The Journal of Canadian Petroleum Technology, October:15–22.
McGee, B. C. W., B. Nevokshonoff, and R. J. Warren. 2000. Electrical heating for the removal of recalcitrant organic compounds. In: Proceedings of the Second International Conference on Remediation of Chlorinated and Recalcitrant Compounds, Monterey, CA, May 22–25, 2000.
Meinardus, H. W., V. Dwarakanath, J. Ewing, K. D. Gordon, G. J. Hirasaki, C. Holbert, and J. S. Ginn. 2002. Full-scale field application of surfactant-foam process for aquifer remediation. In: Proceedings of the Third International Conference on Remediation of Chlorinated and Recalcitrant Compounds, Monterey, CA, May 20–23, 2002.
Morgan, D., D. Bryant, and K. Coleman. 2002. Permanganate chemical oxidation used in fractured rock. Ground Water Currents Issue 43.
Morse, J.J., B. C. Alleman, J. M. Gossett, S. H. Zinder, D. E. Fennell, G. W. Sewell, and C. M. Vogel. 1998. Draft technical protocol—a treatability test for evaluating the potential applicability of reductive biological in situ treatment technology to remediate chloroethenes. Washington, DC: DOD Environmental Security Technology Certification Program.
Myers, D. 1999. Surfaces, Interfaces, and Colloids, Principles and Applications. 2nd ed. New York: Wiley-VCH.
Nash, J. H. 1987. Field Studies of In-Situ Soil Washing. EPA/600/2-87/110. Cincinnati, OH: U.S. Environmental Protection Agency.
National Research Council (NRC). 1993. In Situ Bioremediation: When Does it Work? Washington, DC: National Academy Press.
NRC. 1994. Alternatives for Ground Water Cleanup. Washington, DC: National Academy Press.
NRC. 1997. Innovations in Ground Water and Soil Cleanup: From Concept to Commercialization. Washington, DC: National Academy Press.
NRC. 1999. Groundwater Soil Cleanup. Washington, DC: National Academy Press.
NRC. 2000. Natural Attenuation for Groundwater Remediation. Washington, DC: National Academy Press.
NRC. 2003. Environmental Cleanup at Navy Facilities: Adaptive Site Management. Washington, DC. National Academies Press.
NAVFAC. 1999. In-situ chemical oxidation of organic contaminants in soil and groundwater using Fenton’s Reagent. TDS-2071-ENV. Port Hueneme, CA: Naval Facilities Engineering Service Center.
Naval Facilities Engineering Service Center (NFESC). 2002. Surfactant-Enhanced Aquifer Remediation (SEAR) Design Manual. NFESC Technical Report TR-2206-ENV. Battelle and Duke Engineering and Services. http://enviro.nfesc.navy.mil/erb/erb_a/restoration/technologies/remed/phys_chem/sear/tr-2206-sear.pdf
Nielsen, R. B., and J. D. Keasling. 1999. Reductive dechlorination of chlorinated ethene DNAPLs by a culture enriched from contaminated groundwater. Biotechnology and Bioengineering 62:162–165.
Nyer, L. K., and D. Vance. 1999. Hydrogen peroxide treatment: the good, the bad, the ugly. Ground Water Monitoring and Remediation 19(3):54–57.
O’Haver, J. H., R. Walk, B. Kitiyanan, J. H. Harwell, and D. A. Sabatini. 2004. Packed column and hollow fiber air stripping of a contaminant-surfactant stream. Journal of Environmental Engineering ASCE 130(1):4–11.
Pennington, J. C., M. Zakikhani, and D. W. Harrelson. 1999. Monitored natural attenuation of explosives in groundwater—Environmental Security Technology Certification Program Completion Report. Technical Report EL-99-7. Vicksburg, MS: U.S. Army Corps of Engineers, Waterways Experiment Station.
Philip, J. R. 1998. Full and boundary-layer solutions of the steady air sparging problem. J. Contam. Hydrol. 33(3–4):337–345.
Poston, S. W., S. Ysrael, A. K. M. S. Hossain, E. F. Montgomery III, and H. J. Ramey, Jr. 1970. The effect of temperature on irreducible water saturation and relative permeability of unconsolidated sands. Soc. Pet. Eng. J., June:171–180.
Rabideau, A. J., and J. M. Blayden. 1998. Analytical model for contaminant mass removal by air sparging. Ground Water Monitor. Remed. 18(4):120–130.
Ramsburg, C. A., and K. D. Pennell. 2002. Density-modified displacement for DNAPL source zone remediation: density conversion and recovery in heterogeneous aquifer cells. Environ. Sci. Technol. 36 (14):3176–3187.
Rao, P. S. C., A. G. Hornsby, D. P. Kilcrease, and P. Nkedi-Kizza. 1985. Sorption and transport of hydrophobic organic chemicals in aqueous and mixed solvent systems: model development and preliminary evaluation. Journal of Environmental Quality 14(3):376–383.
Rao, P. S. C., M. D. Annable, R. K. Sillan, D. Dai, K. Hatfield, W. D. Graham, A. L. Wood, and C. G. Enfield. 1997. Field-scale evaluation of in situ cosolvent flushing for enhanced aquifer remediation. Water Resources Research 33(12):2673–2686.
Rao, P. S. C., H. W. Jawitz, C. G. Enfield. R. W. Falta, Jr., M. D. Annable, and A. L. Wood. 2001. Technology integration for contaminated site remediation: cleanup goals and performance criteria. Presented at Groundwater Quality 2001, Sheffield, UK, June 18–21, 2001.
Rathfelder, K. M., L. M. Abriola, T. P. Taylor, and K. D. Pennell. 2001. Surfactant enhanced recovery of tetrachloroethylene from a porous medium containing low permeability lenses. II. Numerical simulation. Journal of Contaminant Hydrology 48(3–4):351–374.
Ravikumar, J. X., and M. D. Gurol. 1994. Chemical oxidation of chlorinated organics by hydrogen peroxide in the presence of sand. Environ. Sci. Technol. 28(3):395–400.
Reitsma, S., and Q. Dai. 2000. Reaction-enhanced mass transfer from NAPL pools. In: Proceedings from the Second International Conference on Remediation of Chlorinated and Recalcitrant Compounds, Monterey, CA, May 22–25, 2000.
Rice, B. N., and R. F. Weston. 2000. Lessons learned from a dual-phase extraction field application. Pp. 93–100 In: Physical and Thermal Technologies: Remediation of Chlorinated and Recalcitrant Compounds. G. B. Wickramanayake and A. R. Gavaskar (eds.). Proceedings of the Second International Conference on Remediation of Chlorinated and Recalcitrant Compounds. Columbus, OH: Battelle Press.
Richardson, R. E., C. A. James, V. K. Bhupathiraju, and L. Alvarez-Cohen. 2002. Microbial activity in soils following steam exposure. Biodegradation 13(4):285–295.
Rieger, P. G., and H. J. Knackmuss. 1995. Basic knowledge and perspectives on biodegradation of 2,4,6-trinitrotoluene and related nitroaromatic compounds in soil. In: Biodegradation of Nitroaromatic Compounds. J. C. Spain (ed.). New York: Plenum Press.
Rosen, M. J. 1989. Surfactants and Interfacial Phenomena. 2nd ed. New York: Wiley.
Rubingh, D. 2003. Presentation to the NRC Committee on Source Removal of Contaminants in the Subsurface. April 14, 2004. Washington, DC.
Sabatini, D. A., J. H. Harwell, M. Hasegawa, and R. C. Knox. 1998. Membrane processes and surfactant-enhanced subsurface remediation: results of a field demonstration. Journal of Membrane Science 151(1):89–100.
Sabatini, D. A., J. H. Harwell, and R. C. Knox. 1999. Surfactant selection criteria for enhanced subsurface remediation. In: Innovative Subsurface Remediation: Field Testing of Physical, Chemical and Characterization Technologies. M. L. Brusseau, D. A. Sabatini, J. S. Gierke and M. D. Annable (eds.). ACS Symposium Series 725. Washington, DC: American Chemical Society.
Sabatini, D. A., R. C. Knox, J. H. Harwell, and B. Wu. 2000. Integrated design of surfactant enhanced DNAPL remediation: effective supersolubilization and gradient systems. Journal of Contaminant Hydrology 45(1):99–121.
Schnarr, M., C. Truax, G. Farquhar, E. Hood, T. Gonullu, and B. Stickney. 1998. Laboratory and controlled field experiments using potassium permanganate to remediate trichloroethylene and perchloroethylene DNAPLs in porous media. J. Contam. Hydrol. 29:205–224.
Schroth, M. H., M. Oostrom, T. W. Wietsma, and J. D. Istok. 2001. In-situ oxidation of trichloroethene by permanganate: effects on porous medium properties. J. Contam. Hydrol. 50:79–98.
Seagren, E. A., B. E. Rittmann, and A. J. Valocchi. 1994. Quantitative evaluation of the enhancement of NAPL-pool dissolution by flushing and biodegradation. Environ. Sci. Technol. 28:833–839.
Semprini, L., and P. L. McCarty. 1991. Comparison between model simulations and field results for in-situ biorestoration of chlorinated aliphatics. I. Biostimulation of methanotrophic bacteria. Ground Water 29:365–374.
Semprini, L., and P. L. McCarty. 1992. Comparison between model simulations and field results for in-situ biorestoration of chlorinated aliphatics. II. Cometabolic transformations. Ground Water 30:37–44.
She, Y., and B. E. Sleep. 1998. The effect of temperature on capillary pressure-saturation relationships for air-water and perchloroethylene-water systems. Water Resources Research 34(10):2587–2597.
She, H., and B. E. Sleep. 1999. Removal of PCE from soil by steam flushing in a two-dimensional laboratory cell. Ground Water Monitoring and Remediation 19(2):70–77.
Shiau, B. J., J. M. Brammer, D. A. Sabatini, J. H. Harwell, and R. C. Knox. 2003. Recent Development of In Situ Surfactant Flushing and Case Studies for NAPL-impacted Site Closure and Remediation. Pp. 92–106 In: Proceedings of 2003 Petroleum Hydrocarbon and Organic Chemicals in Ground Water: Prevention, Assessment and Remediation. National Ground Water Association, August 19-22, 2003, Costa Mesa, CA.
Siegrist, R. L., K. S. Lowe, L. C. Murdoch, T. L. Case, and D. A. Pickering. 1999. In situ oxidation by fracture emplaced reactive solids. ASCE J. Env. Eng. 125(5):429–440.
Sinnokrot, A. A., H. J. Ramey Jr., and S. S. Marsden Jr. 1971. Effect of temperature level upon capillary pressure curves. Soc. Petroleum Engrs. J. 11:13–22.
Sleep, B. E. 1993. Modelling and laboratory investigations of steam flushing below the water table. Groundwater 31(5):831.
Sleep, B. E., L. Sehayek, and, C. Chien. 2000. A modeling and experimental study of LNAPL accumulation in wells and LNAPL recovery from wells. Water Resources Research 36(12):3535–3546.
Song, D. L., M. E. Conrad, K. S. Sorenson, and L. Alvarez-Cohen. 2002. Stable carbon isotopic fractionation during enhanced in-situ bioremediation of trichloroethylene. Environ. Sci. Technol. 36(10):2262–2268.
Speitel, G. E., T. L. Engels, and D. C. McKinney. 2001. Biodegredation of RDX in unsaturated soil. Biorem. J. 5:1–11.
Stegemeier, G. L., and H. J. Vinegar. 2001. Thermal conduction heating for in-situ thermal desorption of soils. Pp. 1–37 In: Hazardous and Radioactive Waste Treatment Technologies Handbook. C. H. Oh (ed.). Boca Raton, FL: CRC Press.
Stroo, H. F., M. Unger, C. H. Ward, M. C. Kavanaugh, C. Vogel, A. Leeson, J. Marqusee, and B. Smith. 2004. Remediating chlorinated solvent source zones. Environ. Sci. Technol. 37(11):225A–230A.
Struse, A. M., R. L. Siegrist, H. E. Dawson, and M. A. Urynowicz. 2002. Diffusive transport of permanganate during in situ oxidation. J. Environ. Eng. 128(4):327–334.
Szafranski, R., J. B. Lawson, G. J. Hirasaki, C. A. Miller, N. Akiya, S. King, R. E. Jackson, H. Meinardus, and J. Londergan. 1998. Surfactant/foam process for improved efficiency of aquifer remediation. Progr. Colloid Polym. Sci. 111:162–167.
Tarr, M. A., M. E. Lindsey, J. Lu, and G. Xu. 2000. Fenton oxidation: bringing pollutants and hydroxyl radicals together. In: Proceedings from the Second International Conference on Remediation of Chlorinated and Recalcitrant Compounds, Monterey, CA, May 22-25, 2000.
Travis, B. J., and N. D. Rosenberg. 1997. Modeling in situ bioremediation of TCE at Savannah River: effects of product toxicity and microbial interactions on TCE degradation. Environ. Sci. Technol. 31:3093–3102.
U.S. Department of Energy (DOE). 1999. In Situ Chemical Oxidation Using Potassium Permanganate. Innovative Technology Summary Report. DOE/EM-0496. Washington, DC: DOE Subsurface Contaminants Focus Area, Office of Environmental Management, Office of Science and Technology.
U.S. Department of Energy (DOE). 2000. Hydrous pyrolysis Oxidation/Dynamic Underground Stripping. Innovative Technology Summary Report, DOE/EM-054. Washington, DC: DOE.
van-Dijke, M. I. J., and S. E. A. T. M. Van der Zee. 1998. Modeling of air sparging in a layered soil: numerical and analytical approximations. Water Resources Research 34 (3):341–353.
van-Dijke, M. I. J., S. E. A. T. M. Van der Zee, and C. J. Van Duijn. 1995. Multi-phase flow modeling of air sparging. Advan. Water Resour. 18(6):319–333.
Vermeulen, F. E., F. S. Chute, and M. R. Cervenan. 1979. Physical modelling of the electromagnetic heating of oil sand and other earth-type and biological materials. Canadian Electrical Engineering Journal 4(4):19–28.
Vinegar, H. J., E. P. de Rouffignac, G. L. Stegemeier, J. M. Hirsch, and F. G. Carl. 1998. In situ thermal desorption using thermal wells and blankets. In: The Proceedings of the First International Conference on Remediation of Chlorinated and Recalcitrant Compounds. G. B. Wickramanayake and R. E. Hinchee (eds.). Physical, Chemical and Thermal Technologies. Monterey, California, May 18–21, 1998.
Vinsome, P. K. W., B. C. W. Mcgee, F. E. Vermeulen, and F. S. Chute. 1994. Electrical heating. Journal of Canadian Petroleum Technology 33(9):29–35.
Wattenbarger, R. A., and F. McDougal. 1988. Oil response to in-situ electrical resistance heating (ERH). Journal of Canadian Petroleum Technology 27(6):45–50.
Watts, R. J., M. D. Udell, S. Kong, and S. W. Leung. 1999. Fenton-like soil remediation catalyzed by naturally occurring iron minerals. Environ. Eng. Sci. 16(1):93–103.
White, P. D., and J. T. Moss. 1983. Thermal Recovery Methods. Oklahoma: PennWell Books.
Yan, Y. E, and F. Schwartz. 1999. Oxidative degradation and kinetics of chlorinated ethylenes by potassium permanganate. J. Contam. Hydrol. 37(3):343–365.
Yang, Y. R., and P. L. McCarty. 1998. Competition for hydrogen within a chlorinated solvent dehalogenating anaerobic mixed culture. Environ. Sci. Technol. 32:3591–3597.
Yang, Y., and McCarty, P. L. 2000. Biologically enhanced dissolution of tetrachloroethene DNAPL. Environ. Sci. Technol 34:2979–2984.
Zhang, H., and R W. Schwartz. 2000. Simulation of oxidative treatment of chlorinated compounds by permanganate. In: Proceedings from the Second International Conference on Remediation of Chlorinated and Recalcitrant Compounds, Monterey, CA, May 22–25, 2000.
Zoh, K., and K. D. Stenstrom. 2002. Fenton oxidation of hexahydro-1,3,5-trinitro-1,3,5-triazine (RDX) and octahydro-1,3,5,7-tetranitro-1,3,5,7-tetrazocine (HMX). Water Res. 36:1331–1341.


