
1
INTRODUCTION
A survey of likely geoscience map users was conducted by the Board on Earth Sciences (BES) of the National Research Council (NRC) to ascertain current and anticipated future geoscience map needs in the United States, and the relative importance of various map types. The survey was motivated by concern expressed to members of the board regarding an apparent progressive decrease in the publication rate of geologic maps at a time when the need for these maps seemed to be increasing. A Committee on Geologic Mapping was established by the BES and charged with determining the importance of not only geologic, but all geoscience maps among the user community, including current and future needs, relative importance of scale, and relative needs for specific map types. In addition, the committee was charged with evaluating problems facing map producers (generators and publishers). This report addresses only the first charge to the committee.
SURVEY SAMPLING
A questionnaire survey was designed by the committee with suggestions from a large number of individuals and organizations, including representatives from the mineral and energy resource industry and earth science associations, planners in the private and government sectors, the U.S. Geological Survey (USGS), and state geological surveys, and from professional questionnaire designers. The questionnaire (Appendix A) was sent to a sample population developed from the membership lists of nine scientific and professional organizations, whose members are known to be users of geologic maps. All known professional geoscience map-user groups are represented in the sample population.
The associations, the size of their U.S. resident, non-student membership (as of 1983), and the general topical interest(s) of their members as it relates to geoscience maps are listed below. Only those members who are U.S. residents and nonstudents were included in the population from which the sample was drawn. A sample representing 3 percent of the population was drawn by selecting the thirty-third name and multiples thereof from each of the membership lists. If the name selected on a given membership list had already been selected from a previous list, the next name on that list was selected.
|
American Association of Petroleum Geologists |
24,133 |
|
All aspects of the geologic sciences related to the petroleum industry |
|
|
Association of Engineering Geologists |
2,233 |
|
Engineering geology |
|
|
American Institute of Certified Planners |
4,667 |
|
Applied geology (geoscience) as it relates to urban and regional planning |
|
|
American Water Resources Association |
1,933 |
|
Primarily applied groundwater |
|
|
Geological Society of America |
9,800 |
|
All aspects of the geologic sciences, especially basic research |
|
|
Society of Exploration Geophysicists |
10,500 |
|
Applied geophysics, largely related to the petroleum industry |
|
|
Society of Economic Geologists |
1,700 |
|
Geology related to mineral deposits and mineral exploration |
|
|
Society of Economic Paleontologists and Mineralogists |
3,967 |
|
Primarily basic problems in stratigraphy and paleontology |
|
|
Society of Mining Engineers |
19,000 |
|
Engineers and geologists engaged in work related to mining and the mineral industry |
|
|
TOTAL |
77,933 |
The decision on the sample size was based upon the desire for a response accuracy on the order of 3 percent in estimating proportions for the entire population at the 95 percent confidence level. Such a response accuracy would require a return of approximately 1100 forms. Assuming a response rate of 50 percent, about 2200 forms would have to be distributed. A total of 2388 questionnaires
were mailed. An additional 341 questionnaires were subsequently mailed to alternate recipients to compensate for questionnaires that were returned unanswered. A second follow-up mailing was made to nonrespondents to the initial mailings and phone calls were made to nonrespondents of the second mailing. A total of 1083 forms were returned out of a distribution of 2388, giving a response of just over 45 percent.
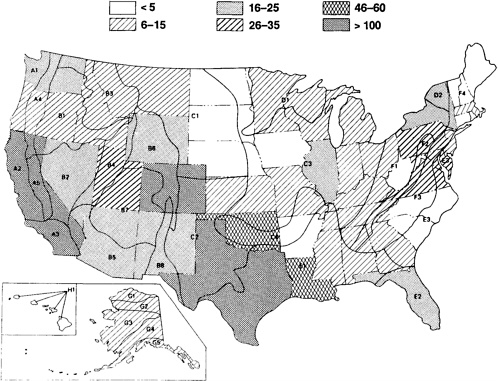
The numbers of questionnaires sent and returned are listed by association in Table 1 (Appendix B; all tables are included in Appendixes B through G). The geographic distribution, by state, of questionnaire respondents is given in Table 2 and Figure 1. Almost one-half (46 percent) of the respondents are located in three states: Texas (20 percent), Colorado (14 percent), and California (12 percent). Oklahoma has an additional 5 percent, and Louisiana 4 percent. All other states have less than 3 percent respondents each. This apparent geographic imbalance of map users strongly reflects the home location of the energy and mineral resource geologists, and geohazard and planning specialists. The location of the respondents, however, does not necessarily reflect the locations where geoscience map needs have been determined to be the greatest.
QUESTIONNAIRE FORMAT
The questionnaire format was designed to acquire information in four main areas that readily could be integrated and analyzed. The four areas are as follows:
-
Personal background information on the respondents’ organizations and uses to which they put geoscience maps.
-
The importance of various physical map requirements, namely, format, scale, and map type.
-
Current and future geologic map needs by geologic-physiographic province and the scales needed in each province.
-
Particular map type(s) most needed and suggestions by respondents for map innovations that would make geoscience maps more useful.
Essay-type questions were used to obtain information for category 4 to allow respondents the opportunity to express their specific needs and opinions. The remainder of the questionnaire was designed for ease of response and to
permit the development of a data base that could be analyzed statistically. Information from the returned questionnaires was entered into a machine-readable data base that forms the basis for this report. The original data base is on file with the Oklahoma Geological Survey and is available for public access.
Of the 1083 returned questionnaires, 501 represented responses not only for an individual, but for his or her organization as well. Of those responding for organizations, 304 were from organizations employing 1 to 5 users of geoscience maps, 180 for 6 to 20 users, 76 for 21 to 100 users; and 35 for those having more than 100 users of geoscience maps. The combined representation from these respondents and the 581 respondents answering only for themselves is estimated conservatively to be more than 12,000 map users (see Table 3).
Questions 5 to 13 (see Appendix A, a duplicate of the questionnaire) were constructed to be answered by the responses “extremely important, moderately important, and not important.” In some cases, a respondent was able to answer to more than one item in a question with one of the three responses. As a result, totals for some questions are greater than the number of respondents. In order to provide consistency in the analytical procedure, the following analysis is based only on the number of “extremely important” responses.


