
2
RESPONDENT INFORMATION
ORGANIZATIONAL GROUP
Collectively, private industry and consultants constitute by far the largest category (66 percent). Federal, state, and local governments were the second largest category (16 percent), and the academic sector was third (13 percent). The remaining 5 percent indicated they were included in the “other” category. These percentage figures are used in this report to analyze responses to other questions in terms of organizational group. The estimated total map users represented, shown in the last column of Table 3, is not used. Even though it represents a larger proportion of the user community than the actual number of respondents shown in column 1, it contains a degree of subjectivity, in that the individual responding for an organization may not accurately represent the views of all individuals in that organization. Use of percentages in the last column instead of those in column 1 would have the greatest effect on comparisons with the private industry and consulting groups.
TYPE OF WORK
The types of work in which respondents are engaged, based on the “extremely important” responses to question 5, are shown in Figure 2. Resource activities (planning, exploration, and development) account for 65 percent of the responses, with exploration accounting for one-half of that amount.
Correlating questions 1 and 5, the type of work (activity) conducted by respondents is given by organizational group in Table 4. In the academic group a not surprising
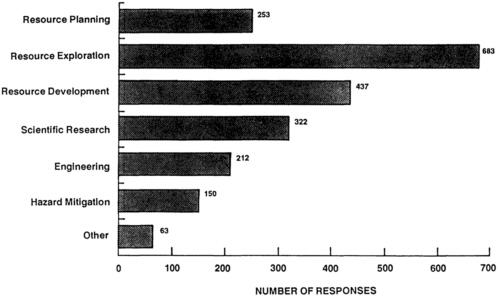
FIGURE 2 Activities respondents consider extremely important to their work.
statistic is that almost one-half of the map usage is in connection with scientific research. However, this group reported 29 percent of its usage of maps was for resource activities, with more than one-half of that amount devoted to exploration. Presumably this usage is in connection with private consulting activities.
The usage of geoscience maps reported by the government group is rather consistent for all categories, with a slight emphasis on scientific research and less emphasis on hazard mitigation. The industry group reported a marked emphasis upon resource activities (76 percent), with about one-half of that amount devoted to resource exploration.
The percentage of the particular activities that are performed by each organizational group is given in Table 5.
RESOURCE TYPE
Figure 3 shows the percentage of respondents engaged in work relating to various resources (coal, groundwater, and so on) correlated with major work activities: exploration, production, research, regulation, and engineering. Responses from the oil and gas industry are more than double
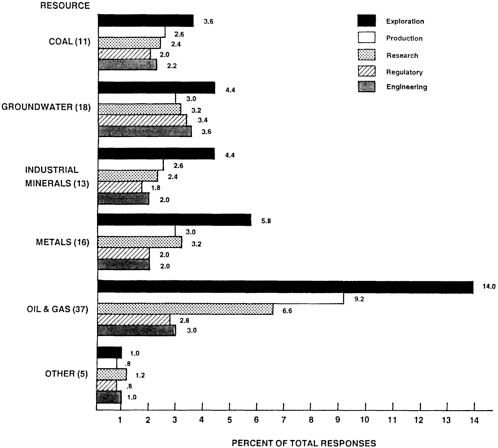
FIGURE 3 Work activity correlated with resource type.
those of the next two most common—groundwater and metals; the latter two are only slightly greater than coal and industrial minerals. In terms of work activity, Figure 3 indicates exploration to be most important regardless of resource type. The distribution of activities in groundwater resource work appears to differ slightly from that in the other categories, having a greater proportion of respondents engaged in regulatory and engineering activities.
FREQUENCY OF MAP USAGE
Table 6 shows the number of maps respondents estimate they use per year. Over 80 percent of the respondents indicated they used one or more geoscience maps annually, and over two-thirds indicated an annual use of between 10
and 500 maps. The sampled population of geoscience map users estimated they used more than 150,000 maps annually. Extrapolation from the number of maps used by the sampled population to the estimated total population of map users indicates the number of geoscience maps used annually in the United States is in excess of 5 million.
Tables 7a and 7b show estimated annual map usage by organizational group and by work activity, respectively. Industry, chiefly by virtue of their being the largest group of respondents, is by far the heaviest user of geoscience maps.
Normalized to a map use per respondent basis, the difference in map use between organizational groups is much smaller, except by local governments, whose map requirements appear to be 30 to 50 percent lower than the other groups. Usage by type of work in which the respondent was engaged shows relatively little variation between the various work activities, with two exceptions. Resource exploration is slightly above average, and the “other” category is notably lower.
SOURCES OF GEOSCIENCE MAPS
Based on the “extremely important” responses, Table 8 and Figure 4 indicate three chief sources of geoscience maps: self-produced with 32 percent, federal government with 31 percent, and state government with 20 percent.
Figure 4a shows the total response to this question, and Figure 4b the data with self-produced maps normalized out. Because it is so important that once a map is made, it be generally available to the user community, the information given in Figure 4b is probably more significant to the purpose of this survey than that given in Table 8 and Figure 4a. Self-produced maps, particularly those produced by private industry, normally do not become available to the user community at large. However, some self-produced maps cited by academia and other organizational groups may eventually be published by state or federal agencies.
Industry relies upon itself for 38 percent of the maps it uses, the highest percentage for any user group. However, it relies upon federal agencies for 27 percent of its map needs and state agencies for 18 percent. Since only about 10 percent of the geologists in the United States who produce geologic maps are employed by federal agencies and 4 percent by state agencies, there is a
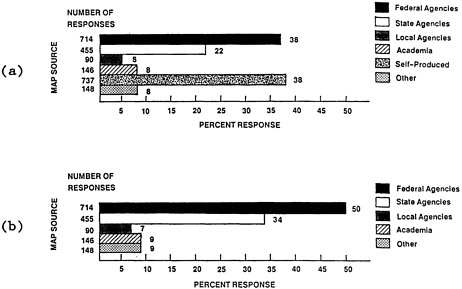
FIGURE 4 Relative importance of geoscience map sources: (a) all data; (b) data normalized to zero self-produced maps.
disproportionate dependence by industry on these agencies. Clearly, federal and state agencies are by far the major sources of geoscience maps that actually reach the user community as a whole, with federal sources relied upon one-half again as much as the combined states’ output.


