
5
Uncertainties Associated with Future Climate Forcings
Climate forcings are bound to evolve over the coming decades due to anthropogenic emissions as well as land-use changes. Scientists have developed methods for projecting future emissions and land-use changes, but limitations in these approaches lead to uncertainties in projections of future climate. Variability in natural processes—including the Sun and the Earth’s orbit around it, volcanism, and internal variability in the climate system—can be even more difficult to project into the future. Nonetheless, making projections of how all of these forcings may manifest themselves enables policy analysts and decision makers to prepare accordingly. In this chapter, current capabilities for projecting future forcings are discussed and critical uncertainties associated with these forcings and their effect on climate are identified.
To date, all model projections of future climate have included a subset of climate forcings, typically greenhouse gas emission scenarios, solar variability, and more recently, aerosol emissions. As the diverse types of radiative and nonradiative climate forcings are recognized (e.g., aerosol indirect effects, changes in land cover), skillful projections of future global and regional climate will need to take them into account, an increasingly challenging task (Pielke Jr., 2001). Addressing this challenge may require a greater focus on assessing key societal and environmental vulnerabilities (Sarewitz et al., 2000).
FUTURE EMISSIONS OF GREENHOUSE GASES AND AEROSOLS
Estimates of future emissions of greenhouse gases, aerosols, and their
precursors are fundamental for all aspects of climate change analysis. Emissions data are needed to drive climate models of the atmosphere, cryosphere, oceans, and biosphere. Scenarios of human-caused emissions are central to policy analysis of climate change because they provide future baseline trends for emissions that policy seeks to alter. The major driving forces of future emissions, such as demographic patterns, economic development, and environmental conditions, also underpin the assessment of vulnerability and development of adaptation strategies.
The available approaches for estimating future emissions to the atmosphere from human activities are described in this section. The methods used to relate emissions to atmospheric concentrations of greenhouse gases and aerosols are discussed in Chapter 6. A category of emissions that is not addressed in detail is volcanic eruptions. Estimating future volcanic emissions is not possible due to limitations in the understanding of the causes of volcanic eruptions, whose frequency depends on the rates of plate motions and of formation of large igneous provinces (see Chapter 3). One can only say, based on past history, that large climate-impacting eruptions will most likely occur, but it is not possible to predict when.
Anthropogenic Emissions
Projecting future emissions differs from other types of prediction that scientists make. Many natural systems, such as planetary motions, are governed by well-understood physical natural laws. The ability to predict future behavior and even events can be impressively high. Other physical systems may have well-understood physical laws, but these laws have shown that long-term prediction is impossible (e.g., chaotic systems). A third category includes systems to which the concept of governing laws expressed by mathematical equations is not applicable (Gaffin, 2002). For these systems, the driving forces change over time, sometimes radically, making prediction of specific outcomes a speculative effort. Many social, political, and economic science systems would fall into this category. Future anthropogenic emissions are a function of such socioeconomic systems and, as a result, are inherently unpredictable. Instead, emissions analysts offer “scenarios” that illustrate possible pathways for future emissions. These scenarios are not ruled out by current understanding of the driving forces behind emissions (Nakićenović et al., 2000). Figures 5-1 and 5-2 show scenarios for carbon dioxide (CO2) and sulfur dioxide (SO2) emissions.
In developing scenarios, it has been standard practice to consider futures with a range of policy interventions. On one end of the spectrum are noninterventionist emissions scenarios, which have been variously named business as usual, normative, reference, and no climate policy, among other terms. These scenarios seek to answer the policy question, How would
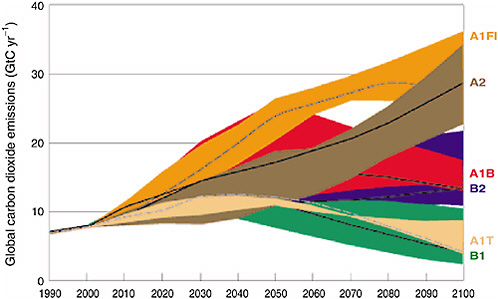
FIGURE 5-1 Global CO2 emissions (billion tons of carbon per year) from all sources for the four scenario families (A1, A2, B1, B2) from the Intergovernmental Panel on Climate Change (IPCC) Special Report on Emissions Scenarios (SRES). The four scenario families had different assumptions about population, technological and land-use changes, and gross domestic product (GDP) growth rates. Each colored band represents the range of results for each scenario from the six emissions models used in the SRES report. Within any one scenario family, the emissions models all used the same scenario-specific global input assumptions for population and GDP growth. SOURCE: Nakićenović et al. (2000).
climate be affected if society takes no further policy steps to stem emissions and allows the driving forces behind emissions to take their course? It appears that none of the names are fully satisfactory and without ambiguities (Nakićenović et al., 2000). For example, “business as usual” does not convey that scenarios address economic and technology changes over a century time frame. Noninterventionist, the currently preferred term, also requires clarification because society is currently taking some steps, such as vehicular mileage standards and hybrid car marketing and research, that could be interpreted as climate policy.
Emissions scenarios that take account of policy intervention include those in which greenhouse gas concentrations are stabilized and cost-benefit scenarios. Stabilization scenarios are associated with atmospheric targets that policy makers often consider as long-term goals (IPCC, 1996;
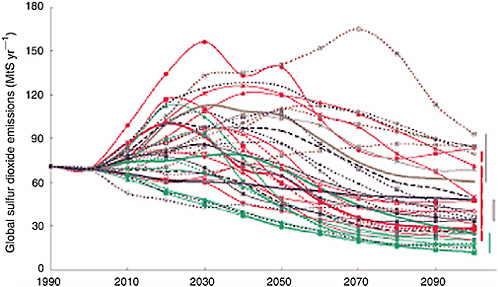
FIGURE 5-2 Global SO2 emissions (million tons of sulfur per year) for the four SRES scenarios families and from each of the emissions models. Red lines correspond to the A1 family of scenarios, brown lines to A2, green lines to B1, and blue lines to B2. These emissions, along with the ozone precursor emissions of methane, carbon monoxide, nitrogen oxides, and volatile organic compounds, were also gridded onto 1° × 1° latitude-longitude maps for use in global climate, atmospheric chemistry, and air quality models. The grids were developed using simple scaling applied to a base-year 1990 map and using the projected four to six regional changes from the SRES emissions models. SOURCE: Nakićenović et al. (2000).
Workshop on GHG Stabilization Scenarios, 2004). Such targets can easily be inverted by carbon cycle models to determine the required emissions scenario for stabilization (e.g., Wigley, 1991). Cost-benefit scenarios are another approach. They are based on the premise that the most efficient policy intervention is that in which the marginal cost of reducing emissions is balanced by the marginal reduction in climate damages, measured in monetary terms (Cline, 1992).
Developing emissions scenarios is tantamount to asking how different societies will produce, transform, and consume energy; extract and use Earth’s resources; and modify the landscape for the next century. The possible answers to this vast and complex question are manifold. Uncertainties arise in all facets of the problem of building long-term scenarios. Moreover, unforeseen events, such as a revolutionary breakthrough in tech-
nology or a geopolitical shift, could occur and radically alter future emissions.
Methods for Developing Emissions Scenarios
Most emissions scenarios are developed using the IPAT model (Ehrlich and Holdren, 1971) in which environmental impact is the result of a multiplication of three driving forces: population, affluence per person, and technological impact per unit of affluence. When applied to greenhouse gas emissions, the impact is the rate of greenhouse gas emissions, while the technological factor is the rate of greenhouse gas emissions per unit of gross domestic product (GDP). The IPAT model has a long history in environmental studies, and there has been much debate over whether it is the proper approach (Chertow, 2001). As a purely mathematical multiplicative identity, it must yield correct emissions rates if all of the PAT factors are well known.
For example, world population growth today is approximately +1.3 percent per year (UN, 2002). Per capita GDP varies widely over time and by country, but recent estimates of world GDP per capita growth are approximately 1.1 to 1.4 percent per year (Maddison, 1995; World Bank, 2004). CO2 emissions per unit of world GDP output display a well-documented long term decline, persistent over the past century, of about −1.3 percent per year (Nakićenović, 1996). The IPAT model indicates that adding these three rates should yield CO2 emissions growth rates. The sum is about 1 to 1.5 percent per year growth in world CO2 emissions, and this is what is seen, albeit with significant interannual variations, when using estimates of CO2 emissions inventories (CDIAC, 2004).
Although the IPAT approach is reliable for estimating present-day emissions—as it must be if given good estimates for the main driving forces—using it to develop estimates of future emissions is by no means so easy. In principle, given a range of long-term projections for population, economic growth and technological changes, one could combine such projections to yield a range of future emissions rates. Some aspects of this approach are discernible in the predecessor scenarios to the Intergovernmental Panel on Climate Change (IPCC) Special Report on Emissions Scenarios (SRES) report: the IPCC IS92 emissions scenarios (Leggett et al., 1992).
Without doubt, the most sophisticated long-term projections exist for world and regional population changes, because these have been an area of intensive demographic research for many decades (Bongaarts and Bulatao, 2000; Lutz, 1996). Projections are routinely made for the world, regions, and countries by the United Nations (UN, 2002) and the International Institute for Applied Systems Analysis (IIASA; Lutz et al., 2004; Lutz, 1996). Less formal, or unpublished, projections are also developed by the
World Bank and the U.S. Census Bureau (Gaffin, 1998). The UN and the IIASA world and regional projections extend out to years 2150 and 2100, respectively. They include variants that explore the sensitivity of the projections to high and low fertility rate and mortality rate changes (and, to a more limited extent, changes in migration rate) that occur with development.
Although projections of future population are thus readily available for use in emissions models, long-term projections for the other key socioeconomic factors that drive emissions are generally not available. Economic and technological projections are much more tenuous and thus are usually limited to a few decades. As two examples, long-term projections for U.S. economic growth by the Energy Information Administration, possibly a best-country case, are made to 2025 (Annual Energy Outlook, 2004). The International Energy Agency makes world energy and economic projections out to 2030 (World Energy Outlook, 2004). Such time frames fall far short of those needed for climate and emissions scenarios.
To circumvent the relative dearth of long-term economic projections, the IPCC SRES report adopted a scenario approach in which story lines were developed that sketched in some detail the broad outline of future world development pathways. These story lines facilitated the selection of specific targets for economic growth in the year 2100. Four broad families of scenarios with story lines were developed and code-named A1, A2, B1, and B2. The A1 and A2 scenarios were characterized by an emphasis on economic and market forces within a geopolitical landscape of either strong globalization (A1) or a tendency toward regional development (A2). The B1 and B2 scenarios instead explored futures that were characterized by a pronounced value-shift toward environmental protection and sustainability, with a similar geopolitical dichotomy between globalization (B1) and regionalization (B2).
Within this framework, target GDP levels (in 1990 U.S. dollars) for the year 2100 were selected as follows: $550 trillion for the A1 family, $250 trillion for the A2 family, $350 trillion for the B1 family and $250 trillion for the B2 family (Nakićenović et al., 2000). Similarly, the exogenously available long-term population projections from the United Nations and the IIASA were also associated with each family based on the story line characteristics. The IIASA low fertility rate and low mortality rate projection was associated with the A1 and B1 scenarios, and the IIASA high-fertility and high mortality rate projection was associated with the A2 scenario (Gaffin, 1998). The UN medium projection was associated with the B2 scenario family. Each of the six emissions models used these exogenous inputs for the economic and demographic drivers.
Projecting technological evolution, including energy technologies that dominate emissions, is a similarly challenging undertaking involving con-
sideration of many factors (Grubler et al., 1999; Nakićenović et al., 2000; Schipper, 1996). Integral to such projections is the observation that the world’s economies and energy systems have been autonomously “decarbonizing” for centuries (Nakićenović, 1996; Nakićenović et al., 1998), that is, reducing the amount of carbon emitted per unit of economic output, primary energy produced, or both. This is happening for many reasons including societal preferences for improved air quality; changes in regional energy resources; and improvements in technology, energy efficiency, and productivity. Moreover, structural changes, as the world’s economies move from preindustrial through industrial and into postindustrial phases, are leading to a general transition away from agriculture and manufacturing activities towards more service- and information-based sectors of activity (Soubottina, 2004). All of these changes contribute to decarbonization.
Long-term technology scenarios applied to emissions implicitly or explicitly project this decarbonization trend forward in time with varying rates (Nakićenović et al., 1998). A further uncertainty is that revolutionary advances in energy technologies or, alternatively, societal disasters are always possible, especially over the long term; however, such scenarios were eschewed in the most recent IPCC SRES report.
Even when long-term projections are available, the context in which they were developed may not be appropriate for noninterventionist emissions scenarios. Moreover, the emissions driving forces should not simply be combined in a random manner since fundamental interrelationships exist between them that may dictate the plausible nature of some combinations. For example, demographic, human welfare, and economic development are often seen as linked through various factors.
When the IPAT model is applied to greenhouse gas emissions, analysts have found it useful to further disaggregate the technology factor into the product of “emissions per unit of energy” (CO2/E) and “energy per unit of GDP” (E/GDP). This variant of the IPAT formula is referred to as the “Kaya” identity (Kaya, 1990). The value added of disaggregating this way is that the CO2/E factor is conveniently thought of as the carbon or greenhouse gas intensity of the energy system within a country, closely reflecting the fuel systems in use. The E/GDP can be thought of as the energy intensity of that economy. Because of persistent decarbonization, CO2/E and E/GDP have declined for most economies and have been declining for perhaps two centuries (Nakićenović, 1996). For detailed modeling, structural models for the explicit energy, technological, economic, and demographic forces involved, developed for disaggregated regions, are preferable. Two broad categories of structural models are macro-economic, or “top-down,” models (Nordhaus, 1993) and systems engineering, or “bottom-up,” models (Nakićenović et al., 2000). Top-down models focus on developing large-scale economic production functions involving capital stock, labor produc-
tivity, and broad-scale technological change. The production function requires decision variables for investment and savings rates. The model seeks an optimal economic growth rate that maximizes utility. The strength of these models is their treatment of the interactions of the economy as a whole. Their weakness is the lack of explicit simulations of energy technologies. In contrast, bottom-up models focus more explicitly on the energy technologies in use. They include details about primary and secondary energy production, distribution, and end-use consumption, seeking to balance energy supply and demand by adjusting energy prices. There are models that combine the top-down and bottom-up approaches (e.g., Goldstein and Greening, 1999). In anticipation of its Third Assessment Report (TAR), the IPCC developed a new set of emissions scenarios. This effort resulted in the IPCC Special Report on Emissions Scenarios (Nakićenović et al., 2000), often referred to as SRES, which is the most recent comprehensive effort at developing projections of future anthropogenic emissions. The results have been widely used in the IPCC TAR and other climate modeling applications. Both top-down and bottom-up modeling approaches are represented in the SRES (Nakićenović et al., 2000). Details on the individual model components are discussed in the SRES and the source references (deVries et al., 1994; Morita et al., 1994; Messner and Strubegger, 1995; Edmonds et al., 1996a,b; Pepper et al., 1998; Mori and Takahashi, 1999).
Since the release of the SRES, emissions scenarios have continued to evolve. For example, the declines in fertility rates since the SRES have been incorporated in more recent work, as has the potential for longer human lifetimes. Another important development is the incorporation of explicit energy and agriculture technologies in models, bridging the gap between economics and engineering. Integrated assessment models now routinely produce scenarios with carbon capture and storage. Some models are now explicitly modeling advanced transportation technologies such as hydrogen, biofuels, hybrids, diesels, and advanced internal combustion engines. Similarly, some models are now producing scenarios that consider the competition between land uses implied by large-scale development of commercial biomass crops and the interaction between the energy system, land use, and the terrestrial carbon cycle.
Emissions Scenarios for Short-Lived Compounds
One category of future emissions with particularly high uncertainties is the shorter-lived compounds, including tropospheric ozone precursors (carbon monoxide [CO], nitrogen oxides [NOx], methane [CH4], and volatile organic compounds [VOCs]), sulfur dioxide, carbonaceous aerosols, dust, and sea salt. Ozone and aerosol concentrations are highly variable over space and time; thus, the spatial distribution of emissions is important for
accurately simulating their atmospheric distributions and radiative impacts. The present-day source inventories for these gases are complex and need further work.
The IPCC SRES provided estimates for emissions of methane, other ozone precursors, and sulfur dioxide (precursor for sulfate aerosols), but not for carbonaceous aerosols, dust, or sea salt (Nakićenović et al., 2000). The SRES paid special attention to sulfur (Grubler, 1998), motivated by the burgeoning recognition between the IPCC’s First and Second Assessment Reports of strong radiative forcing of sulfate aerosol (IPCC, 1996). Most of the SRES effort was devoted to estimating temporal trajectories for large geographic regions—a significant challenge for 100 years into the future—and less attention was paid to smaller-scale spatial variability. In the SRES models, future emissions of species with poorly inventoried sources were often estimated using simple relationships to aggregate energy (e.g., proportional to fossil fuel combustion), economic indicators, and sector-specific activities (e.g., agriculture). Providing more detailed spatial projections for short-lived emissions remains an important challenge for analysts.
To fill the currently burgeoning need for present and future estimates of black carbon and organic carbon emissions, the IPCC (2001) made nominal guesses at these emissions by applying poorly known scaling factors to the SRES CO emissions. Possible future changes in the relative contributions of biomass and fossil fuel combustion to CO emissions were not evaluated. IPCC (2001) noted that this could bias estimates of future particulate emissions if air quality policies target them differently from CO. Explicit, gridded carbonaceous aerosol emissions scenarios that consider a range of policy outcomes are needed.
Spatial Variability in Emissions
As a first step in providing spatially resolved emissions, SRES used a top-down approach. Emissions data were prepared for four large aggregated regions: (1) the Organization for Economic Co-operation and Development (OECD) 1990, (2) Asia, (3) Eastern Europe and the former Soviet Union, and (4) the rest of the world. The six emissions models used in the SRES each had a more detailed aggregation with 9 to 13 regions; each of these models subsequently reaggregated the individual regional data to match the four reporting regions. Results for the four regions are presented in the final report for all of the long-lived greenhouse gases. For the short-lived gases, SRES scaled the aggregated projections from the four reporting regions (SO2 used six regions) to a gridded map for 1990. The base-year emissions map was from the Emissions Database for Global Atmospheric Research (EDGAR), maintained at the National Institute of Public Health and the Environment in the Netherlands (Olivier et al., 1996; Van Aardenne
et al., 2001; see http://arch.rivm.nl/env/int/coredata/edgar/intro.html). This procedure is a reasonable first cut at a complex problem, although it does not capture temporal trends in the spatial distribution of emissions.
One area for improvement is to include future population change information at as high a spatial resolution as possible. The EDGAR database used 1990 population distribution as a major part of its spatial partitioning of emissions to a 1° latitude by 1° longitude map (Van Aardenne et al., 2001). For example, 1990 population density was used to spatially allocate all fossil fuel emissions from power plants; residential and industrial energy use; transportation; industrial and domestic biofuel combustion; processing iron, steel, and cement; and solvent production. By rescaling the base-year grid, therefore, SRES essentially perpetuates the 1990 world population distribution throughout the forecast period to 2100. The SRES used 100-year regional population projections from the UN and the IIASA as one of the key drivers behind emissions (Gaffin, 1998). However, this does not rectify the spatially static character inherent in rescaling the 1990 EDGAR emissions grid because only the reporting region emissions results were used in the top-down gridding, rather than explicit future population distribution information.
To capture future spatial variability in source emissions better, the research community should consider more explicit methods, such as bottom-up methods, for including key indicators. For example, population projections exist nationally out to 2050 from the UN and other sources (UN, 2002). These national projections should be incorporated in some fashion into future gridding algorithms for emissions locations. In addition, there are numerous subnational population projections for major emitting nations, including the United States (U.S. Census Bureau, 2002) and, recently, China (Toth et al., 2003) and India (Srinivisan and Shastri, 2004). Subnational projections, although difficult to undertake, would be valuable for emissions scenarios. Newer sources of remotely sensed data on land use and anthropogenic activity also provide valuable spatial data. For example, nocturnal lighting data are of high quality and can be closely correlated to a number of anthropogenic indicators including emissions (Elvidge et al., 1997). Given that many of the emissions sources are poorly quantified, nocturnal lighting data should be mined for possible improvements in the inventories. Such data offer alternative spatial baselines upon which projected grids could be based (Plutzar et al., 2000).
Biogenic VOC Emissions
Volatile organic compounds are important ozone precursors. In addition to anthropogenic sources, they are emitted by vegetation at a rate that depends on temperature, radiation, and other factors. Biogenic VOC emis-
sions are expected to be highly sensitive to climate change, but the dependences are complicated. The dependence on temperature is large, amounting to a doubling of emissions for a 7 K temperature increase (Guenther et al., 2000). The dependence on solar radiation is weaker and also relatively well understood. Increasing CO2 is known to cause reductions in isoprene emissions (Sanadze, 1969; Monson and Fall, 1989), although this may be compensated by increases in the vegetation leaf area index associated with CO2 fertilization. Most uncertain is the response of biogenic VOC emissions to changes in vegetation type, as driven both by anthropogenic land use and by climate change. Quantifying this effect requires vegetation dynamics models, but these are difficult to constrain for future projections.
Lightning NOx Emissions
Thermal and ionic chemistry taking place in lightning strokes produces large amounts of NOx from nitrogen (N2) and oxygen (O2). Lightning NOx emissions are likely the most important precursors of ozone in the upper troposphere (Martin et al., 2002; Li et al., 2004) and also the most uncertain of the major NOx sources (Nesbitt et al., 2000; Tie et al., 2002). Credible global estimates from the literature range from 2 to 20 Tg of nitrogen per year (IPCC, 2001). Process studies of lightning emissions based on flash energies tend to be at the high end of that range (Price et al., 1997), while estimates constrained by atmospheric observations of nitrogen oxides and ozone tend to be at the low end (Wang et al., 1998; Martin et al., 2002; Staudt et al., 2003). Lightning emissions could possibly be greatly enhanced in populated regions due to high aerosol emissions (Steiger and Orville, 2003).
Dust and Biomass Burning Emissions
Several studies have applied land-use models to estimate past, current, and future dust emissions (Matthews, 1983; Alcamo et al., 1994; IPCC, 2001; Mahowald and Luo, 2003). Mahowald and Luo (2003) found an 11 percent increase in dust emissions over the last century (from 1900 to 2000) but predicted a 20 percent decrease in the next century (from 2000 to 2100). Ice core measurements of dust concentrations over the last century are inconclusive. The projections of future decreases in dust emissions result from changes in soil moisture and surface winds in arid regions; however, future human landscape conversion and landscape degradation have not been included in these projections. Decreases could reduce cooling, thereby enhancing climate warming trends. More information is needed to constrain predictions of dust emissions for the twenty-first century and beyond.
The future of biomass burning emissions is also not well understood. Current evidence shows increasing rates of biomass burning (Cochrane et al., 1999). Additional work is in progress to better understand the current and future sensitivities of biomass burning to biological and societal driving forces (Lavorel et al., 2005; Spessa et al., 2003).
Climatic Implications of Air Quality Regulations
Emissions of aerosol and ozone precursors are heavily regulated in developed countries because of their impacts on air quality. These regulations will likely become stronger in the future as air quality standards are restricted. Control strategies have not yet been developed in a manner that addresses both air quality and the potential climatic implications of emissions reductions (NRC, 2005).
Controlling emissions that lead to air pollution can have either warming or cooling effects on climate, as shown in Table 5-1. Regulations targeting black carbon emissions or ozone precursors would have combined benefits for public health and climate (Hansen et al., 2000; Jacobson, 2002).
TABLE 5-1 Responses of Regional Haze and Climate to Reductions in Emissions of Aerosols and Aerosol Precursors
|
Reduction in Pollutant Emissions |
Impact on Regional Hazea |
Impact on Aerosol Direct Effectb |
|
SO2 |
↓ |
↑ |
|
NOx |
↑ ↓ c |
↑ ↓ |
|
VOC |
↑ ↓ c |
↑ ↓ |
|
Ammonia (NH3) |
↓ |
↑ d |
|
Black carbon |
↓ |
↓ |
|
Primary organic compounds |
↓ |
↑ |
|
Other primary particulate matter (crustal, metals, etc.) |
↓ |
↑ |
|
aDirection of arrow indicates increase (↑) or decrease (↓), and color signifies undesirable (red) or desirable (blue) impact; size of arrow signifies magnitude of change. Small arrows signify possible or small change. bIndirect effects through clouds and precipitation are highly uncertain. Note that the extent and possibly the scale of climate impacts for listed pollutants are quite different from CO2 and CH4. Direction of arrow indicates warming (↑) or cooling (↓). cNo change if little NH3 is available in atmosphere. dMore accurately, decreased aerosol-induced cooling. SOURCE: NARSTO (2003). |
||
|
BOX 5-1 Greenhouse gas forcing increased by about 2.1 W m−2 since 1860 (Feichter et al., 2004), and the reported surface warming trend was about 0.6 K (IPCC, 2001). Some models that have been used to improve understanding of the relationship between the forcings and climate response have included only greenhouse gases, which lead to a warming. Others have included greenhouse gases, which lead to a warming, and aerosols, which lead to a cooling. As a thought experiment, consider two models that accurately simulate the observed temperature trend. Model A, which does include aerosols, estimates that it took the entire 2.1 W m−2 greenhouse gas forcing to produce the 0.6 K warming. On the other hand, Model B includes aerosols that offset 50 percent of the greenhouse gas warming with cooling. The net forcing increase in Model B is thus only 1.05 W m−2 (50 percent of 2.1 W m−2 contributed by the greenhouse warming). In Model B, it therefore takes only 1.05 W m−2 to produce the observed 0.6 K warming. If aerosol cooling were suddenly removed from Model B (e.g., aerosol emissions were significantly decreased in year 2005 due to their health impacts), it would lead to an additional warming during the next few decades without any further addition of greenhouse gases. |
Methane reductions have been proposed as an effective double dividend for improving ozone air quality and mitigating climate change (Fiore et al., 2002). In the case of sulfate and other aerosols having a negative radiative forcing, reducing aerosol concentrations will likely create a more positive radiative imbalance and could actually accelerate increases in surface temperature. Because understanding of the effect of aerosols on the hydrological cycle and vegetation is still incomplete, it is difficult to predict the total effect on climate of reducing aerosol emissions.
Stricter regulation of scattering aerosols such as sulfate could also reveal potential problems with assumptions in climate models about the magnitude of climate sensitivity. Several modeling studies have attributed the surface temperature increases observed during recent decades to the addition of CO2 and other greenhouse gases (IPCC, 2001). More recent modeling studies that have incorporated aerosols show that aerosol direct and indirect forcing may have offset as much as 50 to 75 percent of the radiative forcing due to greenhouse gas increases since preindustrial times. Models that do not include cooling by aerosols will tend to underestimate climate sensitivity, which is adjusted to produce the best fit with the observed radiative forcing and temperature trends (see Box 5-1). This evidence implies a greater possibility that the climate sensitivity for the radiative effects of a doubling of CO2 is in the upper range of the 1.5 to 4.5 K global-averaged surface warming (Andronova and Schlesinger, 2001; Wigley and
Raper, 2001; Forest et al., 2002; Gregory et al., 2002; Anderson et al., 2003a).
SOLAR VARIABILITY
At present, the observational database is too short to detect long-term solar irradiance trends, nor is it possible to predict future solar activity with any skill. Empirical evidence suggests that the approximately 11-year activity cycle of the Sun might be expected to produce future changes in total solar irradiance of order 1 W m−2 or less. This is the change observed in the past three solar cycles, two of which are the second and third largest since 1610 (Lean, 2001).
Unknown is whether solar activity will increase or decrease in the future and how long-term secular changes, if they exist, might evolve. That current levels of solar activity are at overall high levels, according to both sunspot numbers and cosmogenic isotopes, suggests that future solar irradiance values may not be significantly higher than seen in the contemporary database. A projection of future solar activity based on spectral synthesis of the cosmogenic isotope record confirms that solar activity is presently peaking and in 2100 will reach levels comparable to those in 1990 (Clilverd et al., 2003). However, projections of combined 11-, 88-, and 208-year solar cycles suggest that an overall increase in solar activity from 2000 to 2030 will produce a top-of-the-atmosphere (TOA) climate forcing of +0.45 W m−2, followed by decreasing activity until 2090 with climate forcing −1 W m−2 (Jirikowic and Damon, 1994). In contrast, a numerical model of solar irradiance variability that combines cycles related to the fundamental 11-year cycle by powers of 2 predicts a 0.05 percent decrease in irradiance during the next two decades (Perry and Hsu, 2000), for which associated climate forcing is −0.1 W m−2. A lack of physical understanding of how the dynamo-driven solar activity produces the competing effects of sunspot blocking and facular brightening cautions against future predictions, even of 11-year cycle amplitudes.
LAND-USE AND LAND-COVER CHANGE
With continued population growth in the twenty-first century, the conversion of land into agricultural, urban, and other human uses will continue and could even accelerate. The dynamics of anthropogenic land-use change is quite complex and involves socioeconomic forcings and feedbacks (Lambin et al., 2003; Napton et al., 2003; Sohl et al., 2004), as well as climate forcings and feedbacks. For example, Figure 5-3 demonstrates how highway construction and other major infrastructure projects might contribute to change in Brazilian vegetation. The availability of satellite moni-
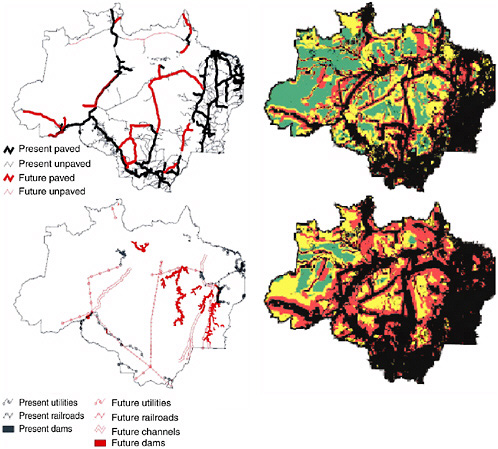
FIGURE 5-3 Left: Existing and planned highways and infrastructure projects in the Brazilian Amazon: (top) highways and road and (bottom) major infrastructure projects. “Utilities” are gas lines and power lines, while “channels” are river channelization projects. Right: Predicted forest degradation by the year 2020 with (top) “optimistic” and (bottom) “pessimistic” scenarios. Black is deforested or heavily degraded, including savannahs and other nonforested areas. Red is moderately degraded, yellow is lightly degraded, and green is pristine. SOURCE: Laurance et al. (2001).
toring of land-use change (e.g., Steyaert et al., 1997; Loveland et al., 2000, 2002) for the United States and globally will permit detailed data to be obtained into the future.
The consequences of future land-use change on the forcing of the climate system include alterations in the surface albedo, portioning of the surface net radiation between latent and sensible turbulent fluxes, and trace
gas and aerosol fluxes. Although understanding of how land-use change acts as a climate forcing is not as developed as that for greenhouse gas forcing, a recent review of research on this topic concluded that land-use change during the twentieth century had well-defined effects on regional climate (Kabat et al., 2004). In some cases, these regional effects are estimated to be as large as those due to a doubling of CO2. In addition, land-use change may have possible significant effects on the global climate through teleconnections. Continued conversion of the landscape is expected to have a comparable effect in the next century.
The climate forcing of future landscape change on the surface energy and water budget, and how this effect is transmitted through the atmosphere, has been little studied. Most previous work on future landscapes has concentrated on how the landscape responds to future climate change simulated in models (e.g., NAST, 2001) and on surface greenhouse gas sources or sinks, rather than on how the landscape itself alters climate through its heat and moisture fluxes (e.g., Snyder et al., 2004).
ABRUPT CLIMATE CHANGE
Abrupt climate changes take place when “the climate system is forced to cross some threshold, triggering a transition to a new state at a rate determined by the climate system itself and faster than the cause” (NRC, 2002). Paleoclimate records indicate that abrupt changes have occurred frequently in the past and at rates high enough that human or natural systems may have had difficulty adapting. However, efforts to develop model-based scenarios for future abrupt climate changes are limited by our lack of understanding of the mechanisms that underlie such changes (see NRC, 2002, for a full discussion of this issue).
One example is a striking series of abrupt changes in temperature identified in Greenland ice core records from the last glaciation. Known as Dansgaard/Oeschger (D/O) cycles, these temperature shifts recur on millennial time scales. They have been attributed to threshold jumps in thermohaline circulation (THC), presumably triggered by sudden discharges of icebergs and freshwater from ice sheets (Broecker, 1997). Temperatures above the ice cap may have dropped by as much as 8°C, and large parts of western Europe may have cooled by a few degrees. The recent discovery of correlatives of D/O cycles in tropical latitudes, however, has raised an alternative possibility that the underlying mechanism was ocean-atmosphere interaction in low latitudes (Clement et al., 2000). Some have even argued that El Niño cycles of long duration or shifts in the ITCZ (intertropical convergence zone) might change water vapor export to high latitudes. Such changes could have amplified or, through impacts on THC, even caused the D/O variations (Peterson et al., 2000).
Examples of abrupt change have been identified in the Holocene as well. Between about 12 and 5 thousand years ago the last phases of deglaciation led to repeated reroutings of glacial lake meltwater into the convecting regions of the North Atlantic (e.g., Teller and Leverington, 2004). It has been argued that each of these events weakened the North Atlantic THC enough to cause abrupt cooling of the northern North Atlantic, Greenland, Iceland, and Europe, perhaps by as much as a few degrees. Yet proxy data from the northern North Atlantic so far have revealed no compelling evidence for changes in THC (Keigwin and Boyle, 2000).
Even if, as many assume, threshold behavior in THC is the most likely cause of abrupt climate change, the processes that lead to such behavior cannot be quantified. The ways in which the North Atlantic THC interacts with other oceans is not well known (Whitworth et al., 1999); it is not certain whether freshwater forcing actually weakens THC under all conditions (Marotzke, 2000). Further, the way in which convective activity is linked to THC is not fully understood (Marotzke and Klinger, 2000).
An abrupt climate change would have more severe impacts on natural and human systems than more gradual change. In particular, it could result in more extremes in climate variables (e.g., heat index, storm intensities and frequencies). Knowledge of what triggers abrupt climate changes is still quite limited; more research is needed to determine whether human-caused increases in greenhouse gases or land-use changes might lead to an abrupt change. Indeed, past abrupt climate changes have been especially common when the climate system itself was being altered (NRC, 2002).


