
3
Radiative Forcing Over Earth’s History
Radiative forcing operates on all timescales over Earth’s history (Ruddiman, 2001). This includes (1) geological timescales (tens of millions of years) over which the output of the Sun, concentrations of greenhouse gases, and volcanism vary significantly; (2) timescales of tens to hundreds of thousands of years, over which Earth orbital and astronomical changes appear to dominate the variability of the climate system; (3) timescales of millennia to multimillennia as exemplified by evidence from our present interglacial climate, the Holocene; and (4) modern timescales of approximately the past 1000 years during which natural and anthropogenic influences can be compared. Only for the past few decades are there direct observations (primarily from space) of multiple forcings and the global surface temperature data needed to assess their forcing effects. In this chapter, forcings over each of these timescales are discussed. Tropospheric forcing and response are emphasized because they have been the primary focus of scientific investigation to date.
GEOLOGICAL TIMESCALES
Solar Luminosity
For most of the Sun’s 4.5 billion years, the conversion of four hydrogen atoms to one helium nucleus in its core has produced the energy that heats the Sun’s surface. The temperature of the Sun’s surface determines the amount and spectral shape of the energy that the Sun radiates toward the Earth. According to standard stellar models, as the Sun uses energy, its core
density increases and the core shrinks slightly. This causes the core to heat up, which increases the Sun’s energy output. Running the standard models backward suggests that at the time of Earth’s formation, the Sun was only 70 percent as bright as it is now (Figure 3-1). At the same time however, the Sun was more active, possibly because it rotated three times faster than today, and the rotation helps create the dynamo that drives solar activity, thereby generating stronger magnetic fields (Noyes, 1982). Solar irradiance variations were likely irregular, with large dark spots dominating the surface. Total irradiance therefore likely varied inversely with activity. Although total brightness was lower overall, the ultraviolet (UV) irradiance of the early Sun may have been much higher than today. Solar rotation has slowed because of the loss of mass (and angular momentum) in the solar wind. Solar activity level has decreased because of the resultant decrease in dynamo action, and activity cycles have become more regular.
Today the Sun is middle aged with an anticipated remaining life of about 4 billion years. It rotates once every 27 days and it is brighter, not dimmer, when it is more active and has more spots. This is because mag-
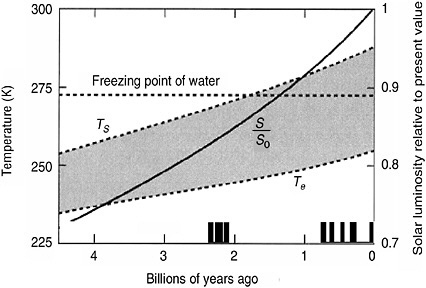
FIGURE 3-1 The Faint Young Sun Paradox. Solid line is solar luminosity relative to present (S/S0). Ts is Earth’s surface temperature and Te is Earth’s effective radiating temperature. Thick vertical bars are glaciations. SOURCE: Modified from Kasting and Catling (2003).
netic fields produce not only dark spots but also bright faculae, whose brightening effects exceed (by a factor of two) the sunspot dimming. As it ages further, the Sun’s rotation rate will continue to decrease, but much more slowly because the solar wind is weak. More regular brightness cycles in phase with solar activity and dominated increasingly by bright faculae are expected (Baliunas et al., 1995).
Carbon Dioxide
The weak solar luminosity on the early Earth has posed a long-standing problem whose solution may implicate the greenhouse effect of CO2 as a long-term temperature regulator. Climate models suggest that for a 30 percent weaker Sun and a modern greenhouse gas concentration, water would have been frozen from 4.5 Ga (billion years ago) until about 2.3 Ga (Sagan and Mullen, 1972), yet geological evidence from well before 2.3 Ga documents a vigorous hydrologic cycle and a diverse marine biota (Sagan and Mullen, 1972; Kasting; 1993; Kump et al., 2000). This contradiction has come to be known as the Faint Young Sun Paradox (Figure 3-1).
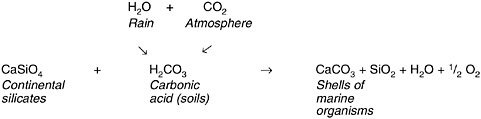
The most widely accepted solution to the paradox, based both on models and geological data, is that the early Earth was warmed by a high concentration of greenhouse gases, probably mainly CO2, perhaps in the range of a few hundred to 1000 times present atmospheric levels (Kump et al., 2000). To explain such high levels of atmospheric CO2, most attention has focused on the dominant process that draws down atmospheric CO2 relative to production on geological timescales: the chemical weathering of continental silicate rocks illustrated in the following chemical reaction (Kasting, 1993; Kump et al., 2000; Ruddiman, 2001).
Because silicate weathering rates vary with temperature (by a factor of about two for each 10°C) and area of exposed continental silicate rocks (Ruddiman, 2001), it has been argued that on a cold early Earth with small continental mass (Kump et al., 2000), the negative feedback from severely reduced silicate weathering rates would have led to a build up of volcanic CO2.
However, if the large CO2 greenhouse effect remained unchanged as
solar luminosity increased, the global temperature of the modern Earth would be too hot for nearly all forms of present-day life (Kump et al., 2000). The suggested solution to this problem is once again a silicate weathering-CO2 negative feedback. Higher temperatures and larger continents would have increased continental silicate weathering rates, thereby decreasing the CO2 greenhouse effect and cooling the Earth. Thus, many regard the silicate weathering-CO2 negative feedback as a thermostat that prevented permanent freezing of the early Earth and, later, prevented permanent temperatures too hot for life.
It should be emphasized, however, that much of what has been said above is based more on models and inference from evidence of warmth on early Earth than on conclusive proxy evidence. In addition, some have argued that methane may have been an important constituent of the early atmosphere (Kasting and Catling, 2003; Rye et al., 1995; Catling et al., 2001; Hessler et al., 2004) and that production of volcanic CO2 may have been an important source of the early Earth’s higher CO2 greenhouse effect (Ruddiman, 2001). More speculative solutions of the Faint Young Sun Paradox suggest that the early Sun might have been hotter than previously thought (Wuchterl and Klessen, 2001) or that a decreased cosmic ray flux, resulting from an early Sun’s stronger solar wind, may have reduced cloud cover and raised global temperatures (Shaviv, 2003).
Geological evidence also suggests that atmospheric CO2 changed dramatically on timescales of a few to tens of millions of years during the Phanerozoic (Figure 3-2). These changes are on the order of 5 to 10 times present atmospheric level. The record suggests that for at least two-thirds of the last 400 My (million years), levels of atmospheric CO2 were much higher than at present. It appears that these oscillations in atmospheric CO2 were linked to recurring changes from greenhouse to icehouse climate states.
The cause of the large atmospheric CO2 changes during the last 400 My is hotly debated. One view, known as the Berner-Lasaga-Garrels (BLAG) hypothesis, proposes that atmospheric CO2 changed in response to changes in seafloor spreading rates (Berner et al., 1983). Higher spreading rates increase volcanic activity at both divergent and convergent plate boundaries, thereby increasing the rate of release of volcanic CO2 from the large rock reservoir of carbon. Plate motion reconstructions for the last 100 My (the limit for which this can be done) suggest that at about 100 Ma (million years ago), spreading rates were 50 percent faster than today; however, during the last 15 My, CO2 levels fell at the same time that spreading rates increased, calling into question any simple relation between spreading rates and CO2 (Ruddiman, 2001).
A second view is that plate tectonic-driven uplifts of large plateaus, formation of mountain ranges, and amalgamation of supercontinents (which appear to be associated with low relative sea level) cause large
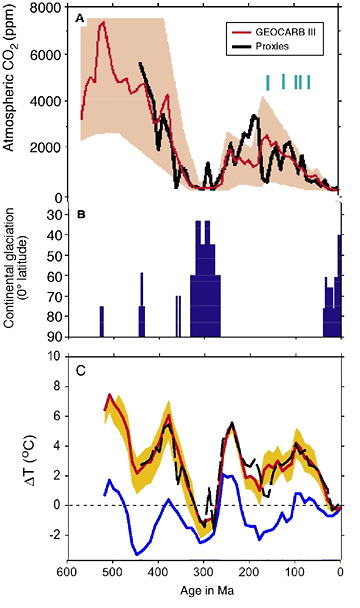
FIGURE 3-2 (A) Comparison of model predictions (GEOCARB III; Berner and Kothavala, 2001) and proxy reconstruction of CO2 based on a new compilation of 372 published observations (Royer et al., 2004). Shaded area = error of model predictions. Light blue lines between about 160 and 60 Ma are times of brief, geographically limited glaciations in high latitudes (Royer et al., 2004). (B) Latitudinal distribution of major Phanerozoic ice sheets (Crowley, 1998). (C) Comparison of temperature variations from Royer et al. (2004) with those of Shaviv and Veizer (2003). The discrepancy with the Royer et al. (2004) observations suggest that the model of Shaviv and Veizer is incorrect.
increases in the exposure of areas of new, fresh continental silicate rocks to chemical weathering (Kump et al., 2000; Ruddiman, 2001). This is thought to have led to increased silicate weathering rates in the uplifted areas, which as explained in the preceding section would have drawn down atmospheric CO2. There is, however, little conclusive geological evidence demonstrating that the large landmasses required by the hypothesis actually existed.
It is important to emphasize that if either of the two hypotheses is correct, atmospheric CO2 changes during the Phanerozoic can be regarded as direct radiative forcings and not feedbacks. That is, just as the source of the CO2 forcing in the last few decades lies largely outside the climate system (human influences), the source of the Phanerozoic CO2 forcing lies in changes in plate tectonics that occurred over tens of millions of years.
Shaviv and Veizer (2003) have suggested that changes in cosmic ray fluxes reaching Earth may occur as the solar system passes through the Milky Way’s spiral arms and may account, through the influence of cosmic rays on cloud formation, for the major variations in global mean temperature and continental glaciation during the Phanerozoic. A critical examination of the physical and statistical issues underlying this argument, however, reveals that the claimed relationship is likely spurious (Rahmstorf et al., 2004).
Methane
The largest modern reservoirs of methane are methane hydrates buried in sediments of deep lakes and marine continental slopes. The marine reservoir is estimated to be between 500 and 24,000 Gt (billion tons) of carbon, with a best guess assessment of 10,000 Gt (Kvenvolden, 2002). It has been suggested that if enough of the oceanic reservoir were released to the atmosphere by ocean warming or by landslides on the continental slopes, it could produce a brief episode of global warming and a severe perturbation of the carbon cycle. Details of the mechanism have been summarized in Katz et al. (2001).
The most convincing evidence for this type of radiative forcing during the geological past comes from deep and surface ocean records of a remarkably abrupt shift in both oxygen and carbon isotopes dated at about 55 Ma and known as the Paleocene-Eocene Thermal Maximum (PETM). Depletions in δ18O imply abrupt ocean warmings, perhaps by as much as 3.5 to 4°C in tropical and subtropical latitudes (Tripati and Elderfield, 2004). The exceptionally large depletion in δ13C of 2 to 4‰ (parts per thousand) is taken to be consistent with a release and subsequent oxidation of between 1500 and 2000 Gt of methane hydrate carbon with a δ13C signature of about −60‰, a typical value for biogenic methane carbon. Model simulations taking into account both the atmospheric chemistry and the radiative
forcing associated with such an increase in methane concentrations successfully reproduce the estimated warming (Schmidt and Shindell, 2003).
If the methane release was triggered by plate-tectonic changes, including possible influences on landslides on continental slopes, as an increasing amount of evidence suggests (Katz et al., 2001), then, as argued for the Phanerozoic CO2, methane was a radiative forcing agent during the geological past that was produced by a mechanism operating outside the climate system. A recent analysis, however, has revised the amount of marine methane carbon downward to between 500 and 2500 Gt (Milkov, 2004). Kent et al. (2003) have argued that if the revised estimate is correct and applies to the time of the Paleocene-Eocene transition, then ocean methane carbon released by any mechanism probably would have been insufficient to cause a recognizable perturbation of climate and the carbon cycle. They propose instead that a large comet impact might be the more likely explanation for the PETM.
Volcanic Aerosols from Flood Volcanism
Although aerosols produced by strong eruptions of individual volcanoes, such as those along subducting plate boundaries, alter climate for only a year or two at most, aerosols from another category of volcanism, perhaps related to plate tectonics, may force much longer changes in Earth’s climate. This type of volcanism, known as flood volcanism, results from deep heating and melting of the mantle at “hot spots.” On Earth’s surface above the hot spots, the mechanism causes repeated eruptions of basaltic lava that persist for as long as 1 or 2 My. The eruptions produce enormous basaltic plateaus, known as large igneous provinces (LIPs), that range from 7.5 × 10⁵ to 55 × 106 km3 in volume.
According to Thordarson et al. (2003) and Self et al. (1997), the volatile mass released by flood volcanism is enormous—on the order of 10,000 Mt (megatons) of SO2 per 1000 km3 of magma erupted. Amounts of H2O and CO2 are likely on the same order as SO2 emissions. Judging from the volume of individual continental LIPs, the volcanism that produced them released 10,000 Mt of SO2 into the atmosphere, which is equivalent to 1000 Mt per year for a 10-year-long event. This is a huge amount compared to the 20 Mt released during the eruption of Mt. Pinatubo. By analogy with the Laki flood eruption in Iceland in 1783 and 1784, about 70 percent of the volatiles released at a flood vent are lofted to upper tropospheric-lower stratospheric heights. Thus, the large flood basalt volumes of LIPs over time, particularly on continents, may have caused widespread climate perturbations if the eruption recurrence intervals were shorter than the recovery time of the environment between eruptions. Sparse dating of flows within LIPs precludes any firm estimate of eruption frequency. Even
so, claims have been made that a correlation may exist between the timing of major LIP growth and major mass extinctions during the Phanerozoic (Haggerty, 1996; Morgan et al., 2004).
GLACIAL-INTERGLACIAL TIMESCALES
The magnitude and distribution of solar radiation, or insolation, received by the Earth’s surface varies due to change in Earth’s location and orientation relative to the Sun. Over periods of 100,000 and 400,000 years, the Earth’s orbit around the Sun varies from nearly circular (eccentricity = 0.00) to slightly elliptical (eccentricity = 0.06). Received total radiative energy changes by about 0.1 percent as a result of the altered distance of the Earth from the Sun. The tilt, or obliquity, of Earth’s orbit, which is currently approximately 23.5° from an axis perpendicular to the plane of orbit, is primarily responsible for the existence of seasons. Variations in the obliquity from 22.1° to 24.5° alter the seasonal distribution of radiation on the Earth’s surface with a period near 41,000 years. Polar regions receive greater insolation when the tilt is largest. Precession of the Earth’s orbit, which occurs with a roughly 22,000-year periodicity, further modulates seasonality, influencing the relative timing of Earth’s closest approach to the Sun (perihelion) relative to the timing of seasons. Currently, perihelion coincides approximately with the Northern Hemisphere winter solstice (favoring decreased seasonal changes in response to seasonal changes in insolation), but the reverse was true 12,000 years ago, at the beginning of the Holocene period.
Periods of approximately 22,000, 41,000, and 100,000 years are prevalent in paleoclimate records and are generally considered to relate, at least in part, to orbital forcing. However, interpreting the dominant 100,000-year cycle in this way is problematic because insolation changes of the order 0.1 percent are too small to have produced the extensive glaciation and cooling of the glacial cycles (Raymo, 1998) and are insufficient to generate the observed variations in model simulations (Kukla and Gavin, 2004). The weak eccentricity forcing must be amplified by the climate system, but the amplifying mechanisms are not well understood. Broecker (1994) noted that glacial terminations are abrupt, in marked contrast to the gradual (sinusoidal) changes in orbital variations. Wunsch (2004) has argued from statistical analyses of climate records that orbital forcing of the 100,000-year glacial cycles accounts for only 20 percent of the variance and is likely indistinguishable from chance. He concluded that broadband stochastic processes are probably the dominant control on glacial cycles.
HOLOCENE
The pre-modern Holocene spans the present interglacial from its onset 11,500 years ago to the time when a reasonable amount of observational data became available, about 1000 years ago. The pre-modern Holocene is regarded as probably the best source of information for understanding how natural radiative forcing agents have changed on timescales of millennia to multimillennia within a modern-like interglacial climate. New evidence suggests that at least regionally the entire ~10,000-year interglacial period contains relatively large oscillations of millennial to multimillennial duration (Hodell et al., 1991; Bianchi and McCave; 1999; deMenocal et al., 2000; Bond et al., 2001; Haug et al., 2001; Thompson et al., 2002; Friddell et al., 2003; Hu et al., 2003; Poore et al., 2003; Niggemann et al., 2003; Magny and Bégeot, 2004).
Orbital-Forced Solar Insolation
Solar insolation changed during the course of the pre-modern Holocene by about 10 to 20 W m−2, in opposite phase for winter and summer. The peak high-latitude summer insolation between about 7,000 and 11,000 years ago likely favored warmer high-latitude summers (sometimes referred to as the Holocene optimum), but cooler high latitude winters and slightly cooler tropical summers, with any net hemispheric or global-scale changes representing a subtle competition between these seasonally and spatially heterogeneous changes (Hewitt, 1998; Kitoh and Murakami, 2002; Liu et al., 2003) and seasonally specific (e.g., vegetation-albedo) feedbacks (e.g., Ganopolski et al., 1998). Recent modeling studies suggest that mid-Holocene global mean surface temperatures may actually have been cooler than those of the mid-twentieth century, even though extratropical summers were likely somewhat warmer (Kitoh and Murakami, 2002).
Extratropical summer temperatures appear to have cooled (Figure 3-3) over the subsequent four millennia (e.g., Matthes, 1939; Porter and Denton, 1967). This period is sometimes referred to as the “Neoglacial” because it was punctuated with periods of glacial advance and retreat of extratropical and tropical mountain glaciers (Grove, 1988). It is reminiscent of, although far more modest than, a full glacial period of the Pleistocene epoch. In many cases, glacial advances appear to have culminated in extensive valley glaciers during the so-called Little Ice Age between the seventeenth and nineteenth centuries.
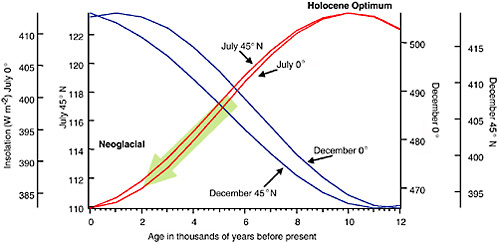
FIGURE 3-3 Changes in insolation over the last 12,000 years at the equator and 45°N for July and December (data from Laskar, 1990). Holocene optimum (warm climate) and Neoglacial (cold climate with increasing numbers of advancing valley glaciers in direction of the large arrow) are climatic events thought to have been associated with the summer insolation changes.
Greenhouse Gases
Prominent multimillennial to millennial time-scale changes in the greenhouse gases CO2 and methane occurred during the pre-modern Holocene, as documented by measurements from Antarctic and Greenland ice cores (Figure 3-4). Blunier et al. (1995) suggested that changes in methane reflected changes in the hydrological cycle at low latitudes. This interpretation appears to be supported by evidence that the minimum in methane coincides with the time at which many tropical lakes dried up. The subsequent increase in methane is thought to reflect an increasing contribution from northern wetlands as these areas recovered from inhibited growth during earlier, colder temperatures. The large, abrupt decreases in methane in the early Holocene coincide with abrupt coolings in at least the North Atlantic and western European regions. It has been argued recently that interpolar methane gradient data from ice cores is evidence of an abrupt switching on of a major Northern Hemisphere methane source, probably in Siberia, in the early Holocene between about 9,000 and 11,500 years ago (Smith et al., 2004).
Indermühle et al. (1999) interpreted the changes in CO2 together with δ13C as evidence of changes in terrestrial biomass and sea surface temperatures. The decline in CO2 between about 7,000 and 11,000 years ago is

FIGURE 3-4 Changes in the greenhouse gases CO2 and methane over the last 12,000 years. Methane (CH4) data from GRIP ice core, Summit Greenland (Blunier et al., 1995), and CO2 from Taylor Dome ice core, Antarctica (Indermühle et al., 1999).
thought to have occurred as the terrestrial biomass began to increase after the end of the glaciation. This is consistent with the view of Smith et al. (2004) that growth of the large methane source in the early Holocene drew down atmospheric CO2. The subsequent overall increase in CO2 to the present is thought to reflect a change to colder and drier conditions in tropical and subtropical regions associated with the Neoglacial trend described above. In this scenario, from about 7,000 years ago to the present, the growing peatlands of the northern latitudes are a source of methane, while the decrease in tropical biomass causes an increase in atmospheric CO2.
Solar Irradiance
Estimates of solar irradiance variations during the pre-modern Holocene assume that cosmogenic isotope information recorded in tree rings (14C) and in ice cores (10Be) provide useful irradiance proxies (Figure 3-5). Yet, whereas the source of irradiance variations are magnetically active
regions near the surface of the Sun, cosmogenic isotope variations occur because magnetic fields in the extended solar atmosphere in interplanetary space (the heliosphere) modulate the flux of galactic cosmic rays that reach Earth’s atmosphere (see Bard et al., 2000; Crowley, 2000; Webber and Higbie, 2003). Thus, the exact relation between the two is far from clear.
Even so, several recent studies document a relatively close connection at millennial timescales between regional climate proxies and nuclide variations (colored heavy lines in the smoothed records in Figure 3-5). Correlations have been found in a number of Holocene records from regions influenced by the Indian and Asian monsoons, in cave deposits from Europe, in marine sediments from the North Atlantic and the Gulf of Mexico, and in records of precipitation from southwestern Alaska (Bond et al.,
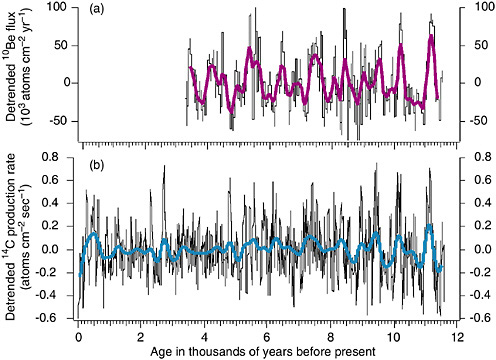
FIGURE 3-5 Changes in the cosmogenic nuclides (a) 10Be and (b) 14C over the last 12,000 years. These changes are taken as proxies of solar activity. Up-pointing peaks indicate reduced activity. 10Be from GRIP/GISP ice cores and 14C from treering measurements. Light black lines are the detrended raw records; heavy colored line represents the same data subject to a binomial smoothing to bring out millennial variability. SOURCE: Adapted from Bond et al. (2001).
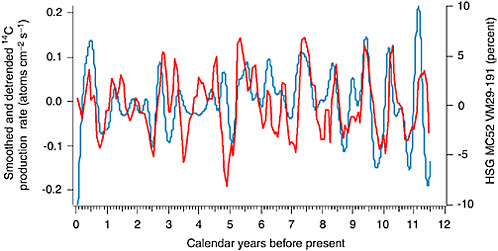
FIGURE 3-6 One example from the eastern North Atlantic of the climate-nuclide connection. Blue lines are smoothed 14C data from Figure 3-5(b); red line is the drift ice record from North Atlantic based on hematite-stained grains (HSG). Up-pointing peaks are relatively colder, possibly by about 1°C, compared to the mean. SOURCE: Adapted from Bond et al. (2001).
2001; Hong et al., 2003; Hu et al., 2003; Niggemann et al., 2003; Poore et al., 2003).
It appears from such correlations that the solar-driven nuclide variations impact climate, at least on a regional scale, enough to leave an imprint in the proxy data (Figure 3-6). These results suggest either that the nuclide-solar irradiance connection is more direct and robust than models suggest, that there are amplified responses of the climate to solar irradiance variations, or both. Potentially, such amplifications include solar ultraviolet impacts on stratospheric ozone and associated tropospheric dynamical responses (e.g., Haigh, 2003; Labitzke and Matthes, 2003; Shindell et al., 2001a, 2003), cosmic ray influences on cloud formation (Carslaw et al., 2002), or changes in North Atlantic meridional overturning (Bond et al., 2001).
LAST 1000 YEARS
Recent theoretical modeling studies have evaluated the role of natural and anthropogenic radiative forcing on climate changes over the past one or more centuries. Detailed attribution studies have focused on the appar-
ent roles of anthropogenic (greenhouse gas and sulfate aerosol) and natural radiative forcings over the spatially data-rich period of the past 100-150 years (Santer et al., 1995, 1996; Tett et al., 1996, 1999; Folland et al., 1998; Hegerl et al., 1997, 2000; Stott et al., 2001). These studies generally find that a combination of natural and anthropogenic forcing is necessary to reproduce early twentieth century changes, while anthropogenic forcing dominates the warming of the latter twentieth century (e.g., Hegerl et al., 2000). However, studies using the instrumental record are limited to a relatively brief (roughly one-century) interval, during which it is difficult to cleanly separate the responses to multiple anthropogenic and natural radiative forcing (Stott et al., 2001).
Longer-term climate model studies have focused on coarser (e.g., hemispheric mean) changes over the past few centuries to millennia (Free and Robock, 1999; Rind et al., 1999; Crowley, 2000; Waple et al., 2002; Shindell et al., 2001b, 2003; Bertrand et al., 2002; Bauer et al., 2003; Gerber et al., 2003; Hegerl et al. 2003; Gonzalez-Rouco et al., 2003) using radiative forcing histories such as those shown in Figure 3-7. The forcing histories include nineteenth and twentieth century anthropogenic radiative forcing (greenhouse gas and sulfate aerosol forcing and, in some cases, land-use changes), and longer-term estimates of natural (volcanic and solar)
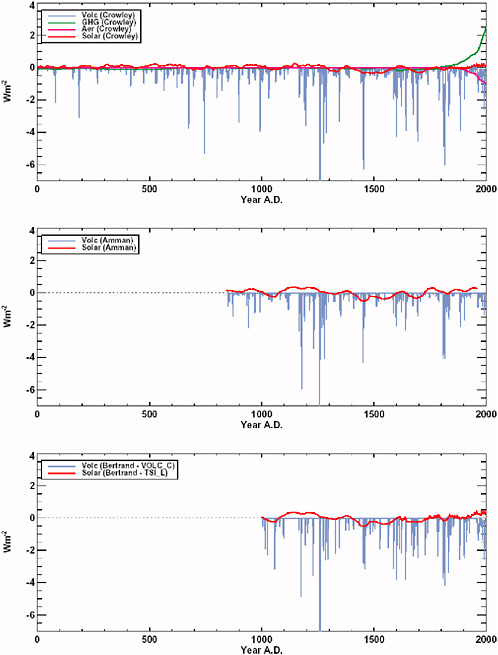
FIGURE 3-7 Estimates of natural and anthropogenic radiative forcings over the last couple of millennia used by climate models: (a) forcings used by Crowley et al. (2003), (b) solar and volcanic forcings used by Ammann et al. (2003), and (c) solar and volcanic forcings used by Bertrand et al. (2002). All forcings are expressed in watts per square meter and represent global averages (a and c) and averages for the Northern Hemisphere (b). For panels (b) and (c) the greenhouse gas and sulfate aerosol forcing will be similar to that used in (a). All solar forcing series are expressed as anomalies from the mean value of 1365.6 W m−2 (Lean et al., 1995). Details of the extension of the solar series before visual-based observations began in the early seventeenth century are given in Bard et al. (2000) and Crowley (2000). Over this period, the solar forcing in (a) is slightly smaller than the other two because it applies the background trend not to the Maunder Minimum period but to the 10Be estimates for the earlier Spörer Minimum. Volcanic forcing is converted to watts per square meter by multiplying the aerosol optical depth estimates made from ice cores by −21 (Hansen et al., 2002). Volcanic forcing dips below −7 W m−2 in either 1258 (panels a and b) or 1259 (panel c) to −9.1, −11.9, and −8.3 W m−2, respectively, in the three panels. SOURCE: Jones and Mann (2004).
radiative forcing histories over the past 1000 years. These longer-term estimates are based on proxy sources and carry with them certain caveats as discussed in Chapter 2. Figure 3-8 compares the results of simulations of externally forced changes in Northern Hemisphere temperature averages over the past one to two millennia to a reconstruction of Northern Hemisphere mean temperatures from proxy data (Mann and Jones, 2003). These are generally consistent (Figure 3-8) with the reconstruction roughly at the center of the spread of the various model estimates. As the uncertainties in model estimates and climate reconstructions are entirely independent, the level of agreement between the two suggests a significant degree of reliability in the common features between them such as the moderate temperatures from A.D. 1000 to A.D. 1300, the colder conditions from A.D. 1400 to A.D. 1900, and the late twentieth century warmth.
The simulations suggest explosive volcanism is the primary source of changes in natural radiative forcing in past centuries, while anthropogenic forcing increasingly dominates hemispheric mean temperature trends during the nineteenth and twentieth centuries (Hegerl et al., 2003). Solar variability appears to play a significant, although somewhat lesser role, over the same time period (Crowley, 2000; Bertrand et al., 2002; Bauer et al., 2003; Gerber et al., 2003). The combined influence of volcanic and solar forcing appears to provide an explanation of the relatively cool hemisphere mean temperatures from A.D. 1400 to A.D. 1900. Shindell et al. (2003) have argued from model results that regionally—for example, in the North Atlantic and in Western Europe—the climate response to change in solar irradiance may have been more important than volcanism.
During the nineteenth and twentieth centuries, human land-use changes appear to have played a potentially significant role in the large-scale radiative forcing of climate. Bauer et al. (2003) used a climate model to examine the biophysical forcing from deforestation, including increased surface albedo as well as reductions in evapotranspiration and surface roughness. Their simulation can reproduce the actual Northern Hemisphere mean temperatures during the nineteenth and early twentieth centuries, while simulations without this forcing (Crowley, 2000; Bertrand et al., 2002; Gerber et al., 2003) are too warm. Simulations that do not include land-use changes may exhibit an artificially cold pre-nineteenth century mean temperature relative to empirical estimates when, as in Figure 3-8, the model simulation results have been aligned vertically to have the same mean as the instrumental temperature record during the late nineteenth and twentieth centuries. The issue of the role of late twentieth century land-use changes in surface temperature measurements is currently being debated in the scientific literature (e.g., Kalnay and Cai, 2003; Marshall et al., 2004a; Trenberth, 2004; Vose et al., 2004) and is worthy of further investigation.
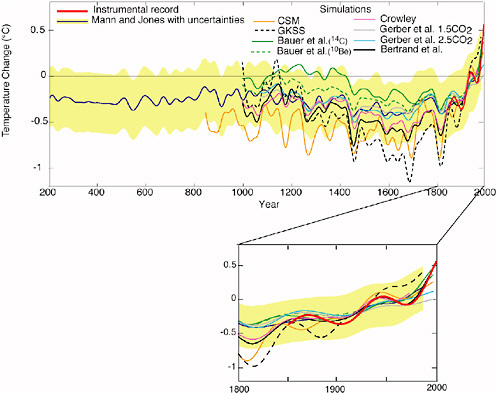
FIGURE 3-8 Model-based estimates of Northern Hemisphere temperature variations over the past two millennia. Shown are 40-year smoothed series. The simulations are based on varying radiative forcing histories, employing a hierarchy of models including one-dimensional energy-based models (Crowley, 2000), two-dimensional reduced complexity models (Bertrand et al., 2002; Bauer et al., 2003; Gerber et al., 2003), and full three-dimensional atmosphere-ocean general circulation (GKSS—Gonzalez-Rouco et al., 2003; CSM—Ammann et al., submitted). Shown for comparison are the instrumental Northern Hemisphere record for 1856-2003 and the proxy-based estimate of Mann and Jones (2003) extended through 1995 (see Jones and Mann, 2004) with its 95 percent confidence interval. Models have been aligned vertically to have the same mean over the common 1856-1980 period as the instrumental series (which is assigned zero mean during the 1961-1990 reference period). The inset provides an expanded view of changes over the past two centuries. SOURCE: Jones and Mann (2004).
Comparisons between long-term model simulations and empirical reconstructions can provide some potential insight into the sensitivity of the climate system to radiative forcing (e.g., Crowley and Kim, 1999). Preliminary climate system modeling, with an emphasis on the carbon cycle of the past millennium (Gerber et al., 2003), indicates that the larger-amplitude century-scale variability evident in some temperature reconstructions is inconsistent with constraints provided by comparison of modeled and observed pre-anthropogenic CO2 variations. This reinforces the evidence for relatively modest (less than 1°C) variations prior to the twentieth century and for a moderate equilibrium climate sensitivity of roughly 2-3°C for a doubling of CO2 concentrations (e.g., Cubasch et al., 2001).
Volcanic and solar radiative forcing of changes in the El Niño/Southern Oscillation (ENSO) in past centuries (Ruzmaikin, 1999; Adams et al., 2003; Mann et al., 2005) may explain preliminary empirical evidence for a prevalence of La Niña-like conditions during the eleventh to fourteenth centuries, and El Niño-like conditions during the seventeenth century (Cobb et al., 2003). Such findings, along with anthropogenic land-use change, further emphasize the potential spatial complexity of the climate in response to past changes in radiative forcing.
LAST 25 YEARS
The last 25 years feature unprecedented data documenting simultaneous variations in radiative forcings, climate feedbacks, and climate itself. Many of the more recent datasets have been acquired using space-based instruments, which achieve essentially continuous, global coverage compared to ground-based observations. Space-based observations are available for solar irradiance; volcanic aerosols; concentrations of ozone, CO2, other greenhouse gases, and CFCs; cloud cover and cloud properties; water vapor; land features, including snow cover, ice, and albedo; temperature of the ocean, land surface, and atmosphere; and other quantities relevant to radiative forcing. Indices are routinely produced, including for ENSO and the North Atlantic Oscillation, based on the extensive datasets and new analysis procedures that extract variability modes. Many of the original databases have been reprocessed, recognizing the need for improved algorithms to remove instrumental drifts so as to better quantify actual change. Examples include the National Centers for Environmental Prediction reanalysis of atmospheric variables, the ISCCP cloud data, and the ground-based Dobson ozone network.
Furthermore, the epoch of the past 25 years is sufficiently long that a range of natural radiative forcing strengths and internal variability modes is sampled concurrently with known anthropogenic forcings. This period includes notable volcanic episodes (i.e., El Chichon, Mt. Pinatubo), two com-
plete solar activity cycles, major ENSO events, land-use changes, and significant increases in greenhouse gases, chlorofluorocarbons, and anthropogenic aerosols. Understanding climate forcings and effects in the last 25 years is a key requirement for securing reliable predictions of future climate change based on forcing scenario studies. Mt. Pinatubo, providing an estimated −3 W m-2 global mean surface radiative forcing, is a particularly important test case for examining model-based predictions of response to radiative forcing. The observed surface cooling of roughly 0.4°C has been shown to be consistent with model-estimated responses (Hansen et al., 1992, 2002). Model experiments imposing the inferred vertical radiative forcing profile of Mt. Pinatubo have closely reproduced (Kirchner et al., 1999) the expected seasonal pattern of summer continental cooling and winter warming.
Datasets spanning the past 25 years facilitate a comparison of empirical analysis and model simulations of radiative forcings and their effects on climate. Model experiments employing a combination of anthropogenic and volcanic radiative forcing best match the vertical pattern of temperature changes (Santer et al., 2000) and tropopause height changes (Santer et al., 2003b) over the past couple of decades. A multiple regression analysis of the ENSO index (defined by tropical Pacific sea surface temperatures), volcanic aerosols (according to stratospheric optical depth), solar irradiance (from direct space-based observations), and a linear trend has been argued to reproduce a significant fraction of variability in estimated global lower tropospheric temperatures (Douglass and Clader, 2002). In the latter study, the linear trend was attributed to anthropogenic forcing (a combination of greenhouse gas warming and tropospheric aerosol cooling), while a cooling of 0.5°C was inferred for the Pinatubo eruption and 0.1°C cooling for the solar cycle decrease (forcing of 0.2 W m-2). These latter conclusions must however be treated with caution because other studies using optimal detection approaches indicate that it is difficult to statistically separate the responses to more than two or three distinct natural and anthropogenic forcings even with a century of data (Stott et al., 2001). Moreover, certain indicators used in the study (e.g., ENSO indices) are not physically or statistically independent of the radiative forcings themselves (e.g., Cane et al., 1997; Collins, 2000; Adams et al., 2003; Mann et al., 2005).
Another study of climate change over the past few decades (Hansen et al., 2002) used a general circulation model to estimate forced changes in both surface temperature estimates and the vertical structure of temperature change (the latter as diagnosed from different channels of the MSU satellite observations). The forcings included well-mixed greenhouse gases, stratospheric (volcanic) aerosols, solar irradiance, ozone, stratospheric water vapor, and tropospheric aerosols. The authors found that observed global temperature change during the past 50 years is primarily a response
to radiative forcings. They also found that the specification of observed sea surface temperature changes improves the reproduction of the vertical structure of temperature changes. The latter finding is consistent with other studies indicating that SSTs contain additional information (related perhaps to dynamical changes in the climate associated, for example, with ENSO or the annular modes) with regard to the patterns of response to forcing not necessarily produced by the atmospheric response to radiative forcing changes alone (Folland et al., 1998; Sexton et al., 2003).
During the past 25 years, the stratosphere has witnessed significant climate change (Ramaswamy et al., 2001; Shine et al., 2003; Ramaswamy and Schwarzkopf, 2002; Schwarzkopf and Ramaswamy, 2002). Indeed, the temperature at 1 mb has dropped significantly over the past two decades. Models are able to explain the cooling of the lower stratosphere in terms of stratospheric ozone loss; upper stratosphere cooling is due to a combination of ozone change and greenhouse gas increases.


