
5
Point and Standoff Detection Technologies
Environmental detection of biological agents in real time is a difficult process. Not only are there a large number of different possible biological agents to detect, but many of them are similar to nonhazardous organisms normally found in the environment.1 Once the biological agents have been transported away from their release point, their concentration may be very low compared with the background against which they must be detected. For this reason, detection at or near the point and time of release offers the best opportunity for distinguishing a potential biological agent attack from fluctuations in the natural background. Simulant tests and modeling results using a nominal density of biological agents of 1012 organisms per gram demonstrate that a concentration of 1,000 particles per liter or greater will remain in the vicinity of a biological agent release with a source term of approximately 1 kilogram for 5 to 20 minutes.2 The actual times are extremely dependent on wind speed and proper formulation of agent. Faster wind speeds result in a more rapid dispersion of the cloud.
As discussed in Chapter 1, the detection of an aerosol cloud is distinct from the identification of the contents of that cloud. Depending on their cost and level of sophistication, detectors can provide rapid but nonspecific information about the aerosol particles, such as:
-
Number of particles within a given size distribution.
-
Distinction between biological and nonbiological particles.
-
Possibly, in the future, distinction between viable and nonviable organisms.
The ability to distinguish biological from nonbiological particles is important for reducing false alarm rates. By contrast, identification techniques are capable of determining the specific organism or toxin used in a biological agent attack, though usually with a longer response time than detectors. As discussed in Chapter 2, detector alarms could trigger low-regret responses as well as the initiation of more specific identification procedures in a cascaded sensor architecture.
Detection technologies can be employed either as point or standoff devices. In point detection applications, the biological organisms must pass through the actual detection element. Standoff detection is detection of a biological agent cloud at some distance (on the order of kilometers) from the target and
from the detector itself.3 Spectroscopic point detectors may be deployed outside at strategic locations around an extended potential target or inside buildings, either in HVAC ductwork or open occupied areas. Standoff detectors are generally considered for outdoor applications; however, this same technology can be employed for line-of-sight detection within open air structures as well. This chapter examines the current state of the art of both point and standoff detection technologies.
POINT DETECTION TECHNOLOGIES
Nonspecific spectroscopic point detectors typically consist of a particle collection and concentration system, a laser light source, and appropriate electronics for determination of the size, shape, and spectral signature of aerosol particles. Aerosol collectors and concentrators play a key role in a rapid detection system. In order for airborne particles to be characterized by a laser light source, the particles must be brought to the laser. This step sometimes involves concentration of the particles through the use of a multistage virtual impactor, discussed in Chapter 4. The virtual impactor generates an airstream of concentrated particles in the desired size range.4 The airflow maintains a constant velocity during the measurement period.
The measurement of a particle's size is based on its inertial behavior in the airstream; smaller particles accelerate faster than larger particles.5 Using a dual laser system, the time of flight of a single particle can be determined. These times are compared with reference tables generated using particles of unit density (1 gram per cubic centimeter) and defined diameters to determine particle size. Utilizing both forward and backscattered light collected by multielement intensified solid-state arrays, one can ascertain key shape information. As long as the wavelength of light is shorter than the diameter of the particle, this scattering provides useful information. Resolution of shape information can be performed to about 1 μm. Current systems can analyze between 5,000 and 10,000 particles per second.
The U.K. Dstl has developed an operation system for the simultaneous measurement of particle shape, size, and number by the spatial analysis of the scattered light pattern. Utilizing high-angle spatial scattering data from a triple photomultiplier tube (PMT) detector, researchers have demonstrated differential light-scattering patterns that allow discrimination of cubes, spheres, curved fibers, flakes, straight fibers, and an irregular background. As with most optical interrogations, the analysis is simplified for a homogeneous population.
Biological and nonbiological particles can be distinguished from one another by their light absorption and fluorescence characteristics. Standard excitation between 260 and 280 nm excites the amino acids with conjugated double bonds: tryptophan, tyrosine, and phenylalanine. Of these three, tryptophan has a fivefold greater absorption cross section than the other two (see Figure 5.1) and is the principal component of protein absorption and emission at these wavelengths.
Other sources of fluorescence that absorb at longer wavelengths are the nicotinamides and riboflavins. The fact that the reduced form of nicotinamide adenine dinucleotide phosphate, [NAD(P)H], absorbs at a different wavelength from the oxidized form, NAD(P), provides a potential method for distinguishing between viable and nonviable bacteria. When bacteria die, they convert to the oxidized state. Therefore, the differential between NAD(P)H and NAD(P) can provide viability information in near real time. Current laboratory efforts are under way to exploit this parameter. If successful, this would significantly enhance the current ability to determine viability at the same time as discriminating biological from nonbiological particles in the environment.
An example of mature particle detection apparatus is the Met One Instruments line of particle counters. These systems are representative of multichannel particle size characterization devices that can accurately count particles in a variety of size distribution windows. These systems are reliable and
|
3 |
National Institute of Justice. 2001. An Introduction to Biological Agent Detection Equipment for Emergency First Responders, NIJ Guide 101-00. Available online at http://www.ncjrs.org/pdffiles1/nij/190747.pdf. Accessed August 2003. |
|
4 |
Stuebing, 2002. See note 2 above. |
|
5 |
Stuebing, 2002. See note 2 above. |
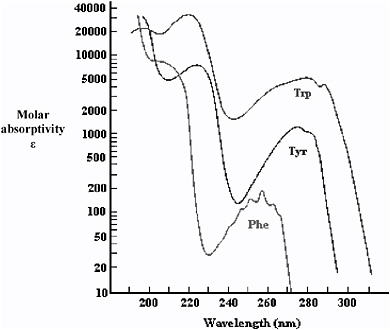
FIGURE 5.1 Ultraviolet absorption spectra of conjugated amino acids tryptophan, tyrosine, and phenylalanine.
are sold as elements of a larger system or as individual handheld devices. Although the acquisition of particle size and shape information is rapid, these systems do not provide information about the biological nature of the detected particles.
Current Instrumentation
Researchers at MIT's Lincoln Laboratory are currently funded for the development and field-testing of the Biological Agent Warning Sensor (BAWS). The BAWS system began development in 1996 and was transitioned to the Joint Program Office for Biological Defense in 1999. The current version is BAWS III, incorporating design improvements and decreases in size and power requirements relative to earlier versions. The system uses a pulsed ultraviolet laser and makes three measurements: ultraviolet energy absorbance and fluorescence, visible light absorption, and elastic scattering of ultraviolet light. The system can discriminate among dirt, bacteria, and pollen. It has also been demonstrated to detect protein-containing airborne particles that are representative of protein toxins. This system has been field-tested many times in various environments. The BAWS costs about $100,000 per device. A recent commercial product, the Bioni, costs around $25,000 per device. In addition, there is a DARPA program to develop ultraviolet light-emitting diodes and laser diodes.
Particle detection and discrimination systems are plagued by the reality that the environmental load of bacteria fluctuates significantly. The fluctuations frequently are related to environmental conditions and usually have a predictable variation, but this is not always the case. Indoor environments, although cleaner, also have significant variances related to the cycling of the air circulation system and movement of personnel. The approach the BAWS researchers have taken to address these natural fluctuations is to compare the current signal with that obtained over the preceding 10 to 15 minutes. This provides an internal reference to correct for ambient fluctuations. The design goal for the BAWS detection threshold was 25 agent-containing particles per liter of air (ACPLA) or better with a 1-minute response time. The system is reported to have between 1 and 20 false alarms per day, depending on the environmental conditions. A similar system has been developed jointly by the Canadian and U.S. governments and industries.
Fluorescence aerodynamic particle sizing (FLAPS) is a technology developed by TSI Incorporated and Canadian Defense Research and Development at Suffield. The technology is similar to that
employed by the BAWS system. The FLAPS system is based on the characterization of individual particles concentrated by a three-stage virtual impactor (discussed earlier). Threat determinations are based on particle size and fluorescence intensity. Size is determined using a dual laser and making calculations based on particle acceleration rates. Excitation is accomplished using a near-ultraviolet laser. The researchers have chosen the near-ultraviolet rather than the far-ultraviolet energies in an attempt to improve signal to noise ratios. The FLAPS system is reported to have a sensitivity of less than 15 ACPLA within 18 seconds with a near 100 percent probability of detection. The most recent version, FLAPS3, uses a diode laser exciting the particles at 405 nm.
The U.K. Ministry of Defence is conducting research and development on a fluorescence and shape analysis system.6 This system uses a dual laser that generates fluorescence as described above but adds an element that analyzes asymmetry to provide further confidence in the detection of biological particles. The log-scale plotting of fluorescence against shape analysis provides a scatter plot that can distinguish biological agents from a variety of molecules that commonly interfere in the analysis.
One approach for determining whether biological organisms are living or dead is based on detection of the presence of adenosine triphosphate (ATP) in living cells. This system requires the bacteria to be in an aqueous medium for analysis. Vegetative bacteria are lysed and the ATP interacts with an enzyme to generate light. A photomultiplier tube captures the light and generates an output proportional to the number of bacteria present. The device is called a luminometer because it determines the amount of light produced using ATP as the energy source. This approach can detect spores if the spores have had time to germinate into vegetative organisms, but ungerminated spores do not contain sufficient levels of ATP to be detected by this method. Furthermore, this technology cannot detect the presence of toxins or nonliving bacteria. Advances in technology have resulted in the production and sales of handheld luminometers from both New Horizons and Biotrace. Current sensitivity ranges for these systems are in the range of 105 to 107 organisms per milliliter (depending on the specific system), with response times of 1 to 2 minutes. These systems cannot discriminate between pathological and nonpathological bacterial species and do not provide identification.
The U.K. Ministry of Defence has an operational biological particle system that uses yet another approach. This system uses orthogonal detection techniques to discriminate biological from nonbiological as well as bacteria from pollen. The first discrimination is based on high-angle, special light-scattering properties. Different shaped particles produce characteristic scattering patterns. Particles are collected into an aqueous medium by a cyclone sampler. This particle discrimination and collection system is in line with a continuous flow luminometer for further characterization of the particulate material. The luminometer performs a differential extraction to distinguish between pollen and bacteria. During the harsh extraction, ATP is released from both bacteria and nonbacterial cells. During the weak extraction, ATP is released only from the nonbacterial cells. The difference between the two measurements represents the bacterial content of the sample. While this system provides near-real-time detection (less than a minute) of biological material, it is reagent intensive and therefore presents a logistical challenge. Efforts are under way to generate technologies to minimize reagent requirements.7
Point Detection Summary
Point detection technologies have shown promise of providing detect-to-warn (DTW) capability, both within a building and outside a facility. Although the aerosol background in both scenarios fluctuates significantly, as highlighted in Chapter 3, the committee believes these systems provide significant value. The size, shape, and fluorescent properties of background particles can be characterized, and their fluctuations modeled and histories incorporated into the analysis algorithm, so as to minimize their effects on the system.
|
6 |
V. Foot, Dstl. Presentation to the committee on April 15, 2002. |
|
7 |
Foot, 2002. See note 6 above. |
Point detection systems present less of a manufacturing challenge than the larger and more powerful standoff detection systems, discussed below. Aerosol particle counting systems are commercially available but on their own do not provide the fidelity of information required for detection of biological components. However, further information regarding particle shape can be obtained without the incorporation of additional laser sources. If additional laser sources are used, the absorption and fluorescence properties of biological material can be exploited to yield a system with rapid detection and a much lower false alarm rate. The key enabling technology appears to be low-cost, robust ultraviolet sources (e.g., light emitting and laser diodes), which are being pursued in ongoing DARPA-funded research programs.
Of the two scenarios considered in this report (internal and external release), the point detection capability is best suited for detection of an internal release of biological agent. One reason is that the internal concentration of biological aerosol particles is likely to be higher for a longer period after the release due to the limited air volumes in enclosed spaces and the lack of weather. A second major distinction between the two scenarios is the fluctuation of the background environments. The fluctuations are frequently associated with discrete events such as people entering or leaving a room.8 Such events and associated fluctuations can be incorporated into an analysis system to normalize the values. Background fluctuations in the outside release scenario are less predictable and therefore harder to normalize. Accurate detection will require protocols for minimizing extraneous aerosols.
STANDOFF DETECTION TECHNOLOGIES
Standoff detection technology relies on the measurement of energy transmission through the atmosphere to detect and distinguish biological agents from other atmospheric pollutants.9 The atmosphere has two main components: the molecular atmosphere (primarily oxygen and nitrogen) and aerosol particles, with the concentration of the latter being highly variable on a short time scale.10 Laser remote sensing, known as light detection and ranging (lidar) has been used successfully for years to detect and measure atmospheric properties of both gases and particulates.11 One of the major limitations to remote sensing is the variable transparency of the atmosphere to transmitted light of different wavelengths. There is significant atmospheric absorption of the light by the various gases in the atmosphere, as well as scattering of light by natural aerosols.
Figure 5.2 shows the vertical spectral transmittance from the top of the atmosphere to ground level.12 Similar spectral trends are expected for the actual transmittance paths and distances used in biological standoff detection, though the actual transmittance values will be different and depend on the details of the observation path. Transmittance may be reduced due to the presence of pollen, fungi, protozoa, bacteria, viruses, particulate matter, and chemicals from plants, soils, farming, human and animal activity, industrial pollution, and pollution from internal combustion engines.13 Airborne organic pollutants can
|
8 |
There are exceptions, such as sites where environmental growth of organisms is occurring or where water spray devices are operating. |
|
9 |
NIJ, 2001. See note 3 above. |
|
10 |
M.D. Roberts. 2001. Atmospheric analysis techniques at HiRes. Proceedings of the International Cosmic Ray Conference, 645-648. |
|
11 |
Chemical and Biological Defense Information Analysis Center (CBIAC). 2001. Artemis Analysis of Alternatives Final Report. Aberdeen Proving Ground, Md.: CBIAC. S.N. Mikhailenko, V.L.G. Tyuterev, V.I. Starikov, K.K. Albert, B.P. Winnewisser, M. Winnewisser, G. Mellau, C. Camy-Peyret, R. Lanquetin, J.M. Flaud, and J.W. Brault. 2002. Water spectra in the region 4200-6250 cm-1: Extended analysis of v1 + v2, v2 + v3, and 3v2 and bands and conformation of highly excited states from flame spectra and from atmospheric long-path observations. Journal of Molecular Spectroscopy 213:91-121. M. Sasano, N. Hayashida, T. Minagawa, M. Teshima, T. Yamamoto, M. Chikawa, Y. Morizane, K. Yasui, S. Kawakama, P. Sokolsky, L. Wiencke, and M. Roberts. 2001. Atmospheric monitoring in Utah using the back scatter lidar method. Proceedings of International Cosmic Ray Conference, 653-656. |
|
12 |
G. Guyot. 1998. Physics of the Environment and Climate. New York: John Wiley & Sons. |
|
13 |
P. Biggins, Dstl. Presentation to the committee on April 15, 2002. J. Ho, P. Hairston, and M. Spence. 2001. Biological Detector Performance with a 402 nm Laser Diode. DRES TR 2000-190. |
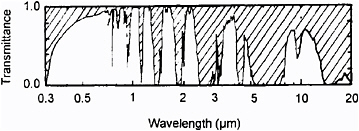
FIGURE 5.2 Mean spectral transmittance of the atmosphere between 0.2 and 20 μm.
react with ozone to form species that fluoresce broadly at 300 to 800 nanometers (nm) after excitation at short wavelength ultraviolet radiation.14
The concentrations and compositions of natural aerosols are variable, depending on the part of the world, the season, meteorological conditions, solar flux, and time of day (see Chapter 3). There are diurnal and annual cycle variations, especially in amounts of airborne, culturable bacteria.15 Not all of the airborne bacteria are culturable; one estimate suggested that less than 10 percent can be cultured. Of those cultured, approximately 28 percent are not identifiable and 31 percent are from the genus Bacillus.16 For one set of outdoor measurements, the average outdoor background in an urban area varies from 101 to 104 organisms per liter, depending on the time of day.17
All aerosol particles in the atmosphere illuminated by light both absorb and scatter that energy, diminishing the energy of the incident light. The attenuation process or extinction measured is concerned with attenuation along the optical path. Scattering from molecules in the air is known as Rayleigh scattering, while scattering from aerosol particulates is Mie scattering.18 Scattering is a function of the ratio of the molecular or particle diameter to the wavelength of incident light; all aerosol particles will scatter light, but absorption can occur only at specific wavelengths at which electronic transitions can occur in the absorbing species.19
Standoff detection systems use lasers to illuminate the biological agent aerosol cloud. The incident laser pulse will undergo elastic Mie scattering, with some of the energy being back-scattered to the laser receiver, giving rise to so called elastic backscatter lidar. In this case, the amplitude of the return signal is proportional to the number of aerosol particles present, and the time delay of the return signal with respect to the original laser pulse yields the distance of the cloud. In those cases where the wavelength of the laser pulse corresponds to an absorption band in the aerosol, some of the laser energy will be absorbed and can then be reemitted at a different wavelength characteristic of the chemical composition of the aerosol (fluorescence). This is the basis of laser-induced fluorescence lidar. Elastic backscatter lidars typically operate in the infrared (1 to 10 μm), while ultraviolet-laser-induced fluorescence lidars (UV-LIF) typically operate at wavelengths of 200 to 400 nm.20 The Department of Defense is currently pursuing an elastic backscatter lidar to detect suspicious aerosol clouds out to distances up to 50 kilometers and a UV-LIF lidar to then interrogate these clouds at distances of several kilometers to determine whether they contain significant amounts of biological aerosols. These and other remote sensing systems are described in the sections below.
|
|
Suffield, Canada: Defence Research Establishment Suffield. S.R. Long, U.S. Army. Presentation to the committee on April 15, 2002. |
|
14 |
NIJ, 2001. See note 3 above. |
|
15 |
Long, 2002. See note 13 above. Biggins, 2002. See note 13 above. |
|
16 |
Long, 2002. See note 13 above. |
|
17 |
Biggins, 2002. See note 13 above. |
|
18 |
Guyot, 1998. See note 12 above. |
|
19 |
V. Butalov, M. Fischer, and I. Schecter. 2002. Aerosol analysis by cavity-ring-down laser spectroscopy. Analytica Chimica Acta 466:1-9. |
|
20 |
NIJ, 2001. See note 3 above. G. Rubel, U.S. Army. Presentation to the committee on April 15, 2002. |
Ultraviolet Systems
An ultraviolet lidar system that causes amino acids and other biomolecules present in biological materials to fluoresce is currently under development by the DoD Program Executive Office (BioDefense) (PEO-BD).21 In one implementation, a short-range UV-LIF lidar actively irradiates a suspected biological agent aerosol cloud with light at 280 nm; the induced fluorescence return is measured at 350 nm. This methodology is based on conventional analytical techniques historically used to measure protein concentration.22 Tyrosine, tryptophan, and phenylalanine, which are present in the cell material of all biological organisms and the cell wall of bacterial spores, all absorb energy between 260 and 280 nm. The fluorescence signal seen is from the amino acid tryptophan, which absorbs strongly at 280 nm and fluoresces at 348 nm.23
A short-wavelength UV-LIF system (e.g., 260 to 280 nm) is likely to be most effective at night or during low light periods because of the relative opacity of the air to these wavelengths and to the high ultraviolet background during the day. It is important to note that the UV-LIF does work for standoff detection during daylight hours, but its range is not as great as during nondaylight hours. For this reason, the design of any battlefield defensive architecture should be preceded by a significant amount of systems analysis to examine possible architectures, their cost-benefit trade-offs, and their concept of operations. Addition of longer wavelength excitation may extend the daytime range and provide additional spectral information to aid in the discrimination of clouds of biological agents. A 355-nm excitation wavelength causes reduced nicotinamide adenine dinucleotide (NADH) to fluoresce. The resulting spectrum has a maximum at approximately 475 nm, although the fluorescence emission is quite broad, spread from 400 nm to 525 nm.24 Using a 400 nm excitation wavelength causes fluorescence in riboflavin; that emission is centered around 525 nm (see Figure 5.3).25
The advantage of a UV-LIF system over an IR system is that it can detect fluorescence emissions in wavelength regions characteristic of biological molecules such as riboflavin and therefore can distinguish a biological aerosol from nonbiological particulates. It is available now as a prototype and it has been demonstrated to detect biological aerosols up to approximately 1 kilometer away.26 Selection of the appropriate excitation wavelength depends on the species being interrogated as well as the desired range. Backscatter intensity is greater at shorter wavelengths, but so is atmospheric attenuation. The net effect is that maximum ranges are reduced for shorter wavelengths.27 For 355 nm wavelengths, the range can be 2 to 4 kilometers. There are other systems used for meteorological observation that employ three wavelengths (355 nm, 532 nm, and 1064 nm), with reported ranges up to 10 kilometers.28
UV-LIF may not specifically distinguish biological agents from other biological material; a fluorescence response at 350 nm after excitation at 260-280 nm only means that protein with tryptophan is probably present. It is not an indication of living organisms, nor is it necessarily distinctive of bacteria. In principle, a fluorescence peak centered at 475 nm after excitation at 355 nm, which is attributed to NAD(P)H, could be used to distinguish living from dead bacteria. As bacteria die, their NAD(P)H becomes oxidized to NAD, so this peak could indicate living organisms. However, there are conflicting reports about the source of the fluorescence from irradiation at 355 nm; some researchers29 suggest that
|
21 |
Rubel, 2002. See note 20 above. |
|
22 |
Ho et al., 2001. See note 13 above. |
|
23 |
A.L. Lehninger. 1975. Biochemistry. New York: Worth Publishers, Inc. CBIAC. 1995. State of the Art Report: Biological Warfare Agent Detection Technologies. Aberdeen Proving Ground, Md.: CBIAC. |
|
24 |
Ho et al., 2001. See note 13 above. |
|
25 |
Ho et al., 2001. See note 13 above. |
|
26 |
Rubel, 2002. See note 20 above. |
|
27 |
CBIAC, 2001. See note 11 above. |
|
28 |
EARLINT. 2000. A European Aerosol Research LIDAR Network to Establish an Aerosol Climatology. Handbook of Instruction, Max-Planck-Institut fur Meteorologie, Hamburg, Germany. Available at http://LIDARb.dkrz.de/earlinet/handbkinstr.pdf. |
|
29 |
J.D. Eversole, W.K. Cary, Jr., C.S. Scotto, R. Pierson, M. Spence, and A.J. Campillo. 2001. Continuous bioaerosol monitoring |
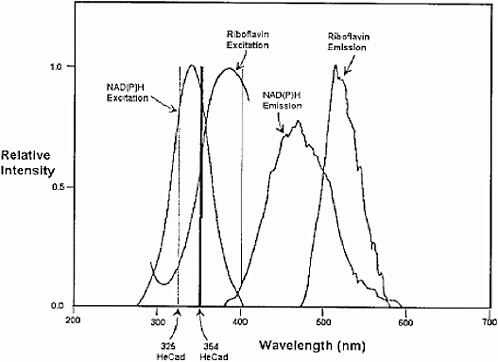
FIGURE 5.3 Excitation and emission spectra of two biomolecules associated with cellular metabolism.
the fluorescence is from NAD(P)H or flavins. Other reports propose that the fluorescence is from growth media, which contains proteins, or at least peptides.30 The fluorescence return from irradiation at 260-280 nm is more intense than the return from irradiation at 355 nm; shorter wavelength (and higher energy) photons excite more molecules.31 However, this more energetic return is offset by atmospheric degradation.32
Standoff Detection Summary
The reported effective nighttime ranges for UV-LIF prototype systems operating at 260-280 nm excitation wavelength are approximately 1 km, using approximately 1,000 particles per liter in a clear atmosphere (visibility 23 km) as the detection limit.33 Projected ranges for a comparable system operating at excitation wavelengths of 355 nm are 2 to 4 kilometers, with sensitivity limits of hundreds of particles per liter of air.34
While UV-LIF systems do allow the discrimination of biological from nonbiological aerosols, they have several shortcomings. They have a shorter range than infrared-based systems, because the shorter ultraviolet wavelengths are more attenuated by the atmosphere.35 They are nonspecific in that they
|
|
using UV excitation fluorescence: Outdoor test results. Field Analytical Chemistry and Technology 15:205-212. Jim Ho. 2002. Future of biological aerosol detection. Analytica Chimica Acta 457:127-150. Ho et al., 2001. See note 13 above. |
|
30 |
CBIAC, 2001. See note 11 above. |
|
31 |
P. Hairston and J. Ho, Defense Research Establishment Suffield, Canada. Biological particle discrimination based on individual particle measurements using near UV fluorescence excitation. Presentation to the committee on April 15, 2002. |
|
32 |
Hairston and Ho, 2002. See note 31 above. CBIAC, 2001. See note 11 above. |
|
33 |
Hairston and Ho, 2002. See note 31 above. Rubel, 2002. See note 20 above. |
|
34 |
John Vitko, Department of Homeland Security. 2002. Discussions with the committee. |
|
35 |
CBIAC, 2001. See note 11 above. |
cannot identify the specific biological organism or discriminate nonpathogenic from pathogenic.36 Further, the source of the fluorescence signal is uncertain.37 There may be some backscatter signals from natural aerosols that could interfere with the detection. It is unlikely that chemicals present in the atmosphere interfere, since they do not fluoresce as efficiently as particles.38
NOVEL OR ADVANCED STANDOFF DETECTION TECHNIQUES
The Department of Defense is conducting basic and applied research into a broad range of electromagnetic techniques to see whether they have the potential for extending the detection range and increasing the specificity for remote detection of biological agents. At this writing, they are all in the early research stage and require significant laboratory analysis and systems modeling before they would warrant moving to a breadboard stage. Representative examples of these novel approaches are given below.
Ultraviolet Resonance Raman Spectroscopy
In this technique, ultraviolet light is used to enhance Raman spectral lines at wavelengths corresponding to electronic vibrational mode transitions of the target molecule.39 In the laboratory, this ultraviolet resonance Raman (UVRR) technique uses ultraviolet energy to excite DNA40 or protein amino acids41 to excited state saturation, then measures the Raman spectral shift. The UVRR shift is usually measured in the range of 600 to 1,800 per centimeter, using conventional ultraviolet-visible IR instruments.42 The method has a distinct advantage over conventional Raman spectroscopy in that emission intensity is enhanced by a factor of 103 to 106.43 Additionally, UVRR reduces the complexity of peptide and protein Raman spectra because it selectively enhances only a few of the first excited state vibrational transition modes.44 Consequently there are fewer spectral lines for analysis. Further, the spectral bands are much narrower (~10 per centimeter) than usually seen with absorption spectroscopy, with little overlap. Resonant Raman scattering is limited to those vibrational modes for which the excited state is in resonance with the excitation wavelength.45 Use of ultraviolet excitation wavelengths below
|
36 |
CBIAC, 2001. See note 11 above. Rubel, 2002. See note 20 above. |
|
37 |
Ho, 2002. See note 29 above. |
|
38 |
A number of polyaromatic hydrocarbons do fluoresce, and the potential of these compounds to interfere in the analysis should be studied further. CBIAC, 2001. See note 11 above. |
|
39 |
Q. Wu, W.H. Nelson, S. Elliot, J.F. Sperry, M. Feld, and R. Manoharan. 2000. Intensities of E. coli nucleic acid Raman spectra excited selectively from whole cells with 251 nm light. Anal. Chem. 72:2981-2986. Q. Wu, T. Hamilton, W.H. Nelson, S. Elliot, J.F. Sperry, and M. Wu. 2001. UV Raman spectral intensities of E. coli and other bacteria excited at 228.9, 244.0, and 248.2 nm. Anal. Chem. 73(14):3432-3440. |
|
40 |
Wu et al., 2000. See note 39 above. |
|
41 |
S.P.A. Fodor, R.P. Rava, T.R. Hays, and T.G. Spiro. 1985. Ultraviolet resonance Raman spectroscopy of the nucleotides with 260-, 240-, 2180, and 2-nm pulsed laser excitation. J. Am. Chem. Soc. 107:1520-1529. P.A Harmon, J. Teraoka, and S.A. Asher. 1990. UV resonance Raman saturation spectroscopy measures protein aromatic amino acid excited state relaxation rates. J. Am. Chem. Soc. 112:8789-8799. J. Teraoka, P.A. Harmon, and S.A. Asher. 1990. UV resonance Raman saturation spectroscopy of tryptophan derivatives: Photophysical relaxation measurements with vibrational band resolution. J. Am. Chem. Soc. 112:2892-2900. |
|
42 |
X.G. Chen, S.A. Asher, R. Sweitzer-Stenner, N.G. Mirkin, and S. Krimm. 1995. UV Raman determination of the π π* excited state geometry of N-methylacetamide: Vibrational enhancement pattern. J. Am. Chem. Soc. 117:2884-2895. Z.Q. Wen, S.A. Overman, G.J. Thomas. 1997. Structure and interactions of single-stranded DNA genome of filamentous virus fd. investigation by ultraviolet resonance Raman spectroscopy. Biochemistry 36:7810-7820. |
|
43 |
H.A. Strubel and W.R. Heineman. 1989. Chemical Instrumentation: A Systematic Approach. New York: John Wiley & Sons. D.P. Strommen. 1997. Raman Spectroscopy.. In Handbook of Instrumental Techniques for Analytical Chemistry. F.A. Settle, ed. Upper Saddle River, N.J.: Prentice-Hall. |
|
44 |
R. Schweitzer-Stenner. 2001. Visable and UV-resonance Raman spectroscopy of model peptides. J. Raman. Spectrosc. 32:711-732. |
|
45 |
H. Tyakuechi, M. Matsuno, S.A. Overman, and G.J. Thomas, Jr. 1996. Raman linear intensity difference of flow-oriented macromolecules: Orientation of the indole ring of tryptophan-26 in filamentious virus fd. J. Am. Chem. Soc. 118:3498-3507. |
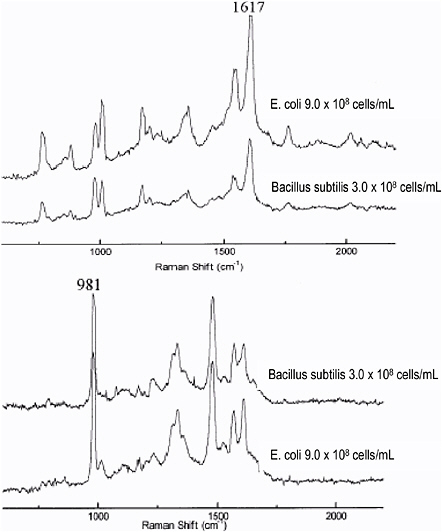
FIGURE 5.4 Different intensities of UV resonance Raman spectral shift from E. coli and B. subtilis.
257 nm results in very little fluorescence interference, but these shorter wavelengths propagate even less than the 260 to 280 nm wavelengths discussed above.46
Preliminary results47 suggest that it may be possible to distinguish different bacterial genera by the differences in intensity of Raman emissions at a specific spectral peak position. Using 228.9 nm as the excitation wavelength results in identical Raman peaks for all genera observed (E. coli, B. subtilis, C. freundi, E. aerogenes, S. epidermidis), but with significant differences in the intensities for different organisms. Figure 5.4 shows this difference in intensity.
Although there are significant differences in the peak intensities between the two organisms whose spectra are shown in Figure 5.4, at least some of the difference can be attributed to conditions under which the organisms were grown.48 Furthermore, such intensity differences cannot be used to distinguish between species unless there is some other information that provides their concentration levels.
Other Ultraviolet Systems
One of the near-term approaches is to match a short-range UV lidar system with a long-range IR lidar. This hybrid system is the basis for the DoD's Joint Biological Standoff Detection System.49 The IR lidar will detect a possible biological agent cloud at a greater distance than the UV lidar. Once the particulate cloud is detected, the UV lidar can be used to indicate whether or not the cloud is biological.50 However, this still does not determine whether a biological agent is present. Further, much more work is needed on the concepts of operation that prescribe how the system will be employed or what the response will be to positive alarms.
Because of the high and highly variable biological background, there may be a high false alarm rate; for example, when the dew point is reached, there can be a nearly instantaneous release of spores from fungi that mimics very closely a typical biological attack. Such natural releases can cause a rapid increase in the bioaerosol background by 104 particles per liter (see Chapter 3). Such false alarms can be reduced through study and modeling of the fluctuations of the natural background under various conditions and use of appropriate computer algorithms to normalize the detector signal.
TERAHERTZ SPECTROSCOPY
There is little information available concerning terahertz technologies for biological agent aerosol detection. Reportedly, the spectra obtained are high in information content but very difficult to interpret because of the low absorption cross sections.51
While point detection systems for particles are commercially available and relatively inexpensive, the point detection systems that can discriminate biological particles require significantly more sophisticated hardware and manufacturing. These systems are commercially available and undergoing continual refinement. The shift from point to standoff detection requires significant increases in sophistication of both hardware and software. Prototype systems exist in a variety of laboratories around the world, but this remains basically a research area. Progress has been made in the laser sources for these systems, allowing for greater strength of signal in an atmospheric window. These advances will increase both sensitivity and range of standoff systems.
One of the most important issues for standoff systems is the generation and acceptance of a usage doctrine for this projected capability. Without a clear understanding of the requirements and subsequent benefits, it is difficult to assess the major manufacturing challenges for these systems. Most likely challenges will be in the areas of improved laser sources and data acquisition and processing of the returned signal.
FINDINGS AND RECOMMENDATIONS
Spectroscopic Point Detectors
Finding 5-1a: Spectroscopic point detectors based only on aerosol particle counting with size discrimination are likely to yield an unacceptable rate of false positive alarms if they are used by themselves as the first stage in a detect-to-warn sensor system.
Although the information provided by these detectors is accurate and rapid, they are unable to distinguish between an increase in the number of particles due to biological agent attack and an increase caused by normal fluctuations in background particles in the 1 to 10 μm diameter range.
Finding 5-1b: Point detection systems using both particle size and shape analysis as well as UV-LIF as
|
49 |
DoD. 2002. Joint Service Chemical and Biological Defense Program, FY 02-03 Overview. Washington, D.C. |
|
50 |
David Walt, Tufts University. Presentation to the committee on June 12, 2002. |
|
51 |
Rubel, 2002. See note 20 above. |
a detector of biologically relevant material have the greatest promise for rapid detection using existing technology. This type of system is most valuable when used within buildings, where the fluctuations in background may be mitigated by filtering and also by smart algorithms that correlate remaining fluctuations with factors such as changes in building occupancy and cleaning.
Recommendation 5-1: Combination (particle characterization technology and UV-LIF) detectors should be developed and fielded as rapidly as possible to provide a detect-to-warn capability for high-value buildings, especially when low-regret responses are available (see Chapter 10). Studies should be performed to characterize the false positive rates of these enhanced bioaerosol detectors at a variety of detection thresholds, including the higher concentrations expected for many building scenarios.
Finding 5-2: The oxidation level of organisms, as determined by the NAD(P)H fluorescence, is a potentially exploitable signature to provide information on their viability in near real time. Viability and discrimination information can also be obtained by making determinations of the cellular ATP levels of collected samples. Currently this latter assay takes minutes and requires a relatively concentrated sample. The spectral combination of size, biological content, and viability in near real time will significantly increase the detect-to-warn capability.
Recommendation 5-2: Further research should be supported to exploit the detection of oxidative state and ATP levels of organisms as indicators of their viability.
Standoff Detectors
Finding 5-3a: Active infrared lidar systems offer the greatest range (and hence the greatest warning time) for detection of aerosol clouds in the atmosphere but do not distinguish biological from nonbiological particles. They also have a significant potential for false alarms due to fluctuations in the concentration of particulate matter in the atmosphere.
Finding 5-3b: Short-range use of UV-LIF provides near-real-time discrimination of biological from nonbiological particles.
The ability to use shorter excitation wavelengths for short distances where atmospheric propagation is not an issue allows information-containing spectral properties to be gathered from aerosolized particles. Current operational systems employ temporal comparisons of spectral signatures to decrease false positive readings due to fluctuations in background signatures.
Finding 5-3c: There is no currently fielded standoff biological agent aerosol detection capability, nor is there a clear concept of operations for use of such a system. The technology closest to fielding is the Joint Biological Standoff Detection System.
Recommendation 5-3: A clear concept of operations for IR-UV-LIF hybrid systems should be developed, and, if promising, development of such a system should be expedited to provide an interim warning capability against biological aerosol attack on extended facilities. Expedite development and fielding of a system such as the JBSDS.
Finding 5-4: There is no currently fielded standoff capability to identify threat biological agents once a biological aerosol has been detected. This is a highly desirable capability that would reduce false alarms from the large amounts of biological material normally present in the atmosphere.
Recommendation 5-4: Laboratory investigations into techniques that might extend the range or increase the specificity of biological standoff detection should be performed. Modeling should be used to understand the performance of the more promising techniques in realistic simulations of standoff applications (e.g., multicomponent clouds with possible interferents). If the new techniques pass the modeling and simulation test, consider moving on to prototyping.
Finding 5-5: There are technologies and systems currently in use by meteorologists and atmospheric scientists that are similar to those developed by the Department of Defense.
Recommendation 5-5: Close monitoring and evaluation should continue of instrumentation, technologies, and techniques (especially those in ultraviolet systems) used in atmospheric studies to determine their applicability to DoD systems.


