
2
Where Are We Now?
As noted in many other studies and reports, academic biomedical research is changing (e.g., NRC, 1998; COSEPUP, 2004). What was once the exclusive domain of individual scientists is being supplemented by large teams of scientists. Where there once was collaboration between individual research groups, now networks and consortia include scientists spread around the world. What was once exclusively the realm of biologists and biochemists now includes physicists, mathematicians, computer scientists, and engineers working together in interdisciplinary teams. Where basic and clinical research were once separate domains, they are now integrated into single research programs. Where there was once a well-defined academic career path and plenty of research positions, there is now a complex network of multiple careers paths and career transitions. Each of these changes has relevance for the issues confronting new investigators.
The effect of “big science” on traditional investigator-initiated “small science” in the biomedical sciences has been discussed for over 20 years (e.g., Alberts, 1985). With more collaborative research projects involving tens or hundreds of scientists, often at multiple locations, crediting individual researchers for their contributions to the team effort has become a challenge. In fact, growth in NIH funding for research centers has out-stripped that for research project grants by over 30 percent between 1998 and 2005 (Check, 2004). This trend toward research center funding is especially important for new investigators who are unlikely to serve as principal investigator (PI) or even leader of a collaborating team.
There is growing interdisciplinarity in biomedical research with physical scientists, computer scientists, and engineers working with biologists in research areas traditionally the exclusive domains of biology. As suggested by Dr. Zerhouni in his remarks at the committee’s June 2004 workshop, pathways are needed to move physical scientists into biomedical research and to provide opportunities for building interdisciplinary research teams. Moreover, opportunities for moving between and among increasingly overlapping disciplines need to be available to early-career scientists as well as those who have already established their independent disciplinary research program.
Biomedical career pathways have traditionally been viewed as linear progressions with individuals moving directly from graduate school to postdoctoral positions to assistant professorships, then obtaining funding and tenure. Regardless of how accurate this view was in the past, clearly this linear pathway is far less common today. The system by which established scientists “clone themselves” through their postdocs and graduate students is increasingly challenged by new, different directions and objectives. Many people who receive PhDs in biomedical sciences opt to pursue careers outside of academic research: in industry, biotechnology, investment, policy, teaching, writing, or any number of other sectors. And there is significantly more movement in and out of the research career track; individual scientists move between disciplines; they take time out for family or to work outside scientific research. Figure 2-1 shows the complexity of the current network of career trajectories in biomedical research. The figure illustrates the many pathways to achieve independence; focusing on only a single pathway puts artificial limits on who may become an independent investigator. Therefore, research funding and training opportunities now need to fit the needs of a variety of careers and allow for transitions among different areas of research.
The availability of research funding drives not only the specific research questions investigated, but also the scientific workforce available to carry out that research. NIH grant programs can stimulate the creation of new research positions by providing partial or full salary support. While non-tenure-track “soft-money” positions especially depend on external sources for salary support, a significant number of tenure-track faculty also depend upon grant funding. For instance, a study of the Association of American Medical Colleges (AAMC) indicated that tenure does not carry any financial guarantee for basic science appointments at 30.8 percent of medical schools in 2002, up from 24.4 percent just 3 years earlier. And the percentage of medical schools indicating that tenure guarantees total institutional salary for basic sciences faculty dropped from 38.6 percent in 1999 to 21.7 percent in 2002 (Liu and Mallon, 2004).
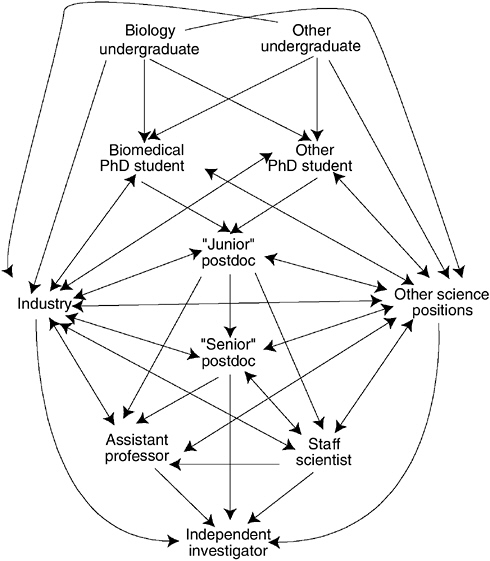
FIGURE 2-1 Complex network of current career pathways to independent investigator. The former linear pathway from undergraduate to PhD student in the biomedical sciences to postdoc to assistant professor to independent investigator has been replaced by a complex network with many paths to multiples types of independent research.
GRANT SUCCESS BY AGE
Each year, both new and experienced investigators compete in a Darwinian-like system (Freeman et al., 2001) for the portion of the NIH extramural budget not already committed to continuing awards. According to Norka Ruiz Bravo, NIH associate director for extramural research, the youngest investigators (ages 35 or younger) have the highest R01 and R29 success rates (Figure 2-2), though it may take a resubmission and more than one study section round for success. That is, of the age cohorts applying for NIH research awards (Figure 2-3), those 35 and under are funded a greater percentage of the time than those in older age cohorts. But that may include multiple grant proposals, resubmissions, and rounds of peer review.
Nonetheless, the average age at which investigators receive their first independent research support is creeping upward (in 2002, age 42 for PhDs and age 44 for MDs) (see Figure 2-4). The average age at which investigators receive their first faculty appointments at U.S. medical schools shows the same trend (in 2002, age 38 for PhDs and age 37 for MDs) (data from the AAMC Faculty Roster as of March 31, 2004; Figure 2-4).
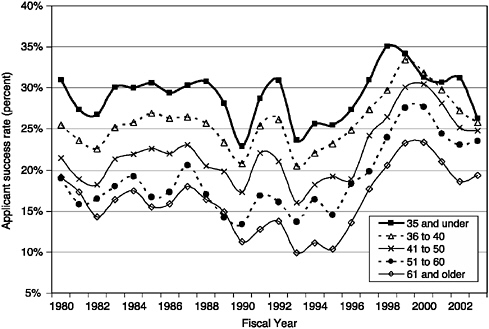
FIGURE 2-2 Success rate of competing new R01 and R29 grant application by age of principal investigator. Source: Office of Extramural Research, NIH.
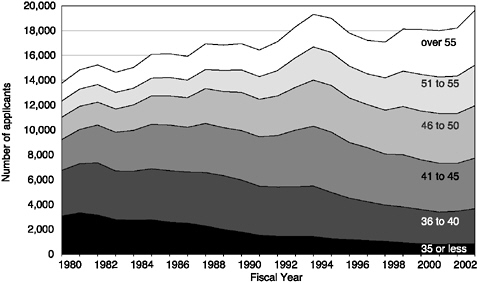
FIGURE 2-3 Number of R01, R23, R29, or R37 applicants by age cohort. Source: Office of Extramural Research, NIH.
The number of biomedical tenure-track faculty in the 33–34 age cohort decreased by half between 1985 and 2001 even though the number of eligible PhD recipients increased during that period (NRC, 2005). But even though the increasing age at receipt of first award seems to follow the increasing age of obtaining the faculty position, a 4–7 year lag persists between becoming a faculty member and receiving a first R01.
It should be noted that the data on grant success at NIH differ significantly between different institutes and centers (ICs). In fact, the absolute number of new investigators receiving R01 awards from some ICs has declined significantly over the last few years (for example, the National Cancer Institute, which was the largest supporter of new investigators in the mid- and late-1990s has had more than a 15 percent decline in the number of new investigators supported between 1997 and 2002).
New and previously funded investigators both seem to be awarded grants at approximately the same age at which they apply (Table 2-1). However, while there may not be evidence of explicit discrimination against younger investigators in the grant process (Goldman and Marshall, 2002), it may take one or more resubmissions for funding; even one resubmission may introduce a 2-year delay in receipt of finding (Coleman, 2005).
NIH still holds at least partial responsibility for the increasing age at which biomedical researchers receive their independence. The current
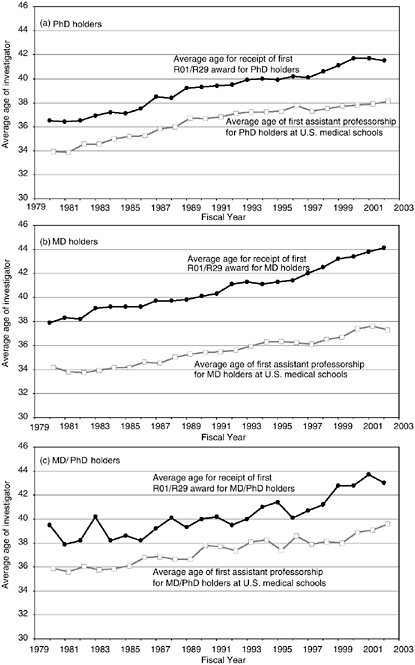
FIGURE 2-4 Average age at time of first assistant professorship at U.S. medical schools and receipt of first R01/R29 award. (a) PhD holders. (b) MD holders. (c) MD/PhD holders. Source: AAMC Faculty Roster Data, as analyzed by Office of Extramural Research, NIH (age at first faculty appointment); Office of Extramural Research, NIH (age at receipt of first NIH award).
TABLE 2-1 Average Age for Applicants and Awardees for Competing Awards for New and Previously Funded Investigators. Source: Office of Extramural Research, NIH
|
|
Applicants |
Awardees |
|
All applicants |
48 |
47 |
|
New investigators (previously unfunded) |
44 |
43 |
|
Previously funded |
52 |
50 |
NIH research funding system may have direct and indirect effects on the progression of researchers through the early stages of their careers: direct in the lack of realistic funding opportunities for new investigators to establish their independence, and indirect in the distribution of independent positions influenced by funding policies and programs.
The success of new investigators did not improve despite a doubling of the NIH budget (1998–2003). Even with more money available, no evidence indicates that new investigators received a larger share of funds as a result (in fact, Figure 1-4 shows a decreasing percentage of awards made to new investigators in recent years). Rather, it seems that those with existing funding and established research programs received increased funding, in part to hire additional postdoctoral and graduate student researchers and further exacerbate the imbalance between trained researchers and available positions (Freeman, 2004). In an effort to provide incentives and opportunities for new investigators, NIH has implemented two changes. First, new investigators are designated for special treatment in peer review and in funding decisions by identifying themselves as such on their grant application (referred to as “self-designation”; Figure 2-5). Second, NIH developed the following programs of special relevance for new investigators:
-
R23 New Investigator Research and R29 FIRST Awards: These grants were designed specifically for and restricted to new investigators to support the first few years of a faculty position. They are now discontinued, for reasons described below.
-
R03 Small Research Grant (pilot): These grants are small ($50,000 for direct costs per year for 2 years) and support self-contained studies. Some institutes use them as a way for new investigators to enter the system.
-
R21 Exploratory/Development Grant: These grants are for a total
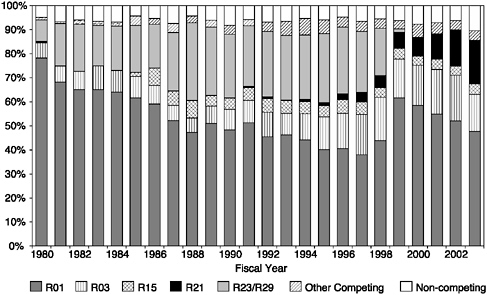
FIGURE 2-6 First NIH award for new investigators. The figure shows that the R23 and R29 grants specifically created for new investigators are being replaced by the R21 award, whose purpose is generally not specific for new investigators. Also notice the declining percentage of new investigators receiving R01s as their first award over the last several years. Source: Office of Extramural Research, NIH.
-
of $275,000 in direct costs for 1 to 2 years (but no more than $200,000 in a single year) and support the early stages of exploratory and developmental research projects.
-
K Awards: These awards support career development for research or health professional doctorates.
R03 and K awardees have higher success rates in applying for subsequent R01 awards than do those with no prior awards.1 It appears that R21 recipients have no greater success at subsequent R01s (data from Office of Extramural Research, NIH, not shown).
Yet, the R21 now appears to be the first NIH award for many new investigators (Figure 2-6). Historically, the R23 New Investigator Award was popular among new investigators until its demise. Then its replacement, the R29 FIRST Award took over as a popular award for new investigators. With the elimination of the R29 (see below for the reasons for this
elimination), new investigators are turning to the R21 exploratory/development grant, even though it is not specifically designed to support new investigators. The appeal of the R21 may be that it does not require discussion of preliminary data and is, therefore, seen as easier to obtain for new investigators.
NIH analysis shows that new investigators are entering the system at a higher rate than experienced researchers are leaving it. From 1980 to 1998, the average ingress rate for new investigators was 11.0 percent, and the average egress rate for experienced investigators was 8.4 percent (see Figure 2-7). In particular, researchers appear to stay in the funding system later and later. Investigators over age 55 received 22.7 percent of research awards in 2003, up from only 9.7 percent in 1980 (Figure 1-2).
The age distribution of those receiving competing NIH research awards has been increasing with few individuals under age 40 now receiving awards. In 2003, for instance, only 16.9 percent of those receiving R01, R29, or R37 awards were age 40 or younger, a significant decrease from the 50.4 percent in 1980 (see Figure 1-2).
The average age of first-time research grant recipients is quite consistent across institution types. Recipients of first research grants average 43 years of age at medical schools and research institutions and 42 at non-medical school academic environments and hospitals (data from Fiscal Year 2003 provided by NIH). The average age of first-time recipients of
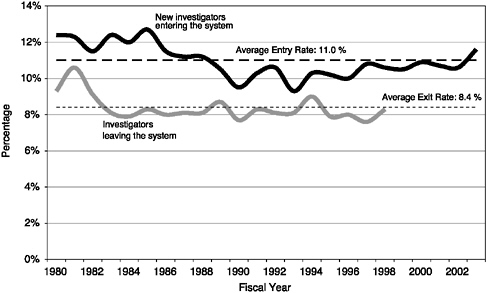
FIGURE 2-7 Entry and egress rates of NIH research project grant investigators. Source: Office of Extramural Research, NIH.
awards involving human subjects and those without human subjects involvement differs slightly (overall, 43 for human subjects, 41 without).
Some gender differential exists across various NIH grant programs. Although men are, on average, a half-year younger than women (42.26 for men vs. 42.82 for women) at receipt of first award, the difference is reversed—and more pronounced—for the R15 and R21 awards. For the R21, in particular, women are over 2 years younger than their male colleagues at receipt of first award (40.45 for women, 42.60 for men). PhD holders are, on average, younger (41.38±7.30) than either MD/PhD (43.79±6.49) or MD (43.83±6.54) holders at receipt of first NIH research award (data provided by NIH).
Not only chronological age demonstrates the difficulties for new investigators. For instance, in its 1997 survey, the American Society for Cell Biology (ASCB) found that 71 percent of those receiving PhDs before 1970 obtained grant funding from the NIH, NSF, or American Cancer Society on their first attempt. That number drops to 43 percent of those graduating in the 1980s and 25 percent of those graduating in the 1990s (Marincola and Solomon, 1998a; http://www.ascb.org/survey/survey.htm).
DEMOGRAPHIC DATA
A demographic analysis of available data2 provides some insight on why the number of awards to new investigators is so low and has declined over time (see Figure 1-3). How have PhDs ages 35 and younger and educated in the United States fared in recent years? Data presented by Paula Stephan about U.S. PhD recipients from 1993 to 2001 reveal the following:
-
The number of life scientists ages 35 and younger increased 59 percent (see Figure 2-8)
-
The number of life scientists ages 35 and younger in tenure-track positions increased 6.7 percent, and
-
The number of life scientists ages 35 and younger in tenure-track positions in Research I institutions3 declined 12.1 percent (from 618 to 543).
|
2 |
As discussed in several places throughout the report, the available data are not always what is needed. Box 2-1 summarizes the major data sources for information on the biomedical workforce. |
|
3 |
The Carnegie Classification of Institutions of Higher Education is the leading typology of American colleges and universities. It is the framework in which institutional diversity in U.S. higher education is commonly described. Research I institutions offer a wide range of baccalaureate and doctoral programs, and include most of the major academic research institutions in the U.S. |
|
BOX 2-1 Several data sources on the biomedical workforce are referenced throughout this report. Each has deficiencies that limit the ability to gather appropriate statistics. Survey of Earned Doctorates (SED). The SED is completed by each person receiving his or her first research doctorate at a U.S. institution.a Forms are distributed, collected, and submitted by the institutions themselves, and completed by the individual when the degree is awarded. In addition to collecting demographic information about the PhD recipient and the individual’s field of study, the SED asks about postdoctoral plans. Thus, the SED can provide information about work plans at receipt of the PhD, but does not provide an accurate count of actual postdoctoral activities. Survey of Doctorate Recipients (SDR). The SDR is conducted on an 8 percent sample of respondents to the SED under age 76 living in the United States. The survey is designed to provide longitudinal demographic and career-history information on individuals holding PhDs from U.S. institutions. Advertised as “the only source of national data on the careers of the science and engineering doctorate holders,” the SDR excludes those with doctorates from non-U.S. institutions or those with non-research doctorates (such as MDs).b Survey of Graduate Students and Postdoctorates in Science and Engineering (GSS). The GSS is a survey of 600 U.S. academic institutions with data collected at the level of departments. It collects demographic information on full- and part-time graduate students and postdoctoral scholars. Summary information on other doctorate non-faculty research personnel is also collected. The GSS provides the only information about foreign doctorate-holders working at U.S. institutions. However, the survey only includes those working in formal departments at academic institutions and excludes those in government, industrial, nonprofit, and other non-academic settings. Further, since it relies on reporting by individual departments and institutions, which may fail to follow survey definitions, it may not count individuals correctly.
|
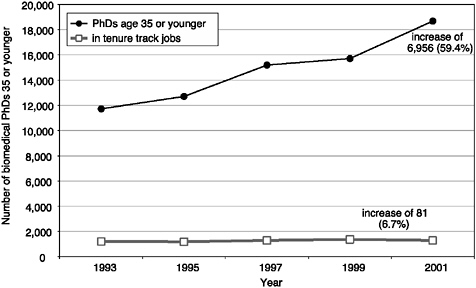
FIGURE 2-8 Number of biomedical PhDs age 35 or younger and the number of those holding tenure-track positions. Source: Weighted data from Survey of Doctorate Recipients, National Science Foundation, as analyzed and presented by Paula Stephan, Georgia State University.
That is, the number of early-career life scientists with PhDs increased substantially, while the number of tenure-track positions has increased only marginally—with tenure-track positions at top research institutions actually decreasing in number. Not surprisingly, the percentage of biological science PhDs pursuing careers in academia has declined, with more opting for industry (perhaps as many as 35 percent of those in the biological sciences, C. Kuh, unpub.). Those who do opt for academia include more women, more underrepresented minorities, and more non-U.S. citizens (C. Kuh, unpub.). The increase in biomedical PhDs has come mainly from the increased participation of women and temporary residents (NRC, 2005).
A major cause for the increased age of independence is the long time it takes to earn a PhD and complete postdoctoral training. Thorough consideration of graduate training is outside the scope of this report, but is worthy of an updated look (cf. COSEPUP, 1995). What is relevant here is the overall length of training, including both graduate school and postdoctoral years, which lasts too long. Not all of the growth in training length has happened over the last few years. For example, the available data suggest that even though time to the PhD degree has increased over the last 30 years, it has stayed relatively constant over the last 10 (NRC,
2005). For example, the median age at receipt of a PhD has remained constant at 29 years, and the years elapsed and years enrolled from bachelor’s to doctoral degree in the biological sciences has remained constant—or even slightly decreased—over the last 10 years (National Science Board, 2004). Thus, the length of graduate training alone does not explain all the increase in the age of new investigators. The postdoctoral situation, however, is more difficult to sort out.
The number of U.S.-earned biomedical PhDs performing postdoctoral work has leveled off in recent years and even declined in 2001—the most recent data available (NRC, 2005). However, the total pool of postdoctoral researchers has continued to grow due to the influx of scientists from foreign countries (Garrison et al., 2003). In the last 25 years, the number of temporary residents who assume science and engineering postdocs has increased 278 percent, with only a 36 percent growth for U.S. citizens and permanent residents (Babco, 2003). However, the vast majority of these temporary residents are not included in the limited data that exists about postdoctoral scientists. Thus, it is difficult to determine an accurate estimate for the average postdoctoral tenure of all biomedical PhDs. Making generalizations based only upon U.S.-earned PhDs may significantly misrepresent the overall postdoctoral experience, but information on U.S. degree holders is largely the only data available.
Focusing on those with U.S. degrees as measured by the SDR, the percentage of PhDs performing postdoctoral work by time since earning their degree declined overall in every time category studied, which suggests that the amount of time U.S. PhD holders spend in postdoctoral positions may be decreasing (Garrison et al., 2003). It does not necessarily follow from the data, however, that the duration is evenly distributed across different career options. For instance, it would be possible for the growing number of PhDs who opt for non-academic career paths to have only short postdoctoral tenures, while those who pursue tenure-track academic positions spend longer periods in postdocs. The available data do not allow significant insight into the current postdoctoral situation. It is clear, however, that regardless of any changes in the last several years, postdoctoral tenures have significantly lengthened from 20 or 30 years ago.
Meanwhile, the mix of research positions is changing. The ratio of full-time, non-tenure-track researchers to total, full-time faculty has increased, with the highest ratios for Research I institutions. Between 1991 and 2001, full-time faculty positions grew about 8 percent (down from growth rates of 18-34 percent from 1975-1991), while full-time non-tenure-track positions and postdocs grew by 55 percent (National Science Board, 2004). The overall faculty share of academic positions decreased from 85 percent in the late 1970s to only 76 percent in 2001, despite signifi-
cantly increased spending on academic research. Looking in more detail at the status of biomedical PhDs employed in academic institutions shows that the percentage in tenured and tenure-track positions decreased between 1989 and 2001 (Figure 2-9), while non-tenure-track, postdoc, and other academic positions increased over that period. These data also show a marked difference between men and women with significantly more men in tenured positions, while women are more represented in postdoctoral and other academic positions. The available data cannot explain reasons for this gender disparity and deserve further study.
We can also investigate cohorts of U.S.-earned biomedical PhDs several years out from their PhDs. The analysis presented in Figure 2-10 looks at cohorts several years before the 1993 and 2001 surveys, sampled from the SDR. The data show that the 3-4 year cohort (i.e., biomedical PhDs who earned their degree 3-4 years before the survey) are increasingly more likely to inhabit postdoctoral positions in 2001 than in 1993, with a corresponding decline in the percentage of biomedical PhDs with tenure-track and non-tenure-track positions (Figure 2.10a). Moving ahead to the 5-6 year cohort, Figure 2.10b illustrates an even greater change in the percentage in tenure-track and tenure positions; those from the 2001 cohort dem-
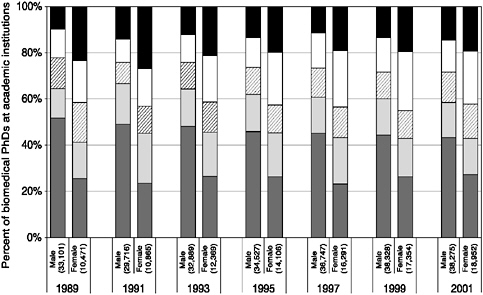
FIGURE 2-9 Status of U.S.-earned biomedical PhDs employed at academic institutions, by gender. There has been a gradual decline in the percentage of tenured faculty, while the percentage of non-tenure-track, postdoc, and other academic positions has increased. Source: Survey of Doctorate Recipients, National Science Foundation.
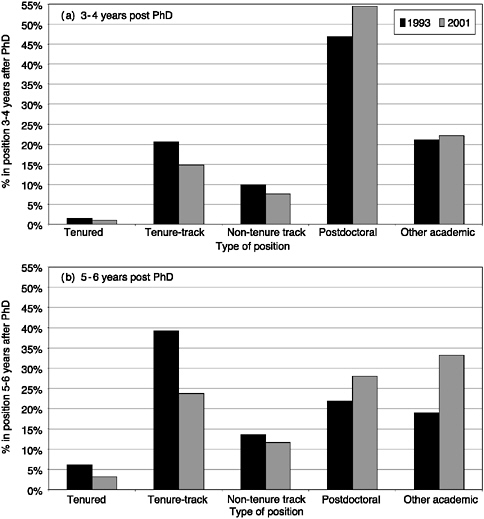
FIGURE 2-10 Cohort analysis of U.S.-earned biomedical PhDs employed at academic institutions. (a) 3-4 year cohort refers to individuals who had earned their PhDs 3-4 years prior to the survey (i.e., 1989-90 PhDs in the 1993 survey and 1997-98 for the 2001 survey). (b) 5-6 year cohort refers to individuals who had earned their PhDs 5-6 years prior to the survey (i.e., 1987-88 PhDs in the 1993 survey and 1995-96 for the 2001 survey). Source: Survey of Doctorate Recipients, National Science Foundation.
onstrate an explosion of those in “other academic” positions (33 percent in 2001 vs. 19 percent in 1993).
The 1997 ASCB survey provides related evidence on the number of positions applied for after postdoctoral study: pre-1970 PhD recipients report applying for a mean of four to five permanent positions before
securing a job, while 1980s graduates applied for a mean of more than 30 permanent positions. In addition, only 1 percent of those receiving their PhDs before 1980 report a year or more spent searching for a first permanent position; this percentage increased to greater than 21 percent of those receiving degrees since 1980. Moreover, 9 in 10 of all respondents to the ASCB survey who advise or oversee the work of trainees indicate that obtaining a desirable full-time position is more difficult than when the advisors were first seeking such a position (Marincola and Solomon, 1998a).
Furthermore, when universities do hire into a new position or to fill a vacancy, they do so more for non-tenure-track than tenure-track positions. The hiring trend can be explained by the following economic factors:
-
Budget crunches and endowment payouts affect hiring
-
Higher salaries and expensive start-up packages are often required for tenure-track positions
-
Grants, or “soft-money,” are available to fund non-permanent positions
-
Non-tenure-track and therefore non-permanent positions are more flexible and potentially allow the institution to make more rapid changes in focus.
In addition to these “soft-money,” “other academic” positions, where are the increasing number of total biomedical PhDs going? One destination is industry. U.S. citizens and permanent residents with biomedical science PhDs working in industry have increased from 27.3 percent in 1997 to 31.6 percent in 2001, while the percentage employed in academia decreased from 55.6 percent to 52.6 percent (Garrison et al., 2003).
GRANT PROPOSALS FROM NEW INVESTIGATORS
Once they have an appropriate position from which they can apply for competitive awards from the NIH (e.g., R01s), new investigators identify themselves by means of a checkbox on the front of the application (see Figure 2-5). New investigators are defined as people applying for an R01/R29 award who have not been a principal investigator (PI) on any prior NIH research grant except a K01, K08, K22, K23, R03, R15, or R21 (see Box 1-2). Most “new investigators” are early-career scientists who have become eligible to be a PI by virtue of obtaining a new faculty or research position. However, this category also includes those moving into biomedical research from other disciplines; in some cases, they may have served as a PI on research projects with funding from other federal and non-federal sources. Others include scientists who have heretofore received
all funding from non-NIH sources, such as scientists from other countries. NIH staff members in the Center for Scientific Review (CSR) check whether the new investigator checkbox has been marked appropriately. For example, many applicants erroneously identify themselves as new investigators, thinking that it means only that the application is new and not a renewal.
REVIEW PROCESS
The peer review process at NIH (described in Box 2-2) is the critical stage in the evaluation of proposals from both new and experienced investigators. As explained by Brent Stanfield, CSR acting director, the study section reviews an application in terms of the significance of the project, the approach or methods to be used, the innovation of its concepts, the investigator’s qualifications, and the probability of success due to environment. Applications may be deferred (rarely), unscored, or scored. An unscored application is one that is deemed noncompetitive, while a scored application has a high likelihood of funding and merits further discussion. Some people suggest that new investigators are especially discouraged by being unscored, but their rates of resubmission are the same as for experienced investigators.
Concerns have also been raised about the time in takes for review of extramural grant applications, with a 9-month review time considered standard (Coleman, 2005). Those not funded on the first application must prepare another submission and then wait an additional 9 months for review of the resubmission. New investigators are especially likely not to receive funding with the first application. In addition, new investigators are unlikely to have other grants in place to carry aspects of their research through until resubmission.
After NIH abolished the R29, CSR developed a one-page sheet that provides guidelines for reviewing applications from new investigators (Box 2-3). The guidelines state that all applicants should be evaluated in a manner appropriate for the stage of their career. More specifically, reviewers should place more emphasis on a new investigator’s demonstration that the techniques and approaches are feasible, rather than on preliminary results. They should also place greater emphasis on a new investigator’s training and research potential, rather than his or her track record and number of publications. Finally, the reviewers should consider the environment appropriately—whether or not the institution is invested in the researcher.
How have new investigators fared under these guidelines? Data presented by Dr. Stanfield from the October 2003 to May 2004 NIH council rounds show that 32 percent of applications from experienced investiga-
|
BOX 2-2 Scientists applying for NIH grants must generally do so with the sponsorship of their institution to which the award would be made. Institutional policies on eligibility differ. Once an application has been submitted by the institution on behalf of the principal investigator (PI), it is usually reviewed on at least two sequential levels by the NIH, designed to separate the scientific assessment of the proposal from policy and resource decisions. The evaluation of scientific and technical merit is generally conducted by scientific study sections chartered by the Center for Scientific Review (CSR) or by individual institutes and centers. The study section, organized around scientific specialty, may consist of as many as 16-20 members, primarily non-federal scientists, supervised by a scientific review administrator (SRA) on the NIH staff. The reviewers study each application individually before a meeting of the study section; some reviewers are assigned to prepare written critiques for each application. Approximately half of the applications are considered competitive, fully discussed at the study section meeting, and given a priority score based on the scientific merits of the project. Priority scores run on a scale from 100 to 500, with lower scores indicating more meritorious proposals. The overall priority score is an average of all the numerical ratings from individual reviewers in the study section. Study sections are encouraged to score about half of the applications (with the remaining “unscored”) and to have a median score of 300. The National Advisory Board or Council for the relevant institute or center then performs a second review. These panels of 12-18 scientists and laypeople consider the priority score from the study section against a background of relevance, program goals, and available resources. Source: Adapted from http://grants1.nih.gov/grants/intro2oer.htm, http://www.csr.nih.gov/REVIEW/scoringprocedure.htm |
tors were unscored (see Box 2-2 for a discussion of the scoring process), compared to 46 percent for those from new investigators (see Figure 2-11). The overall distributions of scores were similar, but the median scores differed considerably (300 for new investigators and 232 for experienced investigators; lower scores are better).
However, the experienced investigators’ applications include those for new studies (Type 1, which new or previously funded investigators can file) or for competitive renewals of ongoing studies (Type 2, which only previously funded investigators can file). If these two types are separated out, 17 percent of Type 2 applications, 37 percent of Type 1 applica-
|
BOX 2-3 “New investigators are important to the future of biomedical research. In order to provide new investigators maximum freedom in identifying the level and period of support needed for the work they are planning and thus enhance their opportunities to establish careers in research, NIH has announced a new policy. Under this policy, new investigators are encouraged to submit traditional research project grant (R01) applications, which will be identified as being from new investigators. First Independent Research and Transition (FIRST; R29) award applications are no longer accepted (effective June 1998). A new investigator is one who has not previously served as such on any PHS-supported research project other than a small grant (R03), an Academic Research Enhancement Award (R15), an exploratory/developmental grant (R21), or certain research career awards directed principally to physicians, dentists, or veterinarians at the beginning of their research career (K01, K08, K22, and K23). Current or past recipients of Independent Scientist and other nonmentored career awards (K02 and K04) are not considered new investigators. New investigators are typically less experienced in the preparation of applications and expression of their research plans. To ensure fair reviews for new investigators, the NIH has revised application forms to allow new investigators to indicate this status and thus ensure that reviewers can readily identify applications that are submitted by new investigators. The biosketch should also be used to identify new investigators. All applicants should be evaluated in a manner appropriate for the present stage in their careers. IMPLEMENTATION: When reviewing these applications, reviewers should keep in mind the experience of and the resources available to the new investigator. When considering an application from a new investigator the five new review criteria must be evaluated in a manner appropriate to the expectations for and problems likely to be faced by a new investigator. Specifically, when considering: Approach: more emphasis should be placed on demonstrating that the techniques/approaches are feasible than on preliminary results. Investigator: more emphasis should be placed on their training and their research potential than on their track record and number of publications. Environment: there should be some evidence of institutional commitment in terms of space and time to perform the research.” Source: http://www.csr.nih.gov/guidelines/newinvestigator.htm |
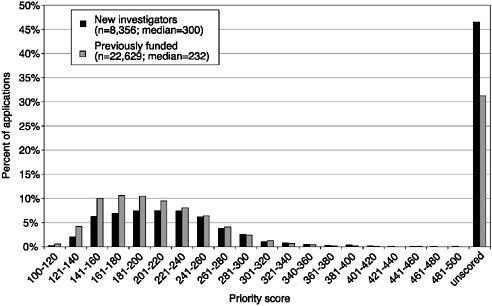
FIGURE 2-11 Distribution of priority scores for R01 applications for new and previously funded investigators, October 2003–May 2004 Council rounds. Unscored applications account for 46% of new investigator applicants and 32% from those previously funded. Lower priority scores are better. Source: Center for Scientific Review, NIH.
tions by previously funded investigators, and, again, 46 percent of new investigator applications went unscored. Similarly, the median score for Type 2 applications is 196, versus 251 for Type 1 applications by previously funded investigators and 300 for new investigator applications.
CSR compiles the results of each study section’s last three meetings and plots the differences between the mean and median scores for new and previously funded investigators. The distribution curves generally skew to the right, meaning the study sections assign better scores to previously funded investigators (see Figure 2-12). CSR also plots the scores for new investigators only—assigning unscored applications a “score” of 500. CSR provides the graphs to the study sections before each meeting to remind them of their behavior during the last three meetings and to help them appreciate whether they are giving new investigators a fair chance.
It is difficult to a priori decide on an appropriate success rate for new investigator applications. Given the relatively few tenure-track positions for an increasing biomedical PhD pool, obtaining such an academic research position has become more competitive. As such, one might expect
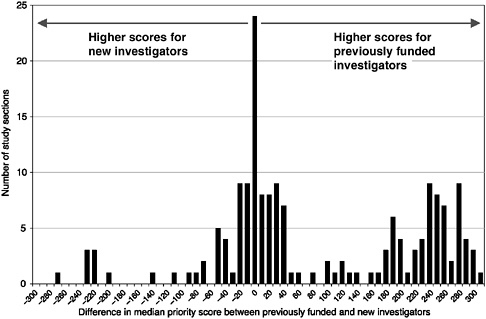
FIGURE 2-12 Differences in median priority scores within study sections between new and previously funded investigators for new R01 applications. A difference of 0 suggests no difference between priority scores given to new and previously funded investigators. Positive scores (to the right on the figure) indicate higher scores given to previously funded investigators. Source: Center for Scientific Review, NIH.
new investigators to be of higher quality than a few years ago and have, consequently, a higher success rate than in the past. Instead, success rates have been relatively flat. One measure of how new investigators are treated by study sections can be obtained from staff members of the CSR. For example, a 2003 analysis of neuroscience study sections and the review process suggests a need for concern. When asked to assess to what extent new investigators are reviewed appropriately by study sections, 54 percent of CSR staff members surveyed said about half the time or less often (Malik and Pion, 2003).
The committee is pleased to learn that several NIH institutes have been taking steps to improve the application success rate for new investigators. Actions taken by the National Institute of Biomedical Imaging and Bioengineering (NIBIB) are described in Box 2-4 and those taken by the National Institute of General Medical Sciences (NIGMS) in Box 2-5. However, not all institutes have addressed this situation with as much con-
|
BOX 2-4 “The NIBIB [National Institute of Biomedical Imaging and Bioengineering] has established a New Investigator Pay Plan with the aim of improving the success that new investigators have in applying for R01 awards. Specifically:
This policy will apply only to Program Announcement and unsolicited R01 applications.” Source of quoted material: http://www.nibib.nih.gov/research/newinvestigators.html Despite the preference given to new investigators for R01 applications, new investigators seem to be applying for R21 exploratory/developmental grants in greater numbers. Only 11 R01 grant applications from new investigators were received by NIBIB in fiscal year 2004. In contrast, 35 new investigators received funding through the R21 program (Laas, 2005). At its January 2005 meeting, the NIBIB advisory council suggested providing grant-writing skills to help new investigators fare better in the review process (Laas, 2005). |
cern. In fact, the absolute number of awards made to new investigators has actually decreased in some institutes even as the scale of total extramural research support has increased substantially. As such, these issues must be considered and implemented NIH-wide.
RISK TAKING
Many observers believe that NIH is too conservative in granting funds (Mervis, 2004a). As mentioned previously, NIH wants to see significant preliminary results before funding a new project. Some savvy researchers have found a way around this as evidenced by the saying in the field: “You apply for things you have already done and use the funds for things you intend to do.” But this only works for those already in the system.
Although many scientists wish to conduct “high-risk” research (Mervis, 2004a), the system discourages such risk-taking at many levels. If an investigator proposes a “risky” project that has no guarantee of success, it is likely that the investigator will not receive the grant and, instead, be asked to reapply with more evidence of feasibility, i.e., more “preliminary results.” Even an investigator with a “risky” project fortunate to be funded will be expected to have publications documenting completion of parts of the project within only three or so years—at the time of application for renewal.4 Unlike more experienced researchers, new investigators do not have long track records of publications and scientific credibility. They are often perceived to respond to these pressures by proposing more straightforward, dependable, and, often, more conservative projects. Thus, researchers who may be at the most creative and free-thinking times in their career may also be the least able to conduct such potentially ground-breaking and innovative research.
The peer review processes, described above, also have an almost inherent tendency towards conservatism. Even if not a conscious process, those on study sections are more likely to rank “familiar” proposals more favorably. Reviewers are naturally attracted to proposals that remind them of their own research and suspicious of proposals that significantly differ from the status quo. Moreover, when faced with limited resources, study sections may believe they have a responsibility to select the most cost-efficient proposals. Proposals deemed to have a high probability of success will therefore be likely to be judged more favorably than those not necessarily viewed as doable.
The NIH Director’s Pioneer Award (NDPA) has been created “to encourage creative, outside-the-box thinkers to pursue exciting and innovative ideas about biomedical research.”5 As described below, however, at least in its current implementation, the NDPA is not expected to have any significant effect on fostering the independence of new investigators.
CURRENT AND RECENT OPPORTUNITIES FOR NEW INVESTIGATORS
Federal agencies and the private sector have developed a number of research award programs targeted to new investigators in biomedical research. These awards may explicitly target researchers who have not received previous support or are still in mentored positions. They generally also do not require submission of preliminary data, which can be
|
BOX 2-5 The National Institute of General Medical Sciences (NIGMS) has established a number of procedures and funding policies to ensure that adequate numbers of new investigators are supported. This comes at a time when applications are increasing, with nearly 70 percent of the increase in new grant applications between 2001 and 2003 coming from new investigators (Hawkins, 2004). Under the new policies, an applicant’s status as a new investigator is one of the criteria used in funding decisions made by the Institute. That is, NIGMS takes certain programmatic steps to provide special consideration for new investigators after consideration of their applications by the study section. In addition, NIGMS is making all its R01 grants to new investigators have a 5-year term (instead of the average 4-year award), providing new investigators with additional time to help establish their research careers. Data provided to the committee by NIGMS suggest that these policies are already having an effect on the success of new investigators in applying for NIGMS support. New investigators are having greater success in receiving funding than are experienced investigators who have previously received NIH funding. For example, between 2001 and 2003, 36 percent of those submitting their first R01 application to NIGMS were funded; two-thirds of these awards were made to unamended applications in the first round of review, with most of the remaining awards going to amended applications submitted two review rounds later. This 36 percent for new investigators compares with a success rate of about 30 percent for previously funded investigators. When looking at any R01 (not only funding of the original or amended first application), about 45 percent of new investigators are funded within three years of their first R01 application to NIGMS. These higher rates of funding success for new investigators occur despite worse priority scores obtained in peer review. New investigators with |
difficult to obtain for researchers seeking to establish their independence and who do not already have an independent track record.
The number of true bridging awards is small. Foundations and the government fund fewer than 100 bridging awards each year, compared to tens of thousands of postdocs.
There is no comprehensive listing of awards of particular interest to new investigators. This leaves many potential applicants in the dark about the opportunities that do exist. Even within NIH, new investigators have had to navigate long listings of program announcements, requests for ap-
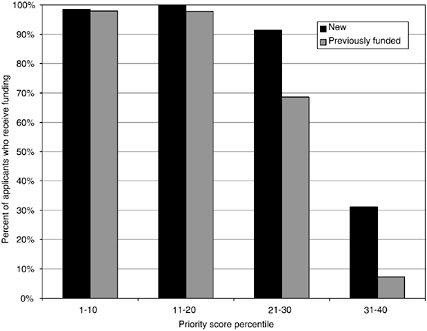 FIGURE 2-13 Success rate for NIGMS R01 applications from new and previously funded investigators, by percentile score. New investigators have a higher success rate on submission of a revised proposal than previously-funded investigators. Source: NIGMS, NIH. percentiles between 20-40 percent have over 20 percent higher funding rates than established investigators (Figure 2-13). Even new investigators with percentile scores between 40-50 percent have a 40 percent chance of being funded through revised applications. |
plications, and institute-specific information to identify the small number of grant programs applicable to their situations. The committee applauds the NIH for compiling resources for new investigators on a single website.6 This page not only provides links to grant opportunities, but provides historical context, help with applications, policies of individual institutes, and other resources.
New Investigator Awards from NIH
The NIH has a history of programs targeted to new investigators and has looked into the issue internally several times. During the mid-1990s, the NIH working group on new investigators was charged with finding answers to two overarching questions: (1) How well have new investigators competed in the funding system? And (2) have the mechanisms designed to support new investigators been effective?
The most prominent among NIH new investigator mechanisms was the R29 First Independent Research Support and Transition (FIRST) award, a successor to the R23 New Investigator Research Award (NIRA) that was phased out in 1986. The nonrenewable R29 award provided total direct costs of no more than $350,000 over 5 years (with a maximum of $100,000 in any single year). The investigator had to be independent, spend at least 50 percent on research effort, have no more than 5 years’ research experience after completing postdoctoral work, and could not hold a concurrent R01.
Alan Leshner, a former director of the National Institute on Drug Abuse, was a member of the NIH working group on new investigators in the mid-1990s. In his remarks at the committee’s June 2004 workshop, he explained that the working group first looked at the numbers of new investigators applying for R01s and R23/R29s from 1980 to 1995. The numbers remained relatively constant, which suggests, at least, that the R23/ R29s did not bring more investigators into the system. Next, the group looked at a series of mechanisms, with an initial focus on the R29 (FIRST) award. From 1980 to 1995, the success rate for R29s was consistently higher than that for the R01s (Figure 2-14). In other words, R29s were easier to get. Did this, then, equate to greater success when the R29 recipients subsequently competed with all other investigators for R01s?
To answer this question, the working group looked at the R01 success rates for those who received the highest scores (top three deciles) on their initial R01 or R29 and found that the probability of getting a subsequent R01 was lower for someone who had an R29 than for someone who had an R01. Some argue that these two groups are not cohorts—rendering the comparison invalid—because those who initially received R01s might have been of different quality than those who received R29s. Perhaps a better comparison would be between those who had received R29s and those who had received no prior funding. Finding equivalent cohorts is a significant problem.
In any event, R29 awards were not seen as prestigious as R01s and did not garner much respect in academia; they were generally given less serious consideration in tenure deliberations. This speaks to the role that academia plays in providing institutional recognition of NIH research
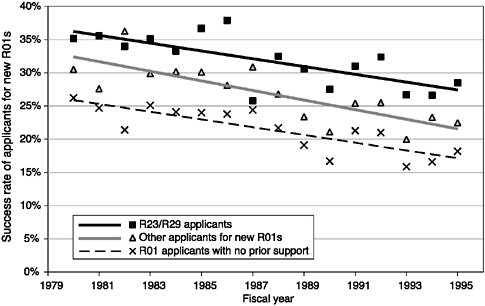
FIGURE 2-14 Success rate of R01/R23/R29 applicants with no prior support and other applicants for new R01s. Source: http://www.nigms.nih.gov/news/reports/table10a.html.
awards. Further, the budgets allowed for R29 awards were generally not sufficient to establish and run a research laboratory. Since R29 recipients could not hold a concurrent R01, it was difficult to obtain supplemental funding from other sources.7 The conclusion was obvious: the FIRST award was not a great success. The group recommended that NIH abolish the R29, provide a mechanism for identifying new investigators on the R01 application (resulting in the front-page checkbox; see Figure 2-5), and maintain the numbers and success rates for new investigators within the R01 system. The group also recommended that, in future efforts, NIH should provide more dollars, find ways to avoid stigmatizing investigators, and conduct formative analysis to evaluate the effectiveness of mechanisms from their initial implementation.
The working group also studied the outcomes for two other mechanisms: the K08 mentored career development award for MDs and the R03
small research grant. The K08 did not fulfill its original purpose of bringing more MDs into the research pool, but it did highlight the important contribution of mentorship. Sixty-five percent of K08 awardees applied for a subsequent R01 or R29, and they realized a 50 percent success rate. In comparison, only 32 percent of MDs without a prior mentored award received R01 or R29 funding. The R03 grant was even less effective in fostering future R01 success. Only 7.5 percent of those who received the small ($75,000) R03 grant were awarded a subsequent R01.
Beyond the R01 and now-discontinued R29, the NIH offers other programs for new investigators. The K22 career transition award is offered by many of the NIH institutes and centers (ICs), although the requirements and characteristics differ significantly. In general, K22s are awarded for 1-2 years of mentored research to postdoctoral researchers who have not received prior independent support. The remaining 3-4 years of the 5-year award tenure is then provided in the first tenure-track independent position. As mentioned, the characteristics and amount of the award differ among ICs; for example, some require carrying out the postdoctoral period in an intramural NIH laboratory. (Chapter 5 recommends a new program that builds upon the strengths of the existing K22, but addresses its weaknesses.)
As mentioned above, the R03 small research grant offers up to 2 years of research support. Although the amount of support is small (limited to $50,000 per year), these awards do not require submission of preliminary data, which makes them especially attractive to new investigators. The R21 exploratory/developmental research grants also do not require submission of preliminary data and these awards are more generous than the R03 (up to $275,000 with a term of up to 2 years), but still below the budget and length of R01s. R21s are intended to promote research that may have risk but has the potential for high reward. Although the R03 and R21 awards often appeal to new investigators since they do not require preliminary data and are perceived as easier to obtain, these awards are not generally explicitly geared for new investigators; rather, ICs use them to encourage research in new areas, develop new research technologies or methodologies, or perform pilot studies.
Several other career development awards in the K series affect a more targeted group of applicants. The K01 mentored research scientist development awards are for those moving to a substantially new area of research or who have had a career hiatus. K02 independent scientist awards provide salary support only and require 75 percent protected time for research. The K08 mentored clinical scientist development awards and related K23 mentored patient-oriented research career development awards primarily support MDs engaged in clinical or patient-oriented research. The K25 mentored quantitative research career development
awards are especially for scientists with quantitative backgrounds looking to pursue independent research in the biomedical sciences, and the K18 career enhancement awards support training in the use of stem cells. The characteristics and requirements for most K awards differ significantly by institute.
Finally, the NIH Director’s Pioneer Award (NDPA) has recently been established “to identify and fund investigators of exceptionally creative abilities and diligence, for a sufficient term (five years) to allow them to develop and test far-ranging ideas.”8 Those selected to formally apply for the NDPA from those nominated do not submit a formal research plan since it is expected to evolve during the tenure of the grant. Because the specific scientific plan is not a review criterion, recipients are selected on the basis of their potential—including scientific innovation and creativity, motivation and enthusiasm, and potential for scientific leadership. Individuals at all career stages are eligible for the NDPA and “nominations from individuals at early stages of their career who demonstrate independence of their ideas from their mentors are especially encouraged.” While the Pioneer Awards have great potential to encourage risk-taking by a small number of biomedical researchers, they will likely have little effect on more than a handful of new investigators. In particular, it is difficult for new investigators—who, by definition, have little track record—to have already demonstrated significant creativity and independence. Without even a research plan, the selection is largely based on the track records of the applicants and new investigators have little to show, at least as compared to their more senior colleagues. The outcome of the first round illustrates why the NDPA is unlikely to help new investigators: of the nine awardees (out of 1,300 applications)—all are men in their 40s and 50s, most are tenured professors at elite institutions, and seven of the nine already have current NIH grants (Mervis, 2004a).
National Science Foundation
The National Science Foundation (NSF) administers one program especially targeted to those at the beginning of their careers. The Faculty Early Career Development (CAREER) Program, offered across NSF, targets those who plan to integrate research and education activities. CAREER awards provide at least $100,000 a year for 5 years to investigators in their first faculty positions. Recipients must be in tenure-track positions, but not yet have received tenure. The application requires an endorsement
from the department head and a career-developmental plan from the applicant that describes research and educational goals, the relevance to the applicant’s own career goals, and a summary of prior research and educational accomplishments. Several of the most meritorious CAREER recipients are selected for the Presidential Early Career Awards for Scientists and Engineers (PECASE), although this designation does not include any additional award benefits. Twenty-five percent of the biological sciences directorate’s young investigators are funded through CAREER each year, although the success rate is only 16 percent.
Overall, in 2003, the NSF funded 24 percent of research grants submitted by all principal investigators, 30 percent of research grants submitted by new principal investigators, and 20 percent of CAREER grant applications across the Foundation, according to Mary Clutter of the Biological Sciences Directorate in her presentation at the committee’s June 16, 2004, public workshop.
NSF does not ask applicants their age, so “new” is defined by the number of years after receiving the PhD. When expressed as a percentage of total awards, awards to new investigators decreased significantly after investigators passed 11 years from PhD. This equates to approximately 40 years old, which is below the median age for receipt of new NIH awards. Because of its broad mission, NSF offers a comparison of biological sciences awards with those in other disciplines. A cross-disciplinary analysis shows the experiences of new investigators in biological sciences are similar to those in mathematics and the physical sciences. Only in computer science and engineering (by a significant margin) and social, behavioral, and economic sciences (by a slim margin) do new investigators have the greatest success in obtaining funding within 5 years after receiving their PhDs.
In addition to the CAREER program, NSF fosters independence in a number of ways:
-
Review committees (akin to study sections) are asked to give “extra credit” to beginning investigators.
-
Program officers are encouraged to have balance in their portfolios. As Dr. Clutter described at the workshop, NSF division directors make sure there are “a goodly number of beginners, as well as small institutions, different types of institutions, etc.”
-
The few postdoctoral awards that NSF offers are portable and include automatic starter grants (for approximately $50,000).
NSF is concerned about the next generation of scientists and, therefore, places extra emphasis on new investigators. In addition, NSF strives to integrate research and education.
Other Federal Support for New Investigators
In addition to NIH and NSF, the Department of Defense provides another major source of federal funding for new investigators in the biomedical sciences. The Army’s Breast Cancer Research Program offers a physician-scientist training award. This two-phase 5-year award can total up to $700,000. The award is given to MDs or MD/PhDs in their last year of oncology graduate training or in their first 3 years as a junior faculty member. The first, mentored phase of the award provides up to 3 years of salary support and medical school debt relief; the second phase adds direct research support. The Office of Naval Research also administers a Young Investigator Program designed to support the careers of academic scientists and engineers within 5 years of receiving their PhD. It offers up to $100,000 per year for 3 years for salary, graduate student support, supplies, and operating expenses and requires a letter of institutional support.
Private Sector Programs for New Investigators
A number of programs for new investigators also exist in the private sector, especially at private foundations (see also ACS/BWF/HHMI, 2000).
Markey Scholar Awards in the Biological Sciences
The Lucille P. Markey Charitable Trust created some of the first career transition awards, known as Markey Scholar Awards in the Biological Sciences. Established in 1983 as a 14-year limited-term trust, the Markey Trust distributed institutional and individual grants, including almost $60 million to 113 Markey Scholars (Lucille P. Markey Charitable Trust, 1996). Academic institutions were invited to nominate young investigators for the awards, which provided salary and research support for up to 3 years of postdoctoral training and for the first 5 years of the awardee’s first faculty position. Support for the faculty phase declined in anticipation of the faculty member obtaining replacement funds from other sources. Among the characteristics that proved especially desirable in the Markey Scholars program were the flexibility in the awardees’ use of the money, including no-cost extensions; the long tenure of the award; the resultant ability to focus on research without having to seek additional funding; and the networking opportunities with the other Scholars.
The National Academies is engaged in a multi-year study on the outcomes of grants and fellowships awarded by the Markey Charitable Trust in the biomedical sciences between 1982 and 1997. Among the outcomes
of interest for fellowship recipients are publications, grants, and independent investigator status. These results will be helpful data in evaluating the success of career transition awards.
Burroughs Wellcome Career Awards
The Burroughs Wellcome Fund (BWF) offers the Career Award in the Biomedical Sciences,9 based upon the initial structure of the Markey Scholar Awards. The goal of this $500,000, 5-year award is to help postdoctoral scholars obtain faculty positions and achieve research independence. Applicants must have between 1 and 2 years of postdoctoral study and be nominated by their sponsor institutions. BWF requires 1 year of additional postdoctoral training unless, during the application process, the applicant has been offered a faculty position. Eighty percent of the recipient’s time must be devoted to research. The award provides salary and research funding—up to 1 year of postdoctoral support and 4 years of faculty support. An investigator is not restricted from receiving additional awards from other sources. The BWF career awards program is one of the only programs that has had a formal assessment of its success and influence on the career trajectories of its awardees (Pion and Ionescu-Pioggia, 2003). Box 5-1 summarizes the evaluation.
BWF provides training to the awardees in areas not generally addressed during postdoctoral training, such as how to manage a laboratory and how to negotiate an academic-industrial collaboration. BWF also collaborates with the Howard Hughes Medical Institute (HHMI) to host the Laboratory Management Course (BWF and HHMI, 2004).10
National Multiple Sclerosis Society Career Transition Fellowships
The National Multiple Sclerosis Society awarded its first three Career Transition Fellowships in 2003. These two-phase awards are given to those with 2-4 years of postdoctoral experience who are engaged in multiple-sclerosis-related research; the first phase includes salary and research support in the 2-year mentored postdoctoral phase, followed by $125,000 annually for salary, personnel, research, and indirect costs during the 3-year faculty phase.
American Heart Association Fellow-to-Faculty Awards
The American Heart Association offers a career transition awards program for MD and MD/PhD scientists pursuing independent research careers in areas relevant to its mission. Applicants for Fellow-to-Faculty awards may have no more than 5 years of postdoctoral research training and must work with a mentor to develop a plan for the training phase; the applicant also identifies a mentor for the faculty phase of the award. Awardees receive salary and research support during the training phase and salary, project support, and indirect costs during the faculty support phase. Mentors also receive $5,000 in compensation for their efforts. Applicants are expected to devote at least 80 percent of their time to research-and training-related activities.
Keck Distinguished Young Scholars in Biomedical Research
The W.M. Keck Foundation established the Distinguished Young Scholars in Biomedical Research Program in 1998. Although the program was originally meant to award only 5 years of Scholars, it was extended for another 5 years in 2003. Thirty institutions are invited to nominate promising early-career biomedical scientists who are in the second, third, or fourth year of their first tenure-track position. Awardees receive up to $1 million over 5 years for salary and research support. The review process is said to emphasize innovative ideas and to support “risky” projects for which funding may be hard to otherwise secure. Unlike several other awards for young investigators, the Keck Foundation does not place limits on teaching, administrative, or grant-writing responsibilities of the awardees, as it sees these skills as important for the careers of the Scholars.
Packard Foundation Fellowships for Science and Engineering
The David and Lucille Packard Foundation invites the presidents of 50 universities to nominate two professors who have held faculty positions for less than 2 years for their Fellowships in Science and Engineering. Nominees should be “unusually creative researchers” undertaking “innovative individual research” in the natural sciences, physical sciences, or engineering, focusing on areas that do not traditionally receive generous funding from other sources. Awardees receive $625,000 over 5 consecutive years and attend annual Packard Fellows meetings.
Beckman Young Investigator Program
The Arnold and Mabel Beckman Foundation established the Beckman Young Investigator Awards in 1991 and has made about 200 awards totaling over $40 million since that time. Awards are normally in the range of $240,000 over a 3-year award tenure. Applicants must be U.S. citizens or permanent residents who are pursuing careers in the chemical or life sciences and have held tenure-track positions for no more than 3 years. According to the Foundation, “Projects should … represent innovative departures in research rather than extensions or expansions of existing programs. Proposed research that cuts across traditional boundaries of scientific disciplines is encouraged.”11
Pew Scholars Program in Biomedical Sciences
The Pew Charitable Trusts has given 20 rounds of awards through the Pew Scholars Program in the Biomedical Sciences, to support junior faculty members as they establish independent laboratories. The program encourages awardees to be “more venturesome in their research and future applications for support than would otherwise be likely.” Faculty within the first 3 years of a full-time faculty appointment as assistant professor or independent researcher are eligible to be nominated by their institution. Scholars are awarded $60,000 per year for 4 years to use for personnel, equipment, supplies, and related travel. The amount for the Scholar’s salary is capped at $10,000, and overhead is limited to 8 percent. Scholars are also expected to participate in an annual meeting to present their research and allow for collaboration and exchange with other Pew Scholars.
Searle Scholars Program
The Kinship Foundation offers the Searle Scholars Program to “support the independent research of exceptional young faculty in the biomedical sciences and chemistry.” Searle Scholar Awards are made to selected academic institutions to support the independent research of outstanding individuals in the first or second year of their first tenure-track assistant professor appointments. Applicants pursuing independent research careers in biochemistry, cell biology, genetics, immunology, neuroscience, pharmacology, or related areas of chemistry, medicine, and the biological sciences can receive one of 15 grants, which offer $80,000 for each of 3 years.
McKnight Scholar Awards
The McKnight Endowment Fund for Neuroscience offers its McKnight Scholar Awards for scientists in the early stages of their careers on disorders of learning and memory. Applicants should have already completed their doctoral degree and postdoctoral training and be in the first 4 years of establishing an independent laboratory and research career. Up to six scholars are selected each year for up to 3 years of support at $75,000 per year. Funds may be used in any relevant way to support the Scholar’s research program, except for indirect costs.
Damon Runyon Scholar Award
The Damon Runyon Cancer Research Foundation grants five Scholar Awards each year to support outstanding scientists as independent investigators. Awardees, who must be within the first 3 years of an assistant professorship, must either be former Damon Runyon postdoctoral fellows or be nominated by their institution (if invited to do so). Damon Runyon Scholars receive $100,000 for each of 3 years that may be used for salary, technical support, equipment, or supplies. Scholars must submit a progress report in the first 2 years of the award as well as a one-paragraph summary of their research written for the lay public. The host department and institution must guarantee that 80 percent of the applicant’s time will be devoted to research, with an accounting for the activities that make up the remaining 20 percent of time and effort specified in the application and progress reports.
Sloan Research Fellowships
The Alfred P. Sloan Foundation has spent nearly $100 million since 1955 to support the early careers of over 3,800 researchers as Sloan Research Fellows. Tenure-track assistant professors within 6 years of receiving their PhD may be nominated by their departments. The 2-year award of $40,000 provides support for the Fellow’s research, including equipment, travel, or trainee support, but may not be used for salary augmentation or indirect costs. The field distribution has been established by the Foundation and currently awards 116 fellowships, including 16 in neuroscience and 12 in computational and evolutionary molecular biology.
American Cancer Society Programs
The American Cancer Society offers a number of research grants and mentored training and career development grants that support new in-
vestigators. In addition to research scholar grants for those in the first several years of independent research careers, several other programs for senior investigators encourage the inclusion of a faculty member at an early-career stage as a co-investigator.
Institutional Independent Research Fellowships
Several institutions provide highly prestigious and very flexible research fellowships to promising researchers at an early career stage. Most recipients are recent doctoral-degree recipients nominated by their research mentors or other prominent scientists. Awardees generally spend several years in residence at the host institution and receive both salary and research support. The fellowship period therefore allows these new investigators to establish an independent research program free from having to apply for external funding or fulfilling teaching or administrative responsibilities. Many of these programs were developed following the model of others, in an attempt to provide similar experiences at other institutions.
The Carnegie Institution of Washington has supported a small number of exceptional early-career scientists as staff associates in its Department of Embryology since 1979. Staff associates are independent junior faculty members who hold non-renewable faculty-level independent appointments for up to 5 years and are appointed in lieu of or just after completing a regular postdoctoral fellowship. Up to four staff associates at a time are provided with their own laboratory space and funding for research equipment, supplies, and usually a technician. Staff associates are considered to be independent PIs and are eligible to apply for external funding, though institutional resources are generally sufficient during the tenure at Carnegie. Although there is no formal association with an established Carnegie laboratory or PI, staff associates are encouraged to attend regular laboratory group meetings in addition to department-wide activities. The small size of the department and the commitment of its members to the program provide a collegial environment in which staff associates receive necessary guidance and mentoring, even without a formal mentoring system.
The Whitehead Institute for Biomedical Research accepts nominations of recent PhD, MD, and MD/PhD recipients for the Whitehead Fellows Program from candidates’ research advisors or other distinguished scientists. The handful of fellows in residence at a time are provided with the space and resources to establish an independent laboratory and conduct an independent research program at the Whitehead Institute. Fellows generally receive support for their own salary, one or two technicians, and
necessary equipment, supplies, and overhead. A 3-year appointment is initially made at selection with the expectation that it will be extended to 5 years. Fellows have the opportunity to serve as PIs and to take advantage of the facilities and interactions with colleagues at the Whitehead or neighboring Massachusetts Institute of Technology, free from financial constraints and formal teaching responsibilities.
The Fellows Program at the University of California, San Francisco (UCSF) has brought in a small number of promising early-career researchers through a 5-year fixed-term award. UCSF Fellows receive office space and a small laboratory, along with salary and a core research grant, and are eligible to serve as PI on external research grants. Fellows may sponsor postdoctoral researchers and co-sponsor graduate students with UCSF faculty. UCSF Fellows are nominated by prominent scientists, generally just after completion of their PhD or after brief postdoctoral periods. UCSF is also considering mechanisms for including physician-scientists in the program. Unlike most of the other models described here, formal mentorship is an important aspect of the program: UCSF Fellows are encouraged to set up a mentoring committee of three senior faculty members to provide guidance on topics including running a laboratory and hiring research personnel.
The University of California, Berkeley awards Miller Research Fellowships through The Adolph C. and Mary Sprague Miller Institute for Basic Research in Science to approximately 8-10 promising scientists at the time of—or soon after—receipt of a doctoral degree. Nominations are accepted from former Miller Fellows and Professors, UC-Berkeley science faculty, faculty advisors and department chairs of candidates, and a worldwide panel of experts. Fellows currently receive a stipend of $50,000 per year with an individual research fund of $10,000 for research, equipment, travel, and other expenses.
Harvard University selects about 10 “persons of exceptional ability, originality, and resourcefulness” as Junior Fellows in any field of study at an early career stage each year. Selected by the Harvard faculty who serve as Senior Fellows from nominations by previous research mentors, recipients spend 3 years in residence conducting independent research with few strings attached—other than attendance at weekly lunches and dinners. Junior Fellows currently receive a stipend of $55,500, but generally arrange support for research with members of the Harvard faculty or apply for internal research funds (Junior Fellows do not have PI status for applying for external funding).
Although the committee found these institutional independent pre-tenure-track fellowships to be beneficial, the committee did not feel that this model could be successfully adopted by the NIH. First, the fully in-
dependent positions require very substantial financial investment on the part of the institution,12 usually providing a start-up equipment package to each fellow along with continuing research and salary support, even though the individuals may only stay at the institution for 3-5 years. Only the wealthiest institutions are likely to be able to provide these resources, and even for them there must be a significant internal reason to divert start-up funds from regular faculty to these special programs. In fact, there is some evidence that other institutions that have tried to adopt similar programs have had difficulty maintaining appropriate funding levels as other needs arise. Moreover, external support to establish or support such programs would essentially be institutional block grants. Although training grants may also be considered block grants, they tend to have a well-defined research focus and close oversight by faculty PIs, in addition to being much more modest in budget. The lack of oversight by NIH on such an institution-based program would make such a program unlikely to receive significant federal support.
Second, the fully independent fellowship positions often lack the opportunity for direct personal mentorship by a senior scientist with similar research interests that is the major academic benefit of the traditional postdoctoral period. Although it is desirable for scientists to become fully independent as quickly as possible, for many people assuming an independent position with the complete responsibilities of running a laboratory immediately after completing the PhD may be too soon. This emphasizes the importance of such programs having the full support and participation of senior faculty mentors.
European Models
Finally, it is worth considering awards that support the independence of new investigators in Europe. The German Research Foundation (Deutche Forschungsgemeinschaft) offers several programs for early-career scientists including the Heisenberg Programme for individuals usually under 35 but no older than 39 with 5 years of salary and research support—and the Emmy Noether Programme, which supports training abroad followed by research and salary support in the first German faculty position.
The Volkswagen Foundation Lichtenberg Professorships provide support to outstanding scientists for up to 8 years. The goal is to provide young investigators the opportunity to independently pursue new and
interdisciplinary research at an early stage in their careers. Applicants must be within 3 years of receiving their PhD and under age 35 with a proven research and publication record. Institutions must also submit a binding letter describing how the environment and focus of the department is appropriate for the applicant and committing to cost-sharing during the professorship and continuing support after the award’s conclusion.
The European Molecular Biology Organization (EMBO) offers the Young Investigator Programme to young scientists in the first 3 years of establishing their own independent laboratory. In addition to €15,000 per year, EMBO provides an opportunity to network with other scientists at the European Molecular Biology Laboratory (EMBL). EMBO Young Investigators choose an EMBL mentor who provides advice on the awardee’s research project and helps promote the mentee to relevant conferences.
The French National Institute for Health and Medical Research (INSERM) offers its Avenir Program for the Promotion of Young Researchers to encourage autonomy for promising young biomedical research scientists. Avenir awardees are provided with a fully equipped laboratory within an INSERM facility or French University Hospital. Applicants receive support of up to €60,000 per year for 3 years and, possibly, financial support to host a foreign postdoc or graduate student. Applicants may already hold a permanent research position at INSERM or other French research institute, university, or hospital; those without a permanent position may apply to develop an independent research project at a host institution.
Conclusion
Few of these model programs for new or early-career investigators have collected data on their outcomes or the successes of their awardees. Conclusions on helpful elements of the awards come from the few programs that have been evaluated and from anecdotal feedback from recipients, program administrators, and other observers. The lack of rigorous feedback on these awards demonstrates the importance of collecting data on awardees—and an appropriate control group—to determine the effect of the award on the careers of those scientists. However, it is difficult to demonstrate a cause-and-effect relationship between the award and career success. For instance, many of the awards go to the same population of researchers, i.e., the same individuals may receive multiple such awards. Did the award help those selected to advance in their career or receive subsequent funding? Or would the individuals selected have been likely to succeed even without the award? These questions are difficult to answer.


