
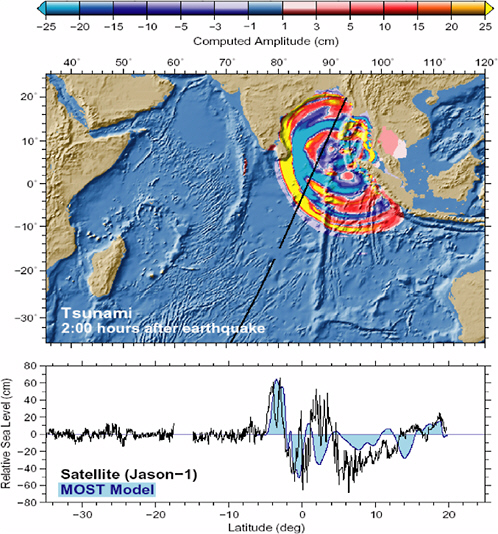
PLATE 1 (Top) Model of the anomalous water height (warm colors are increases in height and cool colors are decreases in height) caused by the deep-water propagation of the tsunami. (Bottom) comparison of the altimetry data (black line) from the Jason-1 satellite 2 hours after the event with the model result (blue line). SOURCE: NOAA’s Pacific Marine Environmental Laboratory. For further information, see NOAA, NOAA News Online, “Scientists Able to Measure Tsunami Height from Space,” 2005, at <http://www.noaanews.noaa.gov/stories2005/s2365.htm>.
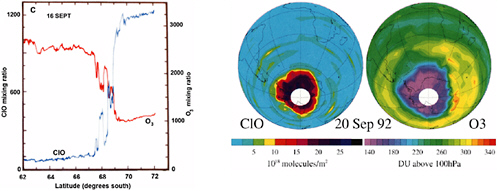
PLATE 2 Ozone-ClO anticorrelation and satellite images of ClO and O3. (Left) NASA aircraft in situ ClO-O3 anticorrelation across Antarctic vortex edge. (Right) NASA microwave LIMB sounder satellite observation of ClO and O3. SOURCE: World Meteorological Organization, Scientific Assessment of Stratospheric Ozone: 1994, WMO Report 37, Geneva, 1994.
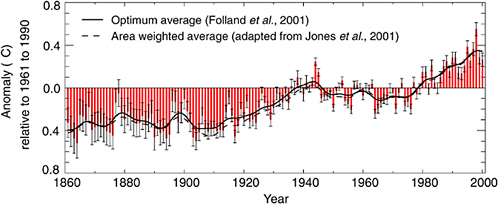
PLATE 3 Annual global land-surface air and sea surface temperature anomalies (°C), 1861 to 2000, relative to 1961 to 1990. Solid curve is the optimally averaged anomalies from Folland et al. [C.K. Folland, N.A. Rayner, S.J. Brown, T.M. Smith, S.S.P. Shen, D.E. Parker, I. Macadam, P.D. Jones, R.N. Jones, N. Nicholls, and D.M.H. Sexton, “Global Temperature Change and Its Uncertainties Since 1861,” Geophys. Res. Lett. 28(13): 2621-2624, 2001], and the dashed curve is the standard area weighted anomalies (adapted from Jones et al. [P.D. Jones, T.J. Osborn, K.R. Briffa, C.K. Folland, E.B. Horton, L.V. Alexander, D.E. Parker, and N.A. Rayner, “Adjusting for Sampling Density in Grid Box Land and Ocean Surface Temperature Time Series,” J. Geophys. Res. 106:3371-3380, 2001]). Unsmoothed optimum averages appear as red bars, and twice their standard errors are denoted by black “I”. SOURCE: Intergovernmental Panel on Climate Change, Climate Change 2001: The Scientific Basis, Contribution of Working Group I to the Third Assessment Report of the Intergovernmental Panel on Climate Change, Cambridge University Press, Cambridge, 2001. Reprinted with permission.


