
Attracting the Most Able US Students to Science and Engineering
SUMMARY
The world economy is growing rapidly in fields that require science, engineering, and technologic skills. The United States can remain a leader in science and engineering (S&E) only with a well-educated and effectively trained population. The most innovative S&E work is done by a relatively small number of especially talented, knowledgeable, and accomplished individuals. Because of the importance of S&E to our nation, attracting and retaining individuals capable of such achievements ought to be a goal of federal policy.
It follows that a key component of national and economic security policy must be US S&E students. The United States has relied on drawing the best and brightest from an international talent pool. However, recent events have led some to be concerned that the United States cannot rely on a steady flow of international students. Furthermore, as other developed countries encourage international students to come to their countries and developing countries enhance their postsecondary educational capacity, there is increased competition for the best students, which could further reduce the flow of international students to the United States. Therefore, any policies aimed at encouraging student interest in S&E must have a significant component that focuses on domestic talent.
Fundamentally, policy levers designed to influence the number of US S&E workers fall into two categories: supply-side and demand-side. Among supply-side issues are K–12 science, mathematics and technology teaching, undergraduate S&E educational experience, graduate training experience, opportunity costs compared with those of other fields and professions, and length of postdoctoral training period. On the demand side are funding for research and availability of research jobs, both of which are powerfully influenced by public policies and by public and private expenditures on research and development.
Past reports have identified a number of options the federal government could take to influence the education and career decisions of top US students, including the following:
-
Double the number of magnet high schools specializing in science, technology, engineering, and mathematics from approximately 100 to 200 over the next 10 years.
-
Support competitive undergraduate scholarships for students interested in science, mathematics, and engineering.
-
Provide scholarships to all qualified students majoring in science or mathematics at a 4-year college who have an economic need and who maintain high levels of academic achievement.
-
Provide at least 5,000 portable graduate fellowships, each with a duration of up to 5 years, for training in emerging fields, to encourage US students to pursue S&E graduate studies.
-
Provide graduate student stipends competitive with opportunities in other venues.
-
Support a significant number of selective research assistant professorships in the natural sciences and engineering open to postdoctoral scholars who are US citizens or permanent residents.
-
Partner with industry to sponsor a series of public-service announcements exalting science and technology careers.
GETTING AN EARLY START: K–12 S&E PROGRAMS
One proven way of fostering students’ interest in science and technology is through magnet high schools that emphasize those subjects. There are approximately 100 such schools in the United States, and studies have shown that graduates from these schools are more likely to study science, mathematics, or engineering in college and enter those fields during their careers.1 It is not known, however, whether these students would have had similar career trajectories even if they had not attended magnet schools.
During the undergraduate years, involvement in research projects and the guidance of experienced mentors are powerful means of retaining students in S&E.2 Mentors can provide advice, encouragement, and information about people and issues in a particular field. An early exposure to research can demonstrate to students the kinds of opportunities they will encounter if they pursue research careers.
TRENDS IN UNDERGRADUATE AND GRADUATE STUDENT INTEREST IN S&E
When one examines the issue, it becomes clear that there is a great deal of domestic student interest in undergraduate S&E programs. About 30% of students entering college in the United States (of whom over 95% are US citizens or permanent residents) intend to major in S&E fields. This proportion has remained fairly constant over the last 20 years. However, a considerable gap exists between freshman intentions and successful degree completion. Undergraduate S&E programs report the lowest retention rate among all academic disciplines. A National Center for Educational Statistics (NCES) longitudinal study of first-year S&E students in 1990 found that fewer than 50% of undergraduate students entering college declaring a S&E major had completed S&E degrees within 5 years.3 Indeed, approximately 50% of such undergraduate students changed their major field within the first 2 years.4 Undergraduates who opt out of S&E programs are among the most highly qualified college entrants.5 They are also disproportionately women and nonwhite students, indicating that many potential entrants are discouraged before they can join the S&E workforce.6
Graduate enrollment in S&E programs has been a relatively level 22-26% of total enrollments since 1993 (see Figures TS-1A, B, C, and D and TS-2). Growth in the number of S&E doctorates awarded is due primarily to the increased numbers of international students but also to the increasing participation of women and underrepresented minority groups.7 If the primary objective of the US S&E enterprise is to maintain excellence, a major challenge is to determine how to continue to attract the best international students and at the same time encourage the best domestic students to enter S&E undergraduate and graduate programs.
DECISION POINTS AND DISINCENTIVES
There are inherent disincentives that push students away from S&E programs and careers. These disincentives fall into three broad categories: curriculum, economics, and environment. Undergraduate attrition may be due partly to a disconnect between the culture and curricula in high schools compared with those at colleges and universities.8 For example, poor mathematics preparation in high school may underlie attrition in undergraduate physics programs. Underrepresented groups such as Blacks and American Indians, who are educated disproportionately in underserved communities, are on the whole less well prepared for college.9 These types of problems suggest transitional programs to bridge the gap between high school and college, but the value of such strategies has not been compared with those at other levels in the educational system.
Higher education is costly, and employment opportunities fluctuate. Whether a student perceives that a degree will lead to a viable career is a major factor determining choice of field.10 This is illustrated particularly
|
tence and Graduation. Norman, OK: University of Oklahoma, 2002. Available at: http://www.ou.edu/education/csar/literature/tan_paper3.pdf; Building Engineering and Science Talent (BEST). The Talent Imperative: Diversifying America’s S&E Workforce. San Diego: BEST, 2004; G. D. Heyman, B. Martyna, and S. Bhatia. “Gender and Achievement-Related Beliefs Among Engineering Students.” Journal of Women and Minorities in S&E 8(2002):33-45. |
|
7 |
National Science Foundation. Graduate Enrollment Increases in S&E Fields, Especially in Engineering and Computer Sciences. NSF 03-315. Arlington, VA: National Science Foundation, 2003. |
|
8 |
A. Venezia, M. W. Kirst, and A. L. Antonio. Betraying the College Dream: How Disconnected K–12 and Postsecondary Education Systems Undermine Student Aspirations. Stanford, CA: The Bridge Project, Stanford University, 2003. Available at: http://www.stanford.edu/group/bridgeproject/betrayingthecollegedream.pdf. |
|
9 |
E. Babco. Trends in African American and Native American Participants in STEM Higher Education. Washington, DC: Commission on Professionals in Science and Technology, 2002. |
|
10 |
C. T. Clotfeltner, R. G. Ehrenberg, M. Getz, and J. J. Siegfried. Economic Challenges in Higher Education. Chicago, IL: University of Chicago Press, 1991; M. S. Teitelbaum. “Do We Need More Scientists?” The Public Interest 153(2003):40-53. |
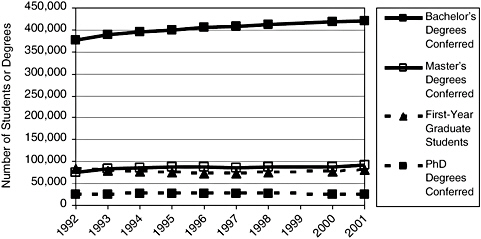
FIGURE TS-1A Number of first-year graduate students and number of S&E degrees conferred, by degree type, 1992-2001.
SOURCE: Data on first-year graduates are from National Science Foundation. Survey of Graduate Student and Postdoctorates in Science and Engineering. NSF 03-320. Arlington, VA: National Science Foundation, 2003. Degree data from National Science Foundation. Science and Engineering Degrees: 1966-2001. NSF 04-311. Arlington, VA: National Science Foundation, 2003.
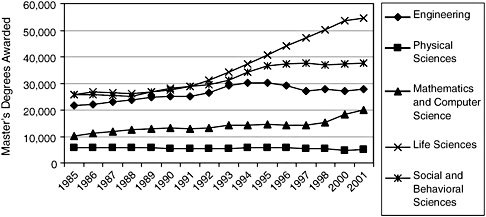
FIGURE TS-1B Number of S&E master’s degrees awarded, by field, 1985-2001.
SOURCE: National Science Foundation. Science and Engineering Degrees: 1966-2001. NSF 04-311. Arlington, VA: National Science Foundation, 2003.
well in engineering: undergraduate student decisions to major in particular fields vary depending on business cycles.
Research indicates that large schools, which often foster a competitive “weeding out” environment, have a much higher attrition rate than smaller schools. This environment can be compounded by the culture of specific
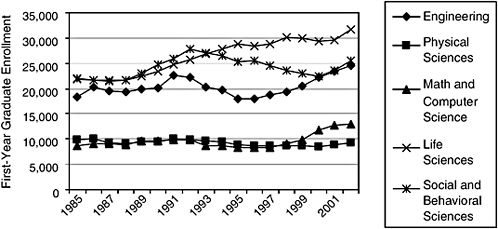
FIGURE TS-1C Number of first-year S&E graduate enrollments, by field, 1985-2001.
SOURCE: Data on first-year graduates are from National Science Foundation. Survey of Graduate Student and Postdoctorates in Science and Engineering. NSF 03-320. Arlington, VA: National Science Foundation, 2003.
fields. Some researchers argue that a key factor in stemming attrition is feeling connected to the intellectual and social life of the college.11 Another researcher writes of three types of university cultures—the elite (scientific excellence), the pluralist (research, teaching, and service), and the communitarian (citizenship)—each carrying its own set of values and signals, some of which are competing.12 Departments, colleges and universities, and professional societies each have a role in providing a high-quality, engaging learning environment.
After a student’s determination of an undergraduate major or concentration, another key transition point is a decision to enter and complete graduate training.13 Major factors to consider include time to degree and economics.14 Unclear job prospects and lost earning potential are major
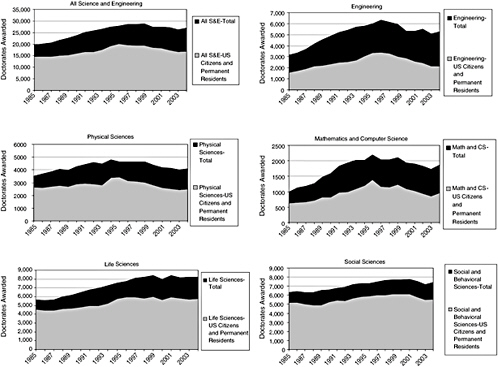
FIGURE TS-1D Number of doctorates awarded, by field and citizenship, 1985-2003. US citizens and permanent residents earn on average about 60-70% of S&E doctoral degrees; about 80% in life sciences and social sciences, 60% in physical sciences, and 50% in engineering and mathematics and computer sciences.
SOURCE: National Science Foundation. Survey of Earned Doctorates. Arlington, VA: National Science Foundation, 2005.
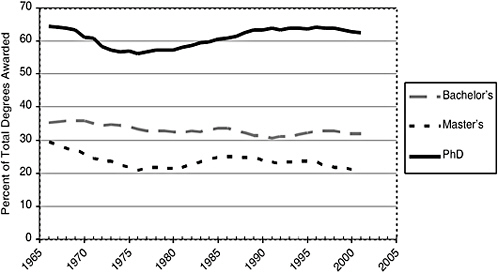
FIGURE TS-2 Percent of total degrees awarded which are S&E degrees, by degree type: 1966 to 2001. Most US doctorate degrees are awarded in S&E fields.
SOURCE: Based on National Science Foundation. Science and Engineering Degrees: 1966-2001. NSF 04-311. Arlington, VA: National Science Foundation, 2003. Table 1. Data from National Center for Education Statistics, Integrated Postsecondary Education Data System. Completions Survey and National Science Foundation/ Division of Science Resources Statistics Survey of Earned Doctorates.
disincentives for many considering an advanced S&E degree.15 An issue raised in several studies on doctoral education is that prospective students are underinformed. A large, cross-disciplinary, multi-institutional survey on the experiences of doctoral students indicated that students entering doctoral programs entered their programs “without having a good idea of the time, money, clarity of purpose, and perseverance that doctoral education entails.”16 The burden of being informed does not rest solely on the prospective student. While professional schools make a point to inform prospective students of the salary and employment levels of graduates, it
|
15 |
R. Freeman, E. Weinstein, E. Marincola, J. Rosenbaum, and F. Solomon. “CAREERS: Competition and Careers in Biosciences.” Science 294(5550)(2001):2293-2294; W. Butz, G. A. Bloom, M. E. Gross, T. K. Kelly, A. Kofner, and H. E. Rippen. Is There a Shortage of Scientists and Engineers?: How Would We Know? IP-241-OSTP. Santa Monica, CA: RAND Corporation, 2003. Available at: http://www.rand.org/publications/IP/IP241/IP241.pdf; M. S. Teitelbaum. “Do We Need More Scientists?” The Public Interest 153(2003):40-53. |
|
16 |
C. M. Golde and T. M. Dore. At Cross Purposes: What the Experiences of Doctoral Students Reveal About Doctoral Education. Philadelphia, PA: A Report Prepared for The Pew Charitable Trusts, 2001. |
appears that S&E graduate programs rarely make such information available.17
Career Prospects in S&E
Students considering research careers can face daunting prospects. Graduate and postdoctoral training may take over a decade, usually with low pay and few benefits. Most researchers do not become full-fledged members of the profession until their mid-30s or later—an especially onerous burden for those who are trying to balance the demands of work and family.
Even at the end of this long training period, many do not find the jobs for which they have been trained. The stagnation of funding for the physical sciences, mathematics, engineering, and the social sciences over the last decade has led to fewer academic faculty positions in these fields. Even in expanding fields, such as the biosciences, the number of permanent academic research and teaching positions has not kept up with the growing number of students who are entering these fields. As a result, more and more researchers languish in temporary positions.18 The fastest-growing employment category since the early 1980s has been “other academic appointments,” which is currently increasing at about 4.9% annually.19 These jobs are essentially holding positions filled by young researchers coming from postdoctoral positions who would like to join an academic faculty on a tenure track and are willing to wait. It is an increasingly long wait as institutions are decreasing the number of faculty appointments to decrease the long-term commitments that they entail. From 1993 to 2001, the number of biomedical tenure-track appointments increased by 13.8%, while those for nontenure-track faculty increased by 45.1% and other appointments by 38.9% (see Figures TS-3A and B).
In fields outside the life sciences, most doctorates go on to careers in industry or government (see Figures TS-4A and B). Increasingly, these sectors are providing research opportunities for the best students. At the same time that biotechnology firms are gearing up their R&D operations, top industrial research laboratories, such as Bell Labs and Xerox PARC are
|
17 |
P. Romer. Should the Government Subsidize Supply or Demand in the Market for Scientists and Engineers? Working Paper 7723. Cambridge, MA: National Bureau for Economic Research, 2000. Available at: http://www.nber.org/papers/w7723/; National Research Council. Trends in the Early Careers of Life Scientists. Washington, DC: National Academy Press, 1998. |
|
18 |
National Research Council. Trends in the Early Careers of Life Scientists. Washington, DC: National Academy Press, 1998. |
|
19 |
National Research Council. Advancing the Nation’s Health Needs. Washington, DC: The National Academies Press, 2005. |
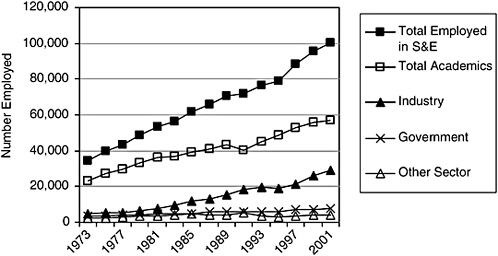
FIGURE TS-3A Number of biomedical jobs, by sector, 1973-2001.
SOURCE: National Research Council. Advancing the Nation’s Health Needs. Washington, DC: The National Academies Press, 2005. Appendix E.
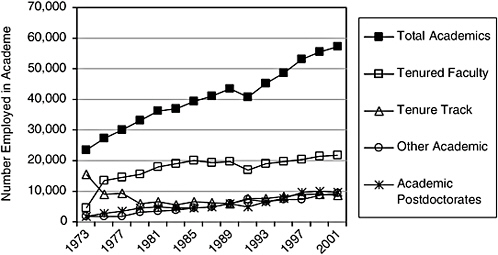
FIGURE TS-3B Number of biomedical academic jobs, by tenure-track status, 1973-2001.
SOURCE: National Research Council. Advancing the Nation’s Health Needs. Washington, DC: The National Academies Press, 2005. Appendix E.
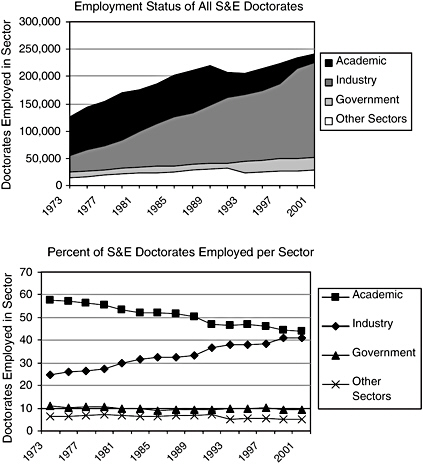
FIGURE TS-4A Number and percentage of S&E doctorates employed, by sector, 1973-2001.
SOURCE: National Science Foundation. Survey of Doctoral Recipients 2003. Arlington, VA: National Science Foundation, 2005.
closing down, leaving physical-science graduates with few options. Increasingly, mathematics and computer-science graduates are turning to finance and Wall Street. Given these shifts in workforce opportunities, top US students may consider options other than S&E very attractive. Careers in such professions as law, medicine, business, and health services require less training, offer more secure job prospects, and have much higher lifetime earning potential (see Tables TS-1A and B).
INTEREST IN RESEARCH CAREERS BY TOP STUDENTS TRACKS JOB MARKET
The current contrast between these options and research is influencing career decisions. According to available sources of data, accomplished US
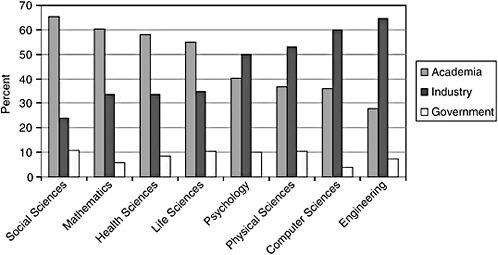
FIGURE TS-4B Work sector of PhDs by field, 2001.
SOURCE: National Science Foundation. Survey of Doctoral Recipients 2003. Arlington, VA: National Science Foundation, 2005.
students are increasingly turning away from S&E, especially during their undergraduate years.20 In the 1990s, surveys of science majors from top universities showed a striking decline of interest in S&E careers. Between 1984 and 1998, the percentage of college seniors planning to go to graduate school in the next fall in S&E fields dropped from 17 to 12%. Among those students with A or A- grade-point averages, the declines were comparably steep—from 25 to 18%.21
Between 1992 and 2000, the number of college seniors who scored highly on the Graduate Record Examination (GRE) and indicated that they intended to study S&E in graduate school fell by 8%. The number of these top students planning to go to graduate school in fields other than S&E grew by 7% (Figure TS-5). The greatest declines were in engineering (25%) and mathematics (19%). Among top GRE scorers, however, enrollment in biological sciences programs showed a 59% gain. When it came to careers outside S&E, the researchers found that the fields attracting the largest growth in top GRE scorers were short training programs in health profes-
sions, such as physical therapy, speech and language pathology, and public health—drawing 88% more top scorers in 2000 than in 1992.
Where are top students going if not into S&E? The top US students do not appear to be headed in large numbers into law school or medical school, where enrollments have been flat or declining. But more do seem to be attracted to graduate business schools, where the number of MBAs awarded annually grew by nearly one-third during the 1990s. During this period, many S&E undergraduate students also may have entered directly into the workforce after graduating, attracted in part by the booming economy. As the economy slowed in the early part of this decade, some of these students may have returned to graduate school, and more undergraduates may have opted to continue their studies.22
Indeed, 1999 appears to have been the nadir for student interest in S&E graduate study. The economy’s recent slump has prompted growing numbers of top US college graduates to attend graduate school, new data show, sharply reversing course from the late 1990s, when more of the brightest young Americans headed for quicker-payoff careers in business and health. By 2001, with fewer high-technology jobs beckoning, the share of top US citizen scorers (above 750) on the GRE quantitative scale heading to graduate school in the natural sciences and engineering increased by about 31% compared with 1998, after having declined by 21% in the previous 6 years.23 This recent increase is comparable with the 29% gain in the number of all score levels of examinees who intended to enroll in graduate school in S&E. And the total number of GRE examinees increased by 9% between 1998 and 2001, suggesting that more students in a variety of fields were preparing for graduate school.
Enrollments of International Students24
As the number of US students studying S&E in graduate schools has dropped, these schools and employers of scientists and engineers have compensated by enrolling and employing more students and trained personnel from other countries. In 2003, foreign students earned 38% of doctorates
|
22 |
W. Zumeta and J. S. Raveling. The Best and the Brightest for Science: Is There a Problem Here? In M. P. Feldman and A. N. Link, eds. Innovation Policy in the Knowledge-Based Economy. Boston: Kluwer Academic Publishers, 2001. Pp. 121-161. |
|
23 |
W. Zumeta and J. S. Raveling. “The Market for Ph.D. Scientists: Discouraging the Best and Brightest? Discouraging All?” AAAS Symposium, February 16, 2004. Press release available at: http://www.eurekalert.org/pub_releases/2004-02/uow-rsl021304.php. |
|
24 |
See also the International Students Issue Brief elsewhere in this report. |
TABLE TS-1A Median PhD Salaries of Engineering and Science Graduates, by Occupation and Field of Doctorate in 1997
|
|
Occupation |
|
|
|
All Sectors |
University |
|
Economics |
$75,000 |
55,000 |
|
Computer Science |
75,000 |
56,000 |
|
Engineering |
73,000 |
65,000 |
|
Physical Science |
65,000 |
52,000 |
|
Biological Sciences |
56,000 |
40,000 |
|
S&E PhDs in Management, Median Net Income. MDs |
92,000 |
85,000 |
|
|
Field |
|
|
|
All Sectors |
University |
|
Economics |
$69,000 |
62,000 |
|
Computer Science |
72,000 |
57,000 |
|
Engineering |
75,000 |
68,000 |
|
Physical Science |
70,000 |
54,300 |
|
Biological Sciences |
60,000 |
53,000 |
|
SOURCE: R. B. Freeman, E. Weinstein, E. Marincola, J. Rosenbaum, and F. Solomon. Careers and Rewards in Bio Sciences: The Disconnect Between Scientific Progress and Career Progression. Bethesda, MD: American Society for Cell Biology, 2001. Available at: http://www.ascb.org/publications/competition.html. |
||
in S&E, including 59% of engineering doctorates.25 In 2000, foreign-born professionals occupied 22% of all US S&E jobs, up from 14% just 10 years before.
But relying on foreign sources of students and research professionals is risky. As systems of higher education and research continue to develop in other countries, it is likely that fewer scientists and engineers will want to come to the United States to study or work. Security concerns also have led to a drop in applications to US graduate programs from international students. Over time, multinational firms may decide simply to locate their R&D facilities overseas, closer to their sources of scientists and engineers.
TABLE TS-1B Bioscience Salary Case Study on Lifetime Income Disadvantage
|
Lifetime earnings for most doctorates are lower than in other high-level careers, particularly for bioscientists, who are paid less than other highly educated workers at any given level of job experience and who take longer to obtain full-time jobs. The two factors cumulate to a huge lifetime economic disadvantage—on the order of $400,000 in earnings compared with high-paying PhD fields, such as engineering, which also require many years of preparation but in which graduates do not in general delay entry into the job market to take postdoctoral postions. This is equivalent to a salary disadvantage of ~$25,000 per year for every year of working life. Medicine, which has a similar career as the biosciences because of residency in hospitals after completion of training, has about twice the lifetime income. The economic disadvantage is greater when we compare bioscience with professions that require less preparatory training. Consider, for example, a person who has just graduated from a 2-year MBA program in 2000, earning $77,000 in base salary and $12,560 in signing bonus (without stock options). A bioscience PhD who completed postdoctoratal training might earn $50,000 as a starting assistant professor. But the MBA graduate would have spent 2 years in school compared with the 10-12 years that students spend as graduate students and postdoctoral fellows. The salary differential cumulates to a lifetime difference in earnings, exclusive of stock options, conservatively estimated at $1 million discounted at 3%—comparable with $62,000 per year of working life. Add in the options and bonuses that managers get, and this differential could easily double. |
|
SOURCE: Based on Freeman et al., 2001. |
Finally, an overreliance on foreign-born scientists and engineers may have the subtle effect of discouraging US students from entering these fields, both because of cultural differences they might encounter during their education (about 20% of the faculty members in S&E were not born in the United States26) and because of a downward pressure on wages caused by an abundance of international scientists and engineers eager to work in this country.
Possible federal actions include the following:
-
Double the number of magnet high schools specializing in science, technology, engineering, and mathematics from approximately 100 to 200 over the next 10 years. Federal support for these schools would send a powerful message to the entire K–12 system about the importance of science and technology.
-
Sponsor regional, national, and international meetings and competitions for high-school students and undergraduates interested in science,
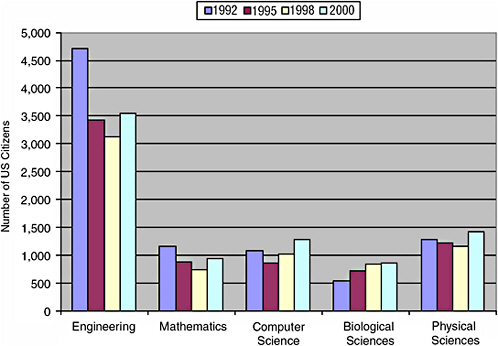
FIGURE TS-5 Number of US citizen GRE examinees scoring over 750 on the quantitative scale by intended S&E field, 1992, 1995, 1998, and 2000.
SOURCE: W. Zumeta and J. Raveling. “The Best and Brightest: Is There a Problem Here?” 2002. Available at: http://www.cpst.org/BBIssues.pdf.
-
mathematics, and engineering. Extracurricular activities and interactions with established scientists, mathematicians, and engineers can be powerful motivating forces for students interested in these subjects.
-
Partner with industry to sponsor a series of public-service announcements exalting S&E careers.27
-
Provide scholarships to all qualified students majoring in science or mathematics at 4-year colleges who have an economic need and who maintain high levels of academic achievement.28 Financial assistance also should be provided to 2-year colleges and to students at those institutions to pre-
-
pare for careers in S&E and to transfer to 4-year programs. Tax credits could be provided to companies or individuals who contribute to scholarship funds for S&E students.
-
Provide at least 5,000 portable graduate fellowships, each with a duration of up to 5 years, for training in emerging fields.29
-
Support prestigious fellowships for graduate study in S&E at US universities that would inspire the best US students in these fields. Though these grants should be linked to the student and therefore portable, an institutional component of each grant would spur competition for these students among institutions.
-
Provide graduate-student stipends competitive with opportunities in other venues.30
-
Substantially increase the number of undergraduate and graduate S&E students drawn from the “underrepresented majority.”31 Today, women, Blacks, Hispanics, American Indians, and persons with disabilities make up two-thirds of the US workforce but only 25% of the technical workforce.
-
Support a significant number of selective research assistant professorships in the natural sciences and engineering at universities.32 These would be highly competitive positions open to postdoctoral scholars who are US citizens or permanent residents. They would provide young and creative scholars with opportunities to pursue research of their own choosing even if they cannot secure positions at research institutions. This would expand the pool of good jobs in S&E in a way that would be expected to affect young people who are trying to decide whether to go to graduate school.
-
Develop prizes for research goals of particular national interest, such as curing AIDS or going into space cheaply. Such prizes can provide flexibility for the researchers striving to achieve them and inspire and educate the public in current research interests.33


