
Undergraduate, Graduate, and Postgraduate Education in Science, Engineering, and Mathematics
SUMMARY
As educators of the nation’s future scientists, engineers, mathematicians, and K–12 teachers, US 2-year and 4-year colleges and universities are the central institutions in building the human resources needed for scientific and technological leadership.
However, these institutions face a number of challenges in producing knowledgeable graduates and trained professionals. Today, the United States ranks 17th globally in the proportion of its college-age population that earns science and engineering (S&E) degrees, down from third several decades ago.1 Many other nations now have a higher fraction of 24-year-olds with S&E degrees (see Figure HE-1). And even though the proportion of its population who attends graduate school is small, because of its large population China graduates three times as many engineers from its colleges as does the United States.
In the past, the United States has relied on international students and scientific and engineering professionals to maintain its base of human resources in these fields. But global competition for S&E talent is intensifying, and enrolling higher percentages of US students in these programs would have many benefits.
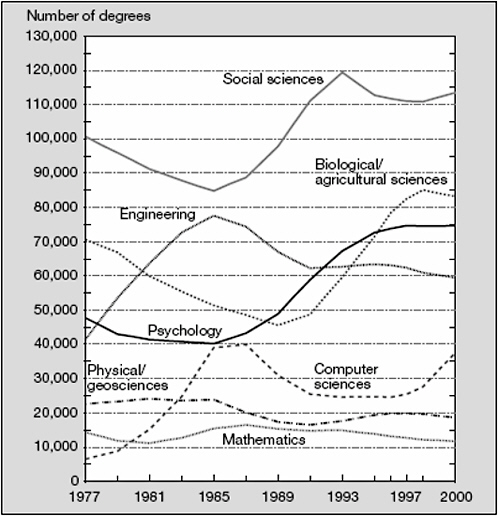
FIGURE HE-1 S&E bachelor’s degrees, by field: selected years, 1977-2000.
NOTE: Geosciences include earth, atmospheric, and ocean sciences.
SOURCE: National Science Board. Science and Engineering Indicators 2004. NSB 04-01. Arlington, VA: National Science Foundation, 2004. Figure 2-11.
To meet this goal, many believe that the United States will need to attract S&E students from all demographic groups. Today, Blacks, Hispanics, and other underrepresented minority groups are about a quarter of the US population but make up only 17.9% of the undergraduate population, 2.5% of the these majors, and 6% of the S&E workforce (see Table HE-1 and Figure HE-2). Only a quarter of this workforce consists of women, though women are almost half the total US workforce. By 2020, more than
TABLE HE-1 Ratio of Bachelor’s Degree to the 24-Year-Old Population, by Selected Fields, Sex, and Race/Ethnicity: 1990 and 2000
|
Sex and race/ethnicity |
Degree |
Degree |
||||||
|
All bachelor’s degrees |
All S&E |
NS&E |
Social/behavioral sciences |
24-year-old population |
Bachelor’s |
NS&Ea |
Social/behavioral science |
|
|
Number |
Ratio to 24-year-old populatiob |
|||||||
|
1990 total |
1,062,160 |
345,794 |
169,938 |
175,856 |
3,722,737 |
28.5 |
4.6 |
4.7 |
|
Male |
495,876 |
199,917 |
117,249 |
82,668 |
1,855,513 |
26.7 |
6.3 |
4.5 |
|
Female |
566,284 |
145,877 |
52,689 |
93,188 |
1,867,224 |
30.3 |
2.8 |
5.0 |
|
White |
856,686 |
270,225 |
127,704 |
142,521 |
2,628,439 |
32.6 |
4.9 |
5.4 |
|
Asian/Pacific Islander |
38,027 |
19,437 |
13,338 |
6,099 |
120,797 |
31.5 |
11.0 |
5.0 |
|
Underrepresented minority |
107,377 |
33,419 |
15,259 |
18,160 |
973,500 |
11.0 |
1.6 |
1.9 |
|
Black |
59,301 |
18,230 |
7,854 |
10,376 |
484,754 |
12.2 |
1.6 |
2.1 |
|
Hispanic |
43,864 |
13,918 |
6,868 |
7,050 |
459,073 |
9.6 |
1.5 |
1.5 |
|
American Indian/Alaskan Native |
4,212 |
1,271 |
537 |
734 |
29,674 |
14.2 |
1.8 |
2.5 |
|
2000 total |
1,253,121 |
398,622 |
210,434 |
188,188 |
3,703,200 |
33.8 |
5.7 |
5.1 |
|
Male |
536,158 |
197,669 |
128,111 |
69,558 |
1,886,400 |
28.4 |
6.8 |
3.7 |
|
Female |
716,963 |
200,953 |
82,323 |
118,630 |
1,816,800 |
39.5 |
4.5 |
6.5 |
|
White |
895,129 |
270,416 |
142,400 |
128,016 |
2,433,400 |
36.8 |
5.9 |
5.3 |
|
Asian/Pacific Islander |
75,265 |
12,368 |
23,185 |
12,368 |
148,800 |
50.6 |
15.6 |
8.3 |
|
Underrepresented minority |
200,967 |
63,519 |
27,939 |
35,559 |
1,121,000 |
17.9 |
2.5 |
3.2 |
|
Black |
104,212 |
32,924 |
13,795 |
19,129 |
527,600 |
19.8 |
2.6 |
3.6 |
|
Hispanic |
88,324 |
27,984 |
12,919 |
15,065 |
560,200 |
15.8 |
2.3 |
2.7 |
|
American Indian/Alaskan Native |
8,431 |
2,611 |
1,246 |
1,365 |
33,200 |
25.4 |
3.8 |
4.1 |
|
aNS&E degrees include natural (physical, biological, earth, atmospheric, and ocean sciences), agricultural, and computer sciences; mathematics, and engineering. bNumber of degrees per 100 24-year-olds. NOTE: NS&E = natural sciences and engineering. SOURCE: National Science Board. Science and Engineering Indicators 2004. NSB 04-01. Arlington, VA: National Science Foundation, 2004. Table 2-8. This table was based on US Department of Education, Completions Survey; National Science Foundation, Division of Science Resources Statistics, WebCASPAR database system, available at: http://caspar.nsf.gov/; and US Bureau of the Census, Population Division. |
||||||||
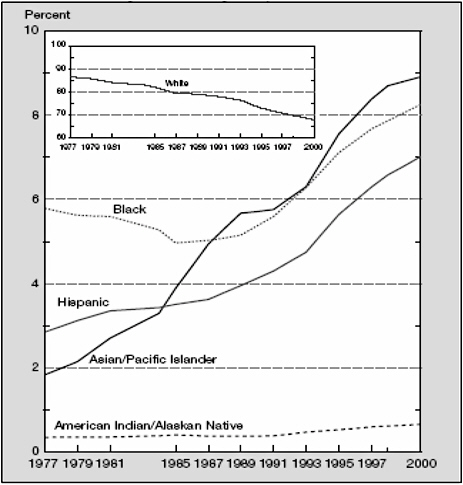
FIGURE HE-2 Minority share of S&E bachelor’s degrees, by race/ethnicity: selected years, 1977-2000.
SOURCE: National Science Board. Science and Engineering Indicators 2004. NSB 04-01. Arlington, VA: National Science Foundation, 2004. Figure 2-13.
40% of the US college-age population will be members of currently underrepresented minorities.
The federal government has a key role in establishing workforce policies that address national needs and opportunities. Given how many years of education and training are required for someone to become a scientist, engineer, or mathematician, policies may need to focus on long-term opportunities that may help to smooth short-term labor-market dynamics. Among the federal actions that organizations have recommended are the following:
Undergraduate Education
-
Provide incentives for all institutions of higher education to provide diverse internship opportunities for all undergraduates to study science, mathematics, engineering, and technology as early in their academic careers as possible.
-
Expand funding for programs at 2-year and 4-year colleges that succeed in attracting and retaining women and members of minority groups underrepresented in science, mathematics, and engineering.
Graduate Education
-
Establish education and traineeship grants to institutions focused on frontier research areas and multidisciplinary or innovation-oriented studies.
-
Require institutions applying for federal grants to report on the size, scope, and performance (student completion rates and career outcomes) of their graduate programs to determine whether these programs are meeting the interests of students in preparing them for diverse careers in academe, industry, government, and the nonprofit sector.
Postdoctoral Training
-
Develop federal policies and standards for postdoctoral fellows supported on federal research grants, including letters of appointment, performance evaluations, benefits and leave, and stipend support.
-
Help develop creative solutions to the problems faced by dual-career couples so that more US students opt to pursue research careers.
-
Create standards for and require the submission of demographic information on postdoctoral scholars supported on federal research grants by investigators awarded such grants. Collect data on postdoctoral working conditions, prospects, and careers.
The following discusses these issues in greater depth.
UNDERGRADUATE EDUCATION
The undergraduate years have a profound influence both on future professionals in science and mathematics and on broader public support of those fields. Undergraduate education acts as a springboard for students who choose to major in and then pursue graduate work in science and mathematics. Undergraduate institutions and community colleges train the technical support personnel who will keep our technological society functioning smoothly in the years ahead. And colleges and universities prepare
the elementary and secondary teachers who impart lifelong knowledge and attitudes about science and mathematics to their students. For many, the undergraduate years are the last opportunity for rigorous academic study of these subjects.
Precollege education needs to include quality instruction in standards-based classrooms and a clear awareness that achievement in science and mathematics will be expected for admission to college. In addition, faculty in these disciplines should assume greater responsibility for the pre-service and in-service education of K–12 teachers.
Many introductory undergraduate courses in science and mathematics fields have been taught to select out the best, most committed students and discard the rest. This strategy is being questioned: Are introductory courses the appropriate place and time for such filtering? Are the students being turned away any less good than those who stay? Evidence indicates that undergraduates who opt out of S&E programs are among the most highly qualified college entrants.2 Can the United States afford to turn away talented students interested in these fields?
Some argue more broadly that all college students should gain an awareness, understanding, and appreciation of the natural and human-constructed worlds and have at least one laboratory experience. Therefore, introductory science and mathematics courses must find ways to provide students both with a broad education in these fields and with the specific skills they need to continue studying these subjects, as is the case with most other introductory courses in colleges. Students who decide to pursue non-S&E majors would then have the background and education to make informed decisions about S&E in their personal lives and professional careers.
To serve these multiple objectives, many introductory and lower-level courses and programs would need to be designed to encourage students to continue, rather than end, their study of S&E subjects. Institutions should continually and systematically evaluate the efficacy of courses in these subjects for promoting student learning.
Many of these issues are also highly relevant to students who enter 2-year colleges after graduating from high school. For example, about a quarter of the students who earn bachelor’s degrees in engineering have taken a substantial number of their lower-level courses at a community college, and nearly half have taken at least one community college course.
As more students make community colleges their point of entry to post-secondary education, the quality of the S&E education they receive in 2-year institutions becomes increasingly important. Community college students need access to the kinds of lower-division courses that can prepare them for upper-division coursework in science, mathematics, and engineering, either at their own institutions or through partnerships between institutions, distance learning, or other means. Two-year colleges need to provide students with access to the kinds of equipment, laboratories, and other infrastructure they need to succeed.
The federal government can help promote these institutional changes through the following actions:
-
Provide incentives for all institutions of higher education to provide diverse internship opportunities for all undergraduates to study science, mathematics, engineering, and technology as early in their academic careers as possible.3 Introductory courses should be integral parts of the standard curriculum, and all colleges should routinely evaluate the success of these courses.
-
Encourage science, mathematics, and engineering departments to work with education departments and surrounding school districts to improve the preparation of K–12 students.
-
Expand funding for science, mathematics, and engineering programs at 2-year and 4-year colleges that succeed in attracting and retaining women and members of minority groups underrepresented in these programs.4
MASTER’S AND PROFESSIONAL EDUCATION
The baccalaureate has been the entry-level degree for many professional positions over the last century, but many employers in our increasingly complex economy now recognize the value of employees who have advanced training (see Figure HE-3). Master’s degree programs provide students with S&E knowledge that is more in-depth than that provided in baccalaureate programs and supplements this knowledge with skills that have application in business, government, and nonprofit settings. Master’s degree programs also can provide the interdisciplinary training necessary for real-world jobs and can be structured to provide job-relevant skills in teamwork, project management, business administration, communication, statistics, and informatics. Moreover, master’s programs have the potential
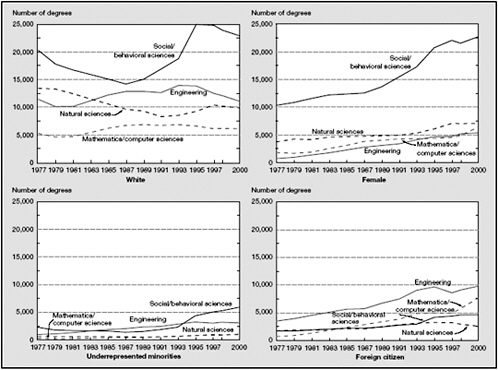
FIGURE HE-3 Master’s degree in S&E fields earned by selected groups, 1977-2000.
SOURCE: National Science Board. Science and Engineering Indicators 2004. NSB 04-01. Arlington, VA: National Science Foundation, 2004. Figure 2-17.
to attract greater numbers of women and minority-group members than do doctoral programs.
A number of reports since the mid-1990s have argued that master’s degree programs for students in S&E with appropriate career aspirations can develop a cadre of professionals who meet employer needs. These reports have called for changes in master’s education to make these programs more appropriate, cost effective, and attractive to students. In engineering, for example, the emphasis on increased skill in communications, business, the social sciences, cross-cultural studies, and important technologies has meant that the first professional degree should not be at the baccalaureate but at the master’s level, as is the case in business, law, and medicine.
Options for the federal government include the following:
-
Direct the National Science Foundation to fund professional science master’s programs at institutions that demonstrate innovative approaches
-
to orienting master’s-level degree programs toward scientific or technical skills needed in the US workforce.
GRADUATE EDUCATION
Graduate education in the United States is widely seen as the best in the world. America’s universities produce most of the scientists, engineers, and mathematicians who will maintain our preeminence in science and technology (see Figure HE-4). They educate the college faculty and K–12 teachers who will critically influence public support for scientific and technological endeavors And the intensive research experiences that are at the heart of graduate education at the doctoral level produce much of the new knowledge that drives scientific and technological progress.
Students from many nations travel to the United States to enroll in science, engineering, and mathematics graduate programs and to serve as postdoctoral fellows. For example, international students account for nearly half of all graduate enrollments in engineering and computer science. The presence of large numbers of international students in US graduate schools has both positive and negative consequences.5 These students enhance the intellectual and cultural environments of the programs in which they are enrolled. Many remain in the United States after their training is finished and contribute substantially to our scientific and technological enterprise. However, the large numbers of foreign students in US graduate schools may have the effect of discouraging US students from pursuing this educational pathway because the rapidly increasing number of students has diminished the relative rewards of becoming a scientist or engineer.6 US colleges and universities have an important role to play in encouraging more US students to pursue graduate education in science, engineering, and mathematics.
The federal government helps support graduate education through research assistantships funded through federal research project grants, fellowship and traineeship programs, and student loans (see Figure HE-5). The availability, level, and timing of this funding have implications for determining who can pursue a graduate education and how long it will take to complete that education. Also, the type of support—whether a research assistantship, teaching assistantship, traineeship, or fellowship—affects the content of graduate education and the kinds of skills one learns during graduate school.
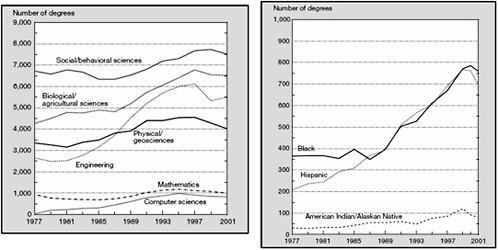
FIGURE HE-4 S&E doctoral degrees earned in US universities, by field and underrepresented minority S&E doctoral degrees, by race/ethnicity: selected years, 1977-2001.
SOURCE: National Science Board. Science and Engineering Indicators 2004. NSB 04-01. Arlington, VA: National Science Foundation, 2004. Figures 2-19 and 2-21.
In the 1990s, several events led to a national discussion of the content and process of doctoral education that continues today. In the late 1980s, labor-market forces pointed toward an impending shortage of PhDs in the arts and sciences in the early to mid-1990s. When the end of the Cold War, a national recession, state budget cuts, and the end of mandatory retirement for college faculty led instead to disappointing job prospects for new PhDs in the early 1990s, a national debate on the doctorate and the job prospects of PhD recipients ensued.
Also, in the 1990s, for the first time, more than half of PhDs in science and engineering reported that they held positions outside academe (see Figure HE-6). This trend has generated interest in providing graduate students with more information about their career options, including whether they should pursue a master’s or doctoral degree and whether they should seek opportunities in government, industry, or nonprofit organizations as well as academe. In turn, this trend has focused attention on the need for training that provides the practical career skills needed in the workplace: pedagogic skills, technological proficiency, the ability to communicate well in writing or oral presentations, experience working in teams, and facility in grant writing and project management.
One great problem in discussions of workforce issues is the paucity of reliable, representative, and timely data. Often policy-makers are making decisions about the future based on data that are 2-3 years old.
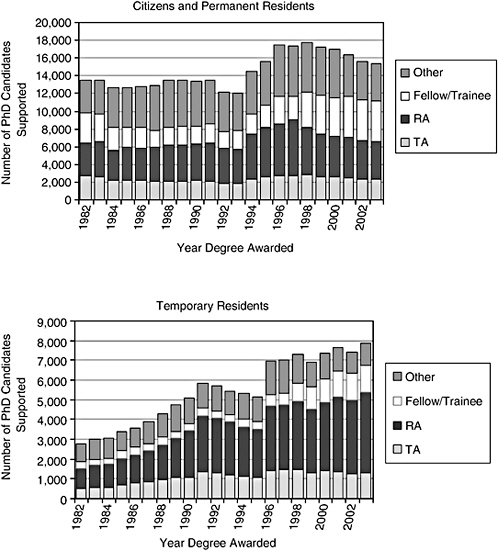
FIGURE HE-5 Number of PhD candidates supported, by support mechanism and citizenship status, 1982-2003.
NOTES: Other: Support from the student’s or scholar’s institution of higher education, state and local government, foreign sources, nonprofit institutions, or private industry; traineeships: educational awards given to students selected by the institution or by a federal agency; research assistantships: support for students whose assigned duties are primarily in research; teaching assistantships: support for students whose assigned duties are primarily in teaching.
SOURCE: National Science Foundation. Survey of Earned Doctorates 2003. Arlington, VA: National Science Foundation, 2004.
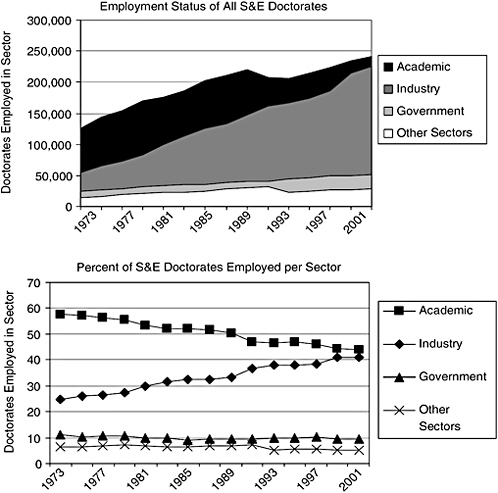
FIGURE HE-6 Number and percent of employment status of S&E doctorates, by sector, 1973-2001.
SOURCE: National Science Foundation. Survey of Doctoral Recipients 2003. Arlington, VA: National Science Foundation, 2005.
Options for the federal government include these:
-
Establish education and traineeship grants to institutions focused on frontier research areas and multidisciplinary or innovation-oriented studies.7
-
Eliminate the employer-employee stipulation in Office of Management Budget Circular A-21 to encourage the dual benefits to research and education of having graduate students serve as research assistants.8
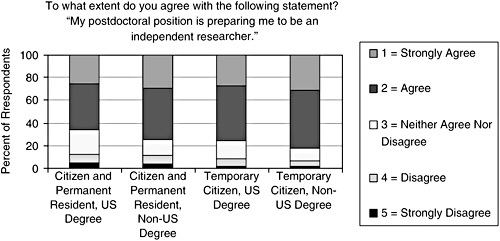
FIGURE HE-7 Response to postdoctoral survey question on preparation for independent research, by citizenship status and country of degree.
NOTE: 22,178 postdoctoral scholars at 46 institutions were contacted, including 18 of the 20 largest academic employers of postdoctoral scholars and National Institutes of Health. Postdoctoral status was confirmed by the institution. 8,392 (38%) responded; 6,775 (31%) of the respondents completed the entire survey, which included over 100 questions.
SOURCE: G. Davis. “Doctors Without Orders: Highlights of the Sigma Xi Postdoc Survey.” American Scientist 93(3, supplement)(May-June 2005). Available at: http://postdoc.sigmaxi.org/results/.
-
Require institutions applying for federal grants to report on the size, scope, and performance (student completion rates and career outcomes) of their graduate programs to determine whether these programs are meeting the interests of students in preparing them for diverse careers in academe, industry, government, and the nonprofit sector.9
-
Provide graduate student stipends competitive with opportunities in other venues.10
-
Direct the National Science Foundation to expand its data collection on S&E careers and its research into national and international workforce dynamics.11
Postdoctoral Training
For more than 2 decades, an increasing percentage of new PhD recipients have been pursuing postdoctoral study instead of employment after graduation. These experiences broaden and deepen the research and other skills that scientists and other highly trained professionals need to make major contributions to society (see Figure HE-7). Most postdoctoral schol-
ars are funded by federal research grants (see Figure HE-8) and on average have stipends of under $35,000 per year.
However, mentors, institutions, and funding organizations have sometimes been slow to give postdoctoral fellows the status, recognition, and
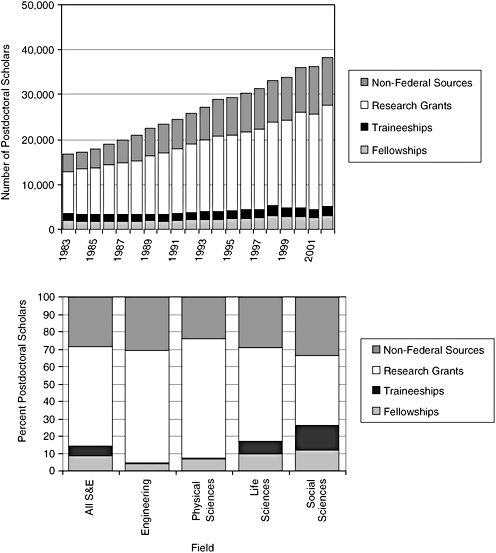
FIGURE HE-8 Number and percent of postdoctoral scholars, by funding mechanism and field, 1983-2002.
NOTE: Non-federal support: support may be from the institution of higher education, state, and local government, foreign sources, nonprofit institutions, or private industry; research grants: support from federal agencies to a principal investigator, under whom postdoctoral scholars work; traineeships: educational awards given to scholars selected by the institution or by a federal agency; fellowships: competitive awards given directly to scholars for financial support of their graduate or postdoctoral studies.
SOURCE: National Science Foundation. Survey of Earned Doctorates 2002. Arlington, VA: National Science Foundation, 2004.
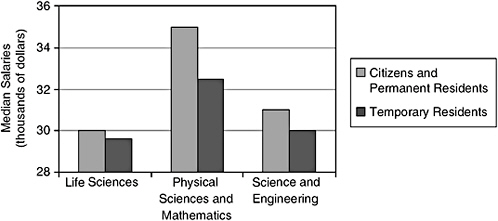
FIGURE HE-9 Median postdoctoral stipend, by field and citizenship status, 2001.
SOURCE: National Science Foundation. Survey of Earned Doctorates 2002. Arlington, VA: National Science Foundation, 2004.
compensation that are commensurate with their skills and contributions to research (see Figure HE-9). Many postdoctoral scholars make substantial economic and familial sacrifices to pursue advanced training, yet they often do not have clearly defined rights, responsibilities, pay scales, access to benefits, or procedures for consideration of grievances.
To ensure a healthy research enterprise, the postdoctoral experience needs to be improved. The federal government should:
-
Develop federal policies and standards for postdoctoral fellows supported on federal research grants, including letters of appointment, performance evaluations, benefits and leave, and stipend support. All postdoctoral scholars should have access to health insurance and to institutional services.12
-
Help develop creative solutions to the problems faced by dual-career couples so that more US students opt to pursue research careers.
-
Improve the quality and quantity of the data on postdoctoral working conditions, prospects, and careers.13 Create standards for and require the submission of demographic information on postdoctoral scholars supported on federal research grants by investigators awarded such grants.


