
3
How Is America Doing Now in Science and Technology?
By most available criteria, the United States is still the undisputed leader in the performance of basic and applied research (see Box 3-1). In addition, many international comparisons put the United States as a leader in applying research and innovation to improve economic performance. In the latest IMD International World Competitiveness Yearbook, the United States ranks first in economic competitiveness, followed by Hong Kong and Singapore.1 The survey compares economic performance, government efficiency, business efficiency, and infrastructure. Larger economies are further behind, with Zhejiang (China’s wealthiest province), Japan, the United Kingdom, and Germany ranked 20 though 23, respectively.2 An extensive review by the Organisation for Economic Co-operation and Development (OECD) concludes that since World War II, US leadership in science and engineering has driven its dominant strategic position, economic advantages, and quality of life.3
|
1 |
IMD International. World Competitiveness Yearbook. 2005. Lausanne, Switzerland: IMD International, 2005. The United States leads the world (with a score of 100), followed in order by Hong Kong (93), Singapore, Iceland, Canada, Finland, Denmark, Switzerland, Australia, and Luxembourg (80). |
|
2 |
Mainland China ranks 31st. |
|
3 |
Organization for Economic Co-operation and Development. “Science, Technology and Industry Scoreboard, 2003, R&D Database.” Available at: http://www1.oecd.org/publications/e-book/92-2003-04-1-7294/. The scoreboard uses four indicators in its ranking: the creation and diffusion of knowledge; the information economy; the global integration of economic activity; and productivity and economic structure. In the United States, investment in knowledge—the sum of investment in research and development (R&D), software, and higher education—amounted to almost 7% of GDP in 2000, well above the share for the European Union or Japan. |
|
BOX 3-1 Pasteur’s Quadrant The writers of this report, like many others, faced a semantic question in the discussions of different kinds of research. Basic research, presumably pursued for the sake of fundamental understanding but without thought of use, generally is distinguished from applied research, which is pursued to convert basic understanding into practical use. This view, called the “linear model” is shown here:  But that classification quickly breaks down in the real world because “basic” discoveries often emerge from “applied” or even “developmental” activities. In his 1997 book, Pasteur’s Quadrant,a Donald Stokes responded to that complexity with a more nuanced classification that describes research according to intention. He distinguishes four types:
In Stokes’s argument, research is better depicted as a box than as a line: 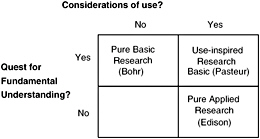 In contrast to the basic–applied dichotomy, Stokes’s taxonomy explicitly recognizes research that is simultaneously inspired by a use but that also seeks fundamental knowledge, which he calls “Pasteur’s Quadrant.” |
Researchers in the United States lead the world in the volume of articles published and in the frequency with which those papers are cited by others.4 US-based authors were listed on one-third of all scientific articles worldwide in 2001.5 Those publication data are significant because they reflect original research productivity and because the professional reputations, job prospects, and career advancement of researchers depend on their ability to publish significant findings in the open peer-reviewed literature.
The United States also excels in higher education and training. A recent comparison concluded that 38 of the world’s 50 leading research institutions—those that draw the greatest interest of science and technology students—are in the United States.6 Since World War II, the United States has been the destination of choice for science and engineering graduate students and for postdoctoral scholars choosing to study abroad. Our nation—about 6% percent of the world’s population—has for decades produced more than 20% of the world’s doctorates in science and engineering.7
Because of globalization in the fields of science and engineering, however, it is difficult to compare research leadership among countries. Research teams commonly include members from several nations, and industries have dispersed many activities, including research, across the globe.
SCIENCE AND ENGINEERING ADVANTAGE
The strength of science and engineering in the United States rests on many advantages: the diversity, quality, and stability of its research and teaching institutions; the strong tradition of public and private investment in research and advanced education; the quality of academic personnel; the prevalence of English as the language of science and engineering; the availability of venture capital; a relatively open society in which talented people of any background or nationality have opportunities to succeed; the US custom, unmatched in other countries, of providing positions for postdoctoral scholars;8 and the strength of the US peer-review and free-
|
4 |
D. A. King. “The Scientific Impact of Nations.” Nature 430(6997)(July 15, 2004):311-316. |
|
5 |
National Science Board. Science and Engineering Indicators 2004. NSB 04-01. Arlington, VA: National Science Foundation, 2004. Chapter 5. |
|
6 |
Shanghai’s Jiao Tong University Institute of Higher Education. “Academic Ranking of World Universities.” 2004. Available at: http://ed.sjtu.edu.cn/rank/2004/2004Main.htm. The ranking emphasizes prizes, publications, and citations attributed to faculty and staff, as well as the size of institutions. The Times Higher Education Supplement citation has provided similar results in comparing universities worldwide. |
|
7 |
National Science Board. Science and Engineering Indicators 2004. NSB 04-01. Arlington, VA: National Science Foundation, 2004. P. 2-36. |
|
8 |
The National Academies. Policy Implications of International Graduate Students and Postdoctoral Scholars. Washington, DC: The National Academies Press, 2005. P. 81. |
enterprise systems in weeding out noncompetitive academic and business pursuits.
In addition to such tangible advantages, US leadership might also be attributed to many favorable public policy priorities: research activities funded by public and private sources that have led to new industries, products, and jobs; an economic climate that encourages investment in technology-based companies; an outward-looking international economic policy; and support for lifelong learning.9
However, things are changing, as noted in Innovate America, a 2004 report from the Council on Competitiveness:10
-
Innovation is diffusing at an ever-increasing rate. It took 55 years for automobile use to spread to a quarter of the US population, 35 years for the telephone, 22 years for the radio, 16 years for the personal computer, 13 years for the cell phone, and just 7 years for the World Wide Web once the Internet had matured (through technology and policy developments) to the point of takeoff.
-
Innovation is increasingly multidisciplinary and technologically complex, arising from the intersection of different fields and spheres of activity.
-
Innovation is collaborative. It requires active cooperation and communication among scientists and engineers and between creators and users.
-
Innovation is creative. Workers and consumers demand ever more new ideas, technologies, and content.
-
Innovation is global. Advances come from centers of excellence around the world and are prompted by the demands of billions of customers.
Central to the strength of US innovation is our tradition of public funding for science and engineering research. Graduate education in the United States is supported mainly by federal grants from the National Science Foundation (NSF) and the National Institutes of Health (NIH) to faculty researchers, buttressed by a smaller volume of federally funded fellowships. One study reported that 73% of applicants for US patents said that publicly funded research formed part or all of the foundation for their innovations.11 Much of the nation’s research in engineering and the physical sciences is performed in federal laboratories, part of whose mission is to assist the commercialization of new technology.
OTHER NATIONS ARE FOLLOWING OUR LEAD—AND CATCHING UP12
It is no surprise that as the value of research becomes more widely understood, other nations are strengthening their own programs and institutions. If imitation is flattery, we can take pride in watching as other nations eagerly adopt major components of the US innovation model.13 Their strategies include the willingness to increase public support for research universities, to enhance protections for intellectual property rights, to promote venture capital activity, to fund incubation centers for new businesses, and to expand opportunities for innovative small companies.14
Many nations have made research a high priority. To position the European Union (EU) as the most competitive knowledge-based economy in the world and enhance its attractiveness to researchers worldwide, EU leaders are urging that, by 2010, member nations spend 3% of gross domestic product (GDP) on research and development (R&D).15 In 2000, R&D as a percentage of GDP was 2.72 in the United States, 2.98 in Japan, 2.49 in Germany, 2.18 in France, and 1.85 in the United Kingdom.16
Many nations also are investing more aggressively in higher education and increasing their public investments in R&D (Figure 3-1). Those investments are stimulating growth in the number of research universities in those countries; the number of researchers; the number of papers listed in the Science Citation Index; the number of patents awarded; and the number of doctoral degrees granted (Table 3-1, Figures 3-2, 3-3, 3-4).17
China is emulating the US system as well. The Chinese Science Foundation is modeled after our National Science Foundation, and peer review methodology and startup packages for junior faculty are patterned on US practices. In China, national spending in the past few years for all R&D activities rose 500%, from $14 billion in 1991 to $65 billion in 2002. US
|
12 |
For another point of view, see Box 3-2. |
|
13 |
Council on Competitiveness. Innovate America. Washington, DC: Council on Competitiveness, 2004. P. 6. |
|
14 |
K. H. Hughes. “Facing the Global Competitiveness Challenge.” Issues in Science and Technology 21(4)(Summer 2005):72-78. See also M. Enserink. “France Hatches 67 California Wannabes.” Science 309(2005):547. |
|
15 |
R. M. May. “Raising Europe’s Game.” Nature 430(2004):831; P. Busquin. “Investing in People.” Science 303(2004):145. |
|
16 |
National Science Board. Science and Engineering Indicators 2004. NSB 04-01. Arlington, VA: National Science Foundation, 2004. Appendix Table 4-43. |
|
17 |
D. Hicks. 2004. “Asian Countries Strengthen Their Research.” Issues in Science and Technology 20(4)(Summer 2004):75-78. The author notes that the number of doctoral degrees awarded in China has increased 50-fold since 1986. |
|
BOX 3-2 Another Point of View: US Competitiveness “Americans are having another Sputnik moment,” writes Robert J. Samuelson, “one of those periodic alarms about some foreign technological and economic menace. It was the Soviets in the 1950s and early 1960s, the Germans and Japanese in the 1970s and 1980s, and now it’s the Chinese and Indians.”a Sputnik moments come when the nation worries about its scientific and technological superiority and its ability to compete globally. And, according to Samuelson, the nation tends to be overly concerned. Sputnik led to the theory of a “missile gap that turned out to be a myth. The competitiveness crisis of the 1980s suggested that Japan would surge ahead of us because they were better savers, innovators, workers, and managers. But in 2004, per capita US income averaged $38,324 compared to $26,937 for Germany and $29,193 for Japan.” Similarly, Samuelson argues that our current fears are unfounded, another “illusion” in which “a few selective happenings” are transformed into a “full blown theory of economic inferiority or superiority.” He argues that low wages and rising skills in China and India could cost us some jobs, but that US gains and losses in response to the rising economic power of those countries will tend to balance out. Samuelson indicates that he believes “the apparent American deficit in scientists and engineers is also exaggerated.” He notes that only about one-third of our science and engineering graduates work in science and engineering occupations and that if there were a shortage, salaries for those jobs would increase and scientists and engineers would return to them. Of greater importance, Samuelson concludes, is that the United States must continue to draw on the strengths that overcome its weaknesses: “ambitiousness; openness to change (even unpleasant change); competition; hard work; and a willingness to take and reward risk.” |
R&D spending increased 140%, from $177 billion to $245 billion, in the same period.18
The rapid rise of South Korea as a major science and engineering power has been fueled by the establishment of the Korea Science Founda-
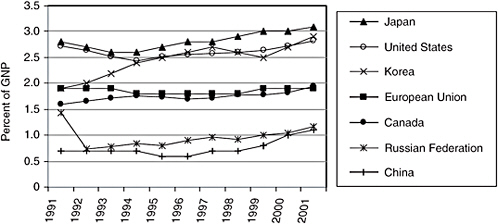
FIGURE 3-1 R&D expenditures as a percentage of GNP, 1991-2002. These expenditures are beginning to rise worldwide.
SOURCE: Organisation for Economic Co-operation and Development. Main Science and Engineering Indicators. Paris: OECD, 2005.
TABLE 3-1 Publications and Citations in the United States and European Union per Capita and per University Researcher, 1997-2001
|
|
United States |
European Union |
|
|
Publications |
1,265,608 |
1,347,985 |
|
|
|
Publications/population |
4.64 |
3.60 |
|
|
Publications/researcher |
6.80 |
4.30 |
|
|
Researchers/population |
0.68 |
0.84 |
|
Citations |
10,850,549 |
8,628,152 |
|
|
|
Citations/population |
39.75 |
23.03 |
|
|
Citations/researcher |
58.33 |
27.52 |
|
Top 1% publications |
23,723 |
14,099 |
|
|
|
Top 1% publications/population |
0.09 |
0.04 |
|
|
Top 1% publications/researcher |
0.13 |
0.04 |
|
NOTES: Number of publications, citations, and top 1% publications refer to 1997-2001. Population (measured in thousands) and number of university researchers (measured in full-time equivalents) refer to 1999. Each cited paper is allocated once to every author. European Union totals are adjusted to account for duplications by removing papers with multiple EU national authorship to give an accurate net total. SOURCE: G. Dosi, P. Llerena, and M. S. Labini. “Evaluating and Comparing the Innovation Performance of the United States and the European Union.” Expert report prepared for the Trend Chart Policy Workshop. June 29, 2005. Available at: http://trendchart.cordis.lu/scoreboards/scoreboard2005/pdf/EIS%202005%20EU%20versus%20US.pdf. |
|||
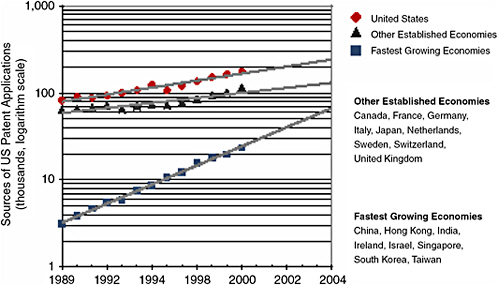
FIGURE 3-2 US patent applications, by country of applicant, 1989-2004.
SOURCE: Task Force on the Future of American Innovation based on data from National Science Foundation. Science and Engineering Indicators 2004. Arlington, VA: APS Office and Public Affairs, 2004.
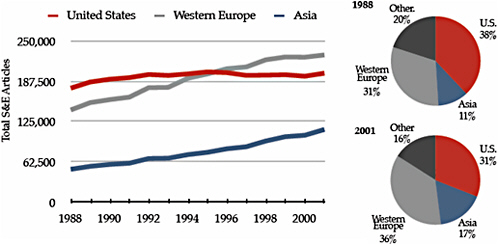
FIGURE 3-3 Total science and engineering articles with international coauthors, 1988-2001.
NOTE: Internationally coauthored articles were counted more than once so each country represented on the author list was included. So if an article was written by authors from the United States and Switzerland, it would be included in the count for both countries.
SOURCES: Task Force on the Future of American Innovation based on data from National Science Foundation. Science and Engineering Indicators 2004. Arlington, VA: APS Office and Public Affairs, 2004.
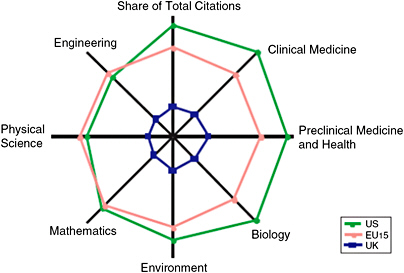
FIGURE 3-4 Disciplinary strengths in the United States, the 15 European Union nations in the comparator group (EU15), and the United Kingdom.
NOTE: The distance from the origin to the data point is proportional to citation share.
SOURCE: D. A. King. “The Scientific Impact of Nations.” Nature 430(2004):311-316. Data are from citations in ISI Thompson.
tion—funded primarily by the national sports lottery—to enhance public understanding, knowledge, and acceptance of science and engineering throughout the nation.19 Similarly, the government uses contests and prizes specifically to stimulate the scientific enterprise and public appreciation of scientific knowledge.
Other nations also are spending more on higher education and providing incentives for students to study science and engineering. To attract the best graduate students from around the world, universities in Japan, Switzerland, and elsewhere are offering science and engineering courses in English. In the 1990s, both China and Japan increased the number of students pursuing science and engineering degrees, and there was steady growth in South Korea.20
Some consequences of this new global science and engineering activity are already apparent—not only in manufacturing but also in services. India’s software services exports rose from essentially zero in 1993 to about $10 billion in 2002.21 In broader terms, the US share of global
|
19 |
Korean Ministry of Science and Engineering (MOST). Available at: http://www.most.go.kr/most/english/link_2.jsp. |
|
20 |
National Science Board. Science and Engineering Indicators 2004. NSB 04-01. Arlington, VA: National Science Foundation, 2004. P. 2-35. |
|
21 |
S. S. Athreye. “The Indian Software Industry.” Carnegie Mellon Software Industry Center Working Paper 03-04. Pittsburgh, PA: Carnegie Mellon University, October 2003. |
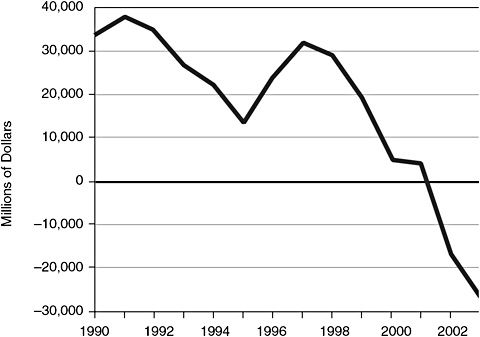
FIGURE 3-5 United States trade balance for high-technology products, in millions of dollars, 1990-2003.
SOURCE: Task Force on the Future of American Innovation based on data from US Census Bureau Foreign Trade Statistics, U.S. International Trade in Goods and Services. Compiled by the American Psychological Society Office of Public Affairs.
exports has fallen in the past 20 years from 30 to 17%, while the share for emerging countries in Asia grew from 7 to 27%.22 The United States now has a negative trade balance even for high-technology products (Figure 3-5). That deficit raises concern about our competitive ability in important areas of technology.23
Although US scientists and engineers still lead the world in publishing results, new trends emerge from close examination of the data. From 1988 to 2001, world publishing in science and engineering increased by almost 40%,24 but most of that increase came from Western Europe, Japan, and several emerging East Asian nations (South Korea, China, Singapore, and Taiwan). US publication in science and engineering has remained essen-
|
22 |
For 2004, the dollar value of high-technology imports was $560 billion; the value of high-technology exports was $511 billion. |
|
23 |
D. R. Francis. “U.S. Runs a High-Tech Trade Gap.” Christian Science Monitor 96(131) (June 2, 2004):1-1. |
|
24 |
National Science Board. Science and Engineering Indicators 2004. NSB 04-01. Arlington, VA: National Science Foundation, 2004. Chapter 5. |
tially constant since 1992.25 Since 1997, researchers in the 15 EU countries have published more papers than have their US counterparts, and the gap in citations between the United States and other countries has narrowed steadily.26 The global increase in the production of scientific knowledge eventually benefits all countries. Yet trends in publication could be a troubling bellwether about our competitive position in the global science community.
INTERNATIONAL COMPETITION FOR TALENT
The graduate education of our scientists and engineers largely follows an apprenticeship model. Graduate students and postdoctoral scholars gain direct experience under the guidance of veteran researchers. The important link between graduate education and research that has been forged through a combination of research assistantships, fellowships, and traineeships has been tremendously beneficial to students and researchers and is a critical component of our success in the last half-century.
One measure of other nations’ successful adaptation of the US model is doctoral production, which increased rapidly around the world but most notably in China and South Korea (Figure 3-6). In South Korea, doctorate production rose from 128 in 1975 to 2,865 in 2001. In China, doctorate production was essentially zero until 1985, but 15 years later, 7,304 doctorates were conferred. In 1975, the United States conferred 59% of the world’s doctoral degrees in science and engineering; by 2001, our share had fallen to 41%. China’s 2001 portion was 12%.27
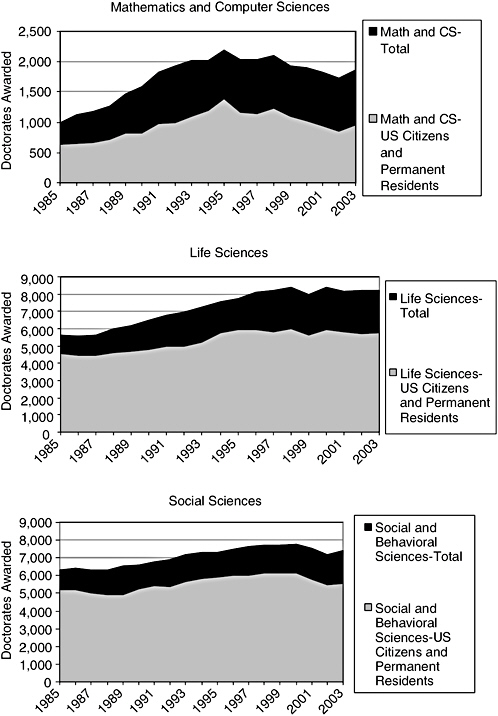
Another challenge for US research institutions is to attract the overseas students on whose talents the nation depends. The US research enterprise, especially at the graduate and postdoctoral levels, has benefited from the work of foreign visitors and immigrants. They came first from Europe, fleeing fascism, and more recently they have come from China, India, and the former Soviet Union, seeking better education and more economic opportunity. International students account for nearly half the US doctorates awarded in engineering and computer science28 (Figure 3-7). Similarly, more than 35% of US engineering and computer science university faculty are foreign-born.29 According to US Census data from 2000,
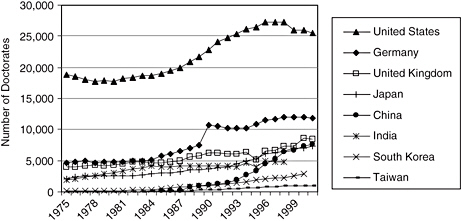
FIGURE 3-6 Science and engineering doctorate production for selected countries, 1975-2001. US doctorate production in science and engineering is decreasing; European Union and Asian production are rising but are still well below US levels.
SOURCE: Based on National Science Board. Science and Engineering Indicators 2004. NSB 04-01. Arlington, VA: National Science Foundation, 2004. Appendix Tables 2-38 and 2-39.
the proportion of doctoral-level employees in the science and engineering research labor force is about equivalent to the percentage of doctorates produced by US universities.
Many nations are seeking to reap the benefits of advanced education, including strong positive effects on GDP growth. They are working harder to attract international students and to encourage the movement of skilled personnel into their countries.30
-
China implemented an “opening-up” policy in 1978 and began to send large numbers of students and scholars abroad to gain the skills they need to bolster that country’s economic and social development.
-
India liberalized its economy in 1991 and started encouraging students to go abroad for advanced education and training. Since 2001, the Indian government has been providing money ($5 billion in fiscal year 2005) for “soft loans,” which require no collateral, to students who wish to travel abroad for their education. In 2002, India surpassed China as the largest exporter of graduate students to the United States.31
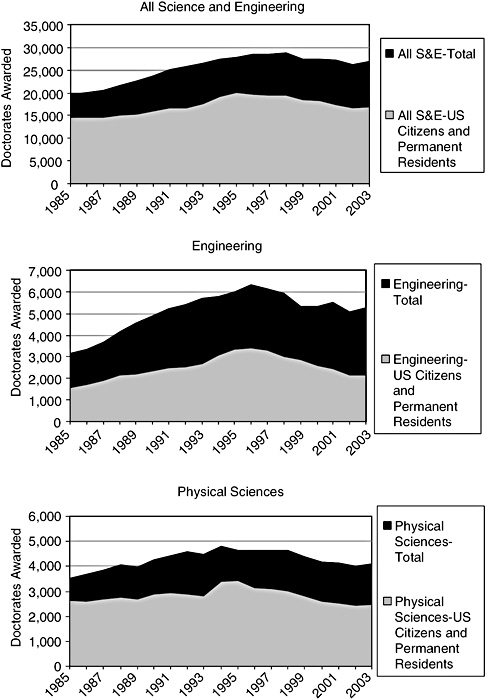
FIGURE 3-7 Doctorates awarded by US institutions, by field and citizenship status, 1985-2003. US citizens and permanent residents earn about 62% of the doctorates in all fields of science and engineering (S&E), about 60% in the physical sciences, and 41% of those awarded in engineering and the combined fields of mathematics and computer sciences (CS).
SOURCE: National Science Foundation. Survey of Earned Graduates. Arlington, VA: National Science Foundation, 2005.
-
The United Kingdom’s points-based Highly Skilled Migrant Programme, which began in the mid-1990s, has increased the number of work permits issued to skilled workers.
-
The Irish government permits relatively easy immigration of skilled workers in information technology and biotechnology through intra-company transfers from non-Irish to Irish locations.
-
Several EU countries and the EU itself have programs that facilitate networking among students and researchers working abroad, providing contact information, collaborative possibilities, and funding and job opportunities in the EU. The German Academic Exchange Service has launched GAIN (German Academic International Network); the Italian Ministry of Foreign Affairs has launched DAVINCI, an Internet database that tracks the work of Italian researchers overseas; and the EU has its Researcher’s Mobility Portal.
-
Nigeria and other oil-producing nations use petroleum profits to support the overseas education of thousands of students.
In addition to sending students abroad for training, emerging economic powers, notably India and China, have lured their skilled scientists and engineers to return home by coupling education-abroad programs with strategic investments in the science and engineering infrastructure—in essence sending students away to gain skills and providing jobs to draw them back.32
The global competition for talent was already under way when the events of September 11, 2001, disrupted US travel and immigration plans of many international graduate students, postdoctoral researchers, and visiting scholars. The intervening years have seen security-related changes in federal visa and immigration policy that, although intended to restrict the illegal movements of only a few, have had a wider effect on many foreign-born graduate students and postdoctoral scholars who either were already in the United States or were contemplating studying here. Many potential visitors who in the past might have found the United States welcoming them for scientific meetings and sabbaticals now look elsewhere or stay home.33 Much of this is to our detriment: Hosting international meetings and visiting researchers is essential to staying at the forefront of international science.
The flow of graduate students and postdoctoral researchers is unlikely to be curtailed permanently, at least as long as the world sees the United
|
32 |
R. A. Mashelkar. “India’s R&D: Reaching for the Top.” Science 307(2005):1415-1417; L. Auriol. “Why Do We Need Indicators on Careers of Doctorate Holders?” Workshop on User Needs for Indicators on Careers of Doctorate Holders. OECD: Paris, September 27, 2004. Available at: http://www.olis.oecd.org/olis/2004doc.nsf. |
|
33 |
The National Academies. Policy Implications of International Graduate Students and Postdoctoral Scholars. Washington, DC: The National Academies Press, 2005. P. 61. |
TABLE 3-2 Change in Applications, Admissions, and Enrollment of International Graduate Students, 2003-2005
States as the best place for science and engineering education, training, and technology-based employment (Table 3-2). If that perception shifts, and if international students find equally attractive educational and professional opportunities in other countries, including their own, the difficulty of visiting the United States could gain decisive importance.34
STRAINS ON RESEARCH IN THE PRIVATE SECTOR
A large fraction of all those with doctorates in science and engineering in the United States—more than half in some fields—find employment in industry (Figure 3-8). There they make major contributions to innovation and economic growth. US industry has traditionally excelled at innovation and at capitalizing on the results of research.35 For decades after World War II, corporate central research laboratories paid off in fledgling technologies that grew into products or techniques of profound consequence. Researchers at Bell Laboratories pursued lines of groundbreaking research that resulted in the transistor and the laser, which revolutionized the electronics industry and led to several Nobel prizes.36
|
34 |
Ibid., p. 79. |
|
35 |
S. W. Popper and C. S. Wagner. New Foundations for Growth: The US Innovation System Today and Tomorrow. Arlington, VA: RAND, January 2002. The authors note the following advantages of industry: rapid responses, flexibility and adaptability, efficiency, fast entry and exit, smooth capital flows, and mobility. |
|
36 |
US Congress House of Representatives Committee on Science. Unlocking Our Future: Toward a New National Science Policy (“the Ehlers Report”). Washington, DC: US Congress, 1998. P. 38. Available at: http://www.house.gov/science/science_policy_report.htm. |
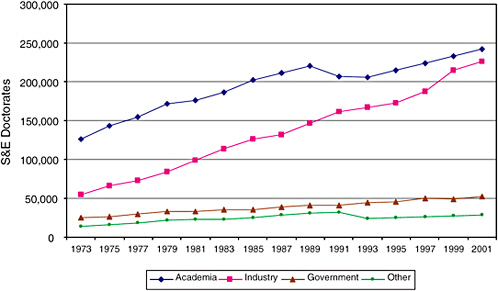
FIGURE 3-8 US S&E doctorates, by employment sector, 1973-2001. The majority of people with science and engineering doctorates obtain nonacademic jobs. About equal numbers work in academic and industrial settings, and about 15% work in government or other sectors.
SOURCE: National Science Foundation. Survey of Doctoral Recipients. Arlington, VA: National Science Foundation, 2004.
Although industry-funded R&D has increased steadily overall (Figure 3-9A), that new money has gone overwhelmingly to activities that are near-term and incremental rather than to long-term or discovery-oriented research, and R&D as a share of gross domestic product has declined (Figure 3-9B). Several explanations are offered for industry’s turn away from fundamental research. First, the Bell Laboratories model was supported by funding from a monopoly that now is dismantled and no longer relevant to the organization of science and engineering research in the United States. Second, Wall Street analysts increasingly focus on quarterly financial results and assign little value to long-term (and therefore risky) research investments or to social returns. Third, companies cannot always fully capture a return that justifies long-term research with results that often spill over to other researchers, sometimes including those of competitors. Fourth, private-sector research is more fragmented across national boundaries in the era of globalization. Capital follows opportunity with little attention to geopolitical borders—this may lead more multinational companies to pursue opportunities outside the United States.
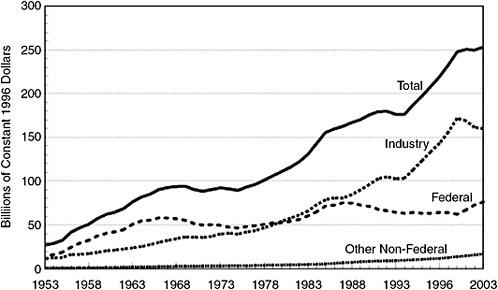
FIGURE 3-9A US R&D funding, by source of funds, 1953-2003.
SOURCE: NSF Division of Science Resources Statistics. National Patterns of Research Development Resources, annual series. Appendix Tables B-2 and B-22. Available at: http://www.nsf.gov/statistics/nsf05308/secta.htm.
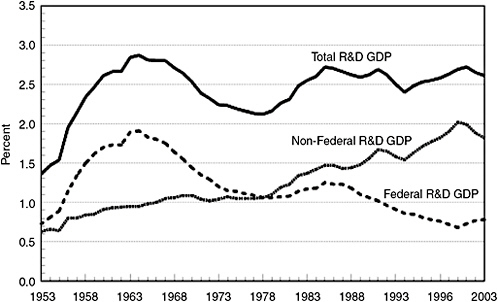
FIGURE 3-9B R&D shares of US gross domestic product, 1953-2003.
SOURCE: NSF Division of Science Resources Statistics. National Patterns of Research Development Resources, annual series. Appendix Table B-9. Available at: http://www.nsf.gov/statistics/nsf05308/sectd.htm.
The National Science Board37 has made the following observations:
-
Two-thirds of the R&D performed overseas in 2000 by US-owned companies ($13.2 billion of $19.8 billion) was conducted in six countries: the United Kingdom, Germany, Canada, Japan, France, and Sweden. At the same time, emerging markets—such as those in Singapore, Israel, Ireland, and China—were increasingly attracting R&D activities by subsidiaries of US companies. In 2000, each of those emerging markets reached US-owned R&D expenditures of $500 million or more, considerably more than in 1994.
-
Three manufacturing sectors dominated overseas R&D activity by US-owned companies: transportation equipment, computer and electronic products, and chemicals and pharmaceuticals. The same industries accounted for most foreign-owned R&D in the United States, implying a high degree of R&D globalization in those industries.
As some large companies reduce their investment in basic research, smaller research-based enterprises often assume risk as the only way to break into a competitive market. Those startup companies commonly rely on the initial capital provided by their investors to finance early research, coupled with the granting of potential future financial gains in the form of stock options to compensate employees. If the money runs out, they can seldom interest venture capital firms until they have grown considerably larger. Many of those companies thus expire before reaching commercialization.38
The overall amount of venture capital invested also has collapsed since the stock market decline of 2000, sinking in 2002 to one-fifth the amount invested in 200039 (Figure 3-10). Venture capital investments in US companies have since stabilized at around $20 billion in 2003 and 2004,40 just one-fifth of their 2000 peak but well above 1998 funding. Led by a resurgence in late-stage financing, total venture capital investment rose 10.5% to $20.9 billion in 2004, according to the MoneyTree Survey by Pricewater-houseCoopers, Thomson Venture Economics, and the National Venture
|
37 |
National Science Board. Science and Engineering Indicators 2004. NSB 04-01. Arlington, VA: National Science Foundation, 2004. P. 4-65. |
|
38 |
National Research Council. Board on Science, Technology, and Economic Policy. The Small Business Innovation Research Program: An Assessment of the Department of Defense Fast Track Initiative. Washington, DC: National Academy Press, 2000. Available at: http://books.nap.edu/catalog/9985.html; US Congress House of Representatives Committee on Science. Unlocking Our Future: Toward a New National Science Policy (the “Ehlers Report”). Washington, DC: US Congress, 1998. P. 39. |
|
39 |
National Science Board. Science and Engineering Indicators 2004. NSB 04-01. Arlington, VA: National Science Foundation, 2004. Appendix Table 6-15. |
|
40 |
National Venture Capital Association. Available at: http://www.nvca.org/ffax.html. |
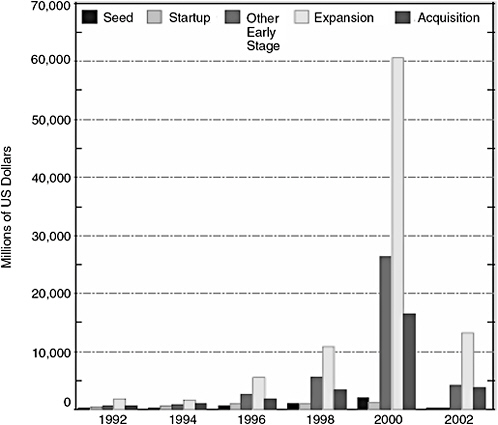
FIGURE 3-10 US venture capital disbursements, by stage of financing, 1992-2002. Venture capital funding is returning to pre-2000 levels.
SOURCES: Thompson Venture Economics, special tabulations, June 2003. See National Science Board. Science and Engineering Indicators 2004. NSB 04-01. Arlington, VA: National Science Foundation, 2004. Appendix Table 6-16.
Capital Association (NVCA).41 With stock values rising, the climate for initial public offerings and acquisitions has improved, attracting capital from investors considering exit opportunities.
Another positive sign is a recent increase in capital raised by venture funds, suggesting an improving attitude toward risk taking. According to NVCA and Thomson Venture Economics,42 venture funds raised $17.6 billion in 2004, more than in the prior 2 years combined (albeit at just one-sixth their 2000 peak). There is a strong funding pipeline to support ven-
|
41 |
PricewaterhouseCoopers. “MoneyTree Survey.” Available at: http://www.pwcmoneytree.com/moneytree/index.jsp. Accessed December 20, 2005. |
|
42 |
Ibid. |
ture capital investments in 2005, especially early-stage investments with particular emphasis on biotechnology.
In addition to private venture capital, small companies can obtain federal tax incentives and other help through the research and experimentation (R&E) tax credit (Table 3-3) and the federal Small Business Innovation Research (SBIR) program and Advanced Technology Program43 (Table 3-4).
The US workforce faces the additional pressure of competing with workers in nations with lower wage structures. A US company can hire five chemists in China or at least that many engineers (depending on the field) in India for the cost of one employee of equivalent training in the United States.44 The upshot has been the growing trend of corporations moving work offshore because of wage disparities (Figure 3-11). Wage differences at the factory and clerical levels are even more pronounced.
A recent McKinsey and Company study45 reported that the supply of young professionals (university graduates with up to 7 years of experience) in low-wage countries vastly outstrips the supply in high-wage countries. There were 33 million people in that category in 28 low-wage countries, and 15 million in 8 high-wage countries, including 7.7 million in the United States.46 With opportunities to study or work abroad or to work at home for a multinational corporation, workers in low-wage countries increasingly will be in direct competition with workers from developed nations.
The same study estimates, however, that only 13% of the potential talent supply in low-wage nations is suited to work for multinational corporations because these individuals lack language skills, because of low-quality domestic education systems, and because of a lack of cultural fit. For the United States to compete, then, its workers can and must bring to the workplace not only technical skills and knowledge but other valuable skills, including knowledge of other cultures, the ability to interact comfortably with diverse clientele, and the motivation to apply their skills. US workers also must be able to communicate effectively orally and in writing, lead teams, manage projects, and solve problems. Although much of our education system is working to teach those skills, there is much to do to prepare
|
43 |
The other program is the Manufacturing Technology Program in the Department of Defense. |
|
44 |
The Web site http://www.payscale.com/about.asp tracks and compares pay scales in many countries. R. Hira, of the University of Rochester, calculates average salaries for engineers in the United States and India as $70,000 and $13,580, respectively. |
|
45 |
McKinsey and Company. The Emerging Global Labor Market: Part II—The Supply of Offshore Talent in Services. New York: McKinsey and Company, June 2005. |
|
46 |
Ibid. |
TABLE 3-3 R&E Tax Claims and US Corporate Tax Returns, 1990-2001
US students for work in a more competitive global economy—as well as to provide the rudimentary skills needed in any economy.
RESTRAINTS ON PUBLIC FUNDING
Public financial support is the backbone of America’s research establishment. In the 1960s and 1970s, university researchers could look to a dozen or so federal sources for grant support, including NSF, NIH, predecessors of the Office of Science in the Department of Energy (DOE),47 the Department of Defense (DOD), the National Aeronautics and Space Administration, and the Department of Agriculture. Funding from those sources, combined with private money, provided flexibility and generosity unmatched in any other nation. Large numbers of today’s senior scientists and engineers owe their ability to pursue their professions to grants from those federal agencies.
TABLE 3-4 Federally and Privately Funded Early-Stage Venture Capital in Millions of Dollars, 1990-2002
Several trends cast doubt on our continuing commitment to the above strategy. The first accompanied the end of the Cold War, when reductions in military funding had the perhaps unintentional effect of cutting basic and applied DOD research budgets. The portion of funding DOD devoted to basic research (the “6.1 account”) declined from 3.3% in fiscal year (FY) 1994 to about 1.9% in FY 200548 (Figure 3-12). Military research funding has gradually shifted from basic and applied research toward the more immediate needs of the combat forces.
Public funding for science and engineering rose through the 1990s, but virtually all of the increase went to biomedical research at NIH. Federal spending on the physical sciences remained roughly flat, and increases for mathematics and engineering only slightly surpassed inflation (Figure 3-13). Funding for important areas of the life sciences—plant science, ecology, environmental research—supported by agencies other than NIH also has leveled off. The lack of new funding for research in the physical sci-
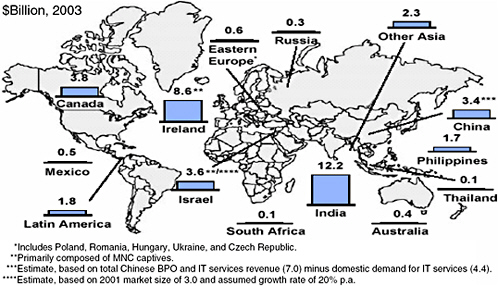
FIGURE 3-11 Offshored services market size, in billions of dollars, 2003.
NOTE: Offshored services market size includes Business Process Outsourcing and Information Technology, Captive and Outsourced.
SOURCE: Based on Software Associations; US country commercial reports; press articles; Gartner; IDC; Country government Web sites; Ministry of Information Technology for various countries; Enterprise Ireland; NASSCOM; McKinsey Global Institute analysis. McKinsey and Company. The Emerging Global Labor Market: Part II—The Supply of Offshore Talent in Services. New York: McKinsey and Company, June 2005.
ences, mathematics, and engineering raises concern about the overall health of the science and engineering research enterprise, including that of the health sciences. Yet, these are disciplines that lead to innovation across the spectrum of modern life.49
Figure 3-9B shows that total R&D as a percentage of GDP bottomed out in the late 1970s at around 2.1%, then rebounded to about 2.6%. That rate of investment has stayed relatively constant since the early 1980s. Federal R&D as a percentage of GDP peaked in the early 1960s and has fallen since then.
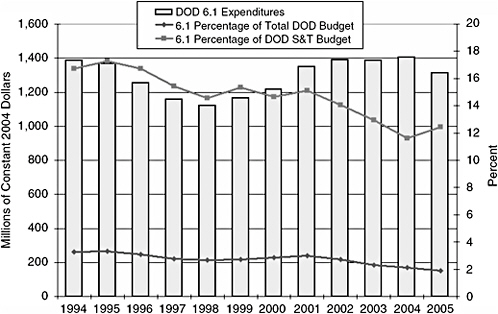
FIGURE 3-12 Department of Defense (DOD) 6.1 expenditures, in millions of constant 2004 dollars, 1994-2005.
SOURCE: National Science Board. Science and Engineering Indicators 2004. NSB 04-01. Arlington, VA: National Science Foundation, 2004.
EXPANDED MISSION FOR FEDERAL LABORATORIES
Among the nation’s most significant investments in R&D are some 700 laboratories funded directly by the federal government, about 100 of which are considered significant contributors to the national innovation system.50 Work performed by the government’s own laboratories accounts for about 35% of the total federal R&D investment.51 The largest and best known of these laboratories are run by DOD and DOE. NIH also has an extensive research facility in Maryland. The DOE laboratories focus mainly on national security research, as at Lawrence Livermore National Laboratory, or more broadly on scientific and engineering research, as at Oak Ridge National Laboratory or Argonne National Laboratory.
The national laboratories could potentially fill the gap left when the
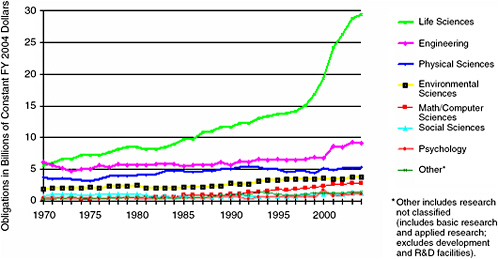
FIGURE 3-13 Trends in federal research funding by discipline, obligations in billions of constant FY 2004 dollars, FY 1970-FY 2004.
NOTE: Life sciences—split into NIH support for biomedical research and all other agencies’ support for life sciences.
SOURCE: American Association for the Advancement of Science analysis based on National Science Foundation. Federal Funds for Research and Development: Fiscal Years 2002, 2003, 2004. FY 2003 and FY 2004 data are preliminary. Constant-dollar conversions based on OMB’s GDP deflector.
large corporate R&D laboratories reduced their commitment to high-risk, long-term research in favor of short-term R&D work, often conducted in overseas laboratories close to their manufacturing plants and to potential markets for their products. The payoff for the US economy from the old corporate R&D system was huge. Today, that work is difficult for business to justify: Its profitability is best measured in hindsight, after many years of sustained investment, and the probability for the success of any single research project often is small.
Nonetheless, it was that type of corporate research which provided the disruptive technologies and technical leaps that fueled US economic leadership in the 20th century. If properly managed and adequately funded, the large multidisciplinary DOE laboratories could assist in filling the void left by the shift in corporate R&D emphasis. The result would be a stable, world-class science and engineering workforce focused both on high-risk, long-term basic research and on applied research for technology development. The national laboratories now offer the right mix of basic scientific inquiry and practical application. They often promote collaboration with research universities and with large teams of applied scientists and engineers, and the enterprise has demonstrated an early ability to translate pro-
totypes into commercial products. National defense-homeland security and new technologies for clean, affordable, and reliable energy are particularly appropriate areas of inquiry for the national laboratory system.
EDUCATIONAL CHALLENGES
The danger exists that Americans may not know enough about science, technology, or mathematics to significantly contribute to, or fully benefit from, the knowledge-based society that is already taking shape around us. Moreover, most of us do not have enough understanding of the importance of those skills to encourage our children to study those subjects—both for their career opportunities and for their general benefit. Other nations have learned from our history, however, and they are boosting their investments in science and engineering education because doing so pays immense economic and social dividends.
The rise of new international competitors in science and engineering is forcing the United States to ask whether its education system can meet the demands of the 21st century. The nation faces several areas of challenge: K–12 student preparation in science and mathematics, limited undergraduate interest in science and engineering majors, significant student attrition among science and engineering undergraduate and graduate students, and science and engineering education that in some instances inadequately prepares students to work outside universities.
K–12 Performance
Education in science, mathematics, and technology has become a focus of intense concern within the business and academic communities. The domestic and world economies depend more and more on science and engineering. But our primary and secondary schools do not seem able to produce enough students with the interest, motivation, knowledge, and skills they will need to compete and prosper in the emerging world.
Although there was steady improvement in mathematics test scores from 1990 through 2005, only 36% of 4th-grade students and 30% of 8th-grade students who took the 2005 National Assessment of Educational Progress (NAEP) performed at or above the “proficient” level in mathematics (Figure 3-14). (Proficiency was demonstrated by competence with “challenging subject matter”.)52 The results of the science 2000 NAEP test were
|
52 |
Educational Programs. Available at: http://nces.ed.gov/pubsearch/pubsinfo.asp?pubid=2005451. Accessed December 20, 2005; J. S. Braswell, G. S. Dion, M. C. Daane, and Y. Jin. The Nation’s Report Card. NCES 2005451. Washington, DC: US Department of Education, 2004. Based on National Assessment of Educational Progress. |
similar. Only 29% of 4th-grade students, 32% of 8th-grade students, and 18% of 12th-grade students performed at or above the proficient level (Figure 3-15). Without fundamental knowledge and skills, the majority of students scoring below this level—particularly those below the basic level—lack the foundation for good jobs and full participation in society.
Our 4th-grade students perform as well in mathematics and science as do their peers in other nations, but in the most recent assessment (1999) 12th graders were almost last among students who participated in the Trends in International Mathematics and Science Study. Of the 20 nations assessed in advanced mathematics and physics, none scored significantly lower than did the United States in either subject. The relative standing of US high school students in those areas has been attributed both to inadequate quality of teaching and to a weak curriculum.
There has, however, been some arguably good news about student achievement. Our 8th graders did better on an international assessment of mathematics and science in 2003 than the same age group did in 1995. Unfortunately, in both cases they ranked poorly in comparison with students from other nations. The achievement gap that separates African American and Hispanic students from white students narrowed during that period. However, a recent assessment by the OECD Programme for International Student Assessment revealed that US 15-year-olds are near the bottom worldwide in their ability to solve practical problems that require mathematical understanding. Test results for the last 30 years show that although scores of US 9- and 13-year-olds have improved, scores of 17-year-olds have remained stagnant.53
One key to improving student success in science and mathematics is to increase interest in those subjects, but that is difficult because mathematics and science teachers are, as a group, largely ill-prepared. Furthermore, many adults with whom students come in contact seemingly take pride in “never understanding” or “never liking” mathematics. Analyses of the teacher pool indicate that an increasing number do not major or minor in the discipline they teach, although there is growing pressure from the No Child Left Behind Act for states to hire more highly qualified teachers (see Table 5-1). About 30% of high school mathematics students and 60% of those enrolled in physical sciences have teachers who either did not major in the
|
53 |
The Programme for International Student Assessment (PISA) Web site is available at: http://www.pisa.oecd.org. PISA, a survey every 3 years (2000, 2003, 2006, etc.) of 15-year-olds in the principal industrialized countries, assesses to what degree students near the end of compulsory education have acquired some of the knowledge and skills that are essential for full participation in society. |
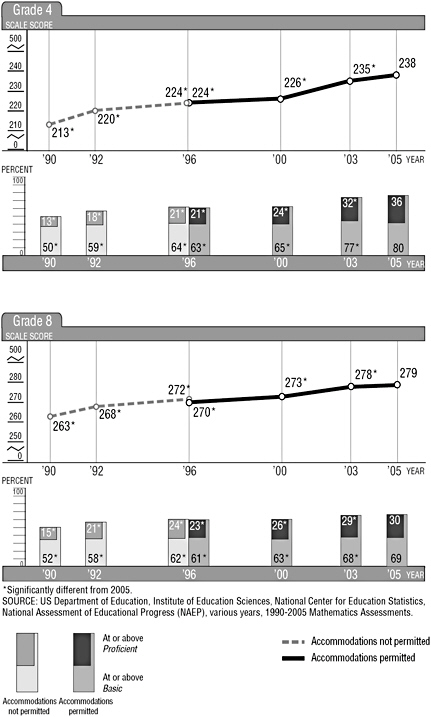
FIGURE 3-14 Average scale NAEP scores and achievement-level results in mathematics, grades 4 and 8: various years, 1990-2005.
SOURCE: National Center for Education Statistics. Available at: http://nces.ed.gov/nationsreportcard/.
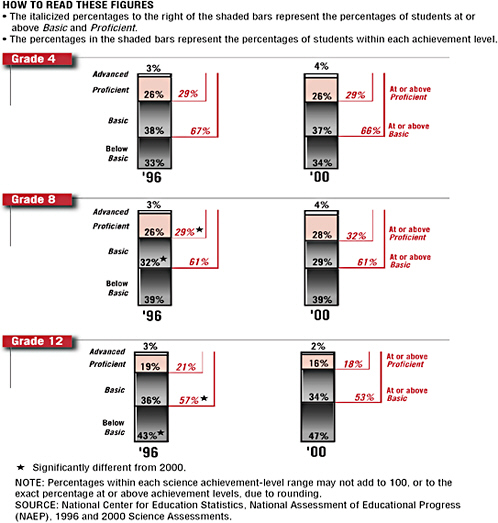
FIGURE 3-15 Percentage of students within and at or above achievement levels in science, grades 4, 8, and 12, 1996 and 2000.
SOURCE: National Center for Education Statistics. Available at: http://nces.ed.gov/nationsreportcard/.
subject in college or are not certified to teach it. The situation is worse for low-income students: 70% of their middle school mathematics teachers majored in some other subject in college.
Meanwhile, an examination of curricula reveals that middle school mathematics and science courses lack focus, cover too many topics, repeat material, and are implemented inconsistently. That could be changing, at
least in part because of new science and mathematics teaching and learning standards that emphasize inquiry and detailed study of fewer topics.
Another major challenge—and opportunity—has been the diversity of the student population and the large variation in quality of education between schools and districts, particularly between suburban, urban, and rural schools. Some schools produce students who consistently score at the top of national and international tests; while others consistently score at the bottom. Furthermore, accelerated mathematics and science courses are less frequently offered in rural and city schools than in suburban ones. How to achieve an equitable distribution of funding and high-quality teaching should be a top-priority issue for the United States. It is an issue that is exacerbated by the existence of almost 15,000 school districts, each containing an average of six schools.
Student Interest in Science and Engineering Careers
The United States ranks 16 of 17 nations in the proportion of 24-year-olds who earn degrees in natural sciences or engineering as opposed to other majors (Figure 3-16A) and 20 of 24 nations when looking at all 24-year-olds (Figure 3-16B).54 The number of bachelor’s degrees awarded in the United States fluctuates greatly (see Figure 3-17).
About 30% of students entering college in the United States (more than 95% of them US citizens or permanent residents) intend to major in science or engineering. That proportion has remained fairly constant over the past 20 years. However, undergraduate programs in those disciplines report the lowest retention rates among all academic disciplines, and very few students transfer into these fields from others. Throughout the 1990s, fewer than half of undergraduate students who entered college intending to earn a science or engineering major completed a degree in one of those subjects.55 Undergraduates who opt out of those programs by switching majors are
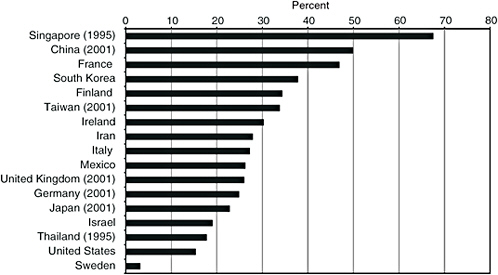
FIGURE 3-16A Percentage of 24-year-olds with first university degrees in the natural sciences or engineering, relative to all first university degree recipients, in 2000 or most recent year available.
SOURCE: Analysis conducted by the Association of American Universities. 2006. National Defense Education and Innovation Initiative based on data from Appendix Table 2-35 in National Science Board. Science and Engineering Indicators 2004. NSB 04-01. Arlington, VA: National Science Foundation, 2004.
often among the most highly qualified college entrants,56 and they are disproportionately women and students of color. The implication is that potential science or engineering majors become discouraged well before they can join the workforce.57
|
56 |
S. Tobias. They’re Not Dumb, They’re Different. Stalking the Second Tier. Tucson, AZ: Research Corporation, 1990; E. Seymour and N. Hewitt. Talking About Leaving: Why Undergraduates Leave the Sciences. Boulder, CO: Westview Press, 1997; M. W. Ohland, G. Zhang, B. Thorndyke, and T. J. Anderson. Grade-Point Average, Changes of Major, and Majors Selected by Students Leaving Engineering. 34th ASEE/IEEE Frontiers in Education Conference. Session T1G:12-17, 2004. |
|
57 |
M. F. Fox and P. Stephan. “Careers of Young Scientists: Preferences, Prospects, and Reality by Gender and Field.” Social Studies of Science 31(2001):109-122; D. L. Tan. Majors in Science, Technology, Engineering, and Mathematics: Gender and Ethnic Differences in Persistence and Graduation. Norman, OK: University of Oklahoma, 2002. Available at: http://www.ou.edu/education/csar/literature/tan_paper3.pdf; Building Engineering and Science Talent (BEST). The Talent Imperative: Diversifying America’s Science and Engineering Workforce. San Diego: BEST, 2004; G. D. Heyman, B. Martyna, and S. Bhatia. “Gender and Achievement-related Beliefs Among Engineering Students.” Journal of Women and Minorities in Science and Engineering 8(2002):33-45. |
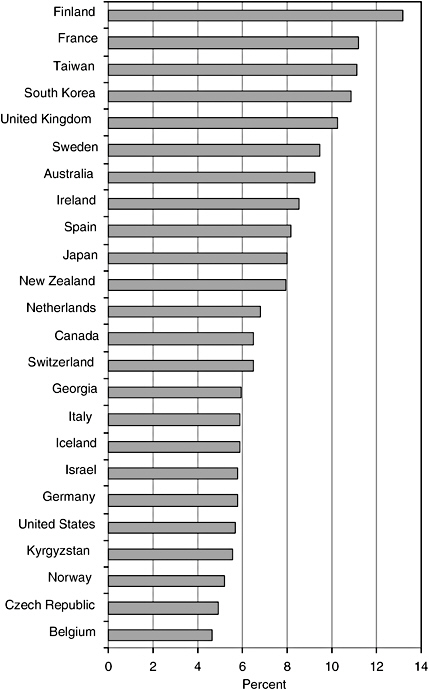
FIGURE 3-16B Percentage of 24-year-olds with first university degrees in the natural sciences or engineering relative to all 24-year-olds, in 2000 or most recent year available.
NOTE: Natural sciences and engineering include the physical, biological, agricultural, computer, and mathematical sciences and engineering.
SOURCE: National Science Board. Science and Engineering Indicators 2004. NSB 04-01. Arlington, VA: National Science Foundation, 2004.
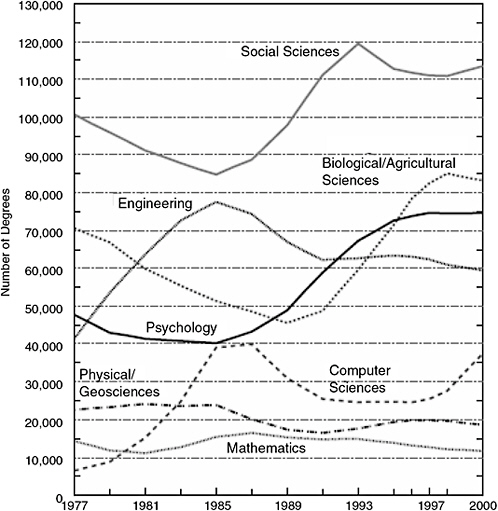
FIGURE 3-17 Science and engineering bachelor’s degrees, by field: selected years, 1977-2000.
NOTES: Geosciences include earth, atmosphere, and ocean sciences. Degree production for many science, technology, engineering, and mathematics fields increased and computer science decreased in 2001. See graphs in the Attracting the Most Able US Students to Science and Engineering paper located in Appendix D.
SOURCE: National Science Board. Science and Engineering Indicators 2004. NSB 04-01. Arlington, VA: National Science Foundation, 2004. Appendix Table 2-23.
Graduate school enrollments in science and engineering in the United States have been relatively stable since 1993, at 22-26% of the total enrollment. More women and under represented minorities participate than has been the case in the past, but a relative decline in the enrollment of US whites and males in the late 1990s has been reversed only since 2001.58 Indeed, for the past 15 years, growth in the number of doctorates awarded is attributable primarily to the increased number of international students. Attrition is generally lower in the doctoral programs than among undergraduates in science, technology, engineering, and mathematics, but doctoral programs in the sciences nonetheless report dropout rates from 24 to 67%, depending on the discipline.59 If the primary objective is to maintain excellence, a major challenge is to determine how to continue to attract the best international students and still encourage the best domestic students to enter the programs—and to remain in them.
Student interest in research careers is dampened by several factors. First, there are important prerequisites for science and engineering study. Students who choose not to or are unable to finish algebra 1 before 9th-grade—which is needed for them to proceed in high school to geometry, algebra 2, trigonometry, and precalculus—effectively shut themselves out of careers in the sciences. In contrast, the decision to pursue a career in law or business typically can wait until the junior or senior year of college, when students begin to commit to postgraduate entrance examinations.
Science and engineering education has a unique hierarchical nature that requires academic preparation for advanced study to begin in middle school. Only recently have US schools begun to require algebra in the 8th-grade curriculum. The good news is that more schools are now offering integrated science curricula and more districts are working to coordinate curricula for grades 7–12.60
For those students who do wish to pursue science and engineering, there are further challenges. Introductory science courses can function as “gatekeepers” that intentionally foster competition and encourage the best stu-
dents to continue, but in so doing they also can discourage highly qualified students who could succeed if they were given enough support in the early days of their undergraduate experience.
Beyond the prospect of difficult and lengthy undergraduate and graduate study and postdoctoral requirements, career prospects can be tenuous. At a general level, news about companies that send jobs overseas can foster doubt about the domestic science and engineering job market. Graduate students are sometimes discouraged by a perceived mismatch between education and employment prospects in the academic sector. The number of tenured academic positions is decreasing, and an increasing majority of those with doctorates in science or engineering now work outside of academia. Doctoral training, however, still typically assumes students will work in universities and often does not prepare graduates for other careers.61 Finally, it is harder to stay current in science and engineering than it is to keep up with developments in many other fields. Addressing the issues of effective lifelong training, time-to-degree, attractive career options, and appropriate type and amount of financial support are all critical to recruiting and retaining students at all levels.
Where are the top US students going, if not into science and engineering? They do not appear to be headed in large numbers to law school or medical school, where enrollments also have been flat or declining. Some seem attracted to MBA programs, which grew by about one-third during the 1990s. In the 1990s, many science and engineering graduates entered the workforce directly after college, lured by the booming economy. Then, as the bubble deflated in the early part of the present decade, some returned to graduate school. A larger portion of the current crop of science and engineering graduates seems to be interested in graduate school.62 In 2003, enrollment in graduate science and engineering programs reached an all-time high, gaining 4% over 2002 and 9% over 1993, the previous peak year. Increasingly, the new graduate students are US citizens or permanent residents—67% in 2003 compared with 60% in 200063—and their prospects seem good: In 2001, the share of top US citizen scorers on the Gradu-
ate Record Exam quantitative scale (above 750) heading to graduate school in the natural sciences and engineering was 31% percent higher than in 1998. That group had declined by 21% in the previous 6 years.64
There is still ample reason for concern about the future. A number of analysts expect to see a leveling off of the number of US-born students in graduate programs. If the number of foreign-born graduate students decreases as well, absent some substantive intervention, the nation could have difficulty meeting its need for scientists and engineers.
BALANCING SECURITY AND OPENNESS
Science thrives on the open exchange of information, on collaboration, and on the opportunity to build on previous work. The United States gained and maintained its preeminence in science and engineering in part by embracing the values of openness and by welcoming students and researchers from all parts of the world to America’s shores. Openness has never been unqualified, of course, and the nation actively seeks to prevent its adversaries from acquiring scientific information and technology that could be used to do us harm. Scientists and engineers are citizens too, and those communities recognize both their responsibility and their opportunity to help protect the United States, as they have in the past. This has been done by harnessing the best science and engineering to help counter terrorism and other national security threats, even though that could mean accepting some limitations on research and its dissemination.65
But now concerns are growing that some measures put in place in the wake of September 11, 2001, seeking to increase homeland security, will be ineffective at best and could in fact hamper US economic competitiveness and prosperity.66 New visa restrictions have had the unintended consequence of discouraging talented foreign students and scholars from coming here to work, study, or participate in international collaborations. Fortunately, the federal agencies responsible for these restrictions have recently implemented changes.67 Of principal concern now are other forms of disincentive:
|
64 |
W. Zumeta and J. S. Raveling. “The Market for PhD Scientists: Discouraging the Best and Brightest? Discouraging All?” AAAS Symposium, February 16, 2004. Press release available at: http://www.eurekalert.org/pub_releases/2004-02/uow-rsl021304.php. |
|
65 |
See, for example, National Research Council. Making the Nation Safer: The Role of Science and Technology in Countering Terrorism. Washington, DC: The National Academies Press, 2002. |
|
66 |
Letter from the Presidents of the National Academies to Secretary of Commerce Carlos Gutierrez, June 24, 2005. Available at: http://www.nationalacademies.org/morenews/20050624.html. |
|
67 |
The National Academies. Policy Implications of International Graduate Students and Postdoctoral Scholars. Washington, DC: The National Academies Press, 2005. Pp. 56-57. |
-
Expansion of the restrictions on “deemed exports,” the passing of technical information to foreigners in the United States that requires a formal export license, is expected to cover a much wider range of university and industry settings.68 Companies that rely on the international members of their R&D teams and university laboratories staffed by foreign graduate students and scholars could find their work significantly hampered by the new restrictions.
-
Expanded or new categories of “sensitive but unclassified” information could restrict publication or other forms of dissemination. The new rules have been proposed or implemented even though many of the lists of what is to be controlled are sufficiently vague or obsolete that it could be difficult to ascertain compliance.69 The result could be to force researchers to err on the side of caution and thus substantially impede the flow of scientific information.
Both approaches could undermine the protections for fundamental research established in National Security Decision Directive 189 (NSDD-189), the Reagan Administration’s 1985 executive order declaring that publicly funded research, such as that conducted in universities and laboratories, should “to the maximum extent possible” be unrestricted.70 Where restriction is considered necessary, the control mechanism should be formal classification: “No restrictions may be placed upon the conduct or reporting of federally-funded fundamental research that has not received national security classification, except as provided in applicable U.S. statutes.” The NSDD-189 policy remains in force and has been reaffirmed by senior officials of the current administration, but it appears to be at odds with other policy developments and some recent practices.
|
68 |
In 2000, Congress mandated annual reports by the Office of Inspector General (IG) on the transfer of militarily sensitive technology to countries and entities of concern; the 2004 reports focused on deemed exports. The individual agency IG reports and a joint interagency report concluded that enforcement of deemed-export regulations had been ineffective; most of the agency reports recommended particular regulatory remedies. |
|
69 |
Center for Strategic and International Studies. Security Controls on Scientific Information and the Conduct of Scientific Research. Washington, DC: CSIS, June 2005. |
|
70 |
Fundamental research is defined as “basic and applied research in science and engineering, the results of which ordinarily are published and shared broadly within the scientific community, as distinguished from proprietary research and from industrial development, design, production and product utilization, the results of which ordinarily are restricted for proprietary or national security reasons.” National Security Decision Directive 189, September 21, 1985. Available at: http://www.aau.edu/research/ITAR-NSDD189.html. |
CONCLUSION
Although the United States continues to possess the world’s strongest science and engineering enterprise, its position is jeopardized both by evolving weakness at home and by growing strength abroad.71 Because our economic, military, and cultural well-being depends on continued science and engineering leadership, the nation faces a compelling call to action. The United States has responded energetically to challenges of such magnitude in the past:
-
Early in the 20th century, we determined to provide free education to all, ensuring a populace that was ready for the economic growth that followed World War II.
-
The GI Bill eased the return of World War II veterans to civilian life and established postsecondary education as the fuel for the postwar economy.
-
The Soviet space program spurred a national commitment to science education and research. The positive effects are seen to this day—for example, in much of our system of graduate education.
-
The decline of the US semiconductor manufacturing industry in the middle 1980s was met with SEMATECH, the government–industry consortium credited by many with stimulating the resurgence of that industry.
Today’s challenges are even more diffuse and more complex than many of the challenges we have confronted in our past. Research, innovation, and economic competition are worldwide, and the nation’s attention, unlike that of many competitors, is not focused on the importance of its science and engineering enterprise. If the United States is to retain its edge in the technology-based industries that generate innovation, quality jobs, and high wages, we must act to broker a new, collaborative understanding among the sectors that sustain our knowledge-based economy—industry, academe, and government—and we must do so promptly.
|
71 |
Note that some do not believe this is the case. See Box 3-2. |


