
F
Chronic Disease and Trends in Severe Disability in Working-Age Populations
Jay Bhattacharya, Kavita Choudhry, and Darius Lakdawalla*
Recent work has shown that rates of severe disability, measured by the inability to perform basic activities of daily living, have been rising in working-age populations. This paper examines the extent to which chronic disease trends can explain these disability trends. The primary findings are that for populations of 30- to 45-year-old individuals between 1984 and 1996, (1) the prevalence of disability fell dramatically among non-chronically ill individuals, (2) the rising prevalence of obesity explains about 40 percent of the rise in disability attributable to trends chronic illness, and (3) the rising prevalence of disability among chronically ill individuals explains about 60 percent of the rise in disability attributable to trends in chronic illness.
Over the past two decades, the rates of severe disability, as measured by limitations in instrumental activities of daily living (IADLs), such as the ability to prepare meals, shop, do housework, use the telephone, and take medications, have been declining in older populations. A consensus has
emerged that the health of the elderly population, at least on this measure, has been improving since the early 1980s and that this improvement in health is reflected in a declining rate of disability (see, e.g., Manton et al., 1997; Crimmins et al., 1997; Schoeni et al., 2001; Crimmins, 2004; Freedman et al., 2004). Much of this literature has pointed to improvements in medical and assistive technologies for the treatment of disabled individuals, as well as the improved prevention of disabling conditions among the elderly population, as the leading causes of these declines.
These declines in disability came as a surprise to researchers because they reversed the trends of increasing rates of disability seen among elderly people in the 1970s. Then, researchers argued that increases in longevity amounted to extensions of the time spent in disability by elderly people (see, e.g., Crimmins et al., 1989; Waidmann et al., 1995). Thus, they predicted, increases in longevity would inevitably be accompanied by growth in the incidence of disability (see, e.g., Gruenberg, 1977). This concern has been replaced with the happy prospect of a compression of morbidity into shorter periods at the end of longer lives.
On the other hand, the news has not been all good over the past 20 years. For both the elderly and the working-age populations, there have been increases in the prevalence of some important chronic conditions, such as obesity and asthma. Working-age populations in the United States are more likely to claim disability benefits now than they were in 1990 (Autor and Duggan, 2001; Bound and Waidmann, 2000). In addition to increases in the size of the work-limited population, severe activity of daily living (ADL)-style disabilities have also risen in the working-age population since 1980 (Lakdawalla et al., 2003a,b; 2004).
The difference in the rates of changes in disability between the elderly and the working-age populations over the past 20 years is puzzling. If the explanation is the use of medical technology and preventive medicine, then the question is why these have not benefited younger populations in the same way that they have benefited the elderly population. This explanation presumes that at the root there have been real changes in the health of the populations under consideration that have led to the observed changes in the prevalence of disabilities. However, is this root assumption correct? Over this period there has been real deterioration in some measures of health in working-age populations, such as the dramatic rise in obesity rates. It seems implausible that such changes would have had no effect on disability rates, but how much is the effect?
The main aim of this paper is to describe the existing evidence on disability and chronic health trends in the population under age 65 years and to present new estimates of a decomposition of disability trends among working-age populations into two parts: the part of the trend explained by changes in the prevalence of chronic disease and obesity and the part of the
trend explained by changes in the prevalence of disability among people with chronic diseases. The main import of such a decomposition is that it may highlight preventable clinical conditions that are most likely to lead to disability. The optimal policies that need to be implemented to reduce disability will be quite different if disease prevalence is the primary cause than if disability prevalence among the chronically ill is the primary cause.
BACKGROUND
In this section, we make precise exactly what we mean when we say that someone has a disability. Perhaps not surprisingly, this turns out to be quite controversial and is the cause of much confusion when the results of papers that analyze disability are compared: they are quite frequently talking about different things. As we intimate in the introduction, the definition of disability that we adopt in this paper is closely related to ADL limitations. We then review the literature on trends in old-age disability. Next, we review the results on ADL disability among working-age populations obtained by some of the authors of the current paper. (To our knowledge, no other work has documented the trends in ADL disability in younger populations.) Finally, we summarize the large medical literature on chronic disease trends in working-age populations.
Defining Disability
Although everyone has some intuitive idea about what it means to be disabled, when it is examined closely, disability turns out to be a concept that is hard to define—and, hence, difficult to measure in population-based surveys. Disability is an elastic concept that changes both from one social environment to another at a single point in time and from one period to another over the life cycle (Berry and Hardman, 1998; Marshak et al., 1999). Definitions of disability thus vary widely and tend to be specific to a particular objective or agency (USDOL, 2005). These unique definitions serve the goals of, for example, removing discrimination through the Americans with Disabilities Act (P.L. 101-336), determining eligibility for special education services, and qualifying for Social Security disability benefits (USEEOC, 1995; Knoblauch and Soerenson, 1998; SSA, 2005).
Survey data on disabilities, which inform the policies established and practiced by the entities cited above, fall into two broad areas: activity limitations and work limitations. The former encompasses the most basic, mechanically oriented ADLs, such as dressing, eating, and bathing, as well as IADLs, which involve everyday behaviors that require a higher level of cognitive functioning than ADLs, such as grocery shopping, managing money, and preparing meals (Crimmins et al. 1997; Manton et al., 1997;
Stone, 1984). The latter definition, which is the one typically used in studies of disability in populations under age 65 years, measures whether individuals are restricted in their ability to work in the labor market as a result of disabling physical or mental conditions. Although both definitions of disability are potentially important for the optimal construction of different policies, the activity limitation definition that we focus on here has, perhaps, more direct clinical relevance.
Surveys that collect data on aging population niches—such as the National Long-Term Care Survey (NLTCS)—tend to gather activity limitation information, whereas nationally representative survey instruments, such as the Current Population Survey, emphasize work disability. Data from the 2000 census, however, include elements on long-lasting sensory impairments, ADLs and IADLs, cognitive ability, and work limitations; this recent change attests to an increasing need to understand what disability is, who is affected by disabilities and to what degree they are affected, and possible or likely trends in disability at all ages. There is also a growing movement to improve measures of current activity outcomes to better address ways in which overall quality of life and employment potential can be improved (see, e.g., Bierman, 2001).
The main data set that we rely on, those from the National Health Interview Surveys (NHISs), includes data on both work limitation-based measures of disability (which are the measures typically reported by analysts using the NHIS) and ADL limitation-based measures (which are the ones that we focus on in this paper).
Trends in Late-Life Disability
A broad set of the literature has looked at trends in disability in the American elderly population over the past two decades. Contributors to this literature have relied on different surveys and different definitions of disability but have consistently found declines—and sometimes sharp and accelerating declines—in disability among the elderly population.
Manton and colleagues (1997) use data from the 1982, 1984, 1989, and 1994 NLTCSs to investigate trends in the prevalence of disability in the elderly population. Defining disability as an inability to perform an ADL or IADL without aid for at least 90 days, they found that the age-adjusted prevalence of disability for 1994 decreased by 3.6 percent from that for 1982 (from 24.9 to 21.3 percent). The authors compare the size of the set of people with disabilities with that which would have occurred without the apparent declines in disability. There were 0.54 million and 1.2 million fewer disabled elderly people in 1989 and 1994, respectively, than there would have been had the 1982 rates stayed fixed (Manton et al., 1993, 1997). Manton and Gu (2001) updated these results using the latest wave
of data from NLTCS. They confirmed a continuing decline in disability among the elderly population, especially among the oldest age groups.
Manton and colleagues also investigated the incidence of disability and the progression to increased forms of disability. They calculated the rates of being institutionalized from having one or two ADLs, three or four ADLs, five or six ADLs, or some number of IADLs exclusively in 1982 and 1984. The decline in the rate of disability accelerated from 0.27 percent per year from 1982 to 1989 to 0.34 percent from 1989 to 1994, with greater declines in older cohorts (Manton and Gu, 2001). The transition rates from 1982 to 1984 and from 1984 to 1989 were also improved (Manton et al., 1993). Manton (2003) and Pardes and colleagues (1999) attribute these recent improvements in the prevalence of disability among the elderly population to improvements in medical technology that enable seniors to delay both disability and death. They argue strongly that potential future medical breakthroughs (such as the treatment and prevention of senile dementia) hold the promise of further disability reductions for the elderly population.
Freedman and Martin (1998) used data from the 1984 and 1993 Surveys of Income and Program Participation (SIPP) to investigate trends in the prevalence of disability. Their definition of disability differs mildly from the one used by Manton and colleagues; they define it as difficulty seeing words in a newspaper, lifting and carrying 10 pounds, climbing stairs, or walking a quarter mile. The authors found that the prevalence of difficulty in each category declined over the study period. The prevalence ranged from 15.3 percent (difficulty seeing words in a newspaper) to 25.8 percent (walking three-quarters of a mile) in 1984 to 11.6 percent to 22.3 percent for the same categories, respectively, in 1993, a relative improvement of between 0.9 and 2.3 percent across functions.
Crimmins and colleagues (1997) confirmed net decreases in disability among the elderly population from 1982 to 1993, despite intermediate fluctuations. They used data from the Longitudinal Study of Aging (LSOA) (1984, 1986, 1988, and 1990) and NHIS (1982 to 1993) to track the prevalence of disability over time. They focused solely on the prevalence of disability in the population over 70 years of age. The overall prevalence of disability determined with data from NHIS (defined as an inability to perform personal or routine care) in 1982 was 21.1 percent, and in 1993 it was 19.5 percent. With data from LSOA they found that the proportions of individuals who were disabled (defined as an inability to perform an ADL without aid) in 1984, 1986, 1987, and 1990 were 18.8, 21.6, 21.3, and 20.5 percent, respectively. Although no visually striking trend exists in the plotted data sets, statistical analysis reveals a slight decrease in disability in the pooled population (controlling for age and sex). These decreases are more likely in the activities of IADLs (routine care) as opposed to ADLs (personal care). Hazard models applied to these data revealed that the rates
of transition to disability and out of disability improved over time: the incidence of disability decreased 16 percent from the 1948 to 1986 period to the 1988 to 1990 period.
Using NHIS 1970, 1980, and 1990 data and a definition of disability that differs from the one that we rely on in this paper (any limitation in usual activity over the past 12 months), Crimmins and colleagues (1997) found fluctuations in the long-term prevalence of disability. Institutionalization rates have declined for most age groups but have stayed the same or increased for those older than age 80. Long-term disability increased for the population older than age 60 from 1970 to 1980 but decreased from 1980 to 1990. For example, males aged 65 to 69 in 1970, 1980, and 1990 had disability rates of 37.84, 43.68, and 39.39 percent, respectively; and for females the rates were 30, 36.2, and 30.56 percent, respectively. These prevalence figures are subject to assumptions made about the effects of question wording changes after 1982.
Crimmins and colleagues (1997) also investigated the relative contributions of disability-free and disabled years to life expectancy. They used the NHIS definition of years of active life expectancy: the “years when an individual’s health does not affect ability to perform normal activities of life including both major and secondary activities” (p. S61). At age 65, total life expectancy increased from 1970 to 1990. (Mortality declines from 1980 to 1990 were one-third of the decline from 1970 to 1980 for females and three-quarters of that for males for that period.) However, the proportion of that increase that included disability-free years was small. From 1970 to 1980, disability-free life expectancy did not increase, but there was a slight increase from 1980 to 1990. McKinlay and colleagues (1989) also found that the disability-free life expectancy decreased for newborns and middle-aged women from 1964 to 1985. These findings do not entirely support the hypothesis of Fries (1980) that the active life span is increasing faster than the total life span.
Freedman and colleagues (2004) presented the most comprehensive work on documenting disability trends in the elderly population. That report presented the summary view of a large group of distinguished researchers on disability in the elderly population. The main goal of Freedman and colleagues was to explore comprehensively whether five different nationally representative data sets gave the same answer about the direction and extent of disability trends. They also looked at how different definitions of disability led to different trend estimates. They summarized their conclusions as follows:
Although the evidence was mixed for the 1980s and it is difficult to pinpoint when in the 1990s the decline began, during the mid- and late 1990s, the panel found consistent declines on the order of 1 percent [to] 2.5 percent per year for two commonly used measures in the disability
literature: difficulty with daily activities and help with daily activities. Mixed evidence was found for a third measure: the use of help or equipment with daily activities (Freedman et al., 2004, pp. 434-435).
There has been one attempt to use statistical decompositions to measure the extent to which changes in chronic disease explain trends in elderly disability. Using NHIS data from 1984 and 1994, Freedman and Martin (2000) found that upper and lower body limitations declined over that decade. Using these same data, Freedman and Martin found that although the prevalence of many prominent chronic diseases rose over the same period, the prevalence of disability among those with chronic disease fell.1
Disability Trends in Working-Age Populations
Using data from the 1984 to 2000 NHISs, Lakdawalla and colleagues (2004) tracked changes in disability by age. They tracked two different measures of disability: personal care and routine needs disability. These are conceptually different from work limitation disabilities, which are also tracked by NHIS.2
Table F-1 shows how disability rates determined from the NHIS data changed between 1984 and 2000. The numbers in the personal care column in Table F-1 reflect the number of people per 10,000 population requiring assistance with personal care needs, whereas the numbers in the routine needs column reflect the number per 10,000 population requiring assistance with personal care needs or other routine needs.
From 1984 to 1996, Table F-1 shows that routine needs disability expanded significantly for individuals between the ages of 30 and 59 years. There were significant expansions in the more severe personal care limitation category for all individuals aged 18 to 39. For groups aged 30 to 59,
|
1 |
Freedman and Martin (2000) rely on linear regression-based methods to decompose rates of disability growth. The validity of these methods depends strongly on the validity of the linearity assumption and on the low prevalence of jointly occurring chronic diseases. |
|
2 |
Specifically, NHIS respondents were asked: “Because of any impairment or health problem, does ___ need the help of other persons with personal care needs, such as eating, bathing, dressing, or getting around this home?” If they answered “no” to this question, they were then asked: “Because of any impairment or health problem, does ___ need the help of other persons in handling routine needs, such as everyday household chores, doing necessary business, shopping, or getting around for other purposes?” These questions allow respondents to be placed in one of three bins: (1) unable to perform personal care needs, (2) limited in performing other routine needs, or (3) not limited in personal care or routine needs. The NHIS questionnaire was redesigned in 1997, and the wording of the questions on disability were subtly altered, although it is still possible on the basis of the new questions to place individuals in the three bins. However, the NHIS designers discourage comparisons of data from before and after the redesign. Table F-1 consequently tracks trends separately between 1984 and 1996 and between 1997 and 2000. |
TABLE F-1 Age-Specific Trends in the Proportion of People with Personal Care or Routine Care Needs Limitations per 10,000 Population, 1984 to 2000
|
|
Number of People per 10,000 Population in the Following Age Groups: |
|||||||||
|
|
18–29 |
30–39 |
40–49 |
50–59 |
60–69 |
|||||
|
Year |
Personal Care |
Personal Care and Routine Needs |
Personal Care |
Personal Care and Routine Needs |
Personal Care |
Personal Care and Routine Needs |
Personal Care |
Personal Care and Routine Needs |
Personal Care |
Personal Care and Routine Needs |
|
1984 |
23 |
82 |
30 |
118 |
63 |
212 |
111 |
400 |
256 |
765 |
|
1985–1986 |
25 |
75 |
37 |
125 |
53 |
200 |
108 |
423 |
212* |
748 |
|
1987–1988 |
27 |
79 |
33 |
126 |
51 |
200 |
97 |
363 |
218* |
701* |
|
1989–1990 |
27 |
86 |
28 |
127 |
58 |
226 |
105 |
360 |
216* |
674* |
|
1991–1992 |
30* |
101* |
55* |
173* |
76 |
250* |
130 |
449* |
229 |
681* |
|
1993–1994 |
26* |
104* |
48* |
185* |
71 |
272* |
114 |
473* |
231 |
763 |
|
1995–1996 |
31* |
98 |
54* |
181* |
78 |
275* |
126 |
464* |
242 |
694* |
|
Change 1984–1996 |
8 |
16 |
24 |
63 |
14 |
63 |
15 |
64 |
–14 |
–72 |
|
1997–1998 |
23 |
63 |
38 |
103 |
67 |
216 |
110 |
370 |
225 |
551 |
|
1999–2000 |
27 |
70 |
44 |
100 |
88 |
217 |
119 |
333 |
217 |
501 |
|
Change 1997–2000 |
4 |
7 |
5 |
–3 |
20 |
1 |
9 |
–37 |
–8 |
–50 |
|
NOTE: *Significantly different from base year (1984 or 1997–1998), according to two-tailed t test at the 95 percent level of confidence. SOURCE: Lakdawalla et al. (2003a), based on NHIS data. |
||||||||||
the absolute growth in personal plus routine needs disability was roughly 63 per 10,000 population. The largest percentage increase occurred for 30-to 39-year-olds, whose rate of disability rose by more than 50 percent over this period. According to either definition of disability, the population aged 60 to 69 actually became less disabled. This is consistent with the findings from previous research that the old are becoming less disabled.
Autor and Duggan (2001) gave a detailed analysis of the way in which changes in the incentives to claim eligibility for government disability insurance payments have affected reported rates of disability among working-age populations. Disability defined by eligibility for disability insurance should be kept conceptually distinct from notions of disability involving requirements for help with personal care or routine needs. Autor and Duggan’s analysis, performed with the NHIS data, shows that over the period from 1970 to 1996, the overall rate of disability fell much more rapidly among those who are more educated. This difference in growth rates, however, does not appear when the data are analyzed within employment status groups. That is, among the employed and among those not in the labor force, disability is growing at the same rates across education groups. This suggests that growth in disability is coming from less educated people who are leaving the labor force at higher rates. Because incentives for disability insurance are also likely to be the strongest for this group (who tend to earn less than more educated individuals), this piece of evidence is consistent with an explanation that stresses the importance of disability insurance. This could be particularly important for those between the ages of 40 and 54 years. The per capita rate of disability awards was constant for this age group from 1984 to 1990, but it suddenly shot up between 1990 and 1992 as a result of increases in disability insurance payments.
The receipt of disability payment alone is unlikely to explain all of the trends in personal care and routine needs disability, because for other age groups the timing of disability award changes does not coincide with the timing of disability growth. The per capita award rate for those under age 40 years grew by 40 percent from 1984 to 1990, but it grew by only 14 percent from 1990 to 1996 (Autor and Duggan, 2001). In contrast, Lakdawalla and colleagues (2004) found that growth in disability among individuals over age 40 is concentrated entirely in the period from 1990 to 1996. Moreover, the per capita award rate grew by more than 20 percent for those between the ages of 55 and 64, whereas the reported disability rate actually declined for this age group (Autor and Duggan, 2001).
Chronic Disease in Working-Age Populations
In this section, we review trends in the prevalence of chronic health conditions in working-age populations (less than 65 years old) and the
relation between these trends and trends in disability in the same populations. Not surprisingly, trends in the prevalence of chronic health conditions vary by condition and by cohort; the evidence indicates that more recent cohorts are more likely to suffer from such chronic health conditions like asthma, diabetes (Mokdad et al., 2000), chronic bronchitis (ALA, 2002a), and obesity (Wolf and Colditz, 1998). They are less likely to suffer from heart disease, hypertension (Reynolds et al., 1999), or arthritis. However, the literature also indicates that the proportion of chronically ill people who have a disability is higher in younger cohorts, although the latter point has not been systematically investigated. The literature on disability in this population tends to focus mainly on disability that causes work limitations rather than on other ADL and IADL limitations, which renders much of the literature that we report on here incomparable with our own results reported below.
Respiratory diseases such as asthma and chronic bronchitis are increasing in prevalence among the nonelderly population. In 1982, 2.9 percent of 18- to 44-year-olds and 3.6 percent of 45- to 64-year-olds experienced an asthma attack; in 1996, these numbers increased to 5.7 and 4.9 percent, respectively (ALA, 2002b). Chronic bronchitis sufferers aged 18 to 44 years in 1982 comprised 2.5 percent of the population, whereas 4.4 percent of the 45- to 64-year-olds had chronic bronchitis. In 1996, these figures rose to 4.5 and 5.9 percent, respectively (ALA, 2002a). The prevalence of childhood disability due to asthma rose 232 percent from 1969 to 1995, whereas the prevalence of childhood disability due to all other chronic illnesses in childhood rose 113 percent—less than half as much—in the same time span (Newacheck and Halfon, 2000).
Both the prevalence and the incidence of self-reported diabetes increased from 1980 to 1994 (CDC, 1997). From 1990 to 1998, the prevalence rate for diabetes among 18- to 29-year-olds increased slightly, from 1.5 to 1.6 percent. However, much more striking increases are seen in other working-age groups: among 30- to 39-year-olds, the prevalence increased from 2.1 to 3.7 percent during the same period (a 69.9 percent rise); for 40- to 49-year-olds, the rate grew from 3.6 to 5.1 percent; in the group aged 50 to 59 years, the prevalence rose from 7.5 to 9.8 percent; and 60- to 69-year-olds saw an increase in diabetes prevalence from 10.9 to 12.8 percent over the period (Mokdad et al., 2000).
The prevalence of congestive heart failure was higher among people aged 40 to 65 years for the period 1988 to 1991 than among people in this age group from 1976 to 1980, with roughly twice as many people at each age experiencing this condition in the later time frame compared with the prevalence in the earlier period (NHLBI, 1996).
Although the recent rise in obesity has attracted considerable attention, growth in weight is not a recent or short-lived phenomenon. Costa and
Steckel (1997) documented large secular gains in average height-adjusted weight for men in different birth cohorts over the last century. Height-adjusted weight for people in their 40s, the age group with the highest labor force attachment, has increased by nearly 4 body mass index units (kilograms per square meter) over this period. To put this into perspective, an increase of this magnitude in the height-adjusted weight of a 6-foot-tall man would require a weight gain of approximately 30 pounds. Similar gains in weight are true for women and children (Bhattacharya and Currie, 2001).
Conversely, both the prevalence of arthritis and the prevalence of activity limitations caused by arthritis decreased for working-age people between 1989 to 1991 and 1997. In the earlier period, self-reported arthritis was noted by 6.6 percent of 25- to 34-year-olds, 12.7 percent of 35- to 44-year-olds, 22.6 percent of 45- to 54-year-olds, and 36.5 percent of 55- to 64-year-olds, whereas the proportions of individuals in these age groups limited in activity were 0.6, 1.5, 3.5, and 7.1 percent, respectively (CDC, 1994). In the later period, 5.5 percent of 25- to 34-year-olds had arthritis, whereas 10.5 percent of 35- to 44-year-olds, 19.4 percent of 45- to 54-year-olds, and 29.7 percent of 55- to 64-year-olds had the condition. Their activity limitation rates due to arthritis were 0.5, 1.3, 2.1, and 5.2 percent, respectively (CDC, 1997). Boult and colleagues (1996) note that a 1 percent biannual decrease in arthritis could result in 4 million person-years of increased activity limitations between the years 2001 and 2049.
The overall prevalence of disability (defined as an inability to work) among the working-age population aged 25 to 34 years decreased from 4.4 percent in 1988 to 3.6 percent in 1998, but during this period it increased from 5.9 to 7.0 percent for 35- to 44-year-olds, from 9.1 to 10.7 percent for 45- to 54-year-olds, and from 15.6 to 16.4 percent for 55- to 61-year-olds (McNeil, 2000). There is no published literature on disability trends in younger populations over this same time period when disability is defined in terms of an inability to perform ADLs or IADLs.
Chronic conditions have long been known to be an important cause of disability (see, e.g., Colvez and Blanchet, 1981). In 1972, the Social Security Administration Survey of Disabled and Nondisabled Adults indicated that 15 percent of the noninstitutionalized population aged 20 to 64 years reported being disabled because of a chronic condition, with women affected in larger proportions than men (Krute and Burdette, 1978). Twenty years later, in 1991–1992, SIPP data showed that 5.1 percent of 16- to 67-year-olds had a work disability that prevented them from working; in 1997, 5.6 percent of 16- to 64-year olds had a work disability that prevented them from working—an approximately 10 percent increase over the 6-year period (but note the 3-year difference in the upper ends of the reported age ranges) (McNeil, 1993, 2001).
Chronic conditions that were responsible for a great deal of work
limitation in 1992 include heart disease, which accounted for 10.9 percent of people aged 18 to 69 years who had a work limitation in that year; arthritis, which was responsible for 8.3 percent of chronic conditions in this niche; respiratory diseases, which 5.6 percent of this group encountered; and diabetes, which caused work limitation in 3.3 percent of the segment (see the findings of Stoddard et al. [1998], based on 1992 NHIS data). There has been an upward trend in the proportion of diabetic working-age adults who report activity limitations. Among 20- to 44-year-olds with diabetes in 1964, 31.9 percent group indicated having activity limitations; this figure increased to 48.3 percent in 1989 for 18- to 44-year-olds. In the diabetic group aged 45 to 64 years, 46.4 percent had activity limitations in 1964, yet 54.7 percent of this same age group had similar limitations in 1989 (Songer, 1995).
Overall, there is much reason for concern over the fact that some important chronic diseases have become more prevalent in working-age populations. Although intuitively it seems plausible that these chronic disease trends can explain some of the rise in ADL-style disability that we reported above, it is not clear from the literature how much can be so explained. The purpose of the rest of the paper is to derive this figure.
DATA
The yearly NHISs provide a nationally representative set of individual-level data on demographics and health status that are designed to represent the noninstitutionalized population. Data have been collected every year since 1957. The stability of the NHIS design makes it particularly attractive for the analysis of long-term trends in disability. Although the survey was redesigned in 1982 and 1997, it is possible to construct quantitatively consistent estimates for the years from 1984 to 1996.
Before 1982, the NHIS disability data were based on an activity limitation variable. NHIS asked respondents whether their health limited their ability to perform work or housework. From their answers, they were then grouped into four categories: (1) unable to perform work or housework; (2) limited in the kind or the amount of work or housework; (3) limited in other activities, besides work or housework; or (4) not limited in any activities. After 1982, NHIS continued to ask the same question, but with one subtle difference. Retirees aged 45 years and older were asked different questions before and after 1982. Before that year, retirees were asked if their health would prevent them from working. Beginning in 1982, they were asked if their health interfered with their major activity, which need not be working. Not surprisingly, therefore, the reported rates of activity limitation among older individuals fell substantially in 1982 because elderly retirees are allowed to report a less strenuous major activity.
After 1982, however, NHIS asks a different question more appropriate for the analysis of disability. The survey began asking all respondents over age 60 years, as well as all of those aged 5 to 59 years who reported some activity limitation, if they need help with personal care.3 This question is preferable to an activity limitation question, in which individuals are allowed to choose their major activity. Because more disabled individuals tend to report a less strenuous major activity, the activity limitation question tends to understate the absolute value of changes in disability. On the basis of a respondent’s answer to the personal care question, he or she was placed in one of two categories: (1) unable to perform personal care needs or limited in performing other routine needs or (2) not limited in personal care or routine needs. Use of the responses to this question provides consistent measures of disability from 1984 to 1996.
NHIS also asks its respondents to answer a battery of questions regarding their medical histories. Among these questions are included probes about the presence of chronic disease. Most of these questions are asked in the form, “Has a doctor ever told you that you have [disease x]?” There is some legitimate concern that this method of asking about the prevalence of disease conditions might undersample people who are less likely to seek medical attention. If this is indeed the case, then the estimates that we present are underestimates of the true influence of chronic disease on disability.
Between 1984 and 1996, the NHIS questionnaire did not ask each of its respondents all the questions about disease prevalence. Instead, it separated the list of disease-related questions into six different condition lists and then randomly assigned each respondent to respond to one of the six condition lists. One consequence of this sampling strategy is that we cannot use data from NHIS to obtain information about whether, for example, a respondent has both hypertension and arthritis. Because these conditions are on different condition lists, the same respondent is never asked about both of these conditions. However, the condition lists were constructed so that diseases that frequently occur together in the population (such as hypertension and heart disease) were placed in the same condition list. Thus, we can use the data from NHIS to measure the covariance of commonly co-occurring conditions.
METHODS
In this section, we briefly describe our decomposition of disability trends into two parts: disability attributable to changes in the prevalence of chronic disease and disability attributable to changes in the prevalence of disability among those with chronic diseases. A central challenge that we face is that there is no large national database of data from a survey that is repeatedly administered and that has samples large enough to state with any confidence how disability and chronic disease have changed within single-year age categories. To compensate for this fact, we combine information across age groups, using a well-specified smoothing technology. To learn about 60-year-olds, we take into account what happened to 59- and 61-year-olds with equal weight, 58- and 62-year-olds with less weight, and so on.4 We elaborate on this basic strategy in Addendum A.
With this smoothing technology in hand, we describe our strategy for decomposing disability trends. Our aim is to determine the extent to which age-specific trends in disability can be explained by the observed trends in chronic health. Presumably, whatever is left over is explained by trends in other determinants of disability prevalence, such as public policy and (mechanically) by disability trends among those with no chronic illness.
Let Dt be a dummy variable indicating disability at time t, and let Ct be a dummy variable indicating chronic illness at time t. A basic law of probability allows us to decompose the probability (P) (or, equivalently, prevalence) of disability into one part attributable to the chronically ill population and another part attributable to the non-chronically ill population (pop.):
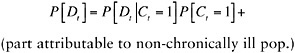
(F-1)
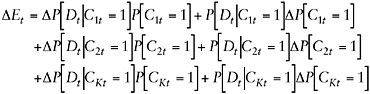
Using Equation F-1, we can write the change in disability prevalence between t – 1 and t, ![]() , as follows:
, as follows:
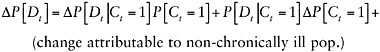
(F-2)
Each term in Equation F-1 contributes two terms to Equation F-2: a term that reflects the change due to a change in the prevalence of chronic conditions and a term that reflects the change due to a change in the probability of disability among those with chronic conditions. We apply our smoothing technology to estimate how each of these terms has evolved over time in NHIS. In Addendum B, we extend this framework to account for changes in multiple chronic conditions.
The set of chronic diseases that we consider include all of the most common causes of severe ADL disability: arthritis, asthma, cancer, chronic obstructive pulmonary disease (COPD), diabetes, hypertension, heart disease, stroke, and obesity.5 The set of jointly occurring conditions that we consider include heart disease and hypertension, diabetes and hypertension, hypertension and stroke; heart disease and stroke, and all conditions interacted with obesity. The last set of interactions is possible because NHIS does not ask about body height or body weight within one of the six randomly assigned condition lists; rather, it asks about these variables in a part of the questionnaire that asks questions of all respondents.
RESULTS
In this section, we present our decomposition of the trends in disability prevalence between 1984 and 1996, as measured by the inability to perform personal care tasks. Recall Table F-1, which shows an increasing prevalence of disability among populations under age 60 years over that time period. We focus on trends between 1984 and 1996 because Table F-1 shows either small or mixed changes in the prevalence of disability between 1997 and 2000. We do not analyze routine needs disability trends here because the results are similar to the personal care disability trends that we do present here.
Table F-2 presents an overview of our results. It shows, in aggregate, the extent to which changes in smoothed disability prevalence between 1984 and 1996 can be attributed to chronic disease trends. Given our discussion to this point, it should not be surprising that the top row of Table F-2 shows increases in total disability prevalence over this period for 30- and 45-year-olds (by 20 and 46 cases per 10,000 population, respectively) and decreases for 60-year-olds (by 89 cases per 10,000).
The next rows of Table F-2 show that chronic illness plays a critical role in explaining these changes in disability prevalence. Among 30-year-
TABLE F-2 A Decomposition of Changes in the Prevalence of Disability Due to Chronic Disease, 1984 to 1996
olds with chronic disease, disability rates rose by 61 cases per 10,000 population. About 24 of these cases can be attributed to changes in the prevalence of chronic illness, and 37 of these cases can be attributed to changes in the prevalence of disability among the chronically ill population. Among 45-year-olds with chronic disease, the prevalence of disability rose by 100 cases per 10,000. About 43 of those cases are attributable to changes in the prevalence of chronic disease, and 57 are attributable to changes in the prevalence of disability among the chronically ill population. Among 60-year-olds with chronic disease, disability rates actually fell by 27 cases per 10,000. Changes in the prevalence of chronic disease alone would have caused an increase in the prevalence of disability by 38 cases per 10,000. However, the prevalence of disability among the chronically ill population decreased dramatically, causing a decline in the attributable disability prevalence by 66 cases per 10,000.
The bottom row of Table F-2 shows how much of these changes in disability prevalence are attributable to non-chronically ill populations. The results are striking: there were large declines in the prevalence of disability in these populations for all age groups. In other words, if chronic disease prevalence and disability prevalence among the chronically ill population had remained constant between 1984 and 1996, there would have been declines in overall disability prevalence by 41, 53, and 62 cases per 10,000 population for 30-, 45-, and 60-year-olds, respectively.
Tables F-3, F-4, and F-5 present, in some detail, the results of our decomposition for 30-, 45-, and 60-year-olds, respectively. The data in these tables were estimated by using smoothed versions of the probabilities
TABLE F-3 A Decomposition of Changes in the Prevalence of Disability for 30-Year-Olds Due to Chronic Disease, 1984 to 1996
listed in Equation F-2 for each chronic condition evaluated at the age indicated. The first data column in each table shows how much of the total change in disability prevalence is due to the change in the prevalence of chronic disease j between 1984 and 1996. The second data column shows how much of the total change in disability prevalence is due to the change in disability rates among those who have condition j in absolute terms. The last two data columns show the sum of those smoothed probabilities in absolute terms and as a percentage of the total change attributable to chronic disease. These last two columns represent the total contribution of changes in condition j on changes in disability prevalence.
Table F-3 shows the decomposition for 30-year-olds. The single largest
TABLE F-4 A Decomposition of Changes in Disability Prevalence for 45-Year-Olds Due to Chronic Disease, 1984 to 1996
source of increased chronic disease prevalence resulting in disability among 30-year-olds is an increase in obesity. If the prevalence of all other chronic diseases had stayed the same while obesity rates increased, as they actually did, our decomposition suggests that the disability rates in this age group would have risen by 20 cases per 10,000 population. This calculation ignores the increase in the prevalence of obese individuals with other chronic diseases. Thus, the increasing prevalence of obesity by itself explains a third of the rise in disability in this group.
TABLE F-5 A Decomposition of Changes in Disability Prevalence for 60-Year-Olds Due to Chronic Disease, 1984 to 1996
Table F-3 also shows that increases in the probability of disability among the chronically ill population are an important source of the overall rise in disability. Increases in disability rates among heart disease patients explain 20 percent of the overall rise attributable to chronic disease, whereas increases in disability rates among obese heart disease patients explain a further 35 percent of the overall rise. Heart attack survival rates increased substantially over this period. Our evidence suggests that improvements in therapy kept people alive but increasingly in a disabled state, at least for 30-year-olds. Increases in disability rates among asthma and hypertension patients also explain 10 and 13 percent of the rise, respectively. Stroke patients were more likely to be disabled in 1996 than they were in 1999, providing evidence of improvements in care for stroke patients.
Table F-4 shows the results of our decomposition for 45-year-olds. As was the case for 30-year-olds, Table F-3 shows that obesity is a major source of the increase in disability in this group, explaining 30 percent of the overall increase in disability. The increase in the prevalence of obese individuals with arthritis, diabetes, or hypertension together explains a further 20 percent of the overall rise. The increase in the prevalence of individuals with stroke and hypertension explains 12 percent of the overall rise.
Table F-4 also shows that (by holding disease prevalence fixed) increases in the prevalence of disability among individuals with COPD (21 percent of the overall increase), hypertension (24 percent), and asthma (9 percent) are also important sources of rising rates of disability in this group. Obese individuals with diabetes in this age group are also increasingly likely to be disabled. Increasing disability in the latter group explains a further 14 percent of the overall increase in disability attributable to the chronically ill. As was the case for 30-year-olds, there is evidence of improvements in disability rates among some subsets of the chronically ill population. For example, 45-year-old stroke patients and patients with both asthma and COPD were less likely to be disabled in 1996 than they were in 1984. In contrast to the findings for the 30-year-olds, 45-year-old nonobese heart disease patients with no history of hypertension were also less likely to be disabled in 1996 than they were in 1984.
Table F-5 shows our decomposition for 60-year-olds. For 60-year-olds with chronic disease, obesity is again the largest single source of increasing chronic disease prevalence that results in increasing disability, although asthma and stroke are also important sources. The declining prevalences of hypertension and heart disease, on the other hand, play important roles in the overall decline in the prevalence of disability for this age group. Table F-5 shows, with few exceptions, that the disability rates among the chronically ill population declined substantially. In particular, disability among patients with asthma, diabetes, heart disease, hypertension, stroke, and
obesity declined by 8, 32, 18, 25, 14, and 21 cases per 10,000 population, respectively. However, disability among patients with both heart disease and hypertension rose by 14 cases per 10,000; among obese individuals with hypertension, disability rose by 62 cases per 10,000. Similarly, disability rose among patients with arthritis (3 cases per 10,000) and with COPD (22 cases per 10,000).
Although the results that we present here may seem to tell a complicated story, they can be summarized simply. With the exception of an increasing prevalence of obesity, changes in chronic disease prevalence cannot account for the increasing prevalence of disability in the population under age 60 years. Within chronically ill populations, however, people were more likely to be disabled in 1996 than they were in 1984. Thus, the two main sources of increasing disability among those under age 60 years are increases in the numbers of obese individuals and an increasingly disabled chronically ill population.
DISCUSSION AND CONCLUSIONS
Although previous literature has established rising disability rates in younger populations and falling disability rates in older populations (results that we confirm), the decomposition estimated in this paper is a starting point in understanding why the prevalence of disability has moved as it has. Our main results are as follows:
-
Between 1984 and 1996, the rising prevalence of obesity has been an important source of the rise in the prevalence of disability for all age groups that we examined.
-
Among populations in age groups under age 60 years, changes in the prevalence of other chronic diseases (including heart disease, hypertension, diabetes, and cancer) have had a mixed or small impact on overall disability rates.
-
Among populations in age groups under age 60 years, chronically ill populations were substantially more likely to be disabled in 1996 than they were in 1984, whereas non-chronically ill populations were substantially less likely to be disabled in 1996 than in 1984.
-
Among populations in age groups ages 60 years and older, both chronically ill and non-chronically ill populations were less likely to be disabled in 1996 than they were in 1984.
One important limitation in our work is that we do not explicitly measure the effect on disability rates of trends in some conditions that afflict working-age populations, including traumatic brain injuries, multiple sclerosis, mental retardation/developmental disability, blindness, and
depression. In our methodology, individuals with these conditions for whom measurements were not obtained are treated as if they were not chronically ill. This limitation suggests a reinterpretation of our finding that non-chronically ill populations have become substantially less disabled over time. What this finding really means is that non-chronically ill populations, alongside populations of individuals with conditions that we did not measure, have become substantially less disabled over time.
Even if an increase in disability prevalence meant nothing more than an increase in the set of people unable to perform basic activities like dressing themselves, such increases would be a source of considerable concern, at least to newly disabled individuals and their caretakers. The well-established link between disability prevalence and medical care expenditures by the elderly population heightens the importance of this phenomenon: disability is closely linked to public expenditures on health insurance. In the remainder of this section, we consider some of the consequences of our findings for future Medicare expenditures.
The well-documented decline in disability among older populations over the past 25 years has led some authors to forecast projections of future Medicare expenditures substantially more optimistic than those that would be predicted if disability trends were ignored (see, e.g., Pardes et al., 1999; Manton and Gu, 2001). Such optimistic forecasts have been criticized because disability rates have been increasing among younger populations (Lakdawalla et al., 2003a, 2004). As these younger populations age into eligibility for Medicare and if they remain increasingly disabled, then future cohorts of elderly individuals may not enjoy further declines in disability. Accounting for both the rising rates of disability among younger populations and the falling rates of disability among older populations results in considerably less optimistic forecasts of future spending on Medicare. A key issue related to the accuracy of these alternate forecasts relates to the permanence of disability. If the development of disability at younger ages augurs disability at older ages, then the less optimistic forecasts are correct. On the other hand, if the disability that develops at younger ages is transitory, then the original optimistic forecasts are more likely true.
The decomposition of disability trends reported in this paper is directly germane to the permanence of disability in younger populations. We emphasize two different sources of the changes in disability: (1) changes in the prevalence of chronic disease and (2) changes in the probability of disability among chronically ill populations. If chronic disease prevalence is a major source of the rise in the prevalence of disability, then the rise in disability is more likely to be permanent. Because most chronic illnesses are permanent, unless these diseases cause younger populations to die at substantial rates before the age of 65 years (although given rising
life expectancies and improved medical technologies, this is not likely to be the case), the rising disability rates caused by an increasing prevalence of chronic disease implies permanent increases in disability. With the exception of a rising prevalence of obesity, we find that the rising prevalence of chronic disease does not, on net, explain the rise in disability among populations between 18 and 59 years old; hence, we do not find empirical support for this particular argument that the changes in disability are permanent.
We do, however, find that the increasing prevalence of obesity is an important source of the rise in disability among younger populations. Of course, an individual who becomes obese does not necessarily remain so forever; that is, weight loss is possible, although it is difficult. However, a case can be made that once an obese individual has a disability, it can be hard to recover, so this result buttresses the argument that the changes in disability are permanent. In the case of obesity, though, this argument is further complicated by the fact that the health effects of increased body weight are different for the younger and the older populations. In older populations, increased body weight can sometimes be protective against conditions that commonly lead to disability (for example, the increased bone density that accompanies increased weight leads to fewer hip fractures).
Alternatively, if rising rates of disability among chronically ill populations (as opposed to rising chronic disease prevalence) are a major source of the rise in the prevalence of disability, then the overall rise in the prevalence of disability may or may not be permanent, depending on why the chronically ill are more likely to be disabled. A rising prevalence of disability due to this source suggests strongly that a chronically ill population is sicker now than it was before, but this fact does not establish the cause and may be due to a number of reasons. For example, the rising prevalence of disability among the chronically ill population may be due to improved medical care; that is, chronically ill people who otherwise would have died when they were treated with the old technology are kept alive with the new technology but are in a disabled state. On the other hand, perhaps the chronically ill population is sicker for reasons that have little to do with technological changes. For example, an increasingly obese populace might produce both more diabetics and a more severely ill diabetic population. Whether these changes in the chronically ill population result in permanent increases in the prevalence of disability and what effect these changes will have on the disability rates of future elderly cohorts are empirical issues that require further research. In any case, it should be clear that accurate forecasts of future Medicare expenditures cannot be constructed by ignoring the increasing prevalence of disability among younger populations.
ADDENDUM A: ESTIMATING CHANGES IN AGE-PREVALENCE CURVES
To describe the method that we use to produce smooth age-specific prevalence functions—the overlap polynomial method6—it is helpful to introduce some notations. Let N represent the number of observations in the data set. Each observation i taken in yeari consists of information about i’s self-reports regarding disability limitations (di) and age (agei).7 Given these data, we estimate the following logit model of disability prevalence using each year of data available:
(F-A-1)
where β1, β2, and β3 are parameters to be estimated, g1 is the overlap polynomial in age, and g2 is the overlap polynomial in year.
In effect, we calculate the prevalence of disability at each age and year in the context of a logistic distribution. The g functions allow the presence of disability to vary flexibly with the year of observation and the age cohort of the respondent. Age and year enter the model through the g functions, which are specified by using an overlap polynomial.
The age polynomials are defined as
(F-A-2)
where pj(agei;β1j) j = 0,….,K + 1 are all nth-order polynomials in agei.8 The terms k0 … kK + 1 are called “knots,” and σ1 is a smoothing parameter; all of these are fixed before estimation. With this smoothing technique, the knots define the age intervals. When the value of the smoothing parameter approaches 0, the age profile over each interval simply equals the average disability level within that interval. In this case, the age profile reduces to a step function, in which each interval constitutes a separate step. As the smoothing parameter increases, the estimator uses increasingly more information from outside each interval. In the extreme, as the smoothing param-
eter approaches infinity, there is no meaningful distinction between any two intervals. The allowance of nonzero values for the smoothing parameters eliminates the sharp discontinuity of the growth rates at the knots. One advantage of the use of overlapping polynomials over the use of traditional splines is that the function and all its derivatives are automatically continuous at the knots, without the imposition of any parameter restrictions.
The overlap polynomial for year g2 and its interaction with g1 allow flexible changes in the age-prevalence relationship over time. It is defined as
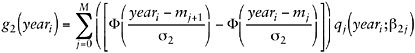
(F-A-3)
As before, the m terms represent the knots, while the σ term represents the smoothing parameter.
The object of the maximum-likelihood logit estimation is to obtain consistent estimates for β1, β2 and β3. By using these estimates, it is straight-forward to generate age-prevalence profiles representative for any particular year. Let ρt,a be the disability prevalence among a-year-olds in year t. Then,
(F-A-4)
APPENDUM B: DECOMPOSING CAUSES OF CHANGES IN AGE-SPECIFIC DISABILITY
The aim here is to determine the extent to which age-specific trends in disability can be explained by observed trends in chronic health. Presumably, whatever is left over is explained by trends in other determinants of the prevalence of disability, such as public policy and (mechanically) by disability trends among those with no chronic illness.
For each person i (suppressed for clarity), let Dt be a dummy indicating self-reported disability at time t and let Ct = {C1t, C2t,…,CKt} be a vector of dummy variables, each of which indicates whether a particular chronic condition is present and observed (by the econometrician) at time t. For illustration, consider just the first chronic condition, C1t. The probability of disability can be written as follows:
(F-A-5)
The proportion of the people with disabilities that is attributable to people with C1t is simply the first of two terms in the previous equation, whereas the second term is the proportion of the people with disabilities that is attributable to people without C1t (although these people may have other chronic conditions or may report being disabled because of public policy, accidents, or other health trends). Using Equation F-A-5, we can decompose the change in disability prevalence between t – 1 and t, ![]() , as follows:
, as follows:
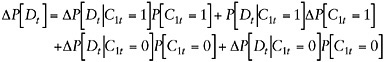
(F-A-6)
Each term in Equation F-A-5 contributes two terms to Equation F-A-6: a term that reflects the change due to a change in the prevalence of the condition and a term that reflects the change due to a change in the probability of disability among those with the condition.
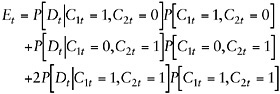
Now, let Et be the portion of disability prevalence that can be explained by the chronic conditions in Ct when they are observed singly. Define Et as a generalization of the first term in Equation F-A-5:
(F-A-7)
Let ΔEt be the portion of the change in disability prevalence between t – 1 and t that can be explained by the chronic conditions in Ct:
(F-A-8)
To show how Et and P[Dt] are related, consider the case in which the presence of only two chronic conditions are observed (i.e., K = 2). In that case, the proportion of disability attributable to each of the conditions can be decomposed as follows:
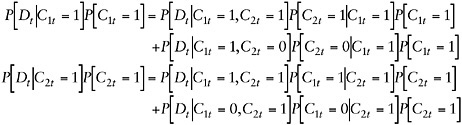
(F-A-9)
Notice that the first terms of both decompositions in Equation F-A-9 are identical and represent the contribution of people who have both chronic conditions to the prevalence of disability. For this case of K = 2, note that ![]() Thus,
Thus,
(F-A-10)
On the other hand, the true probability of disability attributable to the two conditions, ![]() , can be decomposed as follows:
, can be decomposed as follows:
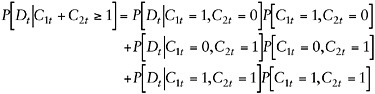
(F-A-11)
By comparing Equations F-A-10 and F-A-11, it is evident that Et over-estimates the portion of disability attributable to chronic conditions by the joint prevalence term, ![]() . That is, by taking each of the observed chronic conditions singly, Et produces an upper bound on how much disability prevalence can be explained by chronic health conditions. It is easy to generalize this argument to more than two conditions, although the proof requires the introduction of some cumbersome notation, so it is omitted here. The principle is the same, though: Et
. That is, by taking each of the observed chronic conditions singly, Et produces an upper bound on how much disability prevalence can be explained by chronic health conditions. It is easy to generalize this argument to more than two conditions, although the proof requires the introduction of some cumbersome notation, so it is omitted here. The principle is the same, though: Et
overcounts disability compared with that counted by  because it includes too many joint prevalence terms. Thus, in Equation F-A-8, ΔEt measures how an upper bound (to the contribution of observed trends in chronic conditions to disability) changes over time.
Although it would be attractive to use Equation F-A-11 to evaluate exactly how the trends in chronic health conditions explain trends in disability, for practical reasons it is not possible to do so. In particular, implementation of our strategy by use of Equation F-A-11 would require large amounts of data for people with every conceivable set of multiple conditions. In practice, this is impossible because there are many combinations of conditions that are rare in the population. Also, as we note above, NHIS does not ask all people about all chronic conditions; rather, it randomly assigns each respondent to respond to one of six condition lists.
On the other hand, we can implement the main insight of Equation F-A-11 by expanding the condition set that we consider to include all common combinations of conditions. For example, because diabetes in combination with heart disease is common, we include three conditions in our calculations from this set: diabetes with heart disease, diabetes alone, and heart disease alone. By doing this we limit the error due to overcounting for all the common disease combinations.
REFERENCES
ALA (American Lung Association, Epidemiology and Statistics Unit). (2002a) Trends in Chronic Bronchitis and Emphysema: Morbidity and Mortality. Online. (The link is no longer available. For the most recent data, go to http://www.lungusa.org/atf/cf/{7A8D42C2-FCCA-4604-8ADE-7F5D5E762256}/COPD1.pdf. Last accessed September 23, 2005.)
ALA. (2002b) Trends in Asthma Morbidity and Mortality January 2001. Online. (The link is no longer available. For the most recent data, go to http://www.lungusa.org/atf/cf/{7A8D42C2-FCCA-4604-8ADE-7F5D5E762256}/ASTHMA1.PDF. Last accessed September 23, 2005).
Autor D, Duggan M. (2001). The Rise in Disability Recipiency and the Decline in Unemployment. Working Paper 8336. Cambridge, MA: National Bureau of Economic Research.
Berry J, Hardman M. (1998) Lifespan Perspectives on the Family and Disability. Needham Heights, MA: Allyn & Bacon.
Bhattacharya J, Currie J. (2001) Youths and nutritional risk: malnourished or misnourished? In Risky Behavior among Youths. Gruber J (ed.). Chicago, IL: University of Chicago Press.
Bierman A. (2001) Activity status: the sixth vital sign. Journal of General Internal Medicine (16):785–786.
Boult C, Altmann M, Gilbertson D, Yu C, Kane R. (1996) Decreasing disability in the 21st century: the future effects of controlling six fatal and nonfatal conditions. American Journal of Public Health 86(10):1388–1393.
Bound J, Waidmann T. (2000) Accounting for Recent Declines in Employment Rates among the Working-Aged Disabled. Working Paper 7975. Cambridge, MA: National Bureau of Economic Research.
CDC (Centers for Disease Control and Prevention). (1994) Arthritis prevalence and activity limitations—United States, 1990. Morbidity and Mortality Weekly Report 43(24):433–438.
CDC. (1997) Trends in the prevalence and incidence of self-reported diabetes mellitus—United States, 1980–1994. Morbidity and Mortality Weekly Report 46(43):1014–1018.
Colvez A, Blanchet M. (1981) Disability trends in the United States population 1966–76: analysis of reported causes. American Journal of Public Health 71(5):464–471.
Costa DL, Steckel RH. (1997) Long-term trends in health, welfare, and economic growth in the United States. In Health and Welfare during Industrialization. Floud R, Steckel RH (eds.). Chicago, IL: University of Chicago Press, pp. 47–89.
Crimmins EM. (2004) Trends in the health of the elderly. Annual Review of Public Health 25:79–98.
Crimmins EM, Saito Y, Ingegneri D. (1989) Changes in life expectancy and disability-free life expectancy in the United States. Population and Development Review 15(2):235–267.
Crimmins, EM, Saito Y, Reynolds SL. (1997) Further evidence on recent trends in the prevalence and incidence of disability among older Americans from two sources: the LSOA and the NHIS. Journal of Gerontology 52B(2):S59–S71.
Freedman VA, Martin LG. (1998) Understanding trends in activity limitations among older Americans. American Journal of Public Health (88):1457–1462.
Freedman VA, Martin LG. (2000) Contribution of chronic conditions to aggregate changes in old age functioning. American Journal of Public Health 90(11):1755–1760.
Freedman VA, Crimmins E, Schoeni RF, Spillman BC, Aykan H, Kramarow E, Land K, Lubitz J, Manton K, Martin LG, Shinberg D, Waidmann T. (2004) Resolving inconsistencies in trends in old-age disability: report from a technical working group. Demography 41(3): 417–441.
Fries JF. (1980) Aging, natural death, and the compression of morbidity. New England Journal of Medicine (303):130–135.
Garber A and MaCurdy T. (1993) Nursing home discharges and the exhaustion of Medicare benefits. Journal of the American Statistical Association (88):727–736.
Gruenberg EM. (1977) The failures of success. Milbank Memorial Fund Quarterly 55(1):3–34.
Knoblauch B, Sorenson B. (1998) IDEA’s Definition of Disabilities. ERIC Digest E560. Online. http://www.ed.gov/databases/ERIC_Digests/ed429396.html. Last accessed September 29, 2002.
Krute A, Burdette ME. (1978) 1972 Survey of disabled and nondisabled adults: chronic disease, injury, and work disability. Social Security Bulletin 41(4):3–17.
Lakdawalla D, Goldman D, Bhattacharya J, Hurd M, Joyce G, Panis C. (2003a) Forecasting the nursing home population. Medical Care 41(1):8–20.
Lakdawalla D, Goldman D, Bhattacharya J, Hurd M, Joyce G, Panis C. (2003b) A response to the points by Manton and Williamson on forecasting the nursing home population. Medical Care 41(1):28–31.
Lakdawalla D, Bhattacharya J, Goldman D. (2004) Are the young becoming more disabled? Health Affairs 23(1):168–176.
Manton KG. (2003) Forecasting the nursing home population. Medical Care 41(1):21–24.
Manton, KG, Gu X. (2001) Changes in the prevalence of chronic disability in the United States black and nonblack population above age 65 from 1982 to 1999. Proceedings of the National Academy of Sciences USA 98(11):6354–6359.
Manton KG, Corder L, Stallard E. (1993). Estimates of change in chronic disability and institutional incidence and prevalence rates in the U.S. elderly population from the 1982, 1984, and 1989 national long term care survey. Journal of Gerontology: Social Sciences 48(4):S153–S166.
Manton KG, Corder L, Stallard E. (1997) Chronic disability trends in elderly United States populations: 1982–1994. Proceedings of the National Academy of Sciences USA (94):2593–2598.
Marshak LE, Seligman M, Prezant F. (1999) Disability and the Family Life Cycle: Recognizing and Treating Developmental Challenges. New York: Basic Books.
McKinlay JB, McKinlay SM, Beaglehole R. (1989) A review of the evidence concerning the impact of medical measures on recent mortality and morbidity in the United States. International Journal of Health Services 19(2):181–208.
McNeil JM. (1993) Americans with Disabilities: 1991–92. Current Population Reports, P79-33, U.S. Bureau of the Census. Online. http://www.bls.census.gov/sipp/p70-33.pdf. Last accessed September 23, 2005.
McNeil JM. (2000) Employment, Earnings, and Disability. Paper prepared for the 75th Annual Conference of the Western Economic Association International, Vancouver, British Columbia, Canada, June 29–July 3.
McNeil JM. (2001) Americans with Disabilities: 1997. Current Population Reports, P79-33, U.S. Bureau of the Census. Online. http://www.bls.census.gov/sipp/p70s/p70-73.pdf. Last accessed September 23, 2005.
Mokdad AH, Ford ES, Bowman BA, Nelson DE, Engelgau MM, Vinicor F, Marks JS. (2000) Diabetes trends in the U.S.: 1990–1998. Diabetes Care 23(9):1278–1283.
Newacheck, PW, Halfon N. (2000) Prevalence, impact, and trends in childhood disability due to asthma. Archives of Pediatrics and Adolescent Medicine 154(3):287–293.
NHLBI (National Heart, Lung, and Blood Institute). (1996) Data Fact Sheet: Congestive Heart Failure in the United States: A New Epidemic. Bethesda, MD: U.S. Department of Health and Human Services.
Pardes H, Manton KG, Lander ES, Tolley HD, Ullian AD, Palmer H. (1999) Effects of medical research on health care and the economy. Science 283:36–37.
Reynolds SL, Crimmins EM, Saito Y. (1999) Cohort differences in disability and disease presence. The Gerontologist 38(5):578–590.
SSA (U.S. Social Security Administration). (2005) Social Security Disability Planner. Online. http://www.ssa.gov/dibplan/dqualify4.htm. Last accessed September 23, 2005.
Schoeni RF, Freedman VA, Wallace RB. (2001) Persistent, consistent, widespread, and robust? Another look at recent trends in old-age disability. Journal of Gerontology 56(4):S206– S218.
Songer TJ. (1995) Disability in diabetes. In Diabetes in America, 2nd ed. National Diabetes Data Group. Washington, DC: U.S. Government Printing Office.
Stoddard, S., L. Jans, J. Ripple, L. Kraus. (1998) Chartbook on Work and Disability in the United States, 1998. Washington, DC: U.S. National Institute on Disability and Rehabilitation Research.
Stone, DA. (1984) The Disabled State. Philadelphia, PA: Temple University Press.
USDOL (U.S. Department of Labor, Office of Disability Employment Policy). (2005) How Does the Federal Government Define ‘Disability’? Online. http://www.dol.gov/odep/faqs/federal.htm. Last accessed September 23, 2005.
USEEOC (U.S. Equal Employment Opportunity Commission). (1995) Executive Summary: Compliance Manual Section 902, Definition of the Term Disability. Online. http://www.eeoc.gov/policy/docs/902sum.html. Last accessed September 23, 2005.
Waidmann T, Bound J, Schoenbaum M. (1995) The illusion of failure: trends in the self-reported health of the U.S. elderly. Milbank Quarterly 73(2):253–287.
Wolf A, Colditz G. (1998) Current estimates of the economic cost of obesity in the United States. Obesity Research 6(2):97–106.


