2
The Instrumental Record
|
Most surface temperature reconstructions depend in some way on the instrumental surface temperature record. Individual and multiproxy reconstructions based on annually or seasonally resolved proxy data use this record for both calibration and validation. Other types of reconstructions—for instance, those derived from glacier lengths and borehole measurements—implicitly use local instrumental records to help develop the physical model used to turn the proxy record into a temperature record. Hence, it is useful to briefly describe the instrumental record and discuss its features and uncertainties before examining the manner in which it is employed in surface temperature reconstructions.
INSTRUMENTAL DATA
The instrumental surface temperature record (“instrumental record”) is derived from traditional thermometer readings and provides the basis for generating the large-scale (global mean or hemispheric mean) surface temperature estimates used in climate change studies. The global average temperature is produced as a combination of near-surface land air temperatures and temperatures of the sea water near the surface (or sea surface temperatures [SSTs]) for the oceans. Land air temperatures are measurements taken by thermometers mounted in shelters about 1.5 meters above the land surface, or higher in areas where snow cover may be substantial. About 2,000 stations report land air temperatures for the global compilations shown in this chapter. The stations are not spatially distributed to monitor all land areas with equal density; unpopulated and undeveloped areas have always tended to have poor coverage.
SSTs are measured by ships, buoys, bathythermograph profilers, and, since 1981, satellites. Ships generally take the water temperature in one of three ways: buckets (the oldest method), hull sensors, and water drawn in to cool the engines (injection temperatures). The depths of ship measurements vary from 1 to 15 meters. Buoys are more standardized and report temperatures generally at 1 meter as well as several other depths depending on the buoy type.
Very few land air temperature records begin prior to 1856, so estimates of large-scale (i.e., global and hemispheric) averages are uncertain before that time. The average SST for all oceans is less well known than land air temperature, especially during the middle to late 19th century, when large portions of the tropical and southern oceans were poorly sampled (and these areas remain comparatively undersampled). Differences in the types of measurement methods, the generally unknown calibration of instruments, and the sparse geographic and temporal sampling in many areas contribute to uncertainties in the estimates of large-scale averages. In addition, the proxy indicators discussed in Chapters 3–8 are generally not directly sensitive to 1.5 meter air temperature. For example, borehole temperature profiles are sensitive to the ground surface temperatures, and ice isotopic ratios are sensitive to cloud-level atmospheric temperatures. Significant systematic differences can exist between temperatures at such different elevations with respect to ground, and these differences represent one of the inherent uncertainties in performing surface temperature reconstructions.
FEATURES OF THE INSTRUMENTAL RECORD
Large-Scale Averages
Figure 2-1 shows three large-scale averages of annual mean surface temperature anomalies from the HadCRUT2v dataset (Jones et al. 2001), which is commonly used in both proxy reconstructions and more general global climate studies.1 The three estimates are for (1) global, (2) Northern Hemisphere, and (3) Northern Hemisphere extratropical land areas only (20°N–85°N). The Northern Hemisphere extratropical land area estimate has the largest variability of the three because the mid- and high-
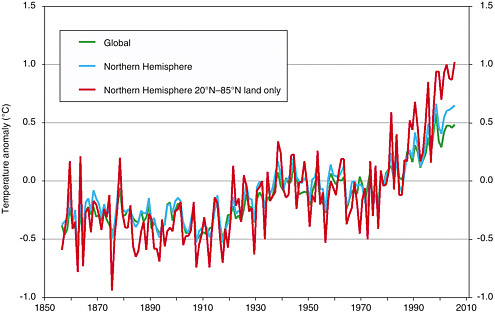
FIGURE 2-1 Global, Northern Hemisphere, and Northern Hemisphere extratropical land area annual temperature anomalies in degrees Celsius from the HadCRUT2v surface temperature dataset. SOURCE: Jones et al. (2001).
latitude continental climatic zones generally exhibit larger temperature swings on virtually all timescales than other regions of the globe. The Northern Hemisphere and global estimates exhibit less variability because of the additional influence of SSTs, which have less variability than land air temperatures from year to year, mainly due to the higher heat capacity of the ocean mixed layer compared to the land surface. The evolving pattern of fluctuations is similar in these three large-scale averages because (a) the Northern Hemisphere extratropical land area stations form a major part of the larger-scale averages and (b) the larger variations in the Northern Hemisphere extratropical land area record tend to dominate the smaller variations in the remaining regions. Since 1978, instruments on satellites have monitored the temperature of the deep atmospheric layer above the surface and, though regional differences occur, global average trends agree with the surface warming of +0.16°C per decade within ±0.04°C per decade (CCSP and SGCR 2006).
In addition to substantial year-to-year variability, the global instrumental temperature record shows the following low-frequency features: a slight decline from 1856 to 1910, a rise of ~0.4°C between 1910 and 1945, a leveling or slight decline between about 1945 and 1975, and a rise of ~0.5°C from 1975 to the present. The overall rise during the 20th century was about 0.6°C, with an additional 0.1°C reported since then. If the 150 years of relatively reliable instrumental data are divided into three 50-year segments—1856–1905 (I), 1906–1955 (II), and 1956–2005 (III)—the average
global temperature anomalies for these three periods relative to the 1961–1990 mean are –0.32°C (I), –0.20°C (II), and +0.11°C (III), respectively. Given this variability, a large-scale surface temperature reconstruction would require exceptionally good accuracy, on the order of a few hundredths of a degree Celsius, to distinguish (I) from (II). To distinguish (III) from the earlier two periods, an error of ~0.15°C would be acceptable. Therefore, if the temperature variations observed during the last 150 years are representative of fluctuations over the last 2,000 years, a relatively small (and well-characterized throughout the time series) error allowance is required to distinguish in a quantitative way the global average temperature levels of the latter half of the 20th century from earlier individual 50-year periods.
Decadal averages, beginning with 1856, produce global values ranging from –0.38°C (1906–1915) to +0.42°C (1996–2005). Thus, to distinguish global mean decadal temperature anomalies into, for example, three categories (cool, average, warm) in the context of the last 150 years would require errors of ~0.2°C or less. As in other types of time series analysis, the magnitude of the climate signal must also be sufficiently greater than the magnitude of the potential errors in order to make confident statements about the relative warmth of individual periods. This must be the case over the entire length of the period under investigation to make inferences about which decades might be the warmest or the coolest. This is a particularly difficult subject for proxy-based records since there are no absolute temperature measurements on these timescales for the preinstrumental era. Hence, the estimation of error characteristics, which are discussed in detail in Chapter 9, is a major emphasis in paleoclimate reconstructions.
Seasonal and Spatial Patterns
Many proxies are most sensitive to temperature during certain seasons: For example, tree ring measurements are usually (but not always) most sensitive to mean temperatures during the summer growing season. For comparison, Figure 2-2 shows the annual and summer anomalies of the Northern Hemisphere extratropical land area temperature record. It is clear that differences occur from year to year and, in the early period, even from decade to decade between the two averaging periods. Year-to-year Northern Hemisphere temperatures vary over a wider range in winter than summer, but the annual mean temperature, being the average of four seasonal anomalies, tends to smooth out these seasonal fluctuations, which are greater in nonsummer seasons, to give roughly the same year-to-year variability as summer. However, note that the 150-year trend in annual mean Northern Hemisphere extratropical land area temperatures is more positive than the corresponding trend in summer mean temperatures (+0.063°C vs. +0.025°C per decade). This difference could be of consequence if the trend influences the statistical calibration procedures (see Chapter 9).
Figure 2-3 displays the regional trends through 2005 beginning in 1870 and in 1950. The changing distribution of measurements is evident as the map beginning in 1870 has much poorer geographic coverage, especially over land. Since 1950, most regions indicate positive surface trends, especially in mid and high northern latitudes. These observed positive trends over the last few decades are sometimes not reflected in tree-ring-based reconstructions for those regions, as further discussed in Chapter 4.
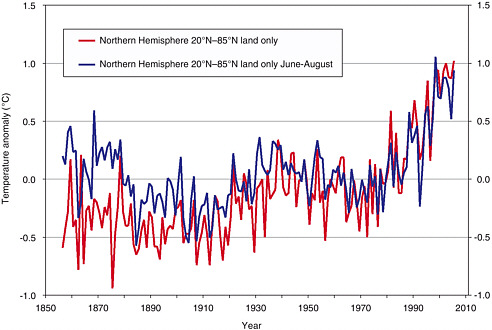
FIGURE 2-2 Annual mean and summer (June–August) mean temperature anomalies in degrees Celsius for Northern Hemisphere extratropical land areas from the HadCRUT2v surface temperature dataset. SOURCE: Jones et al. (2001).
UNCERTAINTIES AND ERRORS ASSOCIATED WITH THE INSTRUMENTAL RECORD
Because proxy-based surface temperature reconstructions often depend on either local or large-scale average land air temperatures and/or SSTs, any errors in the instrumental temperature record will reduce the confidence in the reconstructed temperature record. Several factors influence the land air temperature measurements over time. As land use has changed (e.g., from forest to urban), many thermometers in the land air temperature record have responded to the changes in the thermal properties of their surroundings, yielding temperature changes that are real but not likely due to large-scale climatic causes. The geographic distribution of the land air temperature sites has also grown significantly since 1856, so data from regions that previously had no measurements now provide a more accurate large-scale average, giving rise to larger errors in the earlier part of the record. Similarly, compilations of SST measurements suffer from poor calibration and sampling in the earlier decades. These types of problems are estimated to introduce a potential error (95 percent confidence) of ~0.10°C for the earliest decades of the global and Northern Hemisphere average temperature values (Folland et al. 2001b). In the most recent decades, improved coverage and better knowledge of instrumental biases, such as the effects of urbanization, reduce the error range to ~0.04°C (Brohan et al. in press). These potential errors are relatively small
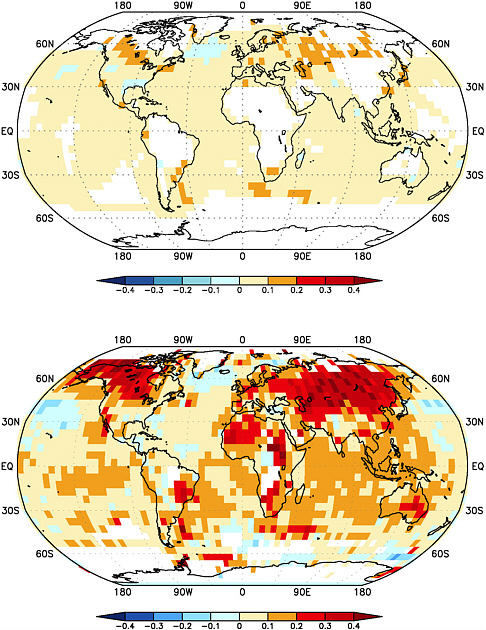
FIGURE 2-3 Observed surface temperature trends in degrees Celsius per decade through 2005 beginning in 1870 (top) and beginning in 1950 (bottom) derived from HadCRUT2v data. SOURCE: Data from Jones et al. (2001); drawing by Todd Mitchell, University of Washington, Seattle. Reprinted with permission; copyright 2006.
compared to the observed decadal temperature changes for the last 150 years described above.
Errors in the instrumental record can reduce the effectiveness of the proxy calibration process because the fundamental relationship sought from the calibration exercise may be compromised to a degree. For example, proxy–temperature relationships determined on the local scale suffer from errors arising from (a) inhomogeneous data at the land air temperature calibration site, (b) horizontal distance between the proxy location and the land air temperature site, (c) elevation differences between the proxy location and the land air temperature site, and (d) differences between the land air temperature sites that are composited to create the calibration and validation datasets. As a result, there are many opportunities for errors in the measurements and averaging techniques to influence the temperature datasets against which data methods are calibrated and verified. Fortunately, when increasing the size of the samples being averaged and tested, random and uncorrelated errors tend to cancel, enhancing the confidence in the variations produced.
There is also the added burden of dealing with new versions of particular datasets. Estimates by research groups of large-scale average temperatures for particular periods have changed somewhat over time. This occurs when the different groups (a) update the primary source data used in the large-scale averages, (b) institute new adjustment procedures, or (c) adopt new spatial or temporal averaging techniques. Thus, a proxy record calibrated or verified using an early version of an instrumental record may be altered slightly if the instrumental data against which the proxy was calibrated changes.
SPATIAL SAMPLING ISSUES
Deducing the number of sites at which surface temperature needs to be sampled in order to represent variations in global (or hemispheric) mean temperature with a specified level of accuracy is a challenge no less formidable than deducing the temperature variations themselves. The most obvious way to address this problem is to try replicating the variations in the Earth’s temperature in the instrumental record using limited subsets of station data. The effectiveness of this approach is limited by the length of the observational record. One way of overcoming this limitation is to sample much longer time series of synthetic climate variations generated by climate models, but this strategy is compromised by the limited capability of the models to simulate temperature variations on the century-to-century timescale and on spatial scales that represent the highly variable character of the Earth’s surface. The studies that have been performed to date suggest that 50–100 geographically dispersed sites are sufficient to replicate the variability in the instrumental record (e.g., Hansen and Lebedev 1987, Karl et al. 1994, Shen et al. 1994). These results indicate that the temperature fluctuations in the instrumental record are well resolved; that is, proxy records do generally reflect the same variability as instrument records where they overlap (Jones et al. 1997). However, they leave open the question of whether the proxy records are sufficiently numerous and geographically dispersed to resolve the major features in the time series of the temperature of the Earth extending back over hundreds or even thousands of years.
Hopes for reliable Northern Hemisphere and global surface temperature reconstructions extending back far beyond the instrumental record are based on the premise that local surface temperature variations on timescales of centuries and longer are
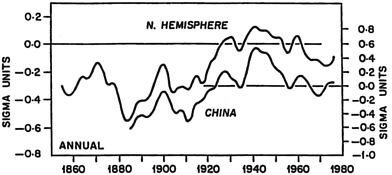
FIGURE 2-4 Smoothed time series of normalized annual mean surface air temperature averaged over China and the entire Northern Hemisphere. SOURCE: Bradley et al. (1988). Reprinted with kind permission of Springer Science and Business Media; copyright 1988.
dominated by variations in global mean temperature that occur in response to changes in the global energy balance. If this premise is correct, it follows that temperature time series at points on Earth should be more strongly correlated with the time series of the global mean temperature on these longer timescales than they are on the year-to-year timescale. Several papers offer support for this view (e.g., Leung and North 1991, Shen et al. 1994), as does the time series shown in Figure 2-4 (Bradley et al. 1988). The strong correspondence between the Northern Hemisphere and China curves indicates that much of the decade-to-decade and century-to-century variability in the mean temperature of the Northern Hemisphere since 1880 can be captured using data from the Chinese station network alone. Of course, temperature time series at individual sites within China are not as highly correlated with hemispheric mean time series as the China-mean time series in Figure 2-4, and proxy time series do not perfectly represent the true time series of surface temperature variations. Much remains to be done to place the spatial sampling requirements on a firm footing.
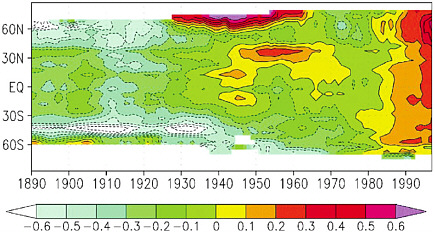
Another issue that arises when interpreting proxy records of surface temperature over the last 2,000 years is the degree to which temperature time series in various latitude belts are representative of the globally averaged temperature. The instrumental record of surface temperature shown in Figure 2-5 is instructive in this respect. The rise in surface air temperature that occurred during the 1920s and the slight decline during the 1950s were much more pronounced over high latitudes of the Northern Hemisphere than at lower latitudes. In contrast, the warming of the last few decades has been much more latitudinally uniform. The latitudinally dependent features in Figure 2-5 serve as a reminder that not all the variability over high latitudes, as recorded in ice core measurements and high-latitude proxies, is necessarily representative of variations in global mean temperature.