
4
Tree Rings
|
DEFINITION AND PREMISES
Dendroclimatology is the application of tree ring science, or dendrochronology, to the study of climate (Fritts 1976). The online Bibliography of Dendrochronology (Dobbertin and Grissino-Mayer 2004) includes more than 10,000 references addressing questions in archeology, climatology, ecology, forestry, hydrology, geology, geomorphology, and other areas. A considerable portion of tree ring data collected on all inhabited continents is freely available online (Grissino-Mayer and Fritts 1997).
Dendroclimatic records are commonly derived from areas where wood growth is related to climate. For air temperature,1 preferred locations are close to the treeline, which repre-
sents the altitudinal or latitudinal limit to tree growth (Kullman 1998, Körner 1999). From a review of published data, Grace (1988) concluded that “a 1°C increase in a north temperate climate may be expected to increase plant productivity by about 10 percent, providing that other factors like water or nutrients do not become limiting.” Controlled experiments dealing with the effect of temperature on plant growth are mostly performed on herbaceous species or seedlings (Junttila 1986, Loveys et al. 2002), and it is difficult to extrapolate those findings to the spatial and temporal scales considered by dendroclimatologists. For example, consider the evidence for treeline shifts in many areas of the world (MacDonald et al. 1998, Esper and Schweingruber 2004, Millar et al. in press). Such observations do not easily lend themselves to experimental testing of causal mechanisms. It has been argued that treeline position is not highly sensitive to interdecadal temperature change (Paulsen et al. 2000), but rather reflects environmental variability over several hundred years (Lloyd and Graumlich 1997, Körner 1999). Local disturbances, site conditions, and regional climatic regimes also influence the degree of sensitivity and rate of response of treelines to temperature changes (Kjällgren and Kullman 2002, Daniels and Veblen 2003).
The biological connection between temperature and tree ring variations on hourly to annual timescales has been investigated in the field using specialized instruments called dendrometers (Biondi et al. 2005), together with wood anatomy observations (Deslauriers et al. 2003a). For European and North American conifers living in cold environments, ring formation mostly occurs from May to the beginning of August, peaking around the time of maximum day length (Rossi et al. 2006 and references therein). By monitoring stem size of Pinus cembra and temperature during the growing season for two full years in the Alps, it was found that radial expansion ceased whenever air temperature fell below 5°C (Körner 1999). Night temperature was more important than day temperature for controlling radial growth of balsam fir at about 50°N latitude (Deslauriers et al. 2003b). At longer timescales (monthly to decadal), a number of dendroclimatic studies have identified a positive, linear relationship between mean July temperature and ring-width chronologies of Pinus sylvestris in northern Fennoscandia (Mikola 1962, Kalela-Brundin 1999, Helama et al. 2002).
In terms of causal mechanisms, tree ring records are likely to be the result of multivariate, and often nonlinear, biophysical processes. Models based on ecological or physiological concepts have been proposed to account for such processes (Fritts et al. 1991, Hunt Jr. et al. 1991, Scuderi et al. 1993, Berninger et al. 2004, Misson 2004). An intriguing hypothesis for the ability of treeline pine species to record slowly changing surface temperatures involves the fact that needles formed in one growing season remain alive and functioning for 10–30 years (LaMarche 1974). The mechanistic bases for the statistical models used to extract climate signals from tree ring data have been summarized in simulation models focusing on the activity of the tissue that forms wood, the vascular cambium (Vaganov et al. 2006). Also note that linear relationships between tree ring records and climate are at least equal to, and often exceed, those found for other proxies (Jones et al. 1998). Statistical techniques more responsive to nonlinear interactions have so far provided relatively small improvements for explaining climatic variance (Hughes 2002 and references therein).
All proxy records of climate are obtained from samples that are not randomly selected (Cronin 1999). Part of the researcher’s ability consists of identifying sites where proxy records are as long, continuous, and representative of the target climatic variable as possible. Guidelines have been specified in the tree ring literature
(Schweingruber 1988, Fritts and Swetnam 1989) to ensure that sample (site, tree, and core) selection is based on a priori rather than a posteriori criteria. For instance, sites are selected in remote areas where tree density is low in order to minimize the impact of stand dynamics and intertree competition (Biondi et al. 1994). The influence of varying local conditions on dendroclimatic records has been studied for elevation, slope, and exposure (Kienast and Schweingruber 1986, Villalba et al. 1994, Buckley et al. 1997, Tardif et al. 2003, Piovesan et al. 2005), topographic convergence and potential relative radiation (Bunn et al. 2005), and flooding patterns (Tardif and Bergeron 1997). Sampled trees should not show signs of disturbance factors such as insect infestation, grazing, fire damage, human utilization, fungal infestation, or mistletoe attack (Schweingruber 1988, Fritts and Swetnam 1989). Overall, as in any other field-based investigation of environmental change, defining the research question is the premise to a proper selection of materials and methods (Bräker 2002).
FIELD AND LABORATORY METHODS
To ensure reliable results, tree ring science places great emphasis on replication (Wigley et al. 1984, Fritts and Swetnam 1989). At least 10–20 trees per species are sampled at a site, mostly by taking increment cores, and each tree is cored following specific guidelines (Grissino-Mayer 2003). All collected samples are transported back to the laboratory, where they are compared to one another. The method of crossdating (or pattern matching) is used to assign calendar years to the individual rings (Baillie and Pilcher 1973, Wigley et al. 1987, Yamaguchi 1991). Initially based on a visual comparison (Stokes and Smiley 1996), crossdating is quality controlled by means of numerical techniques once the ring widths are measured (Holmes 1983, Grissino-Mayer 1997). The precision and accuracy of crossdating have allowed the refinement of radiocarbon dating techniques (LaMarche and Harlan 1973, Friedrich et al. 2004). Tree ring chronology development follows rules that are common to all applications of tree ring science, and is completely independent of any climatic data. Samples or portions of samples that cannot be crossdated with the rest of the specimens are not included in the final chronology. Recommendations to archive all collected materials, so that they remain available for future study, have been published (Eckstein et al. 1984). The Laboratory of Tree-Ring Research at the University of Arizona still has wood samples, field notes, and measurements that were taken a century ago by A.E. Douglass, the Tucson astronomer who proposed many of the dendrochronological methods still in use today (Webb 1983).
After crossdating, tree ring parameters other than width (such as density, stable isotopic composition, cell size and wall thickness, resin duct density, and trace metal concentrations) can be measured. Dendroclimatic studies of past surface temperature are mostly based on ring width or maximum latewood density; the latter usually has a higher correlation with temperature, especially during the summer (Conkey 1986, Briffa et al. 2002). Maximum latewood density is also correlated with ring anatomy as measured by cell number, cell diameter, and cell wall thickness (Wang et al. 2002). Measurements made on crossdated wood samples from the same species and site are typically combined into a master chronology (Fritts 1976, Cook and Kairiukstis 1990). This process is aimed at increasing the climatic signal by reducing the importance of individual sample noise. In general, the number of specimens required to obtain a robust chronology increases as the common variance among specimens decreases (Fritts
and Swetnam 1989). Although all crossdated samples are entered into the final chronology, standardization removes any difference in mean growth rate between specimens, so that faster-growing trees do not dominate the record. Any criteria used to form a chronology out of a subset of the crossdated specimens need to be clearly reported and justified.
The identification of year-to-year (high-frequency) climate signals in tree ring records is relatively straightforward since it is based on the elimination of time series autocorrelation using autoregressive models (Biondi and Swetnam 1987, Cook and Kairiukstis 1990). If adequately long instrumental records are available, it is even possible to explore the stationarity of statistical relationships between climatic variables and tree ring parameters by considering multiple time intervals (Biondi and Waikul 2004).
With regard to low-frequency temperature patterns, the length of the individual tree ring records used to produce a master chronology (rather than the length of the chronology itself) can influence the reconstruction (Cook et al. 1995). It is also difficult to distinguish the amount of temporal autocorrelation in tree ring records that is linked to biological processes instead of climatic ones (Fritts 1976). One way to resolve these issues is to compute the expected value of the tree ring parameter (width, density, etc.) as a function of biological age (i.e., time since ring formation), and use the resulting growth curve to standardize the individual tree ring series. This method, which is now called Regional Curve Standardization (RCS), was first proposed in the 1930s (Grudd et al. 2002), later described by Fritts (1976), and made popular by Briffa et al. (1992). In addition to its theoretical appeal, the RCS method is suitable for retrieving low-frequency signals in tree ring records (Esper et al. 2003, Bunn et al. 2004) and is widely employed in dendroclimatic reconstructions of surface temperature (Esper et al. 2002a, Gunnarson and Linderholm 2002, Naurzbaev et al. 2002).
TEMPERATURE RECONSTRUCTIONS
To prevent the risk that a single tree ring chronology could reflect the influence of localized nonclimatic influences (Fritts 1976, Trotter et al. 2002), dendroclimatic reconstructions often rely on networks of site chronologies. Regional tree ring networks typically have strong intersite correlations (e.g., Hughes et al. 1984, Figure 2), and continental-to-hemispheric-scale networks are able to reproduce synoptic-scale climatological patterns (Fritts 1991, Briffa et al. 2002). When based on a number of sites in the Northern Hemisphere, dendroclimatic reconstructions of surface temperatures show that the 20th century warming was unusual since at least 1500 (D’Arrigo et al. 2006; Figures 4-1 and 4-2), in agreement with independent reconstructions derived from written documents (Xoplaki et al. 2005), borehole temperatures (Pollack and Smerdon 2004), and glacier lengths (Oerlemans 2005a). When records are sought for the last two millennia, the number of available tree ring chronologies declines markedly (Hughes 2002), so confidence in reconstructed patterns is reduced.
All paleoclimatic reconstructions rely on the “uniformity principle” (Camardi 1999), which assumes that modern natural processes have acted similarly in the past, and is also discussed as the “stationarity” assumption in Chapter 9. Although limiting factors controlled tree ring parameters in the past just as they do today, it is possible that the role of different factors at a single location or over an entire region could change over time. This possibility has been raised to explain the “divergence” (i.e.,
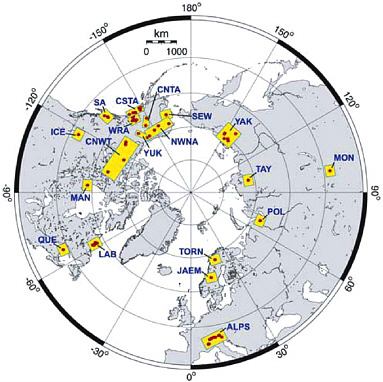
FIGURE 4-1 Location map of individual sites (red) and regional composites (yellow boxes) used to reconstruct Northern Hemisphere surface temperatures for the past millennium. SOURCE: D’Arrigo et al. (2006). Reproduced by permission of American Geophysical Union; copyright 2006. NOTE: ALPS = Alps, CNTA = Central Alaska, CNWT = Central Northwest Territory, CSTA = Coastal Alaska, ICE = Icefields, JAEM = Jaemtland, LAB = Labrador, MAN = Manitoba, MON = Mongolia, NWNA = Northwest North Alaska, POL = Polar Urals, QUE = Quebec, SA = Southern Alaska, SEW = Seward, TAY = Taymir, TORN = Tornetraesk, WRA = Wrangells, YAK = Yaktutia, YUK = Yukon.
reduced correlation) between temperature and ring parameters (width and maximum latewood density) during the late 20th century (Jacoby and D’Arrigo 1995, Briffa et al. 1998). In Alaska, it appears that increasing air temperature over the past decades is not reflected in increasing tree ring records because water (i.e., drought stress) has become the limiting factor (Barber et al. 2000, Lloyd and Fastie 2002, Wilmking and Juday 2005). In Siberia, on the other hand, reduced correlation of tree ring chronologies with summer temperature has been attributed to increasing winter precipitation, which leads to delayed snowmelt in permafrost environments, thus shortening the tree growing season (Vaganov et al. 1999). Other hypotheses have been formulated for the reduced correlation between temperature and tree ring chronologies, such as a negative effect on tree growth due to greater ultraviolet radiation reaching the ground as a
result of thinning stratospheric ozone (Briffa et al. 2004), or the possibility that surface instrumental temperatures are affected by an upward bias (Hoyt 2006). Elevational treeline sites in Mongolia (D’Arrigo et al. 2001) and the European Alps (Büntgen et al. 2005) are not affected by “divergence.” This geographic separation was confirmed by Cook et al. (2004), who subdivided long tree ring records for the Northern Hemisphere into latitudinal bands and found not only that “divergence” is unique to areas north of 55°N but also that the difference between northern and southern sites found after about 1950 is unprecedented since at least A.D. 900.
An especially suitable strategy to minimize confounding effects is to sample sites along ecological gradients, such as elevation or latitude (Fritts and Swetnam 1989, Bugmann 1996). For example, Naurzbaev et al. (2004) selected sites along latitudinal (from 55 to 72°N) and elevational (from 1120 to 2350 meters above sea level) transects and used the parameters of the Regional Curve Standardization to infer climatic influences and past temperature variability. Other strategies are available to improve tree ring reconstructions of surface temperature. Some of these strategies involve using maximum temperature instead of mean temperature (Luckman and Wilson 2005), combining multiple tree ring parameters related to temperature (Helle and Schleser 2004), sampling species with opposing responses to temperature (Biondi et al. 1999), and applying mechanistic models to tree ring records (Anchukaitis et al. 2006).
The possibility that increasing tree ring widths in modern times might be driven by increasing atmospheric carbon dioxide (CO2) concentrations, rather than increasing temperatures, was first proposed by LaMarche et al. (1984) for bristlecone pines (Pinus longaeva) in the White Mountains of California. In old age these trees can assume a “strip-bark” form, characterized by a band of trunk that remains alive and continues to grow after the rest of the stem has died. Such trees are sensitive to higher atmospheric CO2 concentrations (Graybill and Idso 1993), possibly because of greater water-use efficiency (Knapp et al. 2001, Bunn et al. 2003) or different carbon partitioning among tree parts (Tang et al. 1999). Support for a direct CO2 influence on tree ring records extracted from “full-bark” trees is less conclusive. Increasing mean ring width was reported for Pinus cembra from the central Alps growing well below treeline (Nicolussi et al. 1995). Free-Air CO2 Enrichment (FACE) data for conifer plantations in the Duke Forest (Hamilton et al. 2002) and at the alpine treeline (Hättenschwiler et al. 2002) also showed increased tree growth after exposure to atmospheric CO2 concentrations about 50 percent greater than present. On the other hand, no convincing evidence for such effect was found in conifer tree ring records from the Sierra Nevada in California (Graumlich 1991) or the Rocky Mountains in Colorado (Kienast and
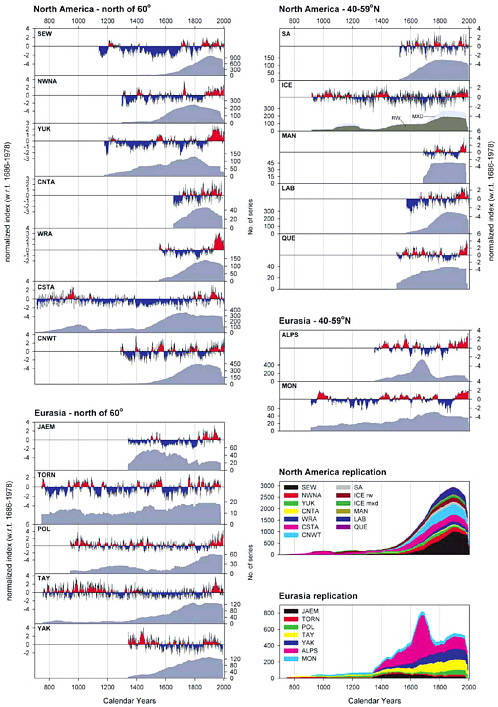
FIGURE 4-2 Results for individual regional composite chronologies for the sites shown in Figure 4-1. The time series have been loosely grouped according to latitude bands and normalized to the common period. The bottom two panels in the right column show grouped replication plots for both North America and Eurasia. For definitions of abbreviations, see Figure 4-1. SOURCE: D’Arrigo et al. (2006). Reproduced by permission of American Geophysical Union; copyright 2006.
Luxmoore 1988). Further evidence comes from a recent review of data for mature trees in four climatic zones, which concluded that pine growth at the treeline is limited by factors other than carbon (Körner 2003). While “strip-bark” samples should be avoided for temperature reconstructions, attention should also be paid to the confounding effects of anthropogenic nitrogen deposition (Vitousek et al. 1997), since the nutrient conditions of the soil determine wood growth response to increased atmospheric CO2 (Kostiainen et al. 2004). However, in forest areas below the treeline where modern nitrogen input could be expected to influence dendroclimatic records, such as Scotland (Hughes et al. 1984) and Maine (Conkey 1986), the relationship between temperature and tree ring parameters was stable over time.
In conclusion, tree ring science provides useful insights into past temperature variability. Promising areas of current and future research can be summarized as:
-
updating site chronologies that were collected 20–30 years ago,
-
increasing the number and geographic coverage of temperature-sensitive tree ring chronologies longer than 1,000 years,
-
quantifying the precision and accuracy of low-frequency temperature signals,
-
performing experimental studies on biophysical relationships between temperature and tree ring parameters, and
-
refining mechanistic models of temperature effects on tree ring parameters at multiple spatial and temporal scales.


