
5
Marine, Lake, and Cave Proxies
|
CORALS
Massive corals that live near the sea surface produce annual density bands of aragonite (calcium carbonate) that can be sampled and used to reconstruct monthly climate records by examining their geochemical composition. In particular, the ratio of 18O to 16O (commonly referred to as δ18O)1 in coralline aragonite decreases with increasing seawater temperature and with decreasing δ18O in water at the time of formation. The δ18O of water is often strongly correlated with salinity. Hence, δ18O values from a coral that grew in an open-ocean location can be used to reconstruct a combined signal of sea surface temperature (SST) and salinity for that oceanic region.
Sites for coral sampling are selected on the basis of proximity to open ocean and generally well-flushed locations. The largest corals are usually found in leeward locations that are minimally influenced by storms and silt. The morphology of the coral head should show a rounded shape with minimal erosion at the base caused by boring organisms or physical damage. In most cases, more than one coral is sampled from each site to obtain the longest record. Ideally, coral-based reconstructions would be based on multiple cores from the same site, but in practice few sites have been studied in this detail (for an exception, see Hendy et al. 2002). More commonly, coral reconstructions are calibrated closely with instrumental data, and high correlation coefficients lend confidence to the reconstruction of past conditions (for reviews, see Gagan et al. 2000, Cole 2003). The primary limitation of using coral δ18O for SST reconstruction is the added variable of water δ18O, which is important in areas of high rainfall, evaporation, or river input, such as the western Pacific warm pool. Recently, it has been discovered that this limitation can be overcome by simultaneously measuring the elemental ratio of strontium to calcium (denoted Sr/Ca) in coral bands, because the Sr/Ca ratio changes mainly as a function of SST. Sr/Ca ratios have been shown to track SST quantitatively with a high degree of precision (Beck et al. 1992), yielding an uncertainty in SST reconstructions of less than 0.3°C. There are several long-term reconstructions of SSTs available using coral Sr/Ca ratios including the Great Barrier Reef (Hendy et al. 2002), Rarotonga and Fiji (Linsley et al. 2004), Madagascar (Zinke et al. 2004), and Hawaii (Druffel et al. 2001). A few studies have also used uranium/calcium (U/Ca) ratios to reconstruct SSTs (e.g., Hendy et al. 2002).
Results of Coral-Based Reconstructions
Continuous coral δ18O records for the last 100–400 years are available for regions in the tropical and subtropical Pacific, Indian, and Atlantic oceans (see summary papers: Cole 2003, Lough 2004, Gagan et al. 2000). Corals from most of these sites display an overall decrease in δ18O values toward the 20th century, which indicates surface seawater that is warmer, fresher (lower salinity), or both. Most of these records also show abrupt shifts toward warmer/fresher waters during the mid-
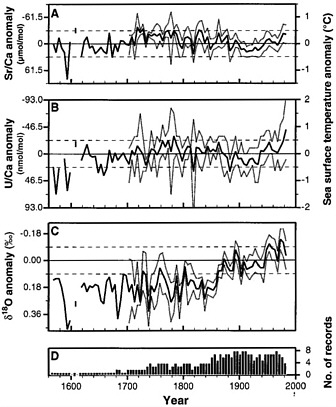
FIGURE 5-1 Sr/Ca, U/Ca, and δ18O anomalies from Great Barrier Reef composites; the Sr/Ca and U/Ca anomalies have been used to reconstruct local SST records for five-year averages, with 95 percent statistical confidence intervals indicated by dotted lines. SOURCE: Hendy et al. (2002). Reprinted with permission from AAAS; copyright 2002.
1800s and from 1920 to 1940, the latter of which agrees with instrumental records (Gagan et al. 2000). Superimposed on the recent oceanic warming, some locations show distinct patterns of decadal variability, with repeated shifts of several tenths of a degree Celsius.
Figures 5-1 and 5-2 show examples of isotopic and elemental records derived from corals. Using Sr/Ca and U/Ca ratios in eight coral cores from the Great Barrier Reef, Hendy et al. (2002) (Figure 5-1) revealed that above-average SSTs were present in the 18th and 19th centuries, with cooling in the early 20th century and warming until the 1980s (more so for the U/Ca results). Other coral records from the southwestern Pacific (Figure 5-2) display interdecadal changes in the δ18O and Sr/Ca values that reflect both SSTs and changes in the circulation near the South Pacific Convergence Zone (Linsley et al. 2004). These authors conclude that the degree of cross-
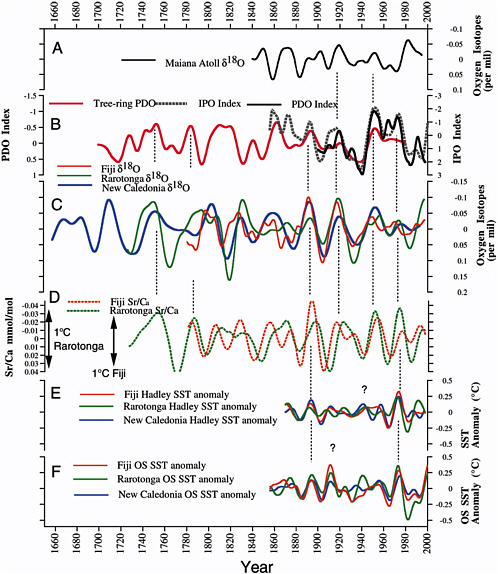
FIGURE 5-2 (A–F) Comparison of interdecadal variability in geochemical records from Porites corals from Rarotonga (Linsley et al. 2000), Fiji and New Caledonia (Quinn et al. 1998), and Maiana Atoll (Urban et al. 2000). The long-term trend has been removed from all data; thus, the warming during the 20th century cannot be seen. Also shown are instrumentally based indices of the Interdecadal Pacific Oscillation (IPO) (Folland et al. 2002) and Pacific Decadal Oscillation (PDO) (Mantua et al. 1997) indices, along with the North American tree-ring-based PDO index of D’Arrigo et al. (2001) and SST data from Rarotonga, Fiji, and New Caledonia from two different datasets (HADISST1 and Kaplan et al. [1998]). SOURCE: Linsley et al. (2004). Reprinted with kind permission of Springer Science and Business Media; copyright 2004.
hemispheric symmetry of interdecadal oceanographic variability has varied over time, with a lower correlation between the North and South Pacific during the mid-18th century.
In the eastern tropical Pacific, where El Niño–Southern Oscillation (ENSO) events dominate the climatology, coral records primarily reflect variability of SSTs, and there is no shift toward lower δ18O (warmer SSTs) by 1954 (Dunbar et al. 1994). Other isotopic and elemental records from corals in this region also demonstrate incidences of these events (Shen et al. 1992, Guilderson and Schrag 1998, Druffel 1981). In the western Indian Ocean, coral δ18O from the Seychelles (Charles et al. 1997) and Malindi, Kenya (Cole et al. 2000) demonstrate an SST increase of 0.6°C from the mid-1800s to 1980; discontinuous records from Madagascar indicate cool conditions from 1675 to 1760 and warm conditions from 1880 to 1900 and from 1973 to 1995 (Zinke et al. 2004). The impact and nature of ENSO cycles in this region appear to have changed during this most recent warm period. In the southeast Indian Ocean, the coral δ18O record suggests a rise in SST by 0.6°C since 1944 and an additional half degree rise since 1795 (Kuhnert et al. 1999). Finally, δ18O data from Bermuda corals indicate a slight shift toward higher SSTs, whereas data from other isotope ratios (13C/12C and 14C/12C) show that mixing in the upper ocean was variable during the 19th and 20th centuries (Nozaki et al. 1978; Druffel 1989, 1997). Coral records from Florida and the Caribbean Sea show δ18O variations that reflect some combination of SST and hydrologic changes (Druffel 1981, Winter et al. 2000, Swart et al. 1996).
Prospects for Improving and Extending Coral Records
To obtain large-scale, multicentury reconstructions of SSTs based on Sr/Ca ratios, it is necessary to obtain long records of Sr/Ca ratios in corals for a much larger number of locations than is currently available. Uranium-thorium measurements make it possible to obtain windows of shorter records within the last few millennia to shed light on tropical and subtropical ocean climate variability. Cobb et al. (2003) reported a δ18O record for portions of the last 1,100 years from fossil corals at Palmyra atoll in the mid-tropical Pacific. As shown in Figure 5-3, they find relatively cool and dry climate conditions during the 10th century to increasingly warmer and wetter climate in the 20th century. ENSO activity was found to be most intense during the mid-17th century than during other periods examined. Although not a problem with these data, the possibility of diagenetic alteration of fossil segments must be considered in coral studies.
Sclerosponges and Molluscs
Sclerosponges inhabit shallow tropical caves and secrete aragonite at very low growth rates (0.1–0.2 millimeters per year); relatively small specimens can be over 1,000 years old. Sr/Ca ratios measured in sclerosponge layers demonstrate correlation with SST (Rosenheim et al. 2004). Long-lived shells such as the clam Arctica islandica live in cold surface waters and put on annual growth bands. Although promising (Forsythe et al. 2003), mollusc δ18O and geochemical records available so far are too short to be used for long-term reconstruction of SSTs.
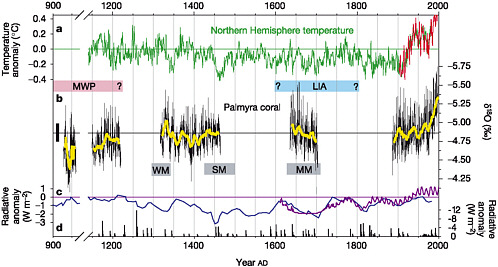
FIGURE 5-3 Composite from Cobb et al. (2003) showing Northern Hemisphere reconstructed temperature anomalies (Mann et al. 1999), δ18O values derived from fossil corals in Palmyra, solar radiance anomalies (Lean et al. 1995, Bard et al. 2000), and one estimate of radiative forcing anomaly (Crowley 2000). SOURCE: Cobb et al. (2003). Reprinted with permission from Macmillan Publishers Ltd.; copyright 2003.
MARINE SEDIMENTS
The utility of marine sediments in recording climate change during the Holocene depends either on sufficiently rapid sediment accumulation to overcome the mixing effects of bioturbation2 (usually up to 8 centimeters) or deposition under anoxic or suboxic oceanic conditions to retain annual layers. Both types of depositional environments have been exploited in attempts to infer oceanic and atmospheric conditions affecting the record in the sediments.
Several studies of marine sediments have provided insight into past climate on a regional basis. The Cariaco Basin off Venezuela is an anoxic basin with annual layers reflecting changes in atmospheric conditions that accompany shifts in the location of the Intertropical Convergence Zone (ITCZ), in particular the location and intensity of precipitation. Haug et al. (2003) have studied the titanium concentration changes in the Cariaco Basin annual sediment layers to infer the variations in the ITCZ, which impacted rainfall on the Yucatan Peninsula. The record is somewhat ambiguous in defining the Little Ice Age or a warm period during medieval times, but the authors believe it indicates several epochs of severe drought at the beginning of medieval times
that caused the collapse of the Classic Mayan civilization. Black et al. (1999) demonstrated that decadal-to-multicentury variations in wind-driven upwelling in the Cariaco Basin, and by inference the mean position of the ITCZ, were closely linked to North Atlantic SSTs over the past eight centuries. Other records from upwelling areas off Pakistan (e.g., von Rad et al. 1999) and zones of layered sediment deposited under anoxic conditions—such as fjords along the coast of British Columbia, Canada—also possess marine sediments with distinct seasonal layers that offer high-resolution histories of late Holocene climate.
Records from rapidly accumulating sediments in the Atlantic Ocean also provide information about temperature changes over the last 2,000 years. The temperature proxies derived from benthic and planktic foraminifera in the northwestern Atlantic Ocean (Keigwin and Pickart 1999, Marchitto and deMenocal 2003), the Bermuda Rise (Keigwin 1996, Keigwin and Boyle 2000), and off the west coast of Africa (deMenocal et al. 2000), as well as from marine diatoms (silica-shelled algae; Jiang et al. 2002), all reveal changes in surface ocean temperatures or surface ocean temperatures transmitted to depth by sinking water masses. To varying degrees, both the Little Ice Age and the warm period around medieval times are revealed by these records (Figures 5-4 and 5-5). It has been suggested that Holocene climate variations indicated by peaks in ice-
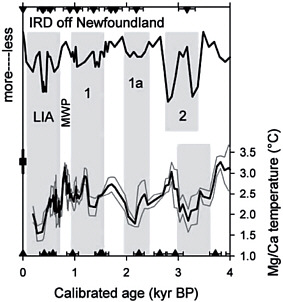
FIGURE 5-4 Variation of bottom temperature on the Labrador current inferred from Mg/Ca ratios in forams and the relation to the measure of ice-rafted debris (IRD) showing variations in North Atlantic temperature changes as reflected in deep-sea sediments. SOURCE: Marchitto and deMenocal (2003). Reproduced by permission of American Geophysical Union; copyright 2003.
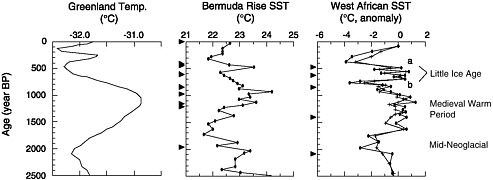
FIGURE 5-5 Greenland temperature (Dahl-Jensen et al. 1998), Bermuda Rise SST (Keigwin 1996), and West African SST for the last 2,500 years. SOURCE: deMenocal et al. (2000). Reprinted with permission from AAAS; copyright 2000.
rafted lithic grain abundances in several North Atlantic cores were paced by variations in solar irradiance (Bond et al. 1997, 2001) (Figure 5-6).
In addition, sedimentation rates are fast enough in some estuarine and coastal settings to allow climate reconstruction for the last 2,000 years. Cronin et al. (2003) used Mg/Ca paleothermometry on microfossil shells to show temperature shifts of 2–4°C in the Chesapeake Bay, including cold excursions during the Little Ice Age and warmer periods during medieval times (about A.D. 800 to 1300). Because of estuarine pollution linked to land clearance from the mid-19th century, the most recent part of this record may reflect factors other than water temperature.
LAKE AND PEAT SEDIMENTS
In many lakes, sediments contain distinct seasonal layers, or varves, that are either biogenic (e.g., carbonate, diatom silica, and organic matter) or minerogenic (alternating coarse and fine-grained particles) in origin. Both sediment types potentially allow annual dating for sequences that span many millennia, although typically with chronological errors of a few percent (Zolitschka 2003). Lake water biology and chemistry are often sensitive to temperature, but they are also influenced by other factors such as precipitation, watershed land use, and atmospheric pollution. To obtain unambiguous climate signals from lake records, researchers often choose sites in remote locations, such as the High Arctic. The summer ice-free period in Arctic Canadian lakes is highly sensitive to temperature, for example, and this in turn has been recorded in the thickness and nature of seasonal varves (Lamoureux and Bradley 1996).
Lakes in tropical and dryland regions are usually more sensitive to water balance than they are to temperature per se. Consequently, lake sediment records provide one of the key natural archives for reconstructing histories of drought and flood in regions such as the U.S. Midwest (Laird et al. 1998), as well as long-term changes in ENSO activity (Rodbell et al. 1999). Stable isotope analysis of a varved lake sequence by
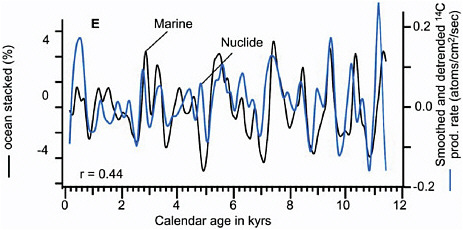
FIGURE 5-6 Relationship between the concentration of ice-rafted debris (as inferred from iron [Fe] concentration) and the flux of cosmogenic 14C. SOURCE: Bond et al. (2001). Reprinted with permission from AAAS; copyright 2001.
Jones et al. (2006) showed increased (i.e., more positive) δ18O values corresponding to the Little Ice Age along with decreased (i.e., more negative) δ18O values before about 1400 (Figure 5-7). However, the primary control on this and similar lake records was not temperature per se but the intensity of drought—linked in this case to the intensity of the summer monsoon over South Asia—and precipitation, determined here by winter atmospheric circulation over the North Atlantic. Although the East Mediterranean was relatively dry during the Little Ice Age, low lake levels in East Africa and North America indicate that droughts in these regions were more extreme in medieval times than during the 20th century, possibly linked to changes in solar activity (Hodell et al. 2001, Verschuren et al. 2000).
Biological Remains
Fossil remains from terrestrial sediments also offer indications of past surface temperatures. Nonbiting midge larvae (chironomids) and some species of beetles are highly sensitive to temperature, and the hard parts of both organisms are preserved in lake and peat sediments. However, the main application of these records to date has been on timescales longer than the last 2,000 years. In peat bogs, testate-forming amoebae species are sensitive to water table depths, which in turn are generally controlled by both rainfall and temperature. Charman et al. (2006) have used reconstructed water table changes to build up decadal-resolution climate histories for the last 4,000 years in northern Britain. Pollen analysis is a key technique for longer term climatic and vegetation history, but does not provide climatic data of sufficient time precision or reliability to assist directly in temperature reconstruction for the last two
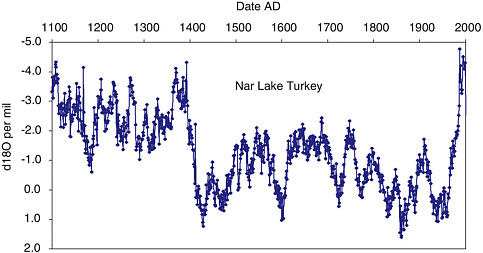
FIGURE 5-7 Annually resolved oxygen isotope record for the last 900 years from varved crater lake carbonates in the East Mediterranean. SOURCE: Modified from Jones et al. (2006). Reprinted with permission; copyright 2006.
millennia, partly because the vegetation that produces pollen lags in its response to climatic forcing.
The calibration approach used for all of these organisms is based on modern training sets rather than matching them against past temperature changes in the instrumental record. A minimum of about 30 sites are analyzed along a climatic gradient for their contemporary species mix (e.g., diatoms in surface muds) and for a range of environmental measurements (pH, salinity, water, air temperature, etc.). These modern training sets are then used to calibrate past species assemblages preserved in sediment cores using regression-based multivariate statistical techniques (Birks 1998). Using this approach, freshwater diatoms from Alpine lakes were found to track lake-water pH, which in turn has followed 20th century temperatures (Koinig et al. 1998).
SPELEOTHEMS
Speleothems are cave deposits such as stalagmites. They record changes in the external climate via a range of different proxies, including luminescence intensity, growth rate, and elemental and isotope chemistry (McDermott et al. 1999, Lauritzen 2003). Speleothem calcium carbonate registers the changing isotopic composition of cave groundwater along with cave temperature. Calcium carbonate deposits grow radially as well as upward in a stalagmite, and records of annual isotopic changes such as δ18O can be evaluated chronologically by accurate dating techniques (e.g., uranium-thorium ratio) and then converted to a climate signal. Such records represent a com-
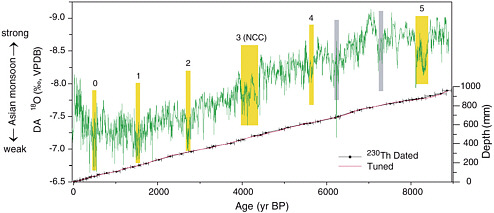
FIGURE 5-8 δ18O over the Holocene derived from a cave in eastern Asia. The yellow numbered bands correspond to times of ice-rafted debris in the North Atlantic shown in Figure 5-6 (Bond et al. 2001). SOURCE: Wang et al. (2005b). Reprinted with permission from AAAS; copyright 2005.
bined signal of temperature and precipitation—along with source area changes—but each of these signals may be dominant in different settings. In tropical and dryland regions, rainfall amount is usually the main determinant of the δ18O content of cave carbonates (Bar-Matthews et al. 2003). Thus, oxygen isotope records obtained from caves in southern China (Wang et al. 2005b) (Figure 5-8) and Oman (Fleitmann et al. 2003) suggest that strong climatological changes have occurred in Asian monsoon intensity over the last several thousand years. Episodic submillennial variations within these Holocene records generally match the North Atlantic ice-rafted debris pattern of Bond et al. (2001). The correlation of speleothem records from cave sites associated with the Asian monsoons to a marine record of ice advance and retreat in the North Atlantic provides a suggestion of hemisphere-wide century-scale climate changes resulting in different local manifestations.
In some cool and wet regions, the cave temperature signal may be dominant in controlling the δ18O and other measurements, and this is especially valuable because cave temperature is stable throughout the year and represents the mean annual temperature of the outside environment. Modern speleothem properties have been used to calibrate cave sequences from northern Scandinavia in terms of Holocene temperature variability (Lauritzen and Lundberg 1999). In addition, some speleothems contain annual bands much like lake varves or tree growth rings, and these have allowed very high resolution measurements of cave isotopic changes during the last 2,000 years. Proctor et al. (2000, 2002) used one such record from northern Scotland to reconstruct annual-to-decadal climatic changes in the North Atlantic during the last three millennia.
SUMMARY
A key advantage of the records described in this chapter is the ability to carry out many different types of laboratory analyses on the same profiles. These multiple proxies—physical, biological, or chemical—can have different and independent bases for climatic calibration; they include the use of modern training sets, sediment trap studies, and historic calibration. Some, but not all, marine, lake, peat, and cave records have annual time resolution. Those that do not have annual dating may nonetheless be able to capture low-frequency climate fluctuations (Moberg et al. 2005b). A major challenge in these cases is to ensure that records are accurately dated and correlated because, if they are not, composite records will tend to smooth out the true temperature variability.


