
6
Ice Isotopes
|
Measurements of oxygen and hydrogen isotopic ratios in ice cores, or ice isotopic ratios, are an important temperature proxy, providing high-resolution continuous records of climatic temperature change at locations with persistent snow accumulation and low temperatures.1 The isotopic record provides information about climate because atmospheric moisture transported onto cold glaciers is distilled by the precipitation process as the air mass cools. This distillation combines with the temperature dependence of isotopic separations
during snow formation to generate an ice isotopic ratio signal. Both of these factors increase in strength as temperature is reduced and, consequently, the correlation of the ice isotopic ratio with temperature is very strong in the cold interiors of the polar ice sheets. Ice isotopic ratio records are geographically limited to locations of significant ice thickness, namely, polar regions and high-altitude mountain ranges elsewhere. It is remarkably fortuitous that the high Andes, the Tibetan and Himalayan ranges, and the great volcanoes of eastern equatorial Africa offer any ice records at all for Earth’s low latitudes.
PHYSICAL BASIS FOR DERIVING CLIMATE SIGNALS FROM ICE ISOTOPIC RATIO RECORDS
The temperature dependence of the ice isotopic ratio arises from fundamental physics at the molecular scale combined with geophysical processes at the planetary scale (Dansgaard 1964, Kavanaugh and Cuffey 2003). However, additional influences on ice isotopic ratio can be significant (Dansgaard 1964, Pierrehumbert 1999, Alley and Cuffey 2001, Kavanaugh and Cuffey 2003, Jouzel et al. 1997), and, consequently, ice isotopic ratio measurements must be calibrated against independent temperature information in order to be used as a quantitatively accurate thermometer (Cuffey et al. 1995). Such calibrations have been applied for long-timescale records from the polar ice sheets, but not for low-latitude high-altitude ice cores (from the Andes, Kilimanjaro, and Tibet), where it is more difficult to isolate and quantify the temperature component of the signal. In general, the ice isotopic ratio records from the interior regions of polar ice sheets yield good temperature reconstructions (Alley and Cuffey 2001, Cuffey et al. 1995). The low-latitude ice isotopic ratios yield a climate signal that depends on a variety of hydrologic and thermal influences in the broad geographic region that supplies moisture to the high glaciated mountains (Pierrehumbert 1999, Tian et al. 2003, Vuille et al. 2003a, Hoffmann et al. 2003, Thompson and Davis 2005, Alley and Cuffey 2001, Jouzel et al. 1997). The connection of ice isotopic ratio to temperature becomes stronger at lower temperatures (e.g., Kavanaugh and Cuffey 2003, Jouzel et al. 1997).
All glacial sites in the low latitudes are cold enough that this temperature influence will have some reflection in the ice isotopic ratio (Pierrehumbert 1999, Tian et al. 2003). Ambiguity results from significant residual influences of warmer regions upwind and local processes related to snowfall timing and preservation (Hardy et al. 2003). Precipitation amount is the effect of greatest importance (Dansgaard 1964). Near sea level at low latitudes the isotopic ratios in precipitation are demonstrably not reflective of temperature changes at ground level—the water distillation process primarily happens in the vertical dimension in large storm clouds, resulting in a correlation between precipitation amount and isotopes at ground level, rather than a correlation between temperature and isotopes. The high-altitude low-latitude ice core sites are in a transition zone where both temperature and this precipitation effect have influence (Pierrehumbert 1999).
In Tibet, ice isotopic ratios in the south appear to be dominantly influenced by monsoonal precipitation, whereas in the north, temperature dominates (Yao et al. 1996, Tian et al. 2003). In the equatorial Andes, ice isotopic ratios retain a strong influence of precipitation over the Amazon lowlands and partly correlate with both Pacific sea surface temperatures and Amazonian temperatures (Henderson et al. 1999,
Hardy et al. 2003, Vuille et al. 2003a). The local warming observed at the Quelccaya ice cap (Thompson et al. 2000a, Mark and Seltzer 2005) does correlate with the ice isotopic ratio there. In both Tibet and the Andes, there is no clear relationship between ice isotopic ratio and local accumulation on the ice caps. Thus, the ice isotopic ratios in these locations are not heavily influenced by local precipitation, but hydrologic influences retained from the lowland regions upwind may still be very important. Controls on ice isotopic ratio in equatorial Africa are not known.
CALIBRATION AND RESOLUTION
The correlation of the ice isotopic ratio with temperature is very strong in the cold interiors of the polar ice sheets. Calibration is nonetheless necessary because factors like the seasonal timing of precipitation, the warm-weather bias of storms, and the atmospheric mixing of air masses may change with time. Calibration of the ice isotopic ratio thermometer is achieved over a range of timescales (Alley and Cuffey 2001 and references therein) by using weather station and satellite records for annual cycles, by using gas isotopic ratios for decadal-scale rapid climate changes, and by using borehole temperatures for centennial-to-millennial-scale climate changes. Such studies have shown polar ice isotopic ratios to be reliable thermometers. Before calibration, temperature changes inferred from ice isotopic ratio changes are accurate to within a multiple of approximately 2. Temperatures recorded by ice isotopic ratio in the polar ice sheets are representative of a broad region in the ice sheet interior and also include an imprint of temperature at much larger scales.
The time resolution of ice isotopic ratio temperature reconstructions varies from place to place. Many sites from Greenland, the Canadian Arctic, and the tropics have nearly annual resolution, whereas sites from the very dry interior of East Antarctica have only decadal resolution. Diffusional smoothing reduces the resolution from annual to a few years or more in most places, and this reduction of resolution increases backward in time. The time span covered by ice isotopic ratio records is greatest where snowfall rates are small and glacier thicknesses are greatest, and varies from several hundred thousand years in central East Antarctica to 100,000 years in central Greenland to 10,000 years in the high-altitude tropics and coastal Antarctica and Greenland. Most glaciers in the midlatitude mountains cannot provide long records of this sort because the ice mass is too rapidly removed by flow.
RESULTS FROM ICE ISOTOPIC RATIO RECORDS
The four available ice cores from Tibet (Figures 6-1 and 6-2) together show that 20th century climate is anomalous relative to the preceding 1,900 years for this region (Thompson et al. 1989, 1997, 2000a, 2003, 2006, in press).2The anomaly is some combination of apparent warm conditions and weak monsoon precipitation. That a warming is part of this signal is clear, given that the anomaly is seen in the northern Tibetan records and that the monsoon-dominated southern records correlate with instrumental trends in the region (Thompson et al. 2000a; the Dasuopu core). A
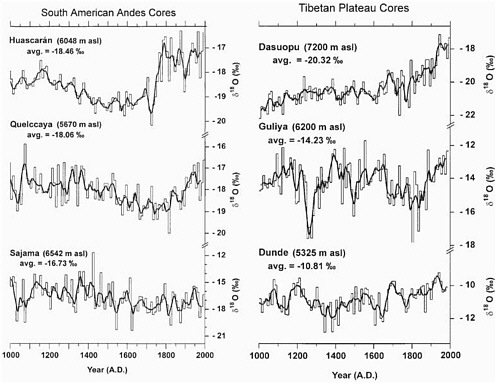
FIGURE 6-1 Isotopic records from high-altitude ice cores from the equatorial Andes (left) and the Tibetan Plateau (right). Higher isotopic values generally indicate warmer conditions, but the records from the Andes may be dominated by hydrologic factors such as precipitation in Amazonia. SOURCE: Thompson et al. (2003). Reprinted with kind permission of Springer Science and Business Media; copyright 2003.
quantitative assessment of temperature change from the north Tibetan cores, using typical isotopic sensitivity, is preliminary, but both suggest warming over the last 150 years of at least 1°C.3
The ice isotopic ratio records available from three sites in the high Andes (Figures 6-1 and 6-2) together suggest warm conditions and weak Amazonian precipitation over the last two centuries, relatively cold and wet from 1400 to 1800, and relatively warm and dry before then (Thompson et al. 1986, 1995, 1998, 2000b, 2003, 2006). The current warm/dry period is a 20th century phenomenon at Quelccaya, but clearly began around 1750 at Huascaran (to the north) and is absent from Sajama (to the south). This latitudinal gradient is interesting but not yet understood. Ice isotopic
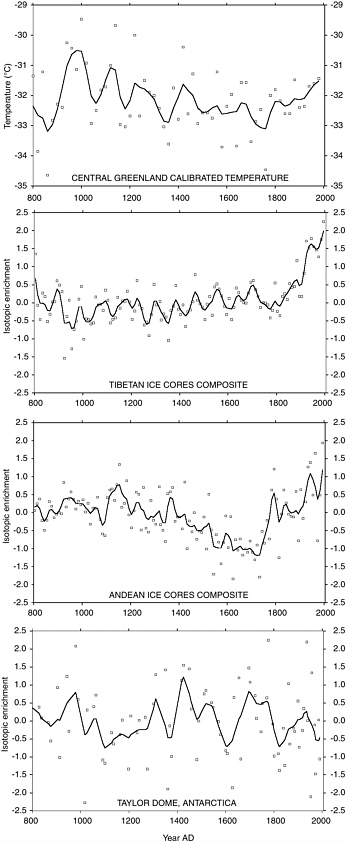
FIGURE 6-2 Two composite isotopic records from low latitudes and two isotopic records from single locations on the polar ice sheets. Top: Record for central Greenland (GISP2 site), converted to temperature by calibration against borehole temperatures. Second from top: Composite record (normalized to mean and standard deviation) for four ice cores from Tibet. Third from top: Composite record (normalized to mean and standard deviation) for three ice cores from the equatorial Andes. Bottom: Normalized record (deuterium) from Taylor Dome, Antarctica. In each plot, data are shown as point measurements and a smoothed version is superimposed for clarity of trends. The central Greenland and Taylor Dome series are smoothed using a 100-year triangular filter, while the composite series uses a 50-year triangular filter. SOURCES: Data from Cuffey and Clow (1997), Thompson et al. (2003, 2006), and Steig et al. (2000).
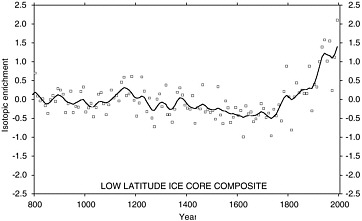
FIGURE 6-3 Composite isotopic record from low latitudes, including four ice cores from Tibet and three from the Andes. The isotope records have been normalized to mean and standard deviation and averaged. The solid line is a smoothed version of the composite record created using a 50-year triangular filter. SOURCE: Data from Thompson et al. (2006). Reprinted with permission; copyright 2006.
ratios from Kilimanjaro reveal no consistent trend over the last two millennia (Thompson et al. 2002).
The combined isotopic signal from all available ice cores in Tibet and the Andes shows that the climate of the 20th century was unusual with respect to the preceding 1900 years (Figure 6-3).
In Greenland (Figure 6-2) and coastal Antarctica, ice isotopic ratio records clearly shows 20th century warming, a Little Ice Age, and earlier warmth. In Greenland, this earlier warmth is centered at about A.D. 1000, whereas in Antarctica it was much earlier. Borehole temperature analyses yield the same pattern (see Chapter 8). In Greenland, the 20th century warmth is not higher than that during medieval times (11th century). In the Canadian Arctic, ice isotopic ratio records from the Agassiz Ice Cap on Ellesmere Island show warming over the last 150 years, which is unprecedented for the last millennium (Fisher et al. 1995). As a group, the ice cores from interior Antarctica (Figure 6-2) show nothing anomalous about the 20th century (Masson et al. 2000).


