
7
Glacier Length and Mass Balance Records
|
Outside of the very cold polar regions, the majority of glaciers in mountain ranges worldwide retreated substantially during the 20th century (Oerlemans 1994, 2005a; Dyurgerov and Meier 1997a,b, 2000; Sapiano et al. 1998; Kaser 1999; Warren and Aniya 1999; Francou et al. 2000; Arendt et al. 2002; Dyurgerov 2003; Khromova et al. 2003; Thompson et al. in press). The reduction in ice cover is pronounced in nearly every major high glaciated mountain range examined, including the Alaska Range and Alaska’s Southeastern Ranges, the Canadian Rockies, the Washington Cascades, the equatorial and Patagonian Andes, the European Alps, the New Zealand Alps, the Tien-Shan, and the Himalayas. In the mid- and high latitudes, this glacier retreat was caused primarily by
widespread climatic warming, which increased ice loss by melt (Oerlemans 2001, 2005a; Dyurgerov and Meier 2000; Oerlemans et al. 1998; Zuo and Oerlemans 1997; Oerlemans and Fortuin 1992). In the tropics, glacier retreat was apparently caused by both temperature changes and moisture changes, depending on the time and region (Kaser 1999, Francou et al. 2000, Mölg et al. 2003, Vuille et al. 2003b, Kaser et al. 2004, Mark and Seltzer 2005). Warming is the dominant factor in the tropical Andes (Thompson et al. 2000b, Vuille et al. 2003b, Mark and Seltzer 2005), whereas moisture change has an influence in equatorial Africa (Mölg et al. 2003, Kaser et al. 2004). On average, snowfall rates increased modestly on these glaciers during the latter half of the 20th century (Dyurgerov and Meier 2000), providing strong evidence against drying as a cause of retreat for this time period.
RECONSTRUCTING TEMPERATURE RECORDS FROM GLACIER RECORDS
Records of glacier length changes during the 20th century and earlier have been analyzed to reconstruct past temperature changes (Oerlemans 1994, 2005a; Oerlemans et al. 1998). These analyses are based on glacier physics (Paterson 1994, Van der Veen 1999, Oerlemans 2001) and provide temperature information that is independent of other temperature reconstruction methods. In particular, the temperature reconstruction from glacier retreat is not calibrated against the instrumental record. Instead, it is based on glacier dynamics models that are highly generalized but calibrated against a small number of extensively studied glacier systems (Oerlemans et al. 1998, Oerlemans 2001) for which realistic glacier dynamics and energy balance modeling has been completed. Glacier-length-based temperature reconstructions are further significant because the influences of urban heat islands and land use changes are likely to be small.
Oerlemans (2005a) showed that temperatures increased by about 0.6°C from the late 19th to the mid-20th century and were persistently cool in the three centuries before this (Figure 7-1). Results also show a small cooling from 1950 to 1980, followed by renewed warming until the record ends in 1990. Data on recent and ongoing retreats have not yet been extensively compiled. It is known, however, that mass loss from mountain glaciers increased strongly in the 1990s due primarily to accelerated warming (Dyurgerov 2003, Meier et al. 2003, Dyurgerov and Meier 2005).
During their period of overlap (1850–1990) the glacier length reconstruction and the instrumental record are very similar in magnitude and pattern (Oerlemans 2005a). The glacier length record thus validates the quantitative accuracy of the instrumental composite for this period as a large-scale average. Reconstructed temperatures from the glacier length record are similar for low- and high-altitude glaciers (Oerlemans 2005a). The dominant pattern of cool climate for a few centuries followed by warming beginning in the late 19th century is seen in all geographic regions examined, though significant differences in details exist.
MORE DETAILED BACKGROUND ON GLACIER-LENGTH-BASED RECONSTRUCTIONS
The most recent and comprehensive temperature reconstruction (Oerlemans 2005a) uses glacier length records for a large number of glaciers (Oerlemans et al. 1998, Oerlemans 2001). The information needed for detailed individual modeling for most of these glaciers does not exist, so the analysis instead uses an approximate and
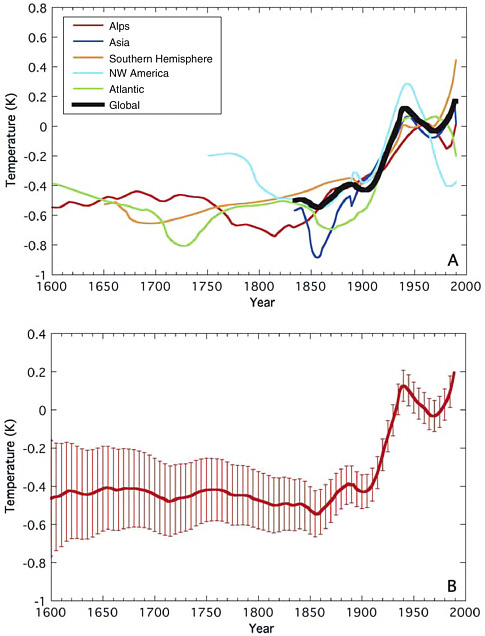
FIGURE 7-1 (A) Glacier-length-based temperature reconstruction for various regions. The black curve shows an estimated global mean value, obtained by giving weights of 0.5 to the Southern Hemisphere, 0.1 to Northwest America, 0.15 to the Atlantic sector, 0.1 to the Alps, and 0.15 to Asia. (B) Best estimate of the global mean temperature, obtained by combining the weighted global mean temperature for 1834–1990 with the average of temperature records at earlier times. The band indicates the estimated standard deviation. SOURCE: Oerlemans (2005a). Reprinted with permission from AAAS; copyright 2005.
generalized approach. Both the sensitivity of glacier length to temperature and the lag time for the glacier response are parameterized in terms of the dominant physical controls or correlates, which are topographic slope, annual precipitation, and glacier length itself. The connection of these parameterizations to the underlying physics is supported in the technical literature, including detailed analyses of specific glaciers (Oerlemans et al. 1998, Oerlemans 2001). However, these parameterizations are only expected to be accurate as an average for a large number of glaciers.
The sensitivity of glacier length to temperature arises from a fundamental aspect of glacial systems (Paterson 1994, Van der Veen 1999, Oerlemans 2001)1: A glacier forming at high altitude will advance downward, extending its front into a region of net melt until all ice mass flux supplied from the high-altitude regions is removed by melt in the lower region. Glaciers will always tend toward such a balance between mass inputs to the system and mass outflow, and this balance will be achieved with the glacier straddling the boundary between regions of net melt and net snowfall. Any climate change will affect this delicate balance and cause some adjustment of the glacier system.
The dominant climatic influences are temperature and snowfall rate, though other variables such as cloud cover can be important in some situations. A temperature increase in the overlying atmosphere increases the energy input to a melting glacier surface through increased downward longwave radiation and increased sensible heat transfer, increasing the rate of melt. An increase in temperature also causes more of the precipitation to reach the glacier surface as rain instead of snowfall. Snowfall is the supply of new ice mass that sustains the glacier. A reduction or increase of the snowfall rate will cause the glacier to shrink or grow, respectively.
Considering individual glaciers, snowfall changes can cause glaciers to advance and retreat, and this effect dominates in some situations (e.g., western Norway before the late 1990s). Temperature is a more powerful influence on average, however, because the melt process only acts over a small fraction of the annual cycle and uses a small fraction of the total energy flux, so its capacity to change is large. A typical quantitative estimate for the leverage of temperature versus snowfall on mountain glaciers is that a 1°C temperature increase is equivalent to a 25 percent reduction of snowfall (Oerlemans and Fortuin 1992, Oerlemans et al. 1998, Oerlemans 2001). As a consequence, glaciers on Earth exist in precipitation regimes extending from the very wet temperate and tropical highlands down to the driest polar deserts, but are completely absent from environments spanning a large range of medium to high mean annual temperatures.
In principle, it would be possible for the global population of glaciers to have shrunk over the past century due to a global-scale precipitation reduction. However, there is no evidence of such a global drying (Folland et al. 2001a), which would require an unprecedented spatial coherence. Furthermore, focused studies of individual glaciers demonstrate the dominant role of temperature change in 20th century retreats (Oerlemans et al. 1998, Oerlemans 2001), and mass balance studies for the later 20th century show that, on average, for studied glaciers, snowfall has been increasing
(Dyurgerov and Meier 2000, Dyurgerov 2003). Hence, it is reasonable to assume that precipitation changes induce variability (or noise) in the glacier length record but do not control its global mean pattern. Regional patterns, on the other hand, are in some cases dominated by precipitation or other variables. For example, in the late 20th century, increased snowfall caused glaciers in western Scandinavia to advance (Dyurgerov and Meier 1997a,b, 2000), whereas combinations of precipitation and temperature changes have induced retreat of the glaciers in equatorial Africa (Mölg et al. 2003, Kaser et al. 2004, Hastenrath 2005). Although warming in recent decades is an important factor driving glacier recession on Mt. Kenya and the Ruwenzori summits, the much higher altitude glaciers on Kilimanjaro may be shrinking primarily as a continuing response to precipitation changes earlier in the century. The magnitude and importance of recent warming are still being researched.
Temperature reconstructions based on glacier length and mass balance records are limited in their temporal and spatial resolution. They do not provide a year-to-year view of temperature change, but only averages over several years to decades (depending on the resolution of the length measurements and on the accuracy of assumptions in the physics). They do not provide any information about most of the globe prior to the 19th century. Only the North Atlantic and European Alpine regions have glacier records back to around A.D. 1600, and even in these regions there is little information prior to the 17th century. The time required for data collection, compilation, and reporting has so far prevented the most recent 15 years from being included in the analysis. In North America, many of the glacier records end between the mid-1970s and 1990 (Oerlemans 2005a), so for this region the late 20th century reconstruction is not yet reliable. Geographic limits arise from the obvious fact that glaciers do not exist everywhere, so the low and middle elevations of the low latitudes are entirely absent. There is also a paucity of data for the Southern Hemisphere. Finally, these reconstructions cannot be done for mountain glaciers in Antarctica because it is so cold there that melt is not the dominant mass loss process (it is iceberg production), so the connection to temperature is different.
OTHER INFORMATION AVAILABLE FROM GLACIERS
Though not suitable for reconstructing temperature time series, other glacier indicators—such as melting on ice caps, organic material uncovered when glaciers melt, and disintegration of ice shelves—provide temperature information. An increase of summertime warmth over the last 150 years caused increased melt on Ellesmere Island’s major ice cap in the Canadian Arctic. This extent of melt had not occurred in the previous 1,500 years (Fisher et al. 1995).
The recent retreat of glaciers has exposed organic material that would have decomposed if not covered by ice, including a human body (the now famous “Ice Man” of the Alps) and plant material (Thompson et al. in press). Three of these finds have been dated (from the Alps, from Washington State, and from Peru) and all have ages greater than 5,000 years before present. This suggests rather strongly that the current deglaciation is unprecedented in the last few millennia at these widespread sites. Nonetheless, it is known from dating of organic material transported to the fronts of glaciers in the Alps that glacier recessions more extensive than the present one have occurred at some sites in Europe (Hormes et al. 2001), with dates ranging from A.D. 800 to
8000 B.C. Such recession has thus occurred in the past due to natural variability, but has been rare in the most recent few millennia.
In the Andes, at the same glacier where the dated plant material was exposed (Quelccaya), melting in the 1980s was strong enough to destroy the geochemical signature of annual layers in the ice beneath (Alley 2006; Thompson et al. 2003, in press). An ice core taken from Quelccaya in the late 1970s showed that such melt had not happened in at least the previous millennium. This strongly suggests anomalous warmth in the late 20th century. The Quelccaya ice cap has existed without interruption for more than 1,000 years. If its present rate of shrinkage continues, it will disappear entirely within a few decades.
Over the last few decades, the floating ice shelves along the Antarctic Peninsula have been disintegrating, following a progressively southward pattern (Vaughan and Doake 1996, Cook et al. 2005). This is primarily a result of higher temperatures inducing surface melt (van den Broeke 2005). Analysis of sediment cores from the seafloor (Domack et al. 2005) beneath one of the largest former shelves (the Larsen B, which disintegrated in the late 1990s) indicates that this ice shelf had persisted throughout the previous 10,000 years, providing further evidence that recent decades have been anomalously warm.


