
8
Realizing the Future
The intellectual merit and tremendous discovery potential of the AMO science described in the previous chapters of this report are unmistakable, and AMO technologies are of high value to U.S. needs, including those of commerce, defense, and medicine. The future for this field is enormously promising, both as an engine of fundamental discovery and as a generator of essential technologies that foster progress in other disciplines and in industry. Indeed, in the 12 years that have elapsed since the last decadal survey of AMO science,1 15 Nobel prizes have been awarded to researchers in this field.2 AMO science and technology is in a period of remarkable productivity and importance. Thus, strength in this discipline is an important part of maintaining U.S. leadership in science and technology generally and in the physical sciences in particular.
The purpose of this last chapter is to put these developments in AMO science in the present-day context of science in the United States and the world. Here the committee discusses the budgetary and political outlook for the near and mid-term future, as well as U.S. needs for technically trained people in this very important area. Based on an analysis of future scientific opportunities and of data gathered
from the federal funding agencies,3 the committee came to a set of conclusions and recommendations that can guide U.S. policy makers and funding agencies as they distribute precious resources in difficult times. The conclusions are in the final section of this chapter.
THE CURRENT STATUS OF AMO PHYSICS PROGRAM SUPPORT
The key U.S. agencies supporting the field (DOE, NIST, and NSF) have recognized the recent extraordinary achievements in AMO physics and have responded well to the new opportunities that have emerged, with budget increases in real terms (that is, in constant FY2005 dollars) of 26 percent over the last decade (Table 8–1). These increases, which required difficult choices by program staff, are all the more notable given the inflation-adjusted flat budgets for physical science over the same period (as measured by the Consumer Price Index (CPI)).4 The result of these investments has been an outpouring of excellent science. Indeed, the AMO example is an interesting case study for the benefits of federal investments in science generally: Good funding of excellent science leads to an excellent return on investment, which in turn leads to new opportunities.
In contrast, there has been a worrisome trend in the Department of Defense (DOD) science agencies to cut back on funds for research generally and for basic research in AMO physics in particular. This policy, which reflects heightened priorities for national security and homeland defense, cannot be justified as a wise or effective long-term strategy if the goal is maximizing the overall strength of the nation. This judgment on the importance of S&T to our overall national security (broadly defined) has been asserted many times over the years in a number of major reports,5
|
3 |
The committee prepared a questionnaire for the federal agencies that support AMO research in order to collect information on the current trends in AMO science, personnel, training, and funding. The agencies involved are the Air Force Office of Scientific Research (AFOSR), the Army Research Office (ARO), the Defense Advanced Research Projects Agency (DARPA), the Department of Energy (DOE), the National Aeronautics and Space Administration (NASA), the National Science Foundation (NSF), the National Institute of Standards and Technology (NIST), and the Office of Naval Research (ONR). Appendix A contains the questionnaire and Appendixes B-F contain the responses. |
|
4 |
For a guide to R&D funding data by science and engineering discipline, see the Web site of the American Association for the Advancement of Science at <http://www.aaas.org/spp/rd/guidisc.htm>. |
|
5 |
See the following reports: House Committee on Science, Unlocking Our Future: Toward a New National Science Policy (1998), available at <http://www.house.gov/science/science_policy_report.htm>, accessed June 2006; Before It’s Too Late (Glenn Commission) (2000), available at <http://www.ed.gov/inits/Math/glenn/report.pdf>, accessed June 2006; The United States Commission on National Security/21st Century, Road Map for National Security: Imperative for Change (2001), also known as the Hart-Rudman Report, available at <http://www.fas.org/man/docs/nwc/phaseiii.pdf>, accessed June 2006; National Science Foundation, The Science and Engineering Workforce: Realizing America’s Potential (2003), available at <http://www.nber.org/~sewp/>, accessed June 2006; U.S. Domestic |
TABLE 8–1 Funding Histories in AMO Science (1996–2005) (millions of dollars)
|
|
DOE |
NIST Total |
NSF |
DOE/NIST/NSFa |
DOD/NASAb |
||||
|
Year |
Centers |
Total |
Centers |
Total |
As-Spent Total |
Deflator |
FY2005 $ |
||
|
1996 |
5.81 |
9.93 |
44.90 |
2.4 |
17.45 |
72.3 |
0.800 |
90.3 |
See notes below and Appendix B |
|
1997 |
5.70 |
9.93 |
46.80 |
2.4 |
17.54 |
74.3 |
0.820 |
90.6 |
|
|
1998 |
6.01 |
9.93 |
48.10 |
2.4 |
19.59 |
77.6 |
0.843 |
92.1 |
|
|
1999 |
6.01 |
11.02 |
50.30 |
2.4 |
20.79 |
82.1 |
0.861 |
95.4 |
|
|
2000 |
5.94 |
10.77 |
51.40 |
3.75 |
21.74 |
83.9 |
0.890 |
94.3 |
|
|
2001 |
6.34 |
11.43 |
55.50 |
7.25 |
27.10 |
94.0 |
0.916 |
102.7 |
|
|
2002 |
6.95 |
11.82 |
61.30 |
7.22 |
28.16 |
101.3 |
0.930 |
108.9 |
|
|
2003 |
7.30 |
13.38 |
65.00 |
7.33 |
30.95 |
109.3 |
0.951 |
115.0 |
|
|
2004 |
7.54 |
13.88 |
66.90 |
7.45 |
26.62 |
107.4 |
0.977 |
109.9 |
|
|
2005 |
7.68 |
16.63 |
70.00 |
7.56 |
27.24 |
113.9 |
1.000 |
113.9 |
|
|
aNotes on DOE, NIST, and NSF 1. Table includes only information from NSF/PHY, DOE/BES/AMOS, and NIST (see Appendixes B, D, and E). 2. Indicates that there has been ~26 percent real growth in AMO funding over the decade from these sources. 3. In constant FY2005 dollars, DOE has grown by ~34 percent, NIST by ~25 percent, and NSF by ~25 percent. 4. Other parts of DOE and NSF support AMO science also. Sometimes this support is very large (e.g., construction of LCLS by DOE/BES). These funds are not included here. 5. Amounts to theory: DOE, ~25 percent; NIST, ~7 percent; and NSF, ~17 percent. 6. AMO funds to universities: DOE, –60 percent; NIST, –10 percent; NSF, 100 percent. Remainders stay inhouse. 7. Many investigators in AMO science have multiple means of support. bNotes on DOD agencies (AFOSR, ARO, DARPA, ONR) and NASA 1. The data supplied to the committee by the DOD agencies and by NASA were mostly anecdotal. 2. The DOD agencies have a long history of substantial funding to AMO science, though this declined over the last decade or so. In FY2005, support levels were approximately as follows: AFOSR, $5.5 million; ARO, $5 million; DARPA, >$30 million; and ONR, $5 million. Thus these agencies added more than $45 million to the above total (see Appendix A). Recent funding also been at about this level, though a detailed accounting is difficult because of program variability and high interdisciplinarity. Yearly funding data were not supplied to the committee. 3. Amounts to universities are AFOSR, ~75 percent; ARO, 100 percent; and ONR, ~67 percent. DARPA’s funds also go predominantly to universities. 4. Amounts to theory are AFOSR, –10 percent; ARO, –20 percent; DARPA, ~0 percent; and ONR, ~33 percent. |
|||||||||
including, recently, Rising Above the Gathering Storm:6
The United States takes deserved pride in the vitality of its economy, which forms the foundation of our high quality of life, our national security, and our hope that our children and grandchildren will inherit ever-greater opportunities. That vitality is derived in large part from the productivity of well-trained people and the steady stream of scientific and technical innovations they produce. Without high-quality,
knowledge-intensive jobs and the innovative enterprises that lead to discovery and new technology, our economy will suffer and our people will face a lower standard of living. Economic studies conducted before the information-technology revolution have shown that even then as much as 85 percent of measured growth in U.S. income per capita is due to technological change.
Today, Americans are feeling the gradual and subtle effects of globalization that challenge the economic and strategic leadership that the United States has enjoyed since World War II. A substantial portion of our workforce finds itself in direct competition for jobs with lower-wage workers around the globe, and leading-edge scientific and engineering work is being accomplished in many parts of the world. Thanks to globalization, driven by modern communications and other advances, workers in virtually every sector must now face competitors who live just a mouse-click away in Ireland, Finland, China, India, or dozens of other nations whose economies are growing.
In view of these concerns,
the National Academies was asked by Senator Lamar Alexander and Senator Jeff Bingaman of the Committee on Energy and Natural Resources, with endorsement by Representatives Sherwood Boehlert and Bart Gordon of the House Committee on Science, to respond to the following questions:
What are the top 10 actions, in priority order, that federal policy-makers could take to enhance the science and technology enterprise so that the United States can successfully compete, prosper, and be secure in the global community of the 21 st Century?
What strategy, with several concrete steps, could be used to implement each of those actions?
The Gathering Storm report responds with four major recommendations (and a number of secondary ones):
Recommendation A: Increase America’s talent pool by vastly improving K-12 science and mathematics education.
Recommendation B: Sustain and strengthen the nation’s traditional commitment to long-term basic research that has the potential to be transformational to maintain the flow of new ideas that fuel the economy, provide security, and enhance the quality of life.
Recommendation C: Make the United States the most attractive setting in which to study and perform research so that we can develop, recruit, and retain the best and brightest students, scientists, and engineers from within the United States and throughout the world.
Recommendation D: Ensure that the United States is the premier place in the world to innovate; invest in downstream activities such as manufacturing and marketing; and create high-paying jobs that are based on innovation by modernizing the patent system, realigning tax policies to encourage innovation, and ensuring affordable broadband access.
Perhaps the most prominent of the secondary recommendations in the Gathering Storm is the call to establish a special new focus on research into alternative sources of energy (via the creation of a new agency, DARPA-E)—to relieve our “addiction to oil,” as President Bush framed the issue in his 2006 State of the Union address. In that speech, President Bush commented on many of the themes that appear in the Gathering Storm and announced the American Competitiveness Initiative to start in FY2007, which includes an advanced energy initiative comprising a number of proposed activities across a broad front of energy research. The committee believes that strong federal stewardship of the opportunities and challenges in the physical sciences generally and in AMO science specifically will be an important element of these initiatives. AMO science addresses directly the report’s major recommendations (C and D, above). AMO science also provides critical research paths that will be necessary to meet the challenges in attaining future energy security.
These recommendations assume even greater urgency because over the last decade, U.S. funding for the physical sciences overall has just kept pace with inflation.7 However, many observers believe that the cost of doing research rises significantly faster than the CPI would indicate—in particular due to the dramatic rise in the capability of new instrumentation. Increasing computational power and new capabilities in electronics allow building instruments that were simply unimaginable only 5 or 10 years ago. While this progress opens rich and productive new avenues for research, following them is very expensive. Agency budgets are simply not rising fast enough to keep up.
While federal spending for AMO science has seen some real growth (see Table 8–1 and Appendix B) over the last decade, investments in the life sciences over the same period—especially in medicine—have shown dramatic growth (see Figure 8–1). There have been many calls from Congress (by individual members, by congressional committees, in congressionally sponsored studies), from the business community, and from leaders in the life sciences community—including the director of the National Institutes of Health (NIH)—for the same kind of increases for the physical sciences as have been allocated for the biomedical sciences. But despite broad bipartisan congressional support for doubling the NSF budget and an authorization act that allows doing so, this doubling has not occurred. At the DOE Office of Science, budgets have declined in constant FY2004 dollars over the last 12 years, though there has been growth in the Office of Basic Energy Sciences.
Unfortunately, because of very significant pressures to constrain federal spending, federal allocations for physical science have remained static at best and at
|
7 |
For a guide to R&D funding data by science and engineering discipline, see the Web site of the American Association for the Advancement of Science at <http://www.aaas.org/spp/rd/guidisc.htm>. |
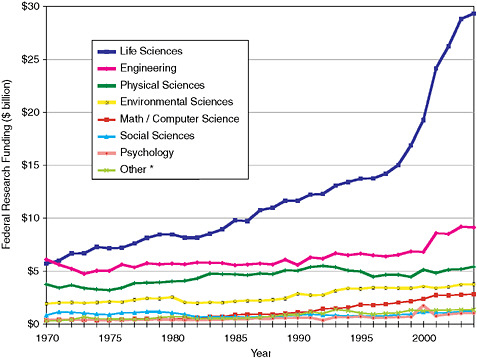
FIGURE 8–1 Trends in federal research by discipline, FY1970–2004, obligations in billions of constant FY2004 dollars. Data are based on National Science Foundation, Federal Funds for Research and Development FY2002, 2003, and 2004. FY2003 and 2004 data are preliminary. SOURCE: American Association for the Advancement of Science. NOTE: “Other” includes research not classified (basic research and applied research; excludes development and R&D facilities).
times decreased over the medium term. The committee believes that continuing this policy would lead to a dangerous outcome for the United States. However, the increases sought in the President’s 2007 budget request are reassuring. There are very few dollars that the government spends that bring more added value for our country than the funds spent on scientific research and on the education of our future scientific workforce.
MAINTAINING U.S. LEADERSHIP IN A CRITICAL AREA OF SCIENCE AND TECHNOLOGY
Countries around the world recognize the enormous value of AMO science and technology. The international AMO scene is highly competitive, and nations
in Europe and the Far East are making substantial investments in this area (see Appendix C). Of the 15 Nobel laureates mentioned in footnote 2, 5 either did their ground-breaking research in Europe or the Middle East or were trained there. More generally, foreign investment in science, as a percentage of GDP, in many cases surpasses the U.S. investment. Among the countries of the Organisation for Economic Co-operation and Development (OECD)8 countries, the United States ranked fifth in the ratio of total R&D to GDP and sixth with the inclusion of Israel.9
As the Gathering Storm report stresses, in recent years it has become very clear that maintaining U.S. leadership in physical science depends on more than simply money. Since at least the 1980s, the United States has benefited from a large influx of foreign nationals to fill the ranks of the scientific and engineering workforce. Indeed, according to a recent survey by the Council of Graduate Schools,10 engineering and physical science have been the leading attractors among all fields of graduate study for foreign-born students. Figure 8–2 shows that in recent years only about 52 percent of the Ph.D.s granted in the United States have been to U.S.-born students. AMO science has benefited greatly from the influx of talented foreign-born students.
Now that there are excellent opportunities for these talented people in their home countries, they are either staying there to start with or training in the United States and then returning home. This has left the United States in a potentially vulnerable position, since recent history shows that American-born students are generally making career choices outside science. Without remediation, the United States could fall into a capability gap. The National Science Board recently commented on this situation:11
Every two years the National Science Board supervises the collection of a very broad set of data trends in science and technology in the United States, which it publishes as Science and Engineering Indicators (Indicators). In preparing Indicators 2004, we have observed a troubling decline in the number of U.S. citizens who are training to become scientists and engineers, whereas the number of jobs requiring science and engineering (S&E) training continues to grow. Our recently published report entitled The Science and Engineering Workforce/Realizing America’s Potential (NSB 03–69, 2003) comes to a similar conclusion. These trends threaten the economic welfare and security of our country.
|
8 |
Current members of the OECD are Australia, Austria, Belgium, Canada, Czech Republic, Denmark, Finland, France, Germany, Greece, Hungary, Iceland, Ireland, Italy, Japan, Korea, Luxembourg, Mexico, Netherlands, New Zealand, Norway, Poland, Portugal, Slovak Republic, Spain, Sweden, Switzerland, Turkey, United Kingdom, and United States. |
|
9 |
|
|
10 |
See <http://www.cgsnet.org/>. |
|
11 |
See A Companion to Science and Engineering Indicators 2004, available at <http://www.nsf.gov/statistics/nsb0407/>. |
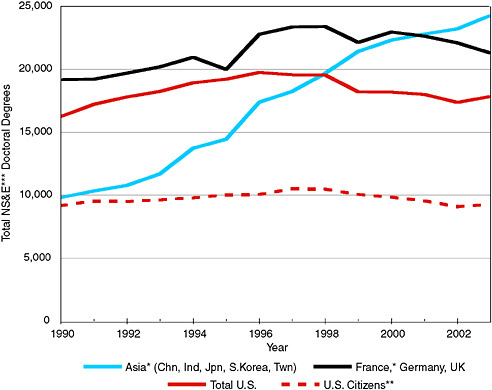
FIGURE 8–2 Natural science and engineering Ph.D.s granted in the United States compared to the major European nations and to Asia. About 52 percent of U.S.-granted Ph.D.s are awarded to American-born students. Data drawn from 2006 NSF Science and Engineering Indicators. SOURCE: American Physical Society, Washington office. NOTES: *Some data were not available, so as a conservative estimate, prior-year data were used. The 2001 China data were used for the 2002 and 2003 values; 2001 Taiwan value for 2002 value; 2000 and 2002 South Korea data for 2001 and 2003, respectively; 1999 France value for 2000–2003. **U.S. institutions only. ***NS&E degrees include natural (physical, biological, Earth, atmospheric, and ocean sciences), agricultural, and computer sciences, mathematics, and engineering.
If the trends identified in Indicators 2004 continue undeterred, three things will happen. The number of jobs in the U.S. economy that require science and engineering training will grow; the number of U.S. citizens prepared for those jobs will, at best, be level; and the availability of people from other countries who have science and engineering training will decline, either because of limits to entry imposed by U.S. national security restrictions or because of intense global competition for people with these skills. The United States has always depended on the inventiveness of its people in order to compete in the world marketplace. Now, preparation of the S&E workforce is a vital arena for national competitiveness.
Even if action is taken today to change these trends, the reversal is 10 to 20 years away. The students entering the science and engineering workforce in 2004 with advanced degrees decided to take the necessary math courses to enable this career path when they were in middle school, up to 14 years ago. The students making that same decision in middle school today won’t complete advanced training for science and engineering occupations until 2018 or 2020. If action is not taken now to change these trends, we could reach 2020 and find that the ability of U.S. research and education institutions to regenerate has been damaged and that their preeminence has been lost to other areas of the world.
How will the United States respond to this overall situation? How will our country maintain its scientific leadership in AMO science and technologies and in other S&T areas, too, in the face of these budgetary and personnel pressures? Clearly it is a matter of strategic national importance. Because these are very serious issues, it is not surprising to find that they were addressed not only in the January 2006 State of the Union address, but also in the White House budget priorities and guidelines for 2007, in statements from many members of Congress, and in the plans of the funding agencies. The White House guidance on budget priorities for FY2007 contained the following language:12
Investments in the physical sciences likely to lead to or enable new discoveries about nature or strengthen national economic competitiveness continue to be important. Priority will be given to research that aims to close significant gaps in the fundamental physical understanding of phenomena that promise significant new technologies with broad societal impact. High-temperature and organic superconductors, molecular electronics, wide band-gap and photonic materials, thin magnetic films, and quantum condensates are examples of novel atomic and molecular-level systems with such gaps where coherent control holds great potential.
The committee welcomes the attention that these issues are receiving in the government. The President’s American Competitiveness Initiative and other aspects of the FY2007 budget request are dramatic further steps. This initiative has a number of important goals, including increases in federal investments in critical research areas in order to ensure that the United States continues to lead the world in opportunity and innovation and to provide American children with a strong foundation in math and science. In his remarks, President Bush asked Congress to double the federal commitment to the most critical basic research programs in the physical sciences over 10 years, including, specifically, a doubling of the sum of funding available to NIST, the NSF, and DOE’s Office of Science.
|
12 |
Available at <http://www.whitehouse.gov/OMB/memoranda/fy2005/m05–18.pdf>. |
PLANNING FOR FUTURE U.S. LEADERSHIP IN AMO SCIENCE
What must be done to realize the future promise of AMO science and technology and to capitalize on AMO’s many potential contributions to overall U.S. interests and national needs? The answers revolve around four major goals for the nation:
-
We must train the next generation of AMO scientists.
-
We must fund the field adequately in order to realize its discovery potential.
-
We must be alert to new and more efficient ways of doing these things: new training modalities and new operational structures (centers, multiinvestigator grants, formation of international teams, stronger cooperation between government and the private sector, and so on).
-
We must deal effectively with known or potential problems—for example, stimulating the growth of our own national workforce while continuing to attract foreign talent; continuing a steady flow of funding resources, with increases where possible; compensating for lost or shifting funding at some of the funding agencies; building links to the private sector where possible; achieving a good balance between mission-oriented and so-called “blue-sky” research; and responding to international competition.
The committee prepared a questionnaire for the federal agencies that support AMO research in order to collect information on the current trends in AMO science, personnel, training, and funding.13 In addition to those agencies the committee polled, there are other federal agencies that support research in AMO science. For example, at NIH AMO science plays a substantial interdisciplinary role in programs within the National Institute for General Medical Sciences and the National Institute for Biomedical Imaging and Bioengineering, but there is no grants program specific to AMO efforts. The National Security Agency (NSA) supports work in quantum information technology and possibly other parts of AMO science, but the committee did not attempt to gather information about it. Nor was information gathered from the Disruptive Technologies Office (DTO) or the National Nuclear Security Administration.
The responses received fall into four broad categories:
-
Information about the intellectual portfolio of the research currently supported by the federal government,
-
Information about its funding,
-
Information about the workforce and the training of the next generation of scientists, and
-
Information about new operational modalities for carrying out the research.
Each of these topics is discussed below. In view of the great diversity in these programs, the discussion is presented in some depth. The discussion also includes other issues that are important in shaping an effective national strategy, including the increasing importance of international competition in AMO science and important logistical issues emerging here at home.
Intellectual Outlines of Research Currently Supported
Appendix D contains the information the committee received about the current research profiles of the funding agencies. With the exception of the NSF, all of the agencies supporting AMO science are mission-oriented. Because proposals to NSF can be unconstrained in scientific content, the community sends in what it believes to be the most promising science. Applicants to the other AMO programs propose research in support of the agency mission and program goals. NSF judges the proposals it receives entirely on the basis of peer review, and DOE and NASA also use peer review to a great extent. Other agencies allocate funds based largely or entirely on the decisions of internal program staff.
The committee concludes that all the agencies, in spite of a significant mission orientation, strive to create dynamic, high-quality portfolios that advance scientific and technical knowledge as they meet those mission requirements. There is, however, considerable concern that the DOD agencies have decreased support for research generally and for basic research in particular (see below).
The AMO research profiles of federal agencies have shifted to newer areas such as intense field and ultrafast x-ray science, cooperative phenomena, ultracold atoms and molecules, precision measurements, nanoscale science, and quantum optics. The highly interdisciplinary, central role of AMO science is evident—the work clearly is of great interest to physics as a whole.
There has been a substantial shift of support away from the more traditional core areas of AMO physics, such as atomic and molecular collision physics and spectroscopy. However, a large segment of this work is critical to many applications, such as plasma processing, lighting, gaseous electronics, and sensor development. This work is also critical to forefront astronomical research, especially as newer ground-based and space-based instruments are being developed with greater photon sensitivities and higher spectroscopic resolution (see Appendix D and Box D–1).
One of the great strengths of U.S. research is its diversity. Nowhere is this clearer than in AMO science, with its very wide intellectual horizon, its variety of funding sources, and its several modalities available for accomplishing the work.
This discussion of the research profile of AMO science is not complete without a comment about the essential role played by theory. In any discipline where the frontiers are traversed so rapidly, theoretical research is essential—not only to understand what has been observed but also to predict what might be seen next and thereby guide future work. This is especially true in AMO science, where researchers are developing and pursuing dramatic new areas such as ultra-high-field physics, the physics of “sparse” condensed matter systems, the study of the fundamentals of quantum mechanics, and the frontiers of quantum information.
The committee therefore notes with concern that support for AMO theory at NSF has not progressed over the last decade, even while support for experiment has been relatively strong. The size of a single-investigator grant in theory at NSF is far below that at the other agencies (see the following section, Table 8–2, and
TABLE 8–2 Demographics, Success Rates, Turnover, Average Grant Sizes, FY2005
|
|
AFOSR |
ARO |
ONR |
DOE |
NASAa |
NISTc |
NSF |
|
Awardsb |
~24 |
~20 |
~30 |
~55 |
~45 |
~5 |
~135 |
|
Seniord |
~30 |
~40 |
~30 |
~83 |
~45 |
~160 |
~145 |
|
Postdoc |
~30 |
~30 |
NA |
~50 |
NA |
~20 |
~50 |
|
Ph.D. |
~6 |
~10 |
NA |
~30 |
NA |
~5 |
~40 |
|
Graduate students |
~30 |
~50 |
NA |
~100 |
NA |
~30 |
~200 |
|
Undergraduate students |
NA |
NA |
NA |
NA |
NA |
~20 |
~115 |
|
Women (%)e |
~10 |
~10 |
NA |
NA |
NA |
~16 |
~10 |
|
Minorities (%)e |
~7 |
<5 |
NA |
NA |
NA |
<5 |
~2 |
|
Average grant size (thousand $) |
|
|
|
|
|
|
|
|
Experimental |
~125 |
~140 |
~150 |
~137 |
~150 |
~100f |
~135 |
|
Theory |
~80 |
~80 |
~125 |
~104 |
NA |
~100f |
~60 |
|
Success rate (%)g |
~30 |
~40 |
~40 |
~34 |
~35 |
N/A |
~43 |
|
Turnover (%)h |
~5 |
~15 |
~15 |
~10 |
NA |
N/A |
~7 |
|
NOTE: Personnel numbers include both experimental and theory. Owing to the high variability and interdisciplinarity of its programs from year to year, DARPA was not included in this table. aNASA data include the Laboratory Astrophysics and Planetary Sciences programs. bAwards from NIST are solicited by the agency. cNumber of grants in place. dNumber of senior investigators supported. ePercentages of the supported investigator pool represented by women or minorities. fFunding per scientist at NIST labs not including overhead, depreciation, and operating expenses. gPercentage of proposals funded out of those submitted; many ideas for proposals are “declined” before a submission. hThe rate at which new people enter the program. |
|||||||
Appendix B). This policy of low average grant size seems to be based not on any reasonable assessment of the needs of a single investigator conducting research in a university environment, but rather on the need to maintain a reasonable number of active theory investigators within an essentially fixed program budget. NSF also supports critically important work at the Institute for Theoretical Atomic, Molecular and Optical Physics (ITAMP), although this funding level has also not increased over the last decade. A limited amount of work in AMO theory is also carried out at the Kavli Institute for Theoretical Physics in Santa Barbara (which is partially supported by NSF) as a part of its workshop series. The committee believes that this pattern of funding erosion in theoretical AMO physics at NSF is not an effective way to realize the full contribution that theory could make to the compelling science opportunities detailed in this report. Theoretical work is also carried out within the DOE and NIST programs, and to a lesser extent in the DOD science agencies. In all these cases the support per investigator is much more robust.
Finally, the committee notes that there are many separate programs throughout the government for funding quantum computing research. Perhaps only 25–35 percent of that effort is in the AMO community, but given the size of the quantum computing funding, even that fraction is a significant amount. The key sponsors are ARO, AFOSR, DARPA, DTO, NSF, and NSA.
Information About Funding
Appendix B and Tables 8–1 and 8–2 contain data the committee received on agency budgets.14 As noted above, in contrast to the support for physical science in general, there was a significant increase in AMO support (about 26 percent in FY2005 dollars) over the last decade at DOE, NIST, and NSF, with much of the increases at these agencies going to the creation or expansion of activities at centers.
In contrast, a recent NRC report15 found that “in real terms the resources provided for Department of Defense basic research have declined substantially over the past decade.” This is particularly true for ONR, which had a strong tradition, until recently, of supporting some innovative and long-term AMO research. These so-called 6.1 funds in the DOD budget appear to require continuous justification to be included as a part of DOD agency missions, which have become increasingly
oriented to short- and medium-term goals. The resultant reductions in 6.1-supported research have had a substantial impact in the university community, which tends to focus on longer-term basic research.
It is contended by some that this problem arises not only from a direct reduction of available 6.1 funds, but also from a relabeling of previous 6.2 and 6.3 work into the 6.1 category. However, NRC’s FAMOS report found little evidence for this contention. On the other hand, Finding 9 of the report goes on to assert that “generated by important near-term Department of Defense needs and by limitations in available resources, there is significant pressure to focus DOD basic research more narrowly in support of more specific needs.” And this is taking place at a time when, according to Finding 14, “the breadth and depth of the sciences and technologies essential to the Department of Defense mission have greatly expanded over the past decade.” And finally, from Finding 8: “A recent trend in basic research emphasis within the Department of Defense has led to a reduced effort in unfettered exploration, which historically has been a critical enabler of the most important breakthroughs in military capabilities.” A compelling example of such a breakthrough in research on atomic clocks that was supported by ONR is described in Boxes 2–3 and 7–3 of this report. This situation has led to much increased proposal pressure at agencies that do support fundamental work. For example, AFOSR is now seeing more proposals from people who used to be funded by ONR and NASA.
With the possible exception of AFOSR, the DOD agency programs seem to vary considerably from year to year in terms of available funds. Owing also to the high degree of multidisciplinary work supported, it is difficult to estimate accurately the funding available each year to AMO science from the DOD agencies, especially at DARPA. From the data gathered for this study, an estimate is $45 million per year—but with a significant uncertainty on this number. About $30 million of this is from DARPA alone. However, the data supplied to us by the DOD agencies and by NASA were mostly anecdotal. Year-by-year funding trends were not made available to us.
It is a testament to the vitality of the field that all of the federal agencies report that the number of very high quality proposals is much larger than the available funds can support. And based on funding requests by grantees currently under review, most of the agencies report that grant sizes in experimental AMO physics could usefully be about 30–50 percent higher—though it is certainly true that grant sizes for the same level of effort will vary depending on the institution, its location, salaries, indirect cost rates, and so on. But in cases where budgets have remained flat, there have been serious losses in the purchasing power of AMO scientists due to regular CPI inflation and the instrumentation capability inflation mentioned above. Maintaining flat levels of effort means that young people are not coming
into the field at a higher rate. More than that, the incremental investment that these additional funds represent would ensure that the government’s start-up investment yields as high a scientific return as possible.
AMO scientists often receive support from multiple sources simultaneously, including support from their home institution. The committee did not attempt to quantify the degree to which this occurs, or what it may mean in terms of total support, on average, for an AMO scientist. Nor were data gathered on possible funding from the private sector. However, it is widely recognized that funding for basic research at most of the country’s leading private industrial research laboratories has all but vanished. Today there is significant interest in the industrial sector in laser physics across an enormous range of activity, but this interest is focused almost entirely on commercial R&D development and hardly at all on fundamental physics. A possible exception is in quantum information science and quantum computing, where companies like IBM and Microsoft have very active research programs in laser physics, condensed matter physics, and other areas germane to those topics.
Information About People
Appendix E contains data the committee received on the makeup of the AMO community of scientists and students. Generally speaking, the number of people supported in the field has not increased dramatically over the last decade, although requests for support have increased. As a measure of this, the committee notes that the membership of the Division of Atomic, Molecular and Optical Physics (DAMOP) of the American Physical Society (APS) has remained relatively constant for more than a decade at ~2,550, not changing from year to year by more than about 5 percent. AMO physicists account for about 6 percent of the total APS membership, and DAMOP is its third largest division. The APS also has a Division of Laser Science, which comprises about 1,350 members, though its membership overlaps very significantly with DAMOP’s, at least in optical science. Another measure of the strength of AMO science and technology is the membership of the Optical Society of America, which today is about 14,000, the large majority of whom represent the engineering community and find their employment in government or private industry.
The excitement of the field and the superb training that it affords have attracted excellent people to it. Of the DAMOP membership, about 700 are students. The number of foreign graduate students, postdocs, and senior investigators remains high. Although physics departments are now reporting increased numbers of Americans majoring in physics, the committee could not determine whether or not this trend extends to AMO science.
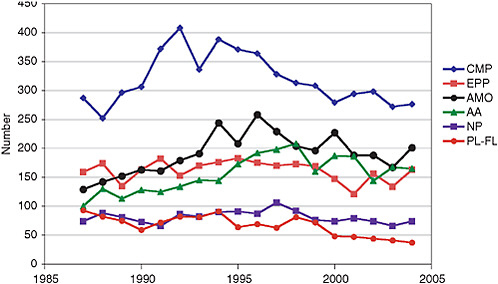
FIGURE 8–3 Total numbers of students of all nationalities receiving U.S. Ph.D.s in the prominent areas of physics, as a function of year. CMP, condensed matter physics; EPP, elementary particle physics; AMO, atomic, molecular, and optical; AA, astronomy and astrophysics; NP, nuclear physics; PL-FL, plasma and fluid dynamics. Total Ph.D.s/year in physics ranged from lows of about 1,240 in 1987 and 2003 to a high of 1,692 in 1994. SOURCE: Data from American Institute of Physics, Statistical Research Center, and the National Science Foundation.
Graduate students and postdocs in AMO science appear to respond very positively to the fact that, for the most part, experiments are still small enough that projects can be conducted by individuals or small groups. Students are therefore able to manage their entire projects nearly on their own, experiencing in full the diversity of the effort—an extremely valuable and highly sought-after training experience.
American Institute of Physics/NSF data (see Figure 8–3) indicate that over the last decade the United States produced about 1,200 Ph.D.s in physics and astronomy each year, of whom about 200 were in AMO science. This number is exceeded only by the condensed matter physics community. Per dollar spent, the AMO community is clearly quite productive in terms of training its next generation.
Information About New Modalities
Appendix F contains information from the agencies about new modalities for doing research. Like other very active areas of science, AMO has evolved substantially over the years in terms of ways the science is carried out. For example,
there has been a steady move toward the creation of center activities, supplanting somewhat the traditional emphasis within AMO science on the single-investigator mode of research. The center approach is chosen sometimes so as to assemble in one place a critical mass of research activity capable of generating new ideas in a given area and capitalizing on them more quickly. At times, the nucleation occurs at a new facility such as the Linac Coherent Light Source (LCLS) at Stanford. Finally, the increasing interdisciplinarity of AMO science produces a natural tendency toward collaborative activity at centers where scientists with the requisite expertise can gather and cooperate. This latter point has been explicitly recognized by the DOD agencies that created the Multidisciplinary University Research Initiative program. These awards, which last up to 5 years and give up to $1 million per year, have allowed the agencies to pursue their research objectives very successfully (see Appendix F for more details).
With the creation of its Center for Ultracold Atoms and its Frontiers of Optical Coherent and Ultrafast Science (FOCUS) center, NSF has chosen two very exciting areas of AMO science for robust support. FOCUS builds on the earlier establishment, and evolution, of the Center for Ultrafast Optics, an NSF Science and Technology Center. ITAMP has most of the attributes of a center (visitor’s programs, workshops, and a postdoc program) but is not currently funded at the level of the Physics Frontiers Centers program.
Perhaps the most dramatic example of excellent scientific productivity coming out of the “centers” concept is JILA at Boulder, Colorado. Jointly supported by NIST and NSF, JILA has been the undeniable world leader in many areas of quantum optics for over a decade. Its work garnered multiple Nobel prizes in that time. Indeed, all of the AMO work that NIST supports is done within the “centers” concept—at JILA, at the Time and Frequency Laboratory in Boulder, and in Gaithersburg, Maryland.
Almost half (47 percent) of DOE’s Basic Energy Sciences (BES) AMO portfolio of research is carried out at centers. Four of the five centers are at national laboratories and one is at Kansas State University. Two centers were new in 2005: the Photon Ultrafast Laser Science and Engineering center is colocated at SLAC with the LCLS and is funded by the Materials Science Program in BES; and the Berkeley Ultrafast Center is located at Lawrence Berkeley National Laboratory.
As described in Appendix F, there is a growing number of large-scale facilities available in this country for research in AMO science (and many smaller ones as well). These include several synchrotron light sources operated by DOE/BES—the Advanced Photon Source at Argonne, the Advanced Light Source at Berkeley, the National Synchrotron Light Source at Brookhaven, and the Stanford Synchrotron Radiation Laboratory—as well as several others at universities. In general, AMO physics accounts for a relatively small fraction of the research portfolios at these
facilities. At new facilities, the emphasis is on fourth-generation light sources, by which is meant the development of x-ray free-electron lasers—in particular, the LCLS at SLAG. There are also three very-high-intensity laser systems (OMEGA at Rochester and JANUSP and the National Ignition Facility, both at Livermore). By creating these new research modalities, the federal science agencies have realized a dramatically positive payoff. It is an approach that has also been adopted by the rest of the world.
Foreign Competition
As is already clear from the preceding facilities discussion and as is amplified in Appendix C, the United States is facing intense competition from abroad in AMO science and areas related to it. The same is true for areas relating AMO science and technology to national security. As this worldwide interest attests, there is every indication that AMO science will be an essential frontier of science for years to come. In the words of John Marburger, President Bush’s science advisor, “It is not a question of responding to a threat, it is a question of maintaining leadership” in a science of great importance to U.S. scientific, commercial, health, and strategic interests.
The activities going on in AMO science in the rest of the world are as creative, diverse, and robust as the U.S. effort. While it is certainly true that no single country can yet match the overall U.S. program, the sum of what is going on in Europe certainly does. The European Union’s support for research on a continental scale, combined with the national efforts of its member states, means that Europe is wellpositioned to compete in research efforts of all kinds. Countries like Germany, with a population of 82 million, and Austria, 8 million, have made investments in AMO science that in some cases well surpass U.S. investments even at our most effective and well-funded laboratories (see Box 8–1). The United Kingdom and France, with populations of 60 million each, are not far behind.
One way to measure emerging trends in international competition in research is to look at how the number of scientific publications from other countries has grown over the past two decades. Figure 8–4 shows some publication data from two of the world’s premier physics journals, The Physical Review and Physical Review Letters. The relative position of the United States has steadily slipped: In 1990, U.S. scientists accounted for half the submissions, but by 2004 they accounted for only 25 percent of the total. The same trend is visible in AMO science by itself.
Finally, the committee notes the existence in Europe and Asia of research facilities that either do not exist in the United States (such as heavy-ion storage rings) or that are essentially the equal of U.S. facilities (such as the synchrotron light sources, laser facilities, and free-electron lasers). In terms of strategic resources, Europe’s
|
BOX 8–1 AMO Science in Austria and Germany In 2003, the Austrian Academy of Sciences founded the Institute for Quantum Optics and Quantum Information. This institute, located in state-of-the art facilities in Innsbruck and Vienna, is composed of four research groups in experimental and theoretical AMO physics. Following the model of the Max-Planck Institutes in Germany, and in particular the Max-Planck Institute for Quantum Optics in Garching (an equally outstanding institute), the institute’s goal is to secure a leading role for Austrian science in the fields of quantum optics and quantum information. As a result of this conscious prioritizing and concentrated investment, it has succeeded in doing so. |
proposed global positioning satellite system, Galileo, and Russia’s existing one, GLONASS, are fully competitive with the U.S. Global Positioning System.
Logistical Issues in the United States
In the aftermath of the 9/11 terrorist attacks, policies across a very broad spectrum were put in place to close existing security holes and to anticipate new ones. Some of these policies, if implemented as originally envisioned, would have had a significant dampening impact on the traditional ways that scientific research has been carried out in the United States and in a larger sense may have worked against U.S. interests. Measures that impede critical research areas can inadvertently diminish national security.
The United States must move decisively to improve significantly the numbers of American-born students who choose science or engineering as a career. This is especially true in the physical sciences, where at present almost half of all Ph.D.s granted in this country are awarded to foreign-born students (Figure 8–2). Yet it is also clear that this situation cannot be changed overnight—it will take many years. While that effort is under way, the country must continue to allow, even encourage, foreign-born students to train here and stay here. U.S. visa policy must be consistent with this goal—a point made forcefully by many U.S. business, academic, and political leaders. At this writing it appears that the government appreciates the need for a careful implementation of visa policy for students, long-term visitors, and permanent residents engaged in U.S. scientific endeavors.
The U.S. scientific community must be fully informed about scientific developments in the rest of the world and must stay fully engaged in international research. Not doing so would have profound ramifications for commerce, health, and defense. To maintain these contacts, foreign visitors must be encouraged to come
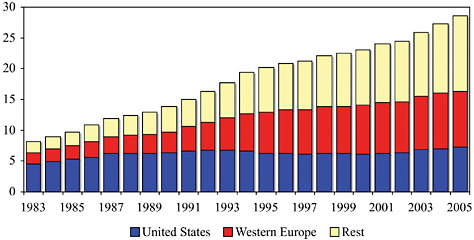
FIGURE 8–4 Number of submissions per year to the world’s leading physics journals, The Physical Review and Physical Review Letters. The U.S. submission rate has remained basically constant since 1987, while the rates for Europe and the Far East have grown rapidly. This trend holds true across all of the subfields of physics, including AMO science. SOURCE: American Physical Society, Publications Office.
to the U.S. to collaborate, attend meetings and conferences, and study. Similarly, U.S. scientists must be able to travel freely abroad for the same purposes. Legitimate security concerns about foreign nationals must not be permitted to weaken the nation’s broader, longer-term security goals, which require that we maintain the health and leadership of the U.S. scientific enterprise through international contact.
Another area of great concern to the academic and business community is the so-called “deemed export” restriction.16 As originally envisioned, this set of rules would have sharply curtailed the ability of foreign students and visitors—that is, nonpermanent residents—to function naturally and effectively in an R&D or educational environment. Given the size of the foreign component of the U.S. research community, these rules as originally stated would have had very serious negative consequences. The committee welcomes the recent and careful consideration by the federal government of how the relevant law can be implemented while mitigating the negative impacts on R&D.
|
16 |
See <http://www.bis.doc.gov/DeemedExports/DeemedExportsFAQs.htmMl> for relevant definitions. |
PROGRAM CONCLUSIONS ON SUPPORT FOR AMO SCIENCE
The committee draws 10 conclusions based on its analysis:
-
Given the budget and programmatic constraints, the federal agencies questioned in this study have generally managed the research profile of their programs well in response to the opportunities in AMO science. In doing so, the agencies have developed a combination of modalities (large groups; centers and facilities; and expanded single-investigator programs). Much of the funding increase that has taken place at DOE, NIST, and NSF has been to benefit activities at research centers. The overall balance of the modalities for support of the field has led to outstanding scientific payoffs.
-
The breadth of AMO science and of the agencies that support it is very important to future progress in the field and has been a key factor in its success so far.
-
Since all of the agencies report that they receive many more proposals of excellent quality than they are able to fund, it is clear that AMO science remains rich with promise for outstanding future progress. AMO science will continue to make exceptional advances in science and in technology for many years to come.
-
In view of its tremendous importance to the national well-being broadly defined—that is, to our nation’s economic strength, health care, defense, education, and domestic security—an enhanced investment program in research and education in physical science is critical, and such a program will improve the country’s ability to capture the benefits of AMO science.
-
Historically, support for basic research has been a vital component of the nation’s defense strategy, making the recent decline in funding for basic research at the defense-related agencies particularly troubling.
-
The extremely rapid increase in technical capabilities and the associated increase in the cost of scientific instrumentation have led to very significant added pressures (over and above the usual CPI inflationary pressures) on research group budgets. In addition, not only has the cost of instrumentation increased, but also the complexity and challenge of the science make investigation much more expensive. This “science inflator” effect means that while it is now possible to imagine research that was unimaginable in the past, finding the resources to pursue that research is becoming increasingly difficult.
-
In any scientific field where progress is extremely rapid, it is important
-
not to lose sight of the essential role played by theoretical research. Programs at the federal agencies that support AMO theory have been and remain of critical importance. NSF plays a critical and leading role in this area, but its support of AMO theoretical physics is insufficient.
-
AMO science is an enabling component of astrophysics and plasma physics but is not adequately supported by the funding agencies charged with responsibility for those areas.
-
The number of American students choosing physical science as a career is dangerously low. Without remediation, this problem is likely to create an unacceptable “expertise gap” between the United States and other countries.
-
Scientists and students in the United States benefit greatly from close contact with the scientists and students of other nations. Vital interactions include the training of foreign graduate students, international collaborations, exchange visits, and meetings and conferences. These interactions promote excellent science, improve international understanding, and support the economic, educational, and national security needs of the United States.


