
4
Coal
INTRODUCTION
Coal is the nation’s (and the world’s) most abundant fossil fuel. Domestic recoverable reserves amount to 6000 quadrillion Btu (quads), which is part of a total domestic resource of about 80,000 quads and a world resource crudely estimated at about 300,000 quads. Of this huge supply, we currently consume about 14 quads each year, or less than 0.3 percent of domestic recoverable coal reserves. In contrast, as noted in chapter 3, the nation extracts each year almost 10 percent of its 420-quad recoverable reserves of oil and natural gas.
The substitution of coal for natural gas and oil on a large scale, either directly or through synthetic coal-derived substitutes, would on these grounds seem a ready-made solution to the nation’s energy problems. The simple arithmetic of availability, however, does not tell the whole story. Doubling or tripling the use of coal will take time, investments amounting over the years to hundreds of billions of dollars, and determined efforts to solve an array of industrial, economic, and environmental problems.
Unlike oil and gas consumption, coal use is limited not by reserves or production capacity generally, but rather by the extraordinary industrial and regulatory difficulties of burning it in an environmentally acceptable and, at the same time, economically competitive manner. Coal is chemically and physically extremely variable, and it is relatively difficult to handle and transport. Its use produces heavy burdens of waste matter and pollutants. Even at its substantial price advantage, Btu for Btu, it cannot compete with oil and natural gas in many applications because of the
expense of handling and storing it, disposing of ash and other solid wastes, and controlling emissions to the air. Only in very large installations, such as utility power plants and large industrial boilers, is coal today generally economic and environmentally suitable to burn. Domestic coal production capacity today exceeds economic demand, and this may well remain true until the end of the century.1
The health problems associated with coal affect both its production and its use. The health of underground miners presents complex and costly problems, for example, and is in need of better management; black lung is the notable instance. At the other end of the fuel cycle, the evolving state of air pollution regulations to deal with the emissions of coal combustion complicates planning for increased demand, and thus in turn inhibits investment in mines, transportation facilities, and coal-fired utility and industrial boilers.
The future is obscured also by a number of more speculative, less easily surmountable problems, which may result in further regulatory restrictions on the use of coal. Chief among these is the risk that before the middle of the next century, emissions of carbon dioxide, an unavoidable (and essentially uncontrollable) product of fossil fuel combustion, may produce such concentrations in the atmosphere as to produce large and virtually irreversible alterations in the world’s climate. (See chapter 9.) Also worrisome is the water-supply situation, which could limit synthetic fuel production or electricity generation unless large-scale and possibly expensive steps are taken to minimize water consumption and manage water supplies. This is already a limiting factor in some western locations, but the eastern coal regions may be approaching trouble too.
Coal-fired power plants burned nearly 70 percent of U.S. coal production in 1977, producing more than 45 percent of the nation’s electricity. Most of this was in large, centralized facilities with generating capacities of 300 megawatts (electric) (MWe) or more, designed to produce base-load power. (Smaller, less efficient oil- and gas-fired units and small, older coal units serve intermediate and peak loads.) Industry used one fifth of national production, slightly more than half of that in coke plants and the rest to produce steam and dry process heat. Almost all the rest (about 8 percent) was exported, mainly to make coke. Imports were less than 1 percent of U.S. production.
In the future, the market for coal can be widened. Development of efficient, relatively clean coal power cycles for use in smaller electricity-generating units decentralized to serve local loads, for example, will be attractive to industry and to utilities with power plant siting problems. Coal use for industrial process heat and chemical feedstocks will be harder to stimulate, especially in smaller installations, because of the expense and difficulty of handling the coal and the various wastes and emissions from
its combustion. In small units, the capital and operating costs of dealing with this inconvenient fuel are proportionally larger than in larger ones. The domestic and foreign market for metallurgical coal (used in blast furnaces, smelters, and chemical plants) amounts to 15–20 percent of the nation’s coal production; it is tied primarily to the world steel industry and is not expected to grow rapidly in the near future.
Over the next 10–20 years some of the obstacles to increased demand will weaken as new technologies increase the efficiency and convenience of using coal, and as the prices of oil and gas rise while their reliability of supply declines. A number of the advanced electric power cycles for coal, now under development, would be suitable for smaller installations, and their relatively clean environmental characteristics would make it possible to locate them near users of their power. For smaller industrial users the fluidized-bed combustion and synthetic fuel processes now undergoing development would be especially valuable.
Department of Energy regulations under the Powerplant and Industrial Fuel Use Act of 1978 (Public Law 95–620) will, when implemented and enforced, further improve the outlook for coal by banning oil and gas as fuels in most new power plants and large industrial heating units.
This is not to imply that all the problems of coal use are solvable, or that coal can become the mainstay of the U.S. energy sector over the long term. Its environmental costs will remain high; mining and burning 2 or 3 times the present output of coal, even if it is done efficiently and with care, will be difficult (and increasingly expensive) if coal’s contributions to air and water pollution and land degradation are to be kept from increasing.
With the foregoing in mind, we see the following as the prime objectives of national coal policy in the coming decades.
-
Provide the private sector with strong investment incentives to establish a synthetic fuel industry in time to compensate as domestic and imported oil supplies begin to decline (probably some time near 1990).
-
Continue the broad research and development program in fossil fuel technology to widen the market for coal by increasing the efficiency and environmental cleanliness with which it can be used.
-
Improve health in the mines by strengthening industrial hygiene and by performing the necessary epidemiological research. The black lung problem especially should be clarified. (See chapter 9.)
-
Devote the necessary resources to supporting long-term epidemiological and laboratory studies of the public health consequences of coal-derived air pollutants to put air quality regulation on a firmer scientific basis that allows more confident and efficient setting of standards, on which industry can depend in its long-range planning. (See chapter 9.)
-
Develop a long-range plan, recognizing that coal presents some
-
serious environmental and occupational health and safety problems, and that it does not relieve the nation of its need to develop truly sustainable energy sources for the long term.
By 1985, given reasonably coherent policy and successful research and development, annual domestic demand for coal should approach 1 billion tons (about 20–25 quads). Commercial techniques for using coal will have changed little, but some synthetic fuel technologies will be on the verge of commercialization, and improved techniques for direct coal combustion will begin to enter the market. Knowledge of the environmental impacts of coal production and use (especially the public health consequences of coal-derived air pollutants) should be improved to the point that the current regulatory uncertainties can be reduced.
As the year 2010 is approached, coal use in the United States may reach 2 billion tons annually. By then, some of the clean, efficient techniques of coal use now being developed should attain full commercialization, and knowledge of the environmental and public health characteristics of coal may be sufficient for confident standard setting. At the same time, however, water supply will be increasingly critical, and the first signs of climatic effects from carbon dioxide emissions may be appearing. It is at about this time that truly sustainable energy sources must begin to become available, to provide new flexibility for energy policy and to relieve some of the pressure on coal.
For now, however, there is little room for maneuver. Coal must be used in increasing quantities, and mainly with the current technologies, until at least the turn of the century, regardless of what happens with respect to such alternatives as nuclear fission or solar energy. However, because of the variety of environmental and social problems it presents, it cannot indefinitely provide additions to energy supply. To keep these problems under control in the meantime, it would be wise to approach coal conservatively, with an eye especially to its environmental risks.
RESOURCES
RANK AND QUALITY
Coal is an extremely complex and variable material whose structure is inadequately understood despite centuries of use. The increased demand for coal is accelerating the effort to better understand its behavior and the nature of its effluents and by-products, under both direct use and conversion to synthetic fuels.
Coals are classified by rank according to the state of “coalification” they
have reached.2 The categories of rank, which roughly indicate the stage of coalification, are, from lowest quality to highest, lignite (two varieties), subbituminous (three varieties), bituminous (five varieties), and anthracite (three varieties). (See Figure 4–1 and Table 4–1.)
Low volatility and high carbon content together make anthracite the slowest and cleanest burning coal, qualities which made it the most desirable residential and commercial heating fuel before the advent of heating with oil and natural gas. However, for making coke the best coal is low-volatile bituminous. Per pound, the percentage of ash is lower and the Btu content is higher in low-volatile bituminous than in anthracite. The agglomerating or caking nature of bituminous coal, however, makes it ill suited for certain types of coal gasification processes, which become clogged by the fused carbon material. These processes require noncaking coal, which is usually subbituminous—a rank found almost exclusively in the West. Some gasification processes have been developed to use either type of coal.
The quality of coal is determined in general by two classes of material: (1) the organic remains of plants and (2) inorganic substances contributed by the plants, by water seepage, and by the surrounding geological matter, generally referred to as mineral matter. The organic portion of coal consists of carbon rings linked by chains that contain nitrogen, hydrogen, sulfur, and oxygen. Many products therefore arise when coal is heated. These products may be commercially useful, but may also be potentially hazardous; they include small amounts of carcinogens, mutagens, and respiratory irritants. The inorganic or mineral portion of coal usually constitutes from 9 percent to about 30 percent of the coal by weight. It includes up to half the sulfur and small, potentially toxic amounts of antimony, arsenic, beryllium, cadmium, mercury, lead, selenium, zinc, heavy radionuclides, and asbestos.3
Sulfur products are currently the most important of all pollutants released by coal combustion (chapter 9); their health effects are the most widely discussed, and they are by far the most costly to control. Sulfur in coal occurs mostly in a form that is either combined with the coal material (“organic”) or attached to, but physically distinct from, the coal (“inorganic” or “mineral”). (An additional small amount occurs as a sulfate, a product of weathering.) The distinction between organic and inorganic sulfur is important because inorganic sulfur can be removed in large part by washing prior to combustion; the organic form, under most washing processes in use today, cannot. In coals with very low total sulfur content by weight (less than 0.6 percent), most of the sulfur is organic; but when total sulfur makes up a greater percentage of the coal, the amount of inorganic sulfur is greater, commonly about 50 percent.
Emissions of sulfur dioxide (SO2) are measured in terms of pounds per
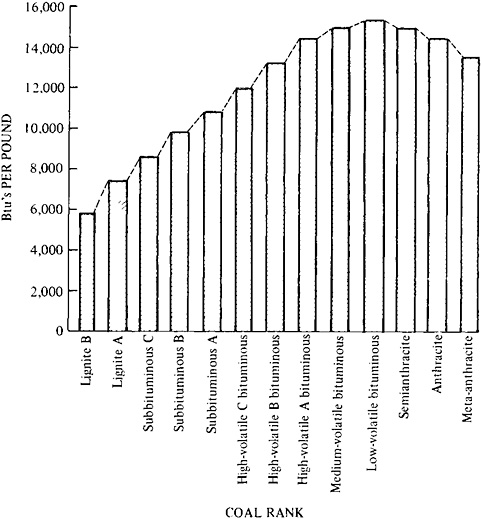
FIGURE 4–1 Comparison of heat values per pound (moist, mineral-matter-free basis) of coal of different ranks (Btu’s per pound). Source: Adapted from Paul Averitt, Coal Resources of the United States, January 1, 1974, U.S. Department of the Interior, Geological Survey Bulletin 1412 (Washington, D.C.: U.S. Government Printing Office (Stock No. 024–001–02703), 1975), p. 17.
million Btu of fuel burned. For enforcement purposes, the Environmental Protection Agency (EPA) assumes that all the sulfur in the coal is released as sulfur dioxide, the weight of which is twice that of sulfur. The ceiling on emissions is 1.2 lb of sulfur dioxide per million Btu, which under earlier EPA regulations could be met by burning coal with 0.6 lb or less of sulfur per million Btu.4 In May 1979, however, the EPA imposed additional control requirements on new plants (construction or alteration begun after
TABLE 4–1 Composition of Some American Coals
|
Typea |
Proximate Analysisb (percent) |
Elementary Analysisc (percent) |
Heating Valued (Btu per pound) |
|||||||
|
Moisture |
Volatile Matter |
Fixed Carbon |
Ash |
S |
C |
H2 |
O2 |
N2 |
||
|
Anthracite |
2.5 |
6.2 |
79.4 |
11.9 |
0.60 |
93.5 |
2.6 |
2.3 |
0.9 |
14,500 |
|
Bituminous |
|
|
|
|
|
|
|
|
|
|
|
Low volatile |
1.0 |
16.6 |
77.3 |
5.1 |
0.74 |
90.4 |
4.8 |
2.7 |
1.3 |
15,600 |
|
Medium volatile |
1.5 |
23.4 |
64.9 |
10.2 |
2.20 |
87.6 |
5.2 |
3.3 |
1.4 |
15,600 |
|
High volatile A |
2.5 |
36.7 |
57.5 |
3.3 |
0.70 |
85.5 |
5.5 |
6.7 |
1.6 |
15,000 |
|
High volatile C |
12.2 |
38.8 |
40.0 |
9.0 |
3.20 |
79.2 |
5.7 |
9.5 |
1.5 |
12.400 |
|
Subbituminous |
|
|||||||||
|
A |
14.1 |
32.2 |
46.7 |
7.0 |
0.43 |
80.9 |
5.1 |
12.2 |
1.3 |
12,100 |
|
C |
31.0 |
31.4 |
32.8 |
4.8 |
0.55 |
74.0 |
5.6 |
18.6 |
0.9 |
8,800 |
|
Lignite |
37.0 |
26.6 |
32.2 |
4.2 |
0.40 |
72.7 |
4.9 |
20.8 |
0.9 |
7,600 |
|
aThe analyses are meant to give an idea of the range of variation among coal types. There is considerable variation within each type, as well. bProximate analysis totals 100 percent by weight. cElementary analysis totals 100 percent by weight on a dry, ash-free basis. dHeating value is on a moist, mineral-matter-free basis. Source: Adapted from U.S. Environmental Protection Agency, Electric Utility Steam Generating Units: Background Information for Proposed Particulate Matter Emission Standards, Office of Air Quality Planning and Standards (Springfield, Va.: National Technical Information Service (PB-286–224), 1978), Table 3–6. |
||||||||||
September 18, 1978) that limit the possibility of using low-sulfur coal as the sole means of meeting the standard (The sulfur content of coals in the major U.S. producing areas ranges from 0.3 to 4.7 lb per million Btu.)5 The regulations and their impact are discussed in more detail in the section of this chapter entitled “Air Pollution Regulation and Control.”
DISTRIBUTION OF RESOURCES
While recoverable quantities of coal are found in at least 32 states (see Figure 4–2), 90 percent is found in only 10 states, distributed among four regions. These regions and states are the Appalachian basin (chiefly, in order of deposit tonnage, West Virginia, Pennsylvania, Ohio, and eastern Kentucky), the Illinois basin (also called the Eastern Interior region—Illinois, western Kentucky, and Indiana), and the Northern Great Plains and Rocky Mountain regions (Montana, Wyoming, Colorado, and North Dakota).
A broad distinction is drawn between types of U.S. coal based on whether they are located east of the Mississippi (Appalachian and Illinois basins) or west (the Western Interior, Northern Great Plains, Rocky Mountain, Gulf, and Pacific regions). There are major differences between eastern and western coals, based on their different conditions of formation. The major deposits east of the Mississippi are generally the oldest and deepest, and are therefore of highest rank. Most western coals were formed about 150 million years later than eastern coal, at shallower depths; their coalification is less advanced, and their energy and carbon content are therefore generally lower, than those of eastern coal. Created from different plants and under different geological conditions, western coal has a carbon structure and mineral content generally different from that of eastern coal; these characteristics must be allowed for and sometimes counteracted in designing boilers, controlling effluents, and choosing coal for coking or for conversion to synthetic fuels.6 (Boilers, for instance, suffer an efficiency loss when a nondesign coal type is substituted for the type originally intended.) Lastly, much eastern coal was formed under salt water, giving it a high sulfur content compared to most western coal, which formed under fresh water.
U.S. coal is generally in huge beds, ranging in thickness from a few inches to more than 100 ft, that extend with some interruptions for up to 30,000 mi2. The major Appalachian deposit is the Pittsburgh bed, which, because of size, the high heat value of the coal it contains, and its use in the creation of the Pennsylvania iron and steel industry, has been called the most important single mineral deposit in the United States. Fairly uniform and continuous over 6000 mi2 of western Pennsylvania, West Virginia, Ohio, and Kentucky, the Pittsburgh bed yielded through 1973 an
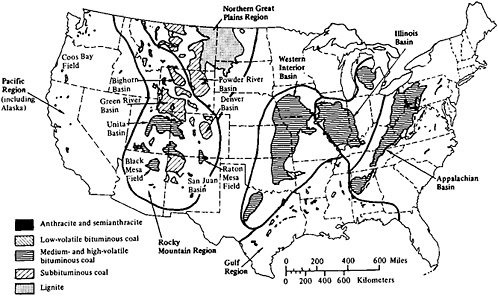
FIGURE 4–2 Coal fields of the coterminous United States. Source: Adapted from Paul Averitt Coal Resources of the United States, January 1, 1974, U.S. Department of the Interior, Geological Survey Bulletin 1412 (Washington, D.C.: U.S. Government Printing Office (Stock No. 024–001–02703), 1975), p. 5; and U.S. Department of Energy, Energy Information Administration, Coal Data (Washington, D.C.: U.S. Government Printing Office (DOE/EIA-0064), 1978), p. 1.
estimated 9 billion tons or about one fifth of total U.S. production to that date, with much still remaining.7
The largest unbroken concentration of coal in the United States is the remarkable Wyodak bed, centered in Cambell County, Wyoming. This bed penetrates the surface continuously along a line extending for 120 miles at thicknesses ranging from 25 ft to 150 ft. To a depth of 200 ft, it contains an estimated 15 billion tons of strip-minable coal (or about 20 times total U.S. output in 1976). To a depth of 2000 ft, it contains perhaps 100 billion tons of coal.8 (Given the low heating value of this coal and current prices, however, these deeper deposits are not now economically recoverable.)
Coal resources are generally reported in short tons. The latest U.S. Bureau of Mines estimate of the tonnage in U.S. coal beds that are legally and economically accessible (called the reserve base) is 438 billion tons, about 32 percent of it accessible by surface mining. The reserve base is part of a total U.S. coal resource estimated, much less reliably, at 4 trillion tons.
In terms of the reserve base, practically all anthracite is found in Pennsylvania underground-minable deposits; all but 16 percent of bituminous deposits are found east of the Mississippi; all subbituminous deposits are found in the West; all lignite is found in surface deposits, practically all of it in Montana, North Dakota, Texas, and Colorado. The distribution of the U.S. reserve base by coal rank, type of mining, and region is shown in Table 4–2.
The distribution of coal energy resources is also of interest. The Bureau of Mines reserve base tonnages were converted to recoverable reserves and to corresponding average energy content figures by the Congressional Office of Technology Assessment using a recovery factor of 57 percent in underground mines and 80 percent in surface mines.9 The resulting regional distribution of recoverable coal reserves by energy content and method of mining is summarized in Table 4–3.
Table 4–3 shows a distribution of recoverable reserve energy that is not far different from the distribution of reserve base tonnages. This is because, in comparison to the eastern coal, the lower energy of western coal is compensated for by its greater recoverability.10
DISTRIBUTION OF PRODUCTION
In 1976 (the most recent year of output unaffected by the 1977–1978 coal strike), surface mines yielded 57 percent of U.S. coal production tonnage. In that year, Appalachia supplied 60 percent of U.S. coal, with 45 percent of the region’s output produced by surface mines; the Interior supplied 24 percent, about two thirds of it surface mined; and the West supplied 16 percent, practically all of it surface mined.
The most important of the 26 producing states in 1976 were all east of
TABLE 4–2 Distribution of U.S. Coal Reserve-Basea Tonnage by Coal Rank and Type of Mining (percent)
|
Region |
Coal Rank |
Total Surface |
Total Deep |
Grand Totalb |
|||||||
|
Anthracite |
Bituminous |
Subbituminous |
Lignite |
||||||||
|
Surface |
Deep |
Surface |
Deep |
Surface |
Deep |
Surface |
Deep |
||||
|
Eastc |
<0.5 |
2 |
9 |
35 |
0 |
0 |
<0.5 |
0 |
9 |
37 |
46 |
|
Westd |
<0.5 |
<0.5 |
2 |
6 |
14 |
25 |
7 |
0 |
23 |
31 |
54 |
|
TOTALb |
<0.5 |
2 |
11 |
42 |
14 |
25 |
8 |
0 |
32 |
68 |
100 |
|
aLegally and economically accessible deposits reported by the U.S. Bureau of Mines as of January 1, 1976, to be 438.3 billion short tons. Figures shown here are independently rounded. bTotals may not add due to rounding. cAppalachian and Eastern Interior basins (see Figure 4–2). dWestern Interior, Gulf, Northern Great Plains, Rocky Mountain, and Pacific (including Alaska) coal regions (see Figure 4–2). Source: U.S. Department of Energy, Coal Data—A Reference, Office of Energy Data and Interpretation, Energy Information Administration (Washington, D.C.: Energy Information Administration Clearinghouse (DOE/EIA-0064, Order no. 704), 1978), p. 2. |
|||||||||||
TABLE 4–3 Distribution of U.S. Recoverable Reserve Coal Energya by Method of Mining (percent)
|
Region |
Surface |
Deep |
Total |
|
Eastb |
11 |
36 |
47 |
|
Westc |
25 |
28 |
53 |
|
TOTAL |
36 |
64 |
100 |
|
aReserve base is made up of economically and legally accessible deposits. Recoverable reserves calculated at 80 percent of surface, and 57 percent of deep, reserve base, Recoverable reserve coal energy is an estimated 6334 quads. bAppalachian and Eastern Interior basins (see Figure 4–2). cWestern Interior, Gulf, Northern Great Plains, Rocky Mountain, and Pacific (including Alaska) coal regions (see Figure 4–2). Sources: Calculated from Office of Technology Assessment, The Direct Use of Coal: Prospects and Problems of Production and Combustion (Washington, D.C.: U.S. Government Printing Office (052–003–00664–2), 1979), p. 63. For the combined deep and surface reserve base energy in Alaska and Washington, multiplied by 60 percent for an estimate of total recoverable reserve energy in those states, Francis X.Murray, ed., Where We Agree: Report of the National Coal Policy Project, 2 vols., sponsored by the Center for Strategic and International Studies, Georgetown University (Boulder, Colo.: Westview Press, 1978), vol. 2, p. 395. |
|||
the Mississippi: Kentucky (21 percent of the U.S. total), West Virginia (16 percent), Pennsylvania (13 percent), Illinois (8 percent), and Ohio (7 percent), all of which are states with large reserves. Two states with small reserves but fairly large outputs were Virginia (6 percent of the 1976 output) and Alabama (3 percent). Two states with very large reserves but comparatively small outputs were Montana and Wyoming (each with about 4 percent of the U.S. total). Montana and Wyoming were the largest western producers and have the fastest growing productions in the nation. On a Btu basis, the East’s share of total output would be larger, and the West’s smaller, than the tonnage shares shown here.11 Table 4–4 shows the share of recoverable reserves, production, and consumption for 1976, by census region.
The extent to which U.S. coal production will shift to the West’s easily mined, surface, low-sulfur deposits depends on the willingness of the federal government, which owns perhaps 55–60 percent of western deposits, to lease new, large tracts of land assembled into “logical mining units.”12 It will also depend on water-use policy in the West, on transportation rates, and in the longer run, on the progress of coal liquefaction and gasification technology. The mining industry estimates
that the current short-term U.S. coal production capacity is roughly 15–20 percent greater than output, which reflects the fact that the most critical short-term constraints on increased coal use are in the demand sector.13
In 1977, coal provided about 14 quads (or 18.4 percent) of the 76.6 quads of energy consumed in the United States. Electric utility boilers consumed 10.7 quads, or about 77 percent of total coal consumption; about 13 percent, or 1.7 quads, was consumed in the manufacture of coke for steel; and other industries consumed 1.4 quads, or 10 percent, primarily as boiler fuel. Less than one fifth of a quad was distributed at retail, primarily as a commercial and residential fuel.14 In the utility market, coal competes with oil, natural gas, and nuclear power; in the industrial boiler market, it competes with oil and natural gas.
CONSUMPTION
INTRODUCTION
The expansion of coal consumption is and will continue to be limited by constraints on demand. Under the National Energy Plan (NEP) of 1977, which called for a near doubling of coal use by 1985, industrial coal consumption was projected to increase at nearly 12 percent annually, and electric utility coal consumption at about 6 percent.15 The nation’s utilities may be able to meet the forecast rate of increase, because under the Powerplant and Industrial Fuel Use Act of 1978 (Public Law 95–620) they are limited almost entirely to coal and nuclear power for new base-load generating capacity. The industrial projections of the NEP appear optimistic, however, given the small scale of many industrial installations now using oil and gas, and the consequently large investments required in new coal-handling facilities, expensive exhaust-gas scrubbers, and the like, (It should be noted that Congress failed to enact some of the plan’s key coal-use incentives.)
In addition, rapid changes in the regulation of coal mining and combustion render the future economics of coal use rather uncertain. New surface-mining legislation, for example, will no doubt decrease somewhat the current cost advantage enjoyed by surface-mined coal over deep-mined coal. Newly proposed air pollution regulations, which would require all new large coal-fired units to install desulfurization equipment, will raise the cost of burning coal and reduce the economic advantage of low-sulfur western coal as a means of meeting air quality requirements. Until the economic implications of these and other regulatory actions are fully understood, coal will not find ready acceptance in many applications, especially in smaller industrial applications, where the costs per unit of heat tend to be greater than in larger operations such as utilities and large industrial establishments.
TABLE 4–4 1976 Recoverable Reserves, Production, and Consumption of U.S. Coal, by Census Region (percent of total tons)a
|
Census Regionb |
Recoverable Reservesc |
Annual Productiond |
Annual Consumptione |
|
New England |
0 |
0 |
0.1 |
|
Middle Atlantic |
6.3 |
13.4 |
12.8 |
|
East North Central |
21.9 |
19.0 |
30.4 |
|
West North Central |
5.1 |
2.6 |
8.9 |
|
South Atlantic |
9.4 |
22.1 |
15.5 |
|
East South Central |
6.9 |
25.5 |
11.8 |
|
West South Central |
1.3 |
2.7 |
2.6 |
|
Mountain |
47.5 |
13.8 |
7.1 |
|
Pacific |
1.7 |
0.7 |
1.2 |
|
aColumns may not add due to rounding. bCensus regions divide the states as follows: New England includes Maine, Massachusetts, Rhode Island, New Hampshire, Vermont, and Connecticut; Middle Atlantic includes New York, New Jersey, and Pennsylvania; East North Central includes Ohio, Indiana, Illinois, Michigan, and Wisconsin; West North Central includes Minnesota, Iowa, Missouri, North Dakota, South Dakota, Nebraska, and Kansas; South Atlantic includes Delaware, Maryland, Virginia, West Virginia, North Carolina, South Carolina, Georgia, and Florida; East South Central mcludes Kentucky, Tennessee, Alabama, and Mississippi; West South Central includes Arkansas, Louisiana, Oklahoma, and Texas; Mountain includes Montana, Idaho, Wyoming, Colorado, New Mexico, Arizona, Utah, and Nevada; and Pacific includes Washington, Oregon, California, and Alaska. cSource: Calculated from Office of Technology Assessment, The Direct Use of Coal: Prospects and Problems of Production and Combustion, (Washington, D.C.: U.S. Government Printing Office (052–003–00664–2), 1979), p. 63. dSources: Calculated from U.S. Department of Energy, Coal—Bituminous and Lignite in 1976, Office of Energy Data and Interpretation, Energy Information Administration (Washington, D.C.: Energy Information Administration Clearinghouse (DOE/EIA-0118/1 [76], Order no. 703), 1978), p. 11; and U.S. Department of Energy, Coal—Pennsylvania Anthracite in 1976, Office of Energy Data and Interpretation, Energy Information Administration (Washington, D.C.: Energy Information Administration Clearinghouse (DOE/EIA-0119, Order no. 705), 1978), p. 3. eSources: Coal—Bituminous and Lignite in 1976 (see footnote d), p. 58; and Coal—Pennsylvania Anthracite in 1976 (see footnote d), p. 25. Calculated as percentage of total shipments by region of destination. Remainder of total shipments, 9.6 percent, allocated to export, dock storage, and rail and lake vessel fuel. |
|||
It seems almost certain that the 1985 target of the 1977 National Energy Plan—1.2 billion tons of coal per year—will not be met. Electric utilities will probably continue to be the major consumers, with industrial consumption of secondary importance as a source of demand. How much the demand for input energy in these two sectors will grow depends generally on the level of economic growth, the impact of conservation efforts, the pace of substitution of electricity for other forms of energy, and the amount of nuclear generating capacity that is installed.
Given recent trends, a plausible assumption about electricity production is that it will grow from 2.2 trillion kilowatt-hours (kWh) in 1978 at a modest 4 percent annually to 2.9 trillion kWh in 1985. If recent utility plans for a roughly 50–50 split in the distribution of new capacity between coal-fired and nuclear units holds true, the additional 170 million tons of demand for utility coal in 1985 will be about 35 percent higher than the 1978 level, requiring a 25 percent boost in total output. Few power plants now burning oil or gas will convert to coal, except for some that were originally designed to burn coal.
Large increases in industrial coal demand for steam and process heat are not likely through 1985. The coal demand of this sector has shrunk more than 10 percent since 1972, and most existing plants face many difficulties in attempting to convert to coal and in burning it.
Beyond 1985, the possibilities of course become more varied. To begin to grasp their range, we will again assume that through 1985 electricity output rises at a 4 percent annual rate, with the total increase shared equally by coal and nuclear fission. Thereafter, we assume a 3 percent annual growth rate for electricity output. If we assume that 1 trillion kWh will be supplied by oil, gas, hydroelectric, wind, solar, geothermal, and tidal generating plants by 2010, then 5 trillion of the 6 trillion kWh being generated in that year will come from nuclear and coal-fired plants (with the distribution of new capacity again split equally between the two plant types).
Nuclear capacity contributed 0.275 trillion kWh in 1978, which would rise to about 0.6 trillion kWh for 1985, and 1.7 in 2010, and require that 3.3 trillion kWh be produced by coal in 2010. Based on utility coal conversion efficiency measured in 1978, this would require 1640 million tons of coal, 3.4 times as much as utilities consumed in 1978 and 2.5 times total 1978 domestic coal production. Any shortfall in nuclear capacity would of course increase this demand.
By 2010, however, utilities will not be the only significant source of demand for coal. Advanced coal-based generation technologies are now undergoing development. Atmospheric fluidized-bed combustion may make coal use more economic for industry, and fuel cells using gas from coal may be economic in decentralized load-following applications. The
successful development of technologies to extract gases and liquids from coal could prove to be the biggest source of demand for coal as an indirect industrial substitute for oil and natural gas. It would also yield fuels attractive to utilities as alternatives to the direct use of coal.
ELECTRICITY GENERATION FROM COAL
The following discussion uses utility generating stations as a model for large-scale coal combustion in general. Utility boilers fired by coal are quite similar to industrial ones, though generally larger. Air quality regulations apply in essentially the same ways to both. The Powerplant and Industrial Fuel Use Act of 1978, when its regulatory provisions are formalized, will impose similar, though probably somewhat less restrictive, constraints on industrial oil and gas burning as on consumption of these fuels by electric utilities. The industrial nonenergy uses of coal—as a chemical feedstock and in metallurgy—will be discussed later.
Most large utility power plants use pulverized coal, burned in a suspension of fine particles to generate steam to drive the electric generator’s turbine. A 1000-MWe coal-fired powor plant consumes about 2.5 million tons of coal each year and produces approximately 6.5 billion kWh of electricity. With flue gas desulfurization equipment it occupies an area of about 600–700 acres, which houses the plant and allows for disposal of the various solid wastes produced in the course of 35–40 years of useful life. From site selection to power production, it takes about 7–8 years to obtain regulatory clearances, build the plant, and make final operating adjustments.
Before the advent of sulfur dioxide controls, coal-fired base-load power plants could convert about 40 percent of the coal’s chemical energy to electricity; the rest was rejected to the environment as heat. The power demands of sulfur dioxide scrubbers and other control equipment that will be required on new plants will reduce coal-to-electricity efficiencies to about 38 percent. In addition, the EPA-proposed increases in regulatory requirements for emission control and waste disposal are estimated to add over $150 per kilowatt (electric) (kWe) of generating capacity to the capital costs of large plants, which without such measures would cost $550/kWe (1976 dollars). The pollution control costs are dominated by the costs of sulfur dioxide scrubbers and waste disposal; a great deal of development work, with the aim of increasing efficiencies and decreasing costs of power plants that are acceptably clean and efficient, is being carried on. Advanced methods of coal combustion will be discussed later.
Air Pollution Regulation and Control
The policy problem of greatest significance to the near future of coal consumption is undoubtedly the question of air pollution and its control. Under the authority of the Clean Air Act of 1970 and its 1977 amendments, the federal government directly and indirectly regulates the siting of fossil-fueled utility and industrial boilers, as well as their permissible emissions of particulates, sulfur oxides, and nitrogen oxides. Other considerations may arise under the Clean Water Act, the National Environmental Policy Act, the National Historic Preservation Act, the Endangered Species Act, and other regulations, but it is the provisions of the Clean Air Act that apply most consistently and with most force.
The Clean Air Act sets national ambient air quality standards (NAAQS) for atmospheric concentrations of sulfur dioxide, nitrogen dioxide, and particulate matter. These are enforced in a variety of ways to control emissions from different stationary and mobile pollution sources. The requirements are different not only for different types of sources, but also for different regions. The act divides the nation into 247 air quality control regions, and charges the states with developing strategies for meeting the applicable ambient pollutant standards. In regions that are already in violation of the ambient standards, any new pollution source must meet the lowest attainable emission rate and at the same time secure from other sources in the region reductions in emissions that more than offset its own. In areas where the air is cleaner than required by the NAAQS (so-called “prevention of significant deterioration” areas), emissions are regulated to prevent significant increases in ambient concentrations of particulate matter and sulfur dioxide. Regulations covering certain other pollutants (including nitrogen dioxide and hydrocarbons) will be promulgated in late 1979.
In addition to the standards regulating ambient air quality, and thus the siting of plants, the Environmental Protection Agency promulgates and enforces regulations limiting the emissions of individual plants. Under the authority of the 1977 amendments to the Clean Air Act, EPA proposed new, tighter standards governing the sulfur dioxide, nitrogen dioxide, and particulate emissions of all new or substantially modified fossil-fueled steam power generating units that consume more than 250 million Btu of fuel energy per hour.16 This is equivalent to about 10 tons of coal per hour—enough to fuel a 10-MWe unit. The standards apply, regardless of the ambient air quality, to plants whose construction or alteration begins after September 18, 1978.
The standards, made final in May 1979, set ceilings on the emissions of the three above-mentioned pollutants, and in the case of sulfur dioxide impose the further requirement that “potential” emissions (those that
would prevail if completely uncontrolled) be reduced by certain percentages, depending on the sulfur content of the coal. The percentage reduction requirement in effect means that all regulated coal-fired power plants must install flue-gas scrubbers to remove sulfur. The use of low-sulfur coal thus is no longer acceptable as the sole means of reducing sulfur emissions at a power plant; this is expected to reduce the market for low-sulfur western coal in the Midwest and East, but the magnitude of the reduction and its precise effect on western coal production are very uncertain.
The new standards, and for comparison the previous ones, are briefly as follows.
-
For sulfur dioxide, the previous standard simply limited emissions to 1.2 lb per million Btu of fuel consumed. The new standard retains this upper limit, but imposes a percentage reduction requirement of 70–90 percent, depending on the sulfur content of the coal.
-
For particulates, the old emission limit was 0.1 lb per million Btu. The new standard limits particulate emissions to 0.03 lb per million Btu, and in addition limits the opacity of exiting flue gas.
-
For nitrogen dioxide, the previous standard limited emissions to 0.7 lb per million Btu. The new standard allows emissions of between 0.5 and 0.8 lb per million Btu, depending on the type of coal burned.
Discussions to follow describe these standards and their implications in more detail.
A recent econometric study17 suggests that, while the tightened emission standards will raise the cost of coal-generated electricity by about 15–20 percent at power plants that install sulfur oxide scrubbers, the overall price of electricity would not rise by more than about 4 percent even by the year 2000, given a number of countervailing assumptions. For example, utilities with flue-gas desulfurization equipment could switch to cheaper, higher-sulfur coal; other fuels, including nuclear, would be available and increasingly competitive; and some plants built before the standards took effect would still be in operation.
Although nuclear generation capacity will be somewhat cheaper than coal-fired capacity in many locations, it will be installed at a rate limited by regulatory and associated investment risk considerations, with coal making up the balance of the installed generating capacity, regardless of emission standards. Up to at least the mid-1990s no electrical energy source other than these two will make appreciable contributions to the nation’s new generating capacity. Therefore, according to this econometric study, the emission standards will have little effect on total coal demand. Of course, these results are sensitive to variations in electricity growth
rates and the future role of nuclear power. Shortfalls in nuclear projections would tend to raise the average electricity price by requiring more new coal-fired plants subject to the new emission standards.
Given the assumptions of the model—that coal and nuclear are the only options for new generating capacity and that the availability of nuclear power will be limited by noneconomic factors—information on the environmental and health effects of coal emissions will have enormous economic value, determining whether there will be investments of many billions of dollars for emission control equipment. The range of scientific uncertainty and controversy over the impacts of emissions is much wider than for the much more widely publicized case of low-level radiation in connection with nuclear power (chapter 9). Yet, while the potential costs to the economy, and even the costs in additional energy and water resources required, are hundreds of times the cost of acquiring the information that is needed to make better-informed decisions, past and present expenditures in assessing the impacts of coal combustion are minuscule compared with the corresponding efforts in the nuclear field. Unfortunately, it will be nonetheless necessary to expand the use of coal greatly in the immediate future; in fact the largest expansion may well be required in the next 10–15 years, during which we will not have an adequate base for definitive decisions. In the absence of such a base we are forced to pay the price for standards set at levels that may prove overly conservative in the light of improved knowledge.
Sulfur Oxides Under the authority of the 1977 Clean Air Act Amendments, the Environmental Protection Agency has proposed new, more stringent standards for reducing sulfur and other emissions. The standards apply to new and substantially altered (after September 18, 1978) fossil-fueled boilers burning more than 250 million Btu/hr (about 10 tons of coal, 40 barrels of residual fuel oil, or 250 thousand ft3 of gas). For coal or other solid fuel, the standards limit sulfur dioxide emissions to a maximum of 1.2 lb per million Btu consumed. In addition, the proposed regulations would require sulfur emissions to be reduced by 70–90 percent from the uncontrolled levels, with the precise reduction determined by the effort required to reduce emissions to the threshold value of 0.6 lb per million Btu. These percentage reduction requirements could be met by any combination of flue-gas desulfurization, coal cleaning, conversion to synthetic fuels, or other means of removing sulfur before, during, or after combustion. Sulfur removed by a coal pulverizer or in bottom ash or fly ash would also be included in the calculation. The percentage reduction requirement in effect mandates the use of sulfur dioxide scrubbers on all plants to which the standards apply.
At present, there are two commercial means of removing sulfur from coal. First, a good deal of the inorganic sulfur, included as pyrites, is removed by mechanical cleaning and washing. This removes about 70 percent of the coal’s inorganic sulfur (which may range from 60 percent of total sulfur in Appalachian coals to very small amounts in some western coals) and is almost entirely ineffective in removing organic sulfur. Thus, ordinary treatment of this type can remove at best about 40 percent of the total sulfur, too little to meet the proposed requirements.
The second means, upon which most operators of large boilers will have to rely in the future, is to “scrub” the combustion gases with a technique known as flue-gas desulfurization (FGD). In essence, FGD involves bringing the sulfur-oxide-laden exhaust gases into contact with some substance with which the sulfur oxides can react so that they can be removed from the gas stream. The various FGD schemes are distinguished from one another by whether a wet or dry scrubbing agent is used and whether the used scrubbing agent is thrown away or regenerated for reuse, with the captured sulfur as a separate by-product.
About 11.5 gigawatts (electric) (GWe) of coal-fired generating capacity have been fitted with FGD systems. Another 17–18 GWe of capacity now under construction will include FGD systems, and additional capacity amounting to about 27 GWe is scheduled to be in operation with scrubbers by 1985.18 Thus, by 1985, about 56 GWe of coal-fired generating capacity (out of a total of 300 GWe) will include FGD systems.
At present, the predominant commercially available FGD process is wet scrubbing with lime or limestone. Figure 4–3 is a schematic diagram of such a system. The lime or limestone absorbent is introduced into the reaction tank along with scrubber effluent and water recycled from the dewatering section. The mixture is pumped to the top of the scrubber and sprayed down into the gas. A stream of effluent from the scrubber is drawn off and dewatered, producing a sludge that must be disposed of as solid waste. A typical unit using such a system and burning 2 percent sulfur coal will produce about 200 lb of sludge (dry weight) for each ton of coal burned. A 500-MWe plant equipped with a lime or limestone FGD system requires over its lifetime a 560-acre sludge disposal pond 40 ft deep.
These systems, in their 15 years of service in the electric utility industry, have been plagued by design and operating problems that have limited their reliability. Scaling and corrosion of pipes and valves have been especially important problems, necessitating frequent maintenance and careful chemical control. These problems are gradually being brought under control, but the devices are by no means simple to operate, and they raise the operating costs of the power plants significantly. They consume large amounts of electrical and thermal energy (thus decreasing the overall coal-to-electricity efficiency of the power plants in which they are installed
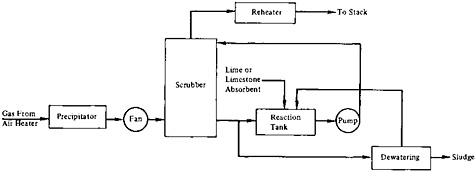
FIGURE 4–3 Generalized lime or limestone flue-gas desulfurization system for coal-fired utility plant.
by about 5 percent); and they consume large amounts of water (0.5–1.5 tons per ton of coal),19 a feature which could raise serious siting problems, especially in the West. The costs of specific installations vary from place to place, but the capital costs typically may be $80–$120/kWe of generating capacity (1975 dollars), with annualized operating costs (capital charges plus operating and maintenance costs) of about 5.5 mills/kWh.20 This would add perhaps 15–20 percent to the typical power plant’s capital cost, and a slightly smaller percentage to annualized operating costs.
Although lime or limestone scrubbing is the most fully developed FGD technology, better processes may be available soon. The nearest to commercial adoption appears to be the regenerable double-alkali process, which uses a recyclable alkali metal hydroxide to neutralize the sulfur oxides; its main advantage is that it lessens the problem of scaling. The Wellman-Lord process, which uses a combination of sodium scrubbing and thermal stripping, is also fairly near to commercial maturity. Several other techniques show somewhat longer term promise.
Fluidized-bed combustion, now under development for use in industrial and utility boilers, holds the potential for somewhat more economical sulfur oxide control, and in addition should reduce nitrogen oxide emissions. It is described below in the section entitled “Advanced Technologies for Coal Combustion.”
Nitrogen Oxides The 1977 Clean Air Act Amendments, as interpreted by the Environmental Protection Agency in the proposed New Source Performance Standards, limit nitrogen oxide (NOx) emissions in new steam boilers consuming more than 250 million Btu of fuel per hour to 0.50–0.80 lb per million Btu, depending on the rank of coal used. These standards are based, according to the EPA,21 on the emission levels
achievable with combustion modification techniques (that is, without the use of scrubbers or chemical systems).
Nitrogen oxides formed during coal combustion draw nitrogen from both the coal and the air in which it burns. The amount formed depends on flame temperature, the amount of excess air in the flame, the length of time the combustion gases are maintained at the elevated temperature, and the rate of quenching. Higher flame temperatures and excess air foster nitrogen oxide production, as does rapid cooling.
At present, the only available means of lowering NOx, emissions in coal-fired boilers is to modify the design and operating characteristics of combustion equipment. One successful approach is to design boilers for two-stage combustion, with the first stage deficient in air and the second causing complete combustion by the injection of additional air. Burner arrangements that yield lower combustion temperatures are also effective, as are restricting air intake, recirculating flue gases, and injecting water into the fire box. Combinations of these methods are reported to lower NOx emissions from larger utility boilers by 40–50 percent.22
Atmospheric fluidized-bed combustion, because of its lower combustion temperatures, will produce less than half the NOx per ton of coal produced by conventional combustion. Pressurized fluidized-bed combustors should do even better.
Particulates The new EPA proposed standards for utility boilers would limit overall emissions of particulate matter to 0.03 lb per million Btu and at the same time set standards for the opacity of existing flue gases. They would require that particulate emissions be reduced by over 99 percent of the uncontrolled emissions. These standards are based on the use of “well designed and operated” baghouses or electrostatic precipitators.23
There are four types of particulate control systems—mechanical collectors, electrostatic precipitators, wet scrubbers, and fabric filter baghouses. They vary greatly in cost and effectiveness; sometimes two types are used in series, with a cheap but relatively inefficient system serving as a first stage to lower the load on the more efficient and costly second stage. All methods of control are more effective in capturing the larger particles; it is probably the smaller, respirable particles that pose the greater danger to health, however, as explained in chapter 9.
Mechanical collectors use gravity, inertia, or centrifugal forces to separate the particles from the gas. Some, for example, consist simply of enlarged chambers in the gas stream, which slow the gas flow and allow the heavier particles to settle. Others depend on induced centrifugal swirling motions in the gases; the particles in these devices are moved by centrifugal force to the outer walls and drop to the bottom of the chamber,
where they can be removed. The units are simple and relatively inexpensive to install and maintain. Because they depend on the masses of the particles, they work best on the larger particles. Because of their low cost and relative ineffectiveness against small particles, they are often used as first-stage cleaners in connection with more efficient (and more expensive) devices.
Electrostatic precipitators consist of high-voltage discharge electrodes and grounded collection plates, between which the flue gases pass. Particles are charged by ions emitted by the discharge electrode and move toward the collection plate, where they can be collected and removed. The devices can remove as much as 99.9 percent (by weight) of the particles in the flue gas, but they too are most effective on larger particles. Capital costs of such systems for large boilers burning medium- or high-sulfur coal are about $25/kWe of generating capacity. With low-sulfur fuel, they are more expensive, because the particles produced in burning such coal tend to be electrically more resistive. To compensate, the precipitators can be enlarged, they can be placed in a hotter part of the flue gas stream (where the high temperatures reduce the particles’ resistivity), or the flue gas can be treated with some substance that reduces resistivity. The third of these options may, however, add some pollutants to the gas, and it is generally used only as a last resort.
Wet scrubbers use water to wash solid particles out of the gas stream. These devices are rather expensive to install and operate and are not widely used for particulate control, though some installations exist.
Fabric filter baghouses are the most effective of all particulate control methods against small particles, but the pressure drop involved in forcing the gas through the necessary fine filters increases operating costs. The devices have been used in industrial particulate control for many years, but the high temperatures and corrosive chemicals in coal combustion gases, among other problems, have limited their use with utility boilers. Improved, heat- and chemical-resistant filters have been developed recently, making this option more attractive to utilities. In view of the importance of small, respirable particles in the health effects of coal combustion, it is likely that filter devices will see increased use in the future, and they warrant vigorous development.
Advanced Technologies for Coal Combustion
A number of new approaches to electricity generation, aimed at improved efficiency, lower costs, or reduced environmental impacts, are under development. None of those about to be described is yet available for commercial use, but all show sufficient promise to support important research and development efforts.
Fluidized-Bed Combustion The technique known as fluidized-bed combustion is a promising alternative to scrubbers for meeting sulfur oxide emission standards. It involves burning the coal in a mixture with limestone (to absorb sulfur), suspended turbulently in the stream of combustion air rising from beneath the bed. This method of combustion allows the coal to be burned at lower temperatures than are normal in today’s pulverized coal burners at 1500°F–1600°F rather than about 3000°F. The lower combustion temperatures substantially reduce emissions of nitrogen oxides. The process is under development now, particularly for small units; the current development goals are high efficiency, durability, low emissions of nitrogen and sulfur oxides, and reliability. These seem attainable in the next few years, and it is conceivable that fluidized-bed combustion systems could be in use for industrial boilers in little more than a decade. Their use in large utility boilers will come later.
There are two approaches to fluidized-bed combustion, atmospheric and pressurized. The first, combustion at atmospheric pressure, is the simpler in design and operation. It is considered a first step toward more economical use of high-sulfur and slagging coals, and because of its relative simplicity it would be especially suitable for small-scale use in commercial and industrial boilers and cogeneration systems. It is on the verge of wide commercialization now; the first few vendors are appearing.
The pressurized (perhaps 6–16 atm) version of this technology is much more complicated and much less well developed. It promises, however, higher efficiencies and lower sulfur and nitrogen oxide emissions than atmospheric fluidized-bed combustion. It holds high promise for larger scale use, as in utility power generation.
Combined-Cycle Generation The combined-cycle approach to power generation holds a good deal of promise in the relatively near term as a means of using coal efficiently and cleanly. The combined-cycle configuration—using the exhaust heat of a gas turbine first stage to raise steam for a steam turbine second stage—is inherently the most efficient power cycle available. This makes it potentially feasible to extract power efficiently and economically from coal even through the intermediary of synthetic fuels, with their inherent conversion losses.
At present there are about 15,000 MWe of combined-cycle capacity in the Western world; the average unit capacity is about 150 MWe.24 Most of this capacity has been installed in the last 10 years. Almost all the plants are fueled by petroleum distillate or natural gas, though the use of heavier
fuels is becoming more common as the ability of gas-turbine components to withstand fuel impurities improves.
The combined-cycle configuration provides a likely application for pressurized fluidized-bed combustion systems. The hot combustion gas from the combustor could be cleaned of most particulates and expanded through a gas turbine, the exhaust from which could raise steam for a steam turbine. The high efficiency of the pressurized combustor would allow overall efficiencies somewhat higher than now achievable in even the best conventional plants. A 13-MWe demonstration of this approach, funded by the Department of Energy, is to begin operation in the early 1980s.25 The fluidized-bed approach could be modified if the problem of particulate carry-over to the turbine proves serious. Combustion gases, instead of being sent directly to the turbine, could be sent instead to a high-temperature heat exchanger using an inert working fluid such as helium, which in turn could heat a closed-cycle gas turbine first stage. This would protect the gas turbine blades but entail a loss of efficiency because of the temperature drop in the heat exchanger.
Another strong possibility is the so-called gasification-combined-cycle approach. In this configuration, a medium-Btu gasifier would be integrated with a combined-cycle power plant, essentially as a means of precombustion emission control. Eventually, coal-to-electricity efficiencies of up to 45 percent (far above the 35 percent typical of standard scrubber-equipped steam turbines fed by pulverized coal) should be attainable, though this will require a good deal of work, especially in developing materials and cooling methods for turbines capable of operation at inlet temperatures well over the 2000°F now possible. Refinement of the gasification system will also be necessary. Such highly efficient systems are unlikely to come into wide use before the late 1990s, but they could be very important for industrial cogeneration, as well as utility power generation, in the decade after 2000.
The nearer term demonstration of gasification-combined-cycle plants is also of some interest, however The first integrated gasification-combined-cycle plant in this country is being designed as a demonstration funded by Texaco, Southern California Edison, and the Electric Power Research Institute. Construction is intended to begin in 1981, and operation in 1984. The unit as planned will have a capacity of 110 MWe, with a 75-MWe gas turbine and a 35-MWe steam turbine, and will consume 1000 tons of coal per day.26 The turbine components will be essentially standard commercial units, and the gasifier will be a scaled-up version of a second-generation, medium-Btu Texaco gasifier that has been operated in Germany for about a year at 150 tons/day. The main problems at this early stage in the project are integrating the gasifier fully with the generating components so that gas can be produced as needed during load fluctuations; improving the
operating characteristics of the gasifier’s waste-heat boiler; and modifying the combustion process to control nitrogen oxide formation.
Sulfur oxide and particulate control in gasification-combined-cycle plants should be relatively simple matters of scrubbing the gas before combustion (far cheaper than scrubbing the emissions of conventional power plants). This is one of the potential attractions of the concept: Even tightening the current sulfur emission standards by an order of magnitude is estimated to increase generating costs in such a system by only 7–8 percent.27
Fuel Cells Fuel cells convert fuel energy to electricity electrochemically rather than thermally. They are essentially nonpolluting, practically noiseless, and potentially very efficient. Furthermore, they are modular in construction and can be installed in units ranging in capacity from a kilowatt or so to several megawatts. They could be used in small installations distributed near load centers, since siting problems should be minimal even in densely populated urban areas. A 4.5-MWe demonstration will take place in New York City in the next few years.
In concept and operation, a fuel cell is very simple. It is essentially an electrolyte between two electrodes. A hydrogen-rich fuel is exposed at one electrode and an oxygen-rich gas (such as air) at the other. The hydrogen at one electrode splits into hydrogen ions and electrons, which move separately toward the oxygen, with which they combine as water. The hydrogen ions move through the electrolyte, and the electrons through an external circuit as electrical current.
Current fuel cell technology uses phosphoric acid as the electrolyte; however, carbon monoxide in the fuel would interfere with cell performance, so that relatively cheap low-Btu gas from coal is not a suitable fuel. Second-generation fuel cells will use a molten carbonate electrolyte, which can tolerate carbon monoxide; they will be more efficient than the first-generation fuel cells (about 45 percent, as compared to 40 percent), and are expected to produce power at lower cost.
Fuel cells can maintain this efficiency over a wide range of loads, unlike conventional power generation units, which are markedly less efficient at part power than at their rated capacities. Fuel cells have nearly constant efficiency from 25–100 percent of rated power output, and can respond within seconds to large changes in load. Pollutant emissions (mainly from the fuel processing section) would be an order of magnitude below the levels set by current emission regulations.
The ease of siting, the modular construction, the environmental characteristics, and the efficiency and operating flexibility of this concept mean that fuel cells could be a major source of coal-derived energy by the early twenty-first century, especially for intermediate load following. It
may be easy to apply fuel cells to those processes which can make effective use of the waste heat, such as industrial cogeneration and integrated utility systems to provide electricity and heat for on-site residential and commercial use.
Magnetohydrodynamic Generation Like fuel cells, magnetohydrodynamic (MHD) technology is a means of producing electricity without the need for a turbine—in this case by expanding hot, electricity-conductive gas (such as fuel combustion gases treated to conduct electricity) through a magnetic field. The interaction of the accelerated, conducting gas with an intense transverse magnetic field induces an electric field in the gas. If electrodes are present to collect the current, then electric power can be supplied to an external load. The emissions from an MHD plant would be almost free of sulfur, even if raw coal combustion gases were used, because the potassium salt used to render the gas conductive would combine with the sulfur, which would be separated out as the potassium was recycled. Efficiencies of as much as 50 percent, from coal to electricity, could be achieved using raw coal combustion gases.28 Exhaust gases are at high temperatures, and their heat could be captured and used in a steam turbine bottoming cycle. MHD as a commercial technology for using coal to generate electricity is more than 20 years away, and will make no major contribution to energy supply in the period with which this study is concerned.
Energy Storage Electric utilities for years have used energy storage to derive benefit from off-peak power generated by base-load plants. It is obvious that wide adoption of any suitably efficient energy storage procedure would allow large coal-fired and nuclear base-load stations to serve increasing amounts of the load; and that this would provide further scope for the use of coal in utilities, while minimizing the need for additional generating capacity. The savings in oil and gas, which now fire most of the intermediate and peaking generators, could be very great.
Except in utilities well endowed with hydroelectric dams, the only method of bulk power storage now used—and the most economical source of peaking power in many situations—is pumped hydroelectric storage. This technique entails pumping water uphill with off-peak power, then running it downhill through turbines to help meet intermediate and peak loads. This system is economical and efficient, but takes up large land areas (mainly for the reservoirs); in many places sites are unavailable, though systems with their lower reservoirs underground have been suggested. The storage alternative most nearly available as a supplement is to compress air in underground caverns, then extract energy by running the air through
turbines. If fuel is fed into the air stream before it enters the turbine, a combustion turbine can be used and the result is very efficient and economical peaking power. The use of medium-Btu gas from coal would obviate the need for additional oil and gas. Sites for such plants are less limited by topography than those for pumped hydroelectric installations. A 290-MWe compressed-air storage plant burning natural gas, the first of its kind, is being used in Huntdorf, Federal Republic of Germany, for peaking. It has been in operation only since November 1978, but so far has proved very economical as a source of peak power.29
A number of other approaches, including batteries, thermal storage, flywheels, superconducting magnets, and hydrogen electrolyzed from water with off-peak power, are being developed.30 None is sufficiently advanced to assume commercial service over the coming 10 years.
Cogeneration The cogeneration of electricity and heat is very attractive as a fuel conservation measure, as explained in chapter 2. The development of small- and medium-sized coal-fired units, with suitable environmental characteristics, would allow more flexibility in matching the demands for steam and electricity; it would also make coal increasingly suitable as a replacement for oil and gas in cogeneration projects or decentralized integrated utility systems for apartment or office complexes, hospitals, and the like. There would be some difficulties in fuel delivery and ash removal, but this option should be studied carefully.
SYNTHETIC GAS FROM COAL
Coal gasification has been a commercial operation for more than 150 years. It was carried on in many cities in the United States until the years after World War II, when cheap natural gas began to be transported through the long-distance pipelines built to carry petroleum for the war effort. By the mid-1950s the domestic industry had virtually disappeared. Europeans continued to gasify coal and substantially improved the gasification technology until the 1950s, when Middle Eastern oil and Dutch natural gas began to displace the European coal-derived gas industry; very few new coal-to-gas plants have been constructed.
None of the gasification technologies currently available for commercial use produces gas with a heating value equivalent to that of natural gas, which is essentially all methane. The gases from the conversion processes are mixtures of carbon monoxide and hydrogen, with small amounts of methane distilled from the coal; these “low-Btu” gases have heating values of 150–300 Btu/ft3, as compared with natural gas at 1000 Btu/ft3. Some changes in process conditions (for example, substituting oxygen for air
during the partial combustion that produces the gas) can increase the heating value to about 500 Btu/ft3; gas of 300–500 Btu/ft3 is known by convention as “medium-Btu gas.” Medium-Btu gas, however, can be converted to high-Btu gas, fully equivalent to natural gas, though no commercial installations are in use.
Virtually all coal gasification processes entail similar steps. First, the coal is crushed. (If coking coal is to be used in certain gasification processes, it is necessary to pretreat it after crushing to destroy its fusing properties, generally by heating it in a mixture of steam and air or oxygen.) The coal is fed to a gasifier where it is heated in the presence of air or oxygen. Depending on the type of gas to be made, the resulting low- or medium-Btu gas may be treated with steam to adjust the ratio of carbon monoxide and hydrogen (the so-called shift reaction), after being cleaned of impurities. This is followed by a second cleaning to remove carbon dioxide and hydrogen sulfide. If high-Btu gas is desired, the clean medium-Btu gas is passed through a methanation step, in which the raw gas is reacted over a catalyst to produce essentially pure methane.
Low- and Medium-Btu Gas
The low-Btu gas produced by an air gasification system has a heating value too low to be economically transported or used in equipment designed for natural gas. It could, however, be used to power on-site industrial boilers and electric power generating equipment. As explained earlier, combined-cycle generating plants fueled by coal gasifiers appear to offer the potential of efficient and relatively low-cost electric power generation as well as environmental benefits over direct coal firing.
When oxygen is used in the gasifier instead of air, the gas produced can have a heating value 30–50 percent that of natural gas, essentially because it is not diluted with nitrogen from the air. Costs are increased by the need for an oxygen-generating plant, but the higher quality medium-Btu gas requires less cleaning than low-Btu gas and can in addition be transported economically for distances of 150 miles or more. Industrial gas users who must convert from natural gas may find medium-Btu gas preferable, especially if their access to petroleum is restricted. Medium-Btu gas may also serve as a fuel for combined-cycle generating plants, as explained earlier.
The commercially available processes for low- and medium-Btu gas production were all developed in Europe. The predominant processes are the Lurgi, the Winkler, and the Koppers-Totzek, all of which use oxygen and steam but differ in the method of bringing these reactants into contact with the coal. A number of improved processes are undergoing development here and abroad.
High-Btu Gas
High-Btu gas, equivalent in heating value to natural gas at 1000 Btu/ft3, could serve as a direct replacement for natural gas in existing pipelines and distribution systems. The projected price (roughly $4–$5 5 per million Btu (1977 dollars)) is about half that of electricity (though much more than that of natural gas). The choice between high-Btu gas and electricity rests on the final cost to the consumer per useful Btu, that is, the cost of the delivered gas or electricity times a factor to allow for the efficiency of end-use. In residential services the advantage of gas for cooking is clear. For space heating, particularly with heat pumps, and for air conditioning, the case is not clear. The alternative of using high-Btu gas is a very important one, because there are some 40 million residential gas customers, 85 percent of whom use gas for space heating. Furthermore, there is a large and efficient gas distribution system already in place, representing an investment of several billion dollars. The allocation of emphasis between gas and electricity as the ultimate products of coal use must be decided carefully for each region, considering the value of using gas distribution systems where they already exist.
The most nearly available high-Btu coal gasification technique is the methanation of medium-Btu gas. The Lurgi process has been tested as a source of the raw gas, and some improvements in this process have been made in the past few years with the aim of better suiting it as a component of a high-Btu gas system. There is need, however, for more economical gasification processes than the “first-generation” Lurgi technique. Thus, a number of second- and third-generation processes are under development, with some of the more advanced projects under combined industry-government funding.
Of the second-generation processes now under investigation, a number have been subjected to pilot plant tests over the past few years. Among the prime objectives is to produce raw gases of high methane content and thus to reduce the need for oxygen in the gasifier. Among the federal development projects are the HYGAS process, which has been operated in a 3-ton/hr pilot plant by the Institute of Gas Technology, and the two-stage Bi-Gas process, which can use all types of coal and is being tested in a 120-ton/day pilot plant at Homer City, Pennsylvania. Private industry is investigating many other approaches in smaller scale facilities.
Third-generation processes promising much improved thermal efficiencies and lower costs are also being investigated through feasibility studies and very small experimental reactor tests. The two such processes emphasized in the federal research and development program are hydrogasification, which produces high-Btu gas by direct reaction of coal
with hydrogen, and catalytic gasification, which eliminates the shift reaction and methanation steps entirely.31
Underground Coal Gasification
Production of low- or medium-Btu gas from coal in situ, by injecting air or oxygen into coal seams, has a number of attractive features. First, more than 90 percent of the nation’s coal resource is inaccessible to mining; some of this could be gasified in place. Of particular interest in the federal research and development program are “steeply dipping beds,” or those that slope more than 35 degrees from the horizontal; such beds in the United States are estimated to contain more than 100 billion tons of coal,32 and coal in these formations may be easier to gasify in situ than that in conventional beds.
Underground coal gasification has several potential health, safety, and environmental advantages over conventional mining followed by gasification. It requires less land disruption, uses less water, brings less solid waste to the surface, and probably creates less air pollution. The most important environmental uncertainties are the potential for contamination of groundwater, and in some cases the hazard of subsidence of the surface over gasified seams. This kind of development must be accompanied by intensive environmental research and monitoring.
Several different methods are being investigated. The most advanced is the linked vertical well method, used to produce low-Btu gas from western coal by air injection. Work on this process began in 1972 and several pilot tests have been quite successful. The Department of Energy estimates that commercialization of the process could begin by 1987 if the product is competitive in price.33 Experiments have also been performed in the production of medium-Btu gas by oxygen injection.
The gas could be used for electricity generation at the gasification site, for the local generation of process heat (for which medium-Btu gas would be especially well suited because it can be economically transported moderate distances), as a raw material for chemical feedstocks, or for conversion to high-Btu gas. One estimate suggests that in situ gasification could eventually provide as much as 1.5 quads of energy in the region surrounding the Rocky Mountains.34
Product Costs
After a comparison of many synthetic gas cost estimates, one authority calculated that a Lurgi high-Btu gas plant yielding 10.4 million standard cubic feet per hour could operate at a cost (1977 dollars) of roughly $4.50 per miilion Btu.35 However, all such estimates are highly speculative and
varied. There is as yet no domestic industry and the experience in Europe is not much help—the facilities there were built long ago and the processes are not necessarily those that will be used in this country. Capital costs will account for half to two thirds of the product price, and estimates are therefore quite sensitive to assumptions about construction costs and methods of financing. Inflation in heavy construction, for example, has been rapid over the past 10 years, and some estimators do not state explicitly whether they use constant or current dollars. Construction costs also vary markedly from region to region. The debt-equity ratio in financing is another source of confusion, along with the assumed rate of return to investors. The costs of coal and water, as well as emission and waste control, are also important variables.
All in all, firm estimates of production costs must await the construction and operation of the first few plants. As the supplier industries develop an infrastructure, experience is gained, and technical refinements are made, costs should fall, as they have in other similar developing industries.
Research and Development Priorities
Economic Comparison of Gasification Options Pilot plants already constructed should be operated to supply data complete enough to permit capital, operating, and product costs for all types of commercial plants to be estimated and compared. The operational data so developed should then be examined to assess the best combinations of gasification and purification processes and other promising economic possibilities for the following applications.
-
Use in combined cycle electric power operations, both utility and industrial.
-
Expanded use in metallurgical industries, particularly for direct reduction of iron ore.
-
Use as feed for petrochemical industries, particularly for alcohol and fertilizers.
-
Expanded use in industry for process heat and process steam raising,
-
Use in integrated utility systems to provide cogenerated electric power and heat for apartment complexes, hospitals, and the like.
-
Domestic use of high-Btu gas as a replacement for natural gas.
Technological Assessment and Development In parallel with the economic assessment of various processes, a major program of research and development is needed to accomplish the following tasks.
-
Using existing basic gasification technology, build and operate
-
commercial pioneer projects to obtain data about costs and operational problems in U.S. commercial markets.
-
Continue development of alternative in situ, high pressure, and catalytic processes.
-
Develop an improved process for gasification as a basic step required for indirect liquefaction for both fuel and chemicals synthesis.
-
Explore the use of by-product pyrolysis liquids since the value of this material is a major factor in determining the cost of the primary product gas.
-
Develop long-range water-use plans to help assess the value of water-conserving technologies.
-
Assess more completely the health and environmental impacts of gasification plants including ash disposal, handling and use of pyrolysis products, and pipeline shipment of gas containing carbon monoxide.
-
Increase knowledge of solids handling. Particular attention should be given to systems that feed coal into and remove coal from high-pressure reactors.
LIQUID FUELS FROM COAL
Many different coal liquefaction processes are under development, but there is no fully developed new technology suitable for large-scale commercial use. Several processes have advanced, under federal sponsorship, to the pilot plant stage, however, and at some time in the future can be expected to become commercially competitive. None will see wide commercial use before the late 1990s without large government subsidies.
The approaches to coal liquefaction fall into four categories: indirect liquefaction, pyrolysis, solvent extraction, and catalytic liquefaction. Indirect liquefaction is the only liquefaction process in commercial use; the SASOL plants in the Union of South Africa will soon be producing about 40,000 barrels of gasoline and fuel oil per day. In this process the coal is first gasified; the resulting synthesis gas is cleaned of impurities and converted over a catalyst to any of a range of products, from gasoline to heavy oils and waxes or methanol, depending on the catalyst and process conditions. Indirect liquefaction processes have low thermal efficiencies (40–45 percent), and for this reason may not be economically suitable for use in the United States.36 In producing substitutes for highly refined petroleum products such as gasoline, however, indirect liquefaction, which would obviate the heavy demand for hydrogen in refining the heavier liquids from direct approaches, may have significant cost advantages.
In pyrolysis, coal is heated in the absence of oxygen to obtain various liquid and gaseous products and char. Hydrogenation is accomplished either by relying on hydrogen from the coal itself, or by carrying out the
process in a stream of hydrogen gas to improve the yield of liquids. Thermal efficiencies can exceed 80 percent, though the liquids are in poor quality and of insufficient value to justify the cost of further processing. Pyrolysis is not a serious candidate for further development as a source of liquid fuels.
In solvent-extraction processes the pulverized coal is mixed with hydrogenated solvents that help to dissolve it and at the same time contribute hydrogen to the hydrogenation reaction. The reaction is catalyzed to some extent by inorganic substances in the coal itself. Thermal efficiencies in this group of processes are 60–65 percent in experimental reactors. One of the more difficult technical problems is how to separate the undigested coal and ash from the liquid products.
Catalytic liquefaction processes have similarly high efficiencies and similar problems in separating solids from the liquid products. Catalyst deactivation is difficult in processes in which the catalyst actually touches the coal. This results in very large requirements for replacement catalysts and consequently rather high potential costs. Some catalytic processes therefore suspend the coal in heavy oil and pass it over a catalyst bed, thus avoiding intimate contact between coal and catalyst; the oil serves as a hydrogen donor after being hydrogenated at the catalyst.
Of the many approaches that have been evaluated, three are at present favored; they enjoy roughly equivalent stages of development. These are two solvent-extraction techniques—Gulf’s Solvent Refined Coal-II (SRC-II) and the Exxon Donor Solvent (EDS) process—and one catalytic liquefaction process (the H-Coal processes of Hydrocarbon Research, Inc.). Each yields about 2.5–3.0 barrels of liquid per ton of coal. The EDS process (which can be considered fairly typical), yields 0.1 barrel of liquid petroleum gas (LPG), 1.0 barrel of naphtha, and 1.5 barrels of fuel oil (as well as 78 lb of sulfur, 12 lb of ammonia, and 223 lb of ash).37 All of these processes are in relatively good positions to become commercial in the next decade or so. The production of methanol from coal by the indirect method is also well advanced technically.
Gulf’s SRC-II process is based on work done in Germany about 50 years ago, It has benefited from a good deal of effort in this country during the past 15 years, first as a means of providing a high-grade, clean-burning solid fuel (SRC-I) for use in utility and industrial boilers, and more recently as a source of liquid fuels for a broader market. The SRC-II process is closest to commercial scale. In Tacoma, Washington, a Department of Energy facility is consuming about 30 tons of coal per day,38 and a full-scale demonstration building on this experience might be achievable somewhat earlier than demonstrations of the other two processes. A 6000-ton/day plant is proposed for operation by 1985. The solid-product process has been more extensively examined; its further
development to provide clean boiler fuel is also being supported by the utility industry. There is doubt, however, that the sulfur content of the solid fuel can be lowered economically to the levels required by the new sulfur emission regulations.
The EDS process uses an indirectly catalyzed reaction, in which a hydrogen-rich solvent stream is produced over a catalyst and then mixed with coal and additional hydrogen in a second reactor, where the solvent releases its hydrogen in reaction with coal. A 250-ton/day pilot plant is under construction in Texas39 and could be scaled to commercial size.
The H-Coal process is an extension of a process used to desulfurize heavy petroleum oils. Its development is being fostered by the Department of Energy, the Electric Power Research Institute, and a consortium of oil companies led by Ashland Oil. A 600-ton/day plant is now being constructed in Kentucky,40 and Ashland Oil has proposed construction of a 20,000-ton/day plant for operation in 1985.
Besides these processes, a number of others are undergoing experimental work; a few are being tested in laboratory-scale facilities, but none on the scale of the three described above.
Product Costs
The costs of products from these processes have been estimated by many different organizations at different times, using different assumptions about capital costs and financing, coal prices, production levels, specific liquefaction techniques, and products. The National Research Council’s Committee on Processing and Utilization of Fossil Fuels41 was able to make estimates “merely indicative of the general level of cost.” Its report states that product costs (in January 1977 dollars) might be as little as $24 per barrel of oil equivalent (at 6 million Btu per barrel) with coal costing $0.40 per million Btu (about $8.00/ton), or as much as $41 per barrel with coal costing $1.40 per million Btu (about $28/ton). This spans most of the range of current coal costs. Obviously, though, it will be impossible to make firm cost estimates until the technologies are much closer to commercial status than they are today.
These estimates do indicate, however, that the price of oil will have to rise a great deal before synthetic products will be able to compete on the market. Arguments can, however, be made for subsidizing synthetic fuels as a means of decreasing demand for imported oil, and a number of means of applying such subsidies have been suggested. In one scheme, the federal government would require that a certain proportion of the oil to refineries be of synthetic origin, and that the higher price of synthetic crude be distributed through the price of all oil. Thus, if 10 percent of the nation’s oil were of synthetic origin, and this synthetic oil were twice as costly as
natural petroleum, the net increase in oil prices due to synthetics would be only 10 percent. As the synthetic industry grew, and the availability of oil diminished, the mandated proportion of synthetic crude could be gradually increased. At some point the prices of synthetic and natural oil would presumably approach parity, and further such subsidies would be unneeded. The main advantage of such a scheme is that it leaves to industry the choice of technology. There are other approaches to commercializing synthetic liquid fuel technology by guaranteeing a market or otherwise subsidizing the industry; this committee has not examined any in detail.
Refining
The solvent extraction and catalytic liquefaction processes that are now emphasized in development are well adapted to produce a variety of fuel oils as their principal products. These are generally fairly low in sulfur, but rather high in some other troublesome elements. Their generally high nitrogen contents, for example, render them rather unstable in storage and also produce nitrogen oxide emission problems. Some special refining will likely be necessary to denitrogenate the liquids; this will require improved denitrogenation catalysts. Those available now are unselective in removing nitrogen, since they merely hydrogenate the liquids to saturation before removing nitrogen. This increases the expense of hydrogen, which is a key part of the cost of producing and refining coal liquids.
Pollution Problems
The environmental and health benefits of using coal liquids as substitutes for coal in power plants and large industrial boilers are not clear. While these products can be “cleaner” in combustion than coal itself, their use may merely shift the sources of pollution from power plants to liquefaction plants. The data base for evaluating the environmental impacts of coal liquefaction plants is, however, very limited.
Animal testing and occupational health records from related processes such as coking indicate that the heavier fractions of coal liquids—particularly those boiling at temperatures over 560°F—would pose a substantial threat of cancer to workers chronically exposed. This is due to the concentration of polycyclic organic matter in these fractions. (See chapter 9.) Modern industrial hygiene can probably eliminate this hazard in the liquefaction plants and the large utility and industrial boilers where these fractions would be most appropriately burned.
Research and Development Priorities
Coal-derived liquid fuels will become increasingly important over the coming decade or two, as the world oil-supply situation tightens. Because the current processes for coal liquefaction promise prices more than double the present world price of crude, lowering costs must be a prime objective of the synthetic fuel research and development program. Even a small-scale demonstration of a more economical process could have a salutary effect on the world petroleum market. Additional research and development should be conducted, including the following tasks.
-
For the more promising processes, build commercial-scale pioneer plants.
-
Continue to look for better processes (including indirect liquefaction).
-
Assess the technologies for using less (or poorer-quality) water.
-
Examine carefully the health and environmental impacts of the processes. It will be necessary to have solutions to the major impacts before large amounts of the liquids are produced.
-
Demonstrate the processes required to separate undigested solids from the liquids in direct liquefaction units.
-
Evaluate refining techniques for the raw liquids to determine product quality and costs.
-
Develop catalysts to synthesize various hydrocarbons from carbon monoxide and hydrogen for use as fuels or chemicals.
-
Continue the current broad program of fundamental research. Examples of the fundamental questions vital to coal liquefaction are the chemical structures and compositions of different coals, the effects of process variables on reaction paths and rates of hydrogen transfer with and without catalysts, the roles of coal’s mineral and nitrogen content in the catalytic hydrogenation processes, and catalytic mechanisms in general.
COAL FOR INDUSTRIAL PROCESS HEAT
U.S. industry burned nearly 60 million tons of coal (about 1.5 quads) to generate steam and process heat in 1976. This amounted to nearly 10 percent of industrial primary energy use. Coal use in industry has been dropping for the past 30 years in this country, and there is no very great incentive for industry to reverse the decline. Even at oil and gas prices higher than those that prevail today, burning these fuels is almost always cheaper and more convenient to the small user than burning coal, because of the extra capital and labor costs of handling the coal and treating wastes and emissions.
Technically, however, there are significant opportunities for conversion to coal as existing oil- and gas-fired boilers, kilns, and furnaces are replaced. One recent study,42 for example, examined the most likely prospects for industrial use of coal as a source of direct heating, and found opportunities for saving almost 1 quad of oil and gas in six energy-intensive industries—cement, lime, iron and steel, copper, glass, and ceramics—by using coal where it is environmentally and economically most acceptable. The prospects for coal use in boilers are potentially much greater than this, although the cost penalties—due largely to the capital and operating costs of pollution control and coal-handling equipment—would be significant. According to a recent report,43 a coal-fired boiler and its ancillary equipment cost from 2 to almost 5 times as much as an equivalent oil- or gas-fired boiler. Fuel savings must be sufficient to return these costs in a timely fashion if coal use in industrial boilers is to be a good investment. At the current relative prices of coal, oil, and gas, this is not usually the case except in units consuming very large amounts of fuel.
However, the Powerplant and Industrial Fuel Use Act of 1978 will, when its regulatory provisions are formalized by the Department of Energy, impose rather strict limits on the use of oil and natural gas in new “major fuel burning installations,” defined as those consuming more than 100 million Btu/hr (about 4 tons of coal) per individual unit or 250 million Btu/hr for each multiunit facility. Such installations will in general be forbidden to burn oil or gas; the rules for exemptions and certain further prohibitions of oil and gas use are still under consideration, so that the ultimate effect of the act is impossible to predict. The Department of Energy itself projects industrial noncoke coal use without the act to rise by 1990 to 5.6 quads/yr (about 235 million tons). According to the Department of Energy’s projections, the most stringent of the restrictions under consideration would raise this to 7.4 quads, or about 315 million tons. Because the act depends for its effect mostly on the replacement of existing units, replacement of oil and gas by coal would presumably accelerate in the 1990s. In 1974, 90 percent of the oil and 70 pecent of the gas burned in boilers was burned in major fuel-burning installations and therefore would be potentially subject to the act.44
The many smaller burners scattered throughout industry will present far smaller opportunities for coal consumption, because at their rates of fuel use the capital and operating cost penalities of coal use will far outweigh the potential fuel savings. The research and development efforts aimed at small-scale coal burning (see “Advanced Technologies for Coal Combustion” above) will probably make coal use a better investment for small users by the 1990s, but it is impossible to predict their impact very precisely.
COAL AS A CHEMICAL FEEDSTOCK
The pressures on oil and natural gas prices, together with the development of coal gasification and liquefaction processes, should make coal an increasingly attractive source of petrochemical feedstocks, especially after 1985. There are often a number of fuels besides oil or natural gas that could serve as petrochemical feedstocks. The factors that determine the choice of fuel are generally its delivered price, its efficiency in the production process, and its associated capital and operating costs. Given comparatively high efficiency and low capital and operating costs, one fuel could be cheaper to use at twice the cost of another fuel per million Btu, as is roughly the case now with natural gas compared to coal in the production of synthetic ammonia.
The great upward pressure on the costs of today’s two principal petrochemical feedstocks, natural gas and petroleum, should begin to force a switch to coal products within a decade. The domestic reserves and production of natural gas and oil have already sharply declined from their respective peaks, and their prices will continue to rise, even if pressure on world prices is eased by a reduction of imports. By 1985, moreover, natural gas prices will have become deregulated under the Natural Gas Policy Act of 1978 and will probably be at least equal to world oil prices. Resource depletion will not, however, be a large factor in the U.S. use of coal for the foreseeable future. And, while coal costs will be raised by regulatory restrictions on the mining and use of coal, as well as, perhaps, by poor productivity gains and increasing concentration in the industry, these increases are not expected to match or approach the real-cost increases of oil and gas.
As a result, there will likely come a time—for some applications the middle to late 1980s—when the premium paid for the use of oil and gas as simple, efficient petrochemical feedstocks will become too high.
The amount of coal potentially involved in the substitution for oil and gas feedstocks is difficult to estimate given the different rates of conversion of the various feedstocks and the varying rates of conversion of one feedstock when used in different conversion processes. In the case of ammonia, for instance, it takes 34.5 million Btu of natural gas as a source of fuel and feedstock to produce 1 ton of ammonia, while it takes 41 million Btu of coal to produce the same result (At current rates of ammonia production—about 18 million tons/yr—it would take 0.740 quads of coal to meet the needs of the ammonia industry, or about 32 million tons—5 percent of 1978 production.)45 While coal is in fact likely to replace oil and gas in many feedstock operations, it will not do so uniformly throughout the country. Rather, since there are large regional
differences in the delivered price of coal, it will become competitive as a feedstock in some regions earlier than it will in others.
COKE PRODUCTION
In 1976, 84 million tons of bituminous coal and 400,000 tons of anthracite were carbonized into 58 million tons of coke. Almost all of the production took place in coke ovens operated by steel and smelter companies to feed their blast furnaces and foundries. About 25 percent of the cost of the coal was recovered from chemicals yielded as a by-product of the carbonization process: about 10 percent from coke oven gas not used to fuel subsequent carbonizing but used elsewhere in the plant or sold; and about 10 percent from tar and its derivatives, including naphthalene. Other chemicals produced at coke plants include ammonia, light oil, and light oil derivatives.46
Most of the 60 million tons of coal exported in 1976 was of coking quality, bringing total U.S. production of coking coal that year to about 140 million tons, or about one fifth of total U.S. coal production. As of 1974, there were an estimated 20 billion tons of coal in the U.S. reserve base that were of potential coking quality (i.e., of rank higher than high-volatile C bituminous, with an ash content not greater than 8 percent and sulfur content not greater than 1 percent).47 Discounting mining losses puts recoverable coking coal reserves somewhere in the neighborhood of 12 billion to 16 billion tons. More than half of these resources are in West Virginia and another fourth are in eastern Kentucky; West Virginia has practically all of the “strongly” coking low-volatile bituminous coals, of which there are roughly 2 billion recoverable tons and of which approximately 18 million tons were consumed in 1976. Coking coal supplies could begin to tighten toward the middle of the next century, depending on the future of exports, of the steel industry (the direct reduction of iron ore to steel is now seeing some commercial use), and the ability to use blends of lower-quality coals to make coke.
PRODUCTION
INTRODUCTION
If coal demand rises significantly, a concomitant rise in coal production will not be automatic, despite coal’s abundance and physical accessibility. A variety of institutional issues surrounding coal mining could, unless resolved, take precedence in the 1980s over today’s questions of demand constraint.
Coal output is likely to rise in the coming decades, by varying amounts, in all coal-producing regions. The result will be to intensify all currently outstanding production problems and controversies, both East and West. The Environmental Protection Agency has estimated new power plant construction and regional coal production by 1995 to total 220 new coal-fired power plants in the East and Midwest, and 130 in the West and in the West South Central region, for a total of 258 GWe.48 Coal production would increase over 1975 production by 1.1 billion tons—65 percent from the West, 27 percent from the Midwest, and only 8 percent from Appalachia. CONAES has made no independent studies of the regional distribution of coal consumption. We use the EPA estimates for illustrative purposes only, noting that the total coal consumption used by the EPA for 1995 corresponds quite closely with CONAES study scenario III3 (Table 11–22), but the EPA estimate of coal-fired electricity generation is about 20 percent less than this study scenario’s estimate (Table 11–28).
As discussed earlier, the new EPA policy requires scrubbers on all new coal-fired power plants, regardless of the sulfur content of the coal. While this requirement will put demand for western coal significantly below the amount that would have been generated by its use as “compliance” coal, the EPA still expects some extra demand for western coal as a means of permitting less-costly light scrubbing (with experimental “dry scrubbers”). This will contribute to the rise in the amount of western coal shipped eastward, the EPA estimates, from 21 million tons in 1975 to 70 million tons in 1995. (EPA expected 100–120 million tons shipped eastward in 1995 if no scrubbing were required for low-sulfur coal.)49
Under the EPA estimates, western production will rise sharply to meet needs west of the Mississippi, regardless of the fate of eastern demand for low-sulfur coal. If western mining does continue to expand, western production controversies concerning federal leasing, land reclamation requirements, water rights, and the local and regional impacts of boomtown development could become at least as important as the traditional eastern ones concerning labor-management relations (although unionization of western coal mines could also become significant if production continues its massive growth there). Conversely, if there is a stalemate on these western issues, or if eastern labor and management achieve a gradual rapprochement under pressure from western competition, there could be a larger role than is now projected for mining east of the Mississippi.
LABOR FORCE
There were 237,000 coal workers in 1977, including about 213,000 miners, at least 7000 coal mine construction workers, and others who worked in
coal preparation plants and in repair shops. Roughly three fourths of mining employment is in underground mines, which yield about 40 percent of the nation’s coal. Of the 160,000 members of the United Mine Workers of America (UMW), 100,000 are underground miners, 63 percent of all such workers. Since the UMW-organized underground mines tend to be the largest ones, the union probably mined more than 63 percent of all deep coal. About 11,500 UMW members were employed at surface mines, representing 21 percent of all surface miners. Since the UMW-organized surface mines tend to be the smaller ones, their workers probably produced less than 21 percent of all surface coal. Overall, UMW workers probably mined about 50 percent of total output.50
The problems of using coal, discussed in the previous section, make it appear unlikely that rapid increases in coal demand will occur through 1985. However, to convey a sense of the impact that a rapid escalation of output would have on labor supply and labor-management relations, we will assume a near doubling of current output to 1.2 billion tons in 1985. If output reached 1.2 billion tons at the 1976 rate of labor productivity, the labor requirement would be 368,000 workers. In addition to the 130,000 employment increase over current levels, approximately 60,000 additional workers would be needed to compensate for attrition at a 2.5 percent turnover rate.51
An engineering labor requirement of 3.5 percent of total mining employment (it was 3.2 percent in 1976) would call for 6,200 additional mining engineers in coal production by 1985 and 900 mining engineering graduates per year to supply all mining industries. The number of bachelor and postgraduate mining engineering degrees rose nearly fourfold in the 1973–1976 period, from 160 to 625; the rate was nonetheless inadequate to meet the needs of the coal companies, which attracted engineers from other industries. These figures indicate that a rapid buildup of production would require intensive efforts by industry and government to promote engineering careers and support engineering education.52
As for the miners themselves, there is generally expected to be adequate supplies of labor to meet even steep increases in output, both east and west of the Mississippi. The question mark in the general area of mine labor concerns the future of labor-management relations in the East and the extent to which western mines will see increasing unionization.
Although it affected all regions, the surge of coal production and employment in the 1970s centered in western, nonunion, surface mines, thus reducing the UMW’s role in the industry. The period also brought into the UMW ranks a heavy influx of young, inexperienced miners concurrent with the departure—due to retirement or disability—of 50,000 experienced miners, a demographic change of far-reaching effect. This influx of inexperienced miners is thought to have contributed directly to the rise in
mine accidents per worker-hour and the decline in output per worker-hour that began in the late 1960s.
A second contributor to the productivity decline was the flare-up of traditional labor-management conflict that began in the late 1960s.53 Per worker-day, deep-mine productivity dropped from about 16 tons in 1969 to about 8 tons in 1978. Surface mine productivity dropped, in the latter part of this period, from about 37 tons to about 25 tons in 1978 (see Figure 4–4).54
A third source of the productivity decline was the opening of more marginal mines in the 1970s to meet growing demand. Just as productivity was aided in the previous decade by stagnant demand and the closing of marginal mines, it was reduced by the expansion of mining, especially in the East, to more difficult seams.
The passage of the 1969 Coal Mine Health and Safety Act (amended in 1977), which set more stringent health and safety standards for mining, was a fourth source of the productivity decline. A measure of the effectiveness of the act was the 60 percent cut in the number of deaths per million hours of exposure in underground mining (and in absolute numbers from 220 in 1970 to 100 in 1977). However, an improvement in the historical rate of disabling injuries (i.e., those causing the loss of at least 1 day’s work following the day of the injury) appeared only in 1974 and 1975. The 1977 rate was 7 percent higher than the 1969 rate, and total annual injuries in underground mining remain in the 9000–11,000 range. Fatalities and disabling injuries per hour in surface mines occur about half as frequently as in underground mines; moreover, the fatality rate in surface mines has fallen to about one third of the 1970 level, and the disabling injury rate has declined about 13 percent.55
The Office of Technology Assessment (OTA) has estimated that if output rises from about 0.7 billion tons in 1977 to 1.5 billion tons in 2000 at constant labor productivity and injury rates, total annual fatalities would rise from 139 to 259 and disabling injuries would grow from 15,000 to 29,000. The estimate shows almost the entire increase in each category would occur in underground mines. To reduce injury rates further, the OTA urged that improved engineering and safety standards be extended to more aspects of mining machinery, that mine inspections be made more frequently, and that labor, industry, and government make stronger efforts at safety training, especially at mines with high accident rates.56
The 1969 act also limited the amount of respirable dust to be allowed in the mines, established enforcement procedures, and granted compensation to miners totally disabled by any of the ailments with respiratory symptoms that are collectively called “black lung.” From 1970 to 1977, 421,000 miners have received $5.6 billion in black lung compensation.57
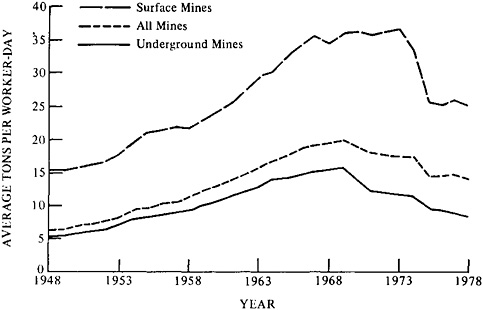
FIGURE 4–4 Productivity in bituminous coal and lignite mining from 1948 to 1978 (average tons per worker day). Source; U.S. Department of Energy, Energy Information Administration, Annual Report to Congress, 1978, vol. 2, Data (Washington, D.C.: U.S. Government Printing Office (061–000–00288–0), 1979), p. 96.
The extent to which coal mining per se is responsible for all of this disability, however, is a question that has not been precisely evaluated.
The occupational health problems relating to coal mining have not been satisfactorily analyzed, in part owing to the many factors involved, sociological as well as occupational. Although the respirable dust standard—if it can be effectively enforced—should provide very significant protection against certain conditions (the pneumoconiosis-fibrosis categories), it is not known to what extent it will protect against other conditions in the very broad black lung category, or against other conditions that could be specifically associated with working in the mines. The problem is discussed in chapter 9. The Office of Technology Assessment58 has emphasized the potential threats to health from other dusts, noise, mine gases, and engine emissions. The whole problem requires intensive study and control that will entail the active cooperation of the workers and management.
It would appear that the broadest relevant generalization concerning the question of labor and working conditions is that the recent period of rapid growth has brought both upheaval in labor-management relations and progress in working conditions. The coming sharp increase in national
reliance on coal—whenever it comes—will further force the attention of labor, government, and management on resolving the outstanding issues of health and safety, benefits, work rules, grievance procedures, and community development.
MINING TECHNOLOGY
Underground Mining
In underground mines, greater use of longwall mining and the removal of technical constraints on the use of the continuous-mining machine in room-and-pillar mining could produce a sharp improvement in both productivity and miner safety.59 Longwall mining requires an extensive, level bed of coal, with suitable roof conditions. One edge of the coal seam is exposed underground and sheared away by a machine making successive passes across the coal face. As the wall of coal retreats, roof supports are advanced, allowing the roof to collapse in the mined-out section. Ninety percent or more of the coal can be extracted using the longwall method, a rate of recovery that can equal or surpass that of surface mining. Longwall mining is used widely in Europe and is gradually seeing greater use in the United States.
Room-and-pillar mining uses pillars of coal to help support the roof; this method, used for 95 percent of U.S. deep-mine production, leaves 45 percent or more of the coal in place and provides less certain roof control than the longwall method. In the conventional room-and-pillar method, one machine cuts away coal from the bottom edge of the face, another machine drills holes in the coal above the cutaway portion, and then either chemical explosives or compressed air is used to blast the overhanging coal. Several sections of the mine are worked simultaneously at one or another stage of this process. The continuous miner is a machine that eliminates several stages in the conventional room-and-pillar extraction method, cutting the coal and loading it on a conveyor in one operation. Its use is constrained by the need to halt it while workers extend ventilation ducts, install roof bolts, and clear away mined coal that builds up at the face. There appears to be considerable scope for further improvement of this technology, increasing both productivity and safety. Moreover, given prospective demands for growth, the financial resources for rapid development of and investment in new mining technology are likely to be much more available than in the recent past. High petroleum and natural gas prices could provide increasing leeway for investment in improved coal mining technology without eroding the competitive position of coal.
Surface Mining
Four basic surface-mining techniques are used to extract coal from beds lying as deep as 150 ft under level terrain and from outcropping coal seams along hillsides. These four methods are area (the major technique in the West and parts of the East), open pit (also used in the West for very thick beds), contour, and auger (the latter two used mainly in Appalachia). The average ratio of overburden thickness to coal thickness in 1970 surface mines was 11:1, and in some locations exceeded 30:1. Rising coal prices since then have probably pushed the ratio higher.60
The equipment used in most surface mining includes conventional earth moving equipment and adaptations such as the “dragline,” an enormous shovel with a boom 180–375 ft long and a bucket up to 200 yd3 in volume. One reason that a labor force is more easily recruited for surface mining than for deep mining is that the surface-mining skills are transferable from the established machine operators’ trade.
Area mining involves removing the topsoil and other overburden in strips usually 1 mile long and about 100 ft wide. Topsoil and overburden are kept separate, and blasting is sometimes used to loosen both the overburden and the underlying coal, which is then loaded on trucks. Reclamation is accomplished by replacing the overburden and topsoil and revegetating.
A larger strip is excavated by open pit mining than by area mining, perhaps 1000 ft wide, with the overburden shifted within the pit to uncover the coal. This method is used in the thickest western beds.
On the hillsides of mountainous coal lands, the edge of coal beds extending horizontally through the mountain are often exposed on the slopes of hills. In contour mining, a ledge is cut along the side of the hill, with the overburden cut away to reveal the coal. The process continues inward until the volume of overburden exceeds the amount of coal to an uneconomic degree.
The use of huge augers, or drills, can extend access to contour-mined seams by boring up to 200 ft into the hillside, with the coal removed by the turning of the drill, without removing overburden.
In the absence of careful and well-enforced regulations, surface mining often has caused erosion, water pollution, and the loss of the land for any other use after mining was completed. The Surface Mining Control and Reclamation Act (SMCRA) was passed in 1977 to promote reclamation and prevent mining in areas that could not be reclaimed. The act requires states to develop licensing procedures as outlined in the act; until they do so, the federal government retains enforcement authority. To open a new surface mine in an area not designated unsuitable, a company must present enough data to allow regulators to assess the probable impact of the
operation on the surrounding area’s water and land resources and the likelihood of reclamation success. Underground mines are also regulated under the act to control subsidence and prevent toxic drainage. During mining, inspectors are to ensure that there is minimal disruption as defined by the permit.
Prior to the act, operators estimated their reclamation costs at $0.20–$1.00/ton mined, depending on seam thickness. Estimates of costs under the new act vary widely.61 Small companies, say many operators, will be unable to meet filing requirements; for firms that can, lead times for opening mines can be extended for years (especially in combination with the requirements of the Mine Safety and Health Act, the Resource Recovery and Conservation Act, and the Clean Water Act), and costs will be increased sharply. The failure of states to issue and enforce regulations under the SMCRA could severely limit enforcement of the act unless federal regulatory resources were greatly increased.62 While the new federal regulations governing mining have increased capital and operating costs, most observers do not anticipate supply restrictions to ensue. The regulations could, however, help concentrate output in those firms best able to meet the greater initial investment required by the law.
FEDERAL LEASING POLICY
In 1971 the federal government imposed a moratorium on leasing of federal lands for coal production, to gain time for an examination of comprehensive changes in its procedures. At that time, outstanding leases included 17 billion tons of recoverable reserves (about 5 percent of federally owned coal reserves). Leases on Indian lands encompassed another 3.5 billion tons. The moratorium had been imposed because the leases, for the most part, were being held but not used, leading to charges of speculation. Under the moratorium, rising coal prices have tripled western output, and federal leases contributed about 30 percent of western coal in 1977. Output on 67 active leases rose 240 percent between 1973 and 1977 to 52 million tons and coal output of Indian lands doubled in the same period to about 23 million tons.63
As a result of a 1977 suit by the Natural Resources Defense Council, a federal court ordered an environmental impact statement on leasing, due this year from the Department of the Interior.
While there is probably enough coal under federal lease in the West to support production goals there through 1985, it is possible that too much of the leased portion is in uneconomical parcels or on restricted land to fully support production beyond that date. Restricted parcels include valley floors and prime agricultural land, locales that were disqualified for mining under the Surface Mining Control and Reclamation Act of 1977.
With as many as 5 years required to open a new surface mine, some leasing should probably be instituted soon to meet post-1985 production goals, if only to fill out present leases to sufficient size to support 20–30 years of production. Railroads are the second largest holders of western coal resources. If further leasing is undertaken, the widespread, checker-board pattern of railroad land holdings may interfere with the assembling of “logical mining units” and require that railroads be included in the planning of a leasing program.
INDUSTRY STRUCTURE
As oil and gas assumed the major share of U.S. energy consumption, the coal market shifted from a large number of small- or medium-sized independent producers selling to many buyers, to a small number of large companies or their subsidiaries selling to a few large buyers.64
In 1977, the largest 15 producers yielded 40 percent of national output; two were independent, five were owned by oil companies, five by steel companies or utilities, and three by conglomerates.
In 1977, utilities mined about 14.5 percent of their own coal consumption, up from about 9 percent in 1973. Moreover, 86 percent of all coal shipped to utilities in 1976 was under long-term contracts, Long-term contracts are usually written for 2 years’ duration or more, with “market reopener” clauses allowing for price adjustments as the market price for comparable coal rises or falls, and with force majeur clauses allowing for termination in the face of uncontrollable or unforeseen events such as strikes, new regulations, or coal seam depletion. From December 1972 to September 1978 the average price per ton of contract steam coal (for use in steam-raising boilers) rose from $8 to $22.66.65 The average price per ton delivered in 1977 to utilities of at least 25-MWe capacity varied from $4.97 for 6600-Btu/lb, low-sulfur Texas surface coal delivered on contract in Texas to $49.56 for 13,000-Btu/lb, high-sulfur West Virginia coal sold in the spot market in Minnesota. The average coal price for these selected utilities was $20.37 or about 89 cents per million Btu, with 70 percent of it surface coal and 80 percent of it on contract.66
Utilities are acquiring coal mines to gain more control of the supply and price of the coal they burn. In 1977, the Federal Power Commission predicted that by 1985 utility coal consumption would rise to 770 million tons and that the amount produced by the utilities themselves (“captive coal”) would triple from the 1975 level, reaching 145 million tons, or almost 19 percent of utility coal consumption. Some maintain that this vertical integration allows utilities to manipulate supplies and production costs to justify rate increases and expand profits. The utilities counter that
mine ownership makes them better able to hold down the cost of electricity to their customers.67
Horizontal integration, the acquisition of coal mines by gas and oil companies, has proceeded faster than vertical integration and has received more attention. Fifteen oil and gas companies mined 161 million tons of coal in 1976, including 125 million tons of steam coal. This amounted to 24 percent of national production and 35 percent of all noncaptive steam coal. The principal investors in coal reserves and leases in recent years have been oil and gas companies, which now make up 6 of the top 10 reserve holders. Oil and gas companies account for about 40 percent of planned new capacity, and while they are not expected to undertake all of the planned expansion, they are expected to produce 260–360 million tons of new steam coal in 1986, bringing their share of nonmetallurgical, nonexport production to 48 percent. Seven companies account for two thirds of the capacity additions planned by oil and gas firms.
The phenomenon of horizontal integration raises charges and counter-claims similar to those in the case of utilities. Critics maintain that control of competing energy sources by a small group of firms allows self-interested manipulation of supplies and prices. Oil and gas companies maintain that their presence in the coal mining industry brings needed management expertise and capital.
By and large, coal is sold not nationally, but rather in regional markets according to type of coal. When broken down by region and type, coal becomes a concentrated industry. Although more than 3000 companies operated more than 6000 mines in 1976, the top four companies in the Midwest produced 65 percent of the coal there; in the Northern Plains, 38 percent; in the Southwest, 64 percent; and in Appalachia, 22 percent (a figure that is probably understated since northern and southern Appalachia are actually two separate markets). By 1985, estimates the Department of Energy, the top four noncaptive producers will supply 47 percent of new, noncaptive utility supply now under contract, and the top eight will supply 71 percent.68
The level of concentration in Montana and Wyoming in 1975 was estimated to reach 70 percent of output in those two states for the top four producers and 92 percent for the top eight. In addition, the boards of the top coal companies exhibit widespread interlocking with the boards of other coal companies and with the boards of major banks and coal consumers.
The dominance of long-term contracts, concentrated markets, and board interlocks carry with them possible implications of noncompetitive power and behavior that could be damaging to the economy. However, the detailed study required to explore these implications has not been done.
The rapid transformation of the structure of the coal industry was
accompanied in the early 1970s by an even more rapid change in the industry’s gross income and profitability. While output rose 14 percent from 1972 to 1976, the mine-mouth value of coal produced rose 187 percent, from $4.6 billion in 1972 to $13.2 billion in 1976.69 From an average of less than 11 percent in the 1950–1970 period, coal companies’ return on net worth rose to an estimated 30 percent in 1974 and was 21 percent in 1976.70 The labor costs of coal dropped from 58 percent of total value received in 1950 to 20 percent in 1974; the labor cost share is estimated to lie in the 25–30 percent range today. Conglomerates do not show separate earnings for their coal operations; however, the financial statements of the two major independent coal companies (the Pittston Corporation and North American Coal) show that after 1973, despite their erratic output and declining labor productivity, the companies’ total net income and net income per employee increased sharply. The net coal income of 24 large private producers rose 400 percent from $128 million in 1971 to $639 million in 1974.
It is difficult to foresee the implications of the changes in industrial structure or of the rising profitability of the coal industry. Undoubtedly concentration and horizontal integration, operating under the shelter of world oil and gas prices governed by the petroleum cartel, will lead to higher prices for coal. Moreover, producers will be much less willing to resist increased labor demands than in the past. Thus, coal prices will tend to follow closely world petroleum prices, suitably discounted for the greater cost of burning coal as compared with fluid fuels. On the positive side, continued high profitability of the industry, and capital availability from the oil and gas companies, will make possible a higher rate of introduction of new technology, and thus rapid improvements in productivity, safety, and responsible environmental behavior could ensue. It will also be easier to enforce environmental, health, and safety regulations against a concentrated industry, both because large units are easier to monitor, and because the companies will be able to pass along internalized social costs to consumers. It may be that these beneficial effects will outweigh the greater ability of large companies to resist regulation through the courts and through lobbying in the political process, Obviously, however, the coal industry is undergoing dramatic structural changes, and these are likely to accelerate in the future as the coal market inevitably expands. The situation will bear close monitoring.
TRANSPORTATION
Coal transport is dominated by railroads. Rail-only shipments account for about half (by weight) of coal haulage. Another 20–25 percent travels at least part of the way by water, and trucks carry 10–15 percent. Almost all
of the rest is used at the mine. Forty percent of 1976 rail tonnage was hauled by unit trains—100-car trains that carry only coal and usually make successive round trips between one mine and one power plant to service long-term contracts, Most unit-train traffic originates in Appalachia and Illinois, although it is increasing in the West. Transportation represents about 20 percent of the delivered cost of coal hauled by rail.71
About 5 million tons of coal per year is carried 270 miles from Arizona to southwestern Nevada by coal slurry pipeline, perhaps the most economical coal transportation method for 300- to 400-mile distances. The average ton of coal moved by rail traveled about 300 miles. The obstacles facing greater use of pipelines to haul coal are water-use restrictions and the refusal of railroads to grant rights-of-way to a competing mode. Efforts to grant slurry pipelines right of eminent domain have failed in Congress, and the future of this transportation mode remains in doubt.
Barge transport is cheaper than rail, but its use is limited by the geography of waterways and the size of river locks. Although truck transport can be as flexible as rail, it is roughly estimated to be 5 times more costly and is also limited by the deteriorating condition of mine roads, especially in Appalachia.72 In the absence of slurry pipeline development, railroads will continue to offer the best combination of cost and flexibility.
Railroad capacity should be able to keep pace with long-term growth of coal output, since the lead time necessary for acquiring new rolling stock is no longer than that required for starting a large mine or power plant. Short-term surges of output, however, could exceed the railroads’ short-run ability to add to their rolling stock.
The models used in one transportation study73 showed that Appalachian coal production is more sensitive to coal mining costs than to transportation costs, while western coal production exhibited the opposite tendency—it would be stimulated more by holding transport costs down than by holding western mining costs down.
The physical conditions of many Appalachian roads and the financial condition of some major eastern coal-hauling railroads pose problems for greatly expanded coal transport in the East. The problems, however, would be greatly reduced if the expansion were gradual.*
Given the right combination of siting, cost, and federal regulatory conditions, a utility could find a financial advantage in locating a new power plant near a mine site and transmitting power to a distant load center over high-voltage lines. It has also been argued, however, that precisely because of the problems associated with their use, coal-fired
|
* |
See statement 4–1, by H.Brooks, Appendix A. |
power plants should be located in the vicinities of those who use the power in order to allocate costs and benefits consistently.74
WATER SUPPLY AS A LIMITING FACTOR
Water is potentially a limiting factor in any plan to produce and use more coal on a large scale.75 Plans to triple or quadruple coal production and use during the transitional period of the next 20 years must include precise projections of how water requirements will be met. The problem is recognized at present, although a consensus has not been achieved. Much will hinge on what can be done in arid regions, but water concerns elsewhere are also of specific importance.
Potentially most troublesome will be providing water needed in using coal (primarily to produce electricity and synthetic fuels), rather than in mining it. To service a 35- to 45-quad increment will be difficult, even with optimal planning at both regional and local levels. The ultimate capacity of the coterminous 48 states to supply water, and the fraction of water supply that could be devoted to power supply systems, have not been estimated, but should be for national energy planning. Realistic analysis requires the development of two tools: (1) a national water-data bank and (2) practical indices to gauge water-supply potential regionally and locally, taking into account possible environmental damage resulting from excessive withdrawal.
PRECIPITATION, RUNOFF, AND CONSUMPTION
The total annual precipitation for the coterminous 48 states averages about 4.5 billion acre-ft, of which 30 percent is runoff.76 Nationally in 1975, about 9 percent of the total runoff was consumed but, within the 18 hydrological regions into which the 48 states are divided, consumption varied from less than 1 percent in New England to more than 200 percent (owing to imported water) in the Lower Colorado region (Table 4–5). The Missouri, Rio Grande, Lower Colorado, California, and Great Basin hydrological regions consumed more than 30 percent of their runoff.
As shown in Table 4–6, the consumption of water by use varies tremendously. Irrigation is by far the heaviest consumer, taking 76 percent of the total consumption; this figure rises to 88 percent when combined with evaporation from man-made reservoirs. Coal mining at present takes less than 0.2 percent, and when this is combined with power plant cooling needs (both fossil and nuclear), the total is still less than 2 percent.
The regional and end-use differences in water consumption suggest that tradeoffs could be made, so that one region or industry might receive less
water (in exchange for something else) to permit another one to receive more. However, undoing the present patterns of distribution (including allotment plans in water-short states) would be very difficult, if not impossible, today. Planning for future developments with the whole country’s interest in mind will have to involve such difficult considerations,
Figure 4–5 is a map of the nation’s hydrological regions superimposed on a map of the nation’s major coal deposits. The eastern group of mines is composed largely of the Upper Mississippi, Ohio, and Tennessee basins; the western group occurs mainly in the Upper Colorado and Missouri basins (including the Powder River).
In the western group, water consumption in 1975 was 20 percent of runoff, and water there is at a premium. In the eastern group, consumption amounts to somewhat more than 1 percent of runoff, and there should still be room for expansion. The nation has generally depended heavily on the eastern group of hydrological regions, which supply about 80 percent of the nation’s coal and about 30 percent of its electric power.
Looking toward a future that probably will involve large increases in the production of coal, electricity, and coal-derived synthetic fuels, what projections might be made about water supply as a limiting factor?
PROJECTED WATER CONSUMPTION
In the West, the stringency of water supply is well known. The projection of what additional consumption should be allowed there will have to depend on a case-by-case analysis. The pressure for such additional consumption derives from the large stores of low-sulfur coal that can be extracted relatively cheaply by surface mining.
For the eastern group of mines, the relative abundance of water would seem adequate to support increased electricity production and coal-derived synthetic fuel production, as well as coal mining. We first note that the production of coal and the reclamation of mined land requires less than 5 percent of the water used (per quad) in the production of electricity or synthetic fuel from that coal. In general, then, the water requirements for any large-scale expansion of coal production will stem primarily from the use of the coal and not from its mining. Furthermore, electricity production from oil and natural gas has the same water consumption as from coal; with nuclear fuel and current nuclear reactor technology, the consumption is about 50 percent greater, given similar cooling practices.
Consider the water requirements associated with the incremental consumption of 40 quads of coal (about 2.5 times present production). This amount could support tripling the present steam-generated production of electricity, or the synthetic production of 75 percent of today’s domestic liquid fuel consumption, or the production of synthetic gas equal
TABLE 4–5 Regional Runoff and Consumption Statistics for 1975a
to the nation’s natural gas consumption. The quantities may seem large today, but considered in the light of prospects for other sources of energy to replace dwindling oil and gas supplies in 2010, they are not implausible. Suppose that 30 quads of this increment are directed to the production of electricity (yield, about 11.5 quads) and 10 quads to synthetic liquids (yield, about 6.5 quads). The total water consumption would be about 4.2 million acre-ft, on the basis of the factors in Table 4–7.
How should such a burden be distributed? It might be argued that the nearer consumption is located to production, the more efficient it will be.
TABLE 4–6 1975 U.S. Consumption of Freshwater by Different Categories of Use (millions of acre-feet)
|
Use |
Consumption |
|
Domestic and commercial use |
7.45 |
|
Industrial mining and manufacturing |
4.54 |
|
Coal mining |
0.16 |
|
Power plant cooling (fossil and nuclear) |
2.11 |
|
Irrigation |
93.15 |
|
Evaporation from artificial reservoirs |
14.58 |
|
TOTAL |
121.99 |
|
Source: Adapted from John Harte and Mohamed El-Gasseir, “Energy and Water,” Science 199 (1978):624. |
|
In the case of the eastern group of three river basins, which in 1975 had a water consumption of 2.8 million acre-ft, use of the 40 quads would increase water consumption to 7 million acre-ft, or about 2.7 percent of runoff.
Although such gross analysis appears favorable, other considerations are important. The gross runoff may include water that is available only at great cost, or water to which there is no longer access at desirable locations. The runoff may be subject to seasonal variations that affect the constancy of supply. The withdrawal of large amounts of water (added to such variations in flow) may so diminish flow that it will no longer support the ecological integrity of the river and its banks, in turn leading to other biological and environmental effects.
ESTIMATING PERMISSIBLE CONSUMPTION LEVELS
Clearly, some measurement of permissible flow is needed. A stringent one based on ecological considerations, proposed by Samuels,77 takes as a baseline the minimum weekly flow that can be expected each 10 years (in hydrologists’ terminology, 7Q10) and proposes that, annually, no more than 10 percent of it be used (0.1×52×7Q10).
The Risk and Impact Panel analyzed the eastern and western groups of basins referred to above and for simplicity pooled the entire water supply within each group: this is equivalent to assuming that the distributions of water supply and demand are optimally matched. Under the 40-quad scenario, consumption in the western group is 20 times greater than the Samuels-derived criterion of 1.1 million acre-ft; for the eastern group, consumption is four times as great as the criterion of 1.8 million acre-ft.
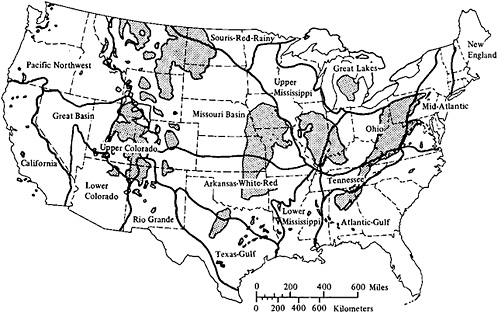
FIGURE 4–5 Water Resources Council hydrological regions in the coterminous United States, superimposed on a map of U.S. coal fields. Source: Adapted from Paul Averitt, Coal Resources of the United States, January 1, 1976, U.S. Department of the Interior, Geological Survey Bulletin 1412 (Washington, D.C.: U.S. Government Printing Office (Stock No. 024–001–02703), 1975), p. 5, for coal fields; and U.S. Water Resources Council, The Nation’s Water Resources (Washington, D.C.: U.S. Government Printing Office, 1968), for hydrological regions.
TABLE 4–7 Estimated Freshwater Consumption Factors for the Coal Fuel Cycle (millions of acre-feet)
|
Product |
Water Consumption |
|
|
Per Quad of Coal |
Per Quad of Product |
|
|
Electricitya |
0.12 |
0.31 |
|
Synthetic gasb |
0.05 |
0.07 |
|
Synthetic liquidsb |
0.06 |
0.09 |
|
aAssumes that production of electricity from fossil fuels is to be 38 percent efficient and that 17 percent of the waste heat is dissipated directly to the atmosphere along with stack gases. Water consumption for the major cooling modes are (in millions of acre-feet per quad of electricity): once-through (no storage), 0.17–0.34: once-through (with storage), 0.43–1.28; wet-tower cooling, 0.34–0.51. Estimates apply to the following distribution of cooling modes: one-third once-through (no storage), one-third once-through (with storage), and one-third wet-tower cooling. Other combinations, of course, are possible, but for the kind of gross estimate with which this discussion is concerned, this distribution provides a useful example. bAssumes an average efficiency of conversion of 68 percent. Source: Adapted from John Harte and Mohamed El-Gasseir, “Energy and Water,” Science 199 (1978):627–628. Harte and El-Gasseir give a large range of values for each item based on known practice or estimates given in environmental impact statements. Their minimal estimates have been used in each case since engineering practice will tend to improve. |
||
In the examples given above, only two groups of hydrological regions were considered. It would appear that the water problems associated with the assumed 40-quad increment could be mitigated by employing other hydrological regions, those either with large freshwater supplies (Table 4–5) or with access to the ocean (Figure 4–5). Detailed studies at both the regional and local levels, however, will be needed to evaluate the resources.
An equivalent problem has been studied in great detail by the six national laboratories, which analyzed the water requirements of the President’s National Energy Plan of 1977.78 That plan called for an additional 18 quads of coal—13.5 for electricity and 4.5 for industrial use—and the findings were considered to apply by and large to the plans under the subsequent National Energy Act of 1978. Using a less demanding water shortage criterion (critical surface supply) than that employed by the Risk and Impact Panel, the report concludes that such an increase is feasible, provided that great attention is paid to the many siting
problems that will occur. The problem will be not in mining the coal, but in its use.
In addition to the control of siting, engineering practice may contribute to easing the problem. Dry cooling (or a mixture of wet and dry cooling) could be instituted at all new power plants, for example, and synthetic fuel plants could recycle water more thoroughly. Maintenance of plants could be scheduled for the dry seasons. In places where water is fully allocated, or nearly so, supplies might be bought from current holders of water rights—not all of whom now use water very efficiently. Water could in principle be moved by pipeline from basins in which it is relatively abundant to those where it is scarce, though political opposition by those in the donor basins would likely be serious. Brackish and otherwise unusable groundwater supplies could be tapped in some parts of the country.
All of these would involve increases in the costs of the electricity or fuels produced. As energy development expands, the cost of water will become increasingly important as a factor in optimizing the design of facilities, and therefore as a component in the price of the products.
Economics aside, in some places the arrival of new, large water consumers may be effectively barred by state water allocation systems, which can be very strict in their standards for use and strongly favor established users over newcomers. This means that even where water allocations are unused, it may be impossible for new facilities to obtain them.
In conclusion, the analysis shows the increasing importance of water as a potential limiting factor for the increased production of electricity from fossil or nuclear fuel, and of synthetic fuels from coal. We judge that tripling present coal production for these ends will be contingent on facing the water problem squarely. The technical means of reducing water consumption should be stressed. Siting must be carefully planned, not only to prevent water-supply failure, but especially to obtain optimal use of our water resources. We recommend that all hydrological regions be studied, and that a national data bank be established. We note that water resources are largely under the control of the states, that two different approaches in law have been used to control them (the riparian doctrine and the appropriation doctrine), and that their use in national planning will not be a simple matter. The energy-water problem is, in fact, a part of a much broader one of water as a general limiting factor in the activities of society.
GENERAL CONCLUSIONS
Coal will remain a key element of U.S. energy policy well beyond the end of this century, regardless of the development of other energy sources. Its prime virtue is availability; it will be used increasingly over the next several decades to make up for delays in the development of other energy sources. In this role, it will help tide the nation over until truly sustainable energy sources can be used to replace dwindling supplies of oil and natural gas. It is impossible to predict very precisely how much coal will be needed annually as we approach the end of the century, but it is likely that demand, rather than supply, will be the limiting factor on coal use for as long as this study looks into the future.
In making projections, it is important to distinguish between the near term—up to the late 1980s—and the longer term. First, since the lead time for construction of both coal-fired and nuclear power plants is of the order of 10 years, the electricity-generating capacity of these sources in the near term is already fairly well determined.
Second, it is likely that the use of coal will be determined by the availability of facilities that can burn it in an environmentally acceptable manner rather than by the ability to produce or transport coal in sufficient quantities; any shortfalls in electrical output will have to be made up largely from oil- and gas-fired utilities, usually by delaying their phase-out or their transfer from base to intermediate and peak load use.
Third, if the expansion of nuclear power is constrained by safety and related considerations, then the demand for coal in the near term will be little influenced by economic considerations or by its competitiveness with nuclear power.
For the period beyond 1990 the situation becomes more complex. By then, oil and natural gas will be making smaller contributions to electricity generation, and coal and nuclear fission will tend to be more directly substitutable. If fears about safety, waste disposal, or related issues continued to constrain nuclear power, then coal demand would depend largely on the total demand for electricity and would be relatively insensitive to the competitiveness of its price or the severity of environmental regulations. If concerns about nuclear fission subside, then the choice between coal and nuclear power will likely be made increasingly on an economic basis; the demand for coal would be more sensitive to environmental standards and to the cost and reliability of pollution controls.
In both the short and long term, emission standards will have an impact on the regional distribution of coal production and hence on transportation requirements. Expansion of production is not likely to be a limitation unless there is substantial vacillation and uncertainty about environmental
requirements. Because of the regional character of coal markets, uncertainty about environmental standards could affect the regional distribution of coal output while total supply remained the same.
Beyond the turn of the century the situation will change again for several different reasons. First, coal will be increasingly required to produce synthetic fuels to substitute for declining oil and gas production. To the extent that gases and liquids could be produced in situ from coal seams not otherwise accessible to mining, this particular competition with direct combustion could be decreased.
Second (particularly if electricity growth is high), expansion of nuclear power will be increasingly limited by the availability and price of uranium unless advanced reactors and fuel recycling are permitted and well established by that time. If nuclear capacity is restricted to light water reactors on a once-through fuel cycle, the demand for coal in the early decades of the twenty-first century could accelerate.
Third, if the carbon dioxide problem (chapter 9) proves serious, as seems quite probable, it would begin to become apparent shortly after the turn of the century—the same time at which total coal use would have reached the level where it could strain water resources.
Thus, the first few decades of the twenty-first century could be a very critical time in balancing coal use with the exploitation of other alternatives, the principal one of which is likely to be nuclear fission. Among other things, this points to the importance of having as thorough a knowledge as possible of all aspects of the environmental, health, and climatic effects of coal use by the time the choices have to be made,
On balance, it seems unwise to depend on coal use to increase much more than threefold in this country by the end of the century, though it would be technically possible to produce a good deal more than this. At about this level, the problem of water supply could become pressing, and the difficulty of dealing with air pollutant emissions is likely to be great. The climatic effects of carbon dioxide emissions may well become the overriding consideration at about this time. All of these factors, with their complex political and economic interactions, will combine to slow the growth of coal demand.
Even so, at 3 times today’s production rate, or about 45 quads annually, coal is likely to supply perhaps one third to one half of the nation’s energy by the year 2000. This level of use, with all its costs and potential dangers, will have served its purpose if the intervening years are used to develop alternative, safe, and sustainable energy sources.
NOTES
|
|
1. Energy Modeling Forum, Coal in Transition: 1980–2000, 3 vols. (Stanford, Calif.: Institute for Energy Studies, Stanford University, 1978). |
|
|
2. Plant matter that sank to the bottom of swamps 1 million to 600 million years ago formed peat which, when subsequently covered by sedimentation and rock, underwent chemical change. Heat in the absence of oxygen and the passage of time caused a progressive reduction in the amount of moisture and volatile matter in the coal and a progressive increase in the carbon and energy content. The amount of heat (which was a function mostly of depth of burial) and the length of time were the primary determinants of how far the process advanced. |
|
|
3. H.M.Braunstein, E.D.Copenhaver, and H.A.Pfuderer, eds., Environmental, Health, and Control Aspects of Coal Conversion: An Information Overview, 2 vols., prepared for the U.S. Energy Research and Development Administration (Oak Ridge, Tenn.: Oak Ridge National Laboratory (ORNL/EIS-94), 1977), pp. 2–25, 30, 31; 4–138, 139; 5–5, 6, 7. |
|
|
4. The 0.6 lb or less of sulfur per million Btu is equivalent to coal with 10,000 Btu/lb and 0.6 percent or less sulfur by weight. Each 1000-Btu increase in the coal’s energy allowed an additional 0.06 percent sulfur in the coal to meet the ceiling requirement. |
|
|
5. New emissions standards in U.S. Environmental Protection Agency, news release on “New Standards for Coal-Fired Power Plants” (Washington, D.C.: U.S. Environmental Protection Agency (R-R-90), May 25, 1979). Distribution of coal by sulfur content in Francis X.Murray, ed., Where We Agree: Report of the National Coal Policy Project, 2 vols., sponsored by the Center for Strategic and International Studies, Georgetown University (Boulder, Colo.: Westview Press, 1978), vol. 2, pp. 291, 333, 393. |
|
|
6. Braunstein, Copenhaver, and Pfuderer, eds., op. cit., pp. 2–32. |
|
|
7. Paul Averitt, Coal Resources of the United States, January 1, 1974, U.S. Department of the Interior, Geological Survey Bulletin 1412 (Washington, D.C.: U.S. Government Printing Office (024–001–02703–8), 1975), pp. 63–75, |
|
|
8. Ibid., pp. 71–72. |
|
|
9. When the amount of coal in the reserve base is reduced by the amount expected to be lost in mining, it is called the reserve or the recoverable reserve. While the rate of coal recovery varies widely (from 25–30 percent in some deep mines to more than 90 percent in some deep and surface mines), 50 percent recovery has been estimated as the country’s average historical rate. This average is now rising as more surface deposits are mined and advanced underground technology is used to a greater extent. |
|
|
10. The National Coal Policy Project (NCP) argues that the Montana and Wyoming underground subbituminous coal included by the U.S. Bureau of Mines in the U.S. reserve base is currently uneconomical to mine and should not be counted. If those deposits are subtracted, the West’s share of recoverable coal energy would drop from 53 percent to about 45 percent (Murray, ed., op cit., p. 286; calculated by taking 57 percent of NCP’s estimate of energy lost and subtracting it from the estimate of the Office of Technology Assessment (see Table 4–3) of western and total recoverable reserve energy). |
|
|
11. U.S. Department of Energy, Coal—Bituminous and Lignite in 1976, Office of Energy Data and Interpretation, Energy Information Administration (DOE/EIA-0118/1[76]) (Washington, D.C.: Energy Information Administration Clearinghouse (703), 1978), p. 11; and National Coal Association [The first edition of Coal Facts published since the 1974–1975 issue], Coal Facts 1978–1979 (Washington, D.C.: National Coal Association, n.d.), p. 80, for rates of change, |
|
|
12. Averitt, op. cit., p. 88, for federal government data. |
|
|
13. The industry estimates that mines could produce 800–850 million tons in 1980 if there were demand for it, although there would be a short-term shortage of rail cars at that level of |
|
|
|
|
|
37. L.E.Swabb, Jr., “Coal—Conversion to Fluid Fuels” (Paper presented at Exxon Energy Research and Development Symposium, New York, N.Y., September 27, 1978). |
|
|
38. U.S. Department of Energy, Fossil Energy Research and Development Program, op. cit., p. 78. |
|
|
39. Perry, op. cit., p. 282, |
|
|
40. Ibid., p. 283. |
|
|
41. National Research Council, Assessment of Technology for the Liquefaction of Coal, Commission on Sociotechnical Systems, Committee on Processing and Utilization of Fossil Fuels, Ad Hoc Panel on Liquefaction of Coal (Washington, D.C.: National Academy of Sciences, 1977), pp. 131–152. |
|
|
42. Institute of Gas Technology, Assessment of Applications for Direct Coal Combustion, prepared for the National Science Foundation (Springfield, Va.: National Technical Information Service (PB-263651/AS), 1976). |
|
|
43. Congressional Budget Office, Replacing Oil and Natural Gas with Coal: Prospects in the Manufacturing Industries (Washington, D.C.: U.S. Government Printing Office, 1978). |
|
|
44. Executive Office of the President, Replacing Oil and Gas with Coal and Other Fuels in the Industrial and Utility Sectors (Washington, D.C.: Office of Energy Policy and Planning, 1977). |
|
|
45. D.E.Nichols, P.C.Williamson, and D.R.Waggoner, “Assessment of Alternatives to Present Day Ammonia Technology with Emphasis on Coal Gasification” (Paper presented at the Symposium on Nitrogen Fixation, Madison, Wisc., June 12–16, 1978). |
|
|
46. U.S. Department of Energy, Coke and Coal Chemicals in 1976, Office of Energy Data and Interpretation, Energy Information Administration (DOE/EIA-0120/76) (Washington, D.C.: Energy Information Administration Clearinghouse (706), 1978); and U.S. Department of Energy, Coke Producers in the United States in 1977, Office of Energy Data and Interpretation, Energy Information Administration (DOD/EIA-0122/1) (Washington, D.C.: Energy Information Administration Clearinghouse (708), 1977). |
|
|
47. National Coal Association, op. cit., p. 76. |
|
|
48. See note 5. |
|
|
49. See note 5. |
|
|
50. Office of Technology Assessment, op. cit., pp. 121–122. |
|
|
51. National Research Council, Coal Mining, Commission on Sociotechnical Systems, Committee on Processing and Utilization of Fossil Fuels, Ad Hoc Panel on Coal Mining Technology (Washington, D.C.: National Academy of Sciences, 1978), pp. 55–60. |
|
|
52. Ibid. |
|
|
53. Office of Technology Assessment, op. cit., pp. 121–146. |
|
|
54. U.S. Department of Energy, Coal Data—A Reference, Office of Energy Data and Interpretation, Energy Information Administration (DOE/EIA-0064) (Washington, D.C.: Energy Information Administration Clearinghouse (704), 1978), p. 14. |
|
|
55. Office of Technology Assessment, op. cit., pp. 276, 278–289, |
|
|
56. Ibid., pp. 282–286, 289. |
|
|
57. Ibid., pp. 259–263, |
|
|
58. Ibid., pp. 265–275. |
|
|
59. In 1976, 63 percent of underground production came from continuous-mining machines and 4 percent from longwall mines. U.S. Department of Energy, Coal—Bituminous and Lignite in 1976, op. cit., p. 30. |
|
|
60. Averitt, op. cit., p. 55. |
|
|
61. Office of Technology Assessment, op. cit., p. 147. |
|
|
62. Ibid., p. 382. |
|
|
63. Ibid., p. 110. |
|
|
64. The following material draws on Office of Technology Assessment, op. cit., pp. 111–120, |


