
2
Slowing the Growth of Energy Consumption
It is wrong to think of the nation’s energy troubles as simply difficulties in energy supply. The real problem is finding a new balance between energy supply and energy demand, consistent with generally satisfactory overall economic performance.* The generally rising real price of energy lends advantage to higher investments in both supply and conservation. The economic, environmental, and political trade-offs between these two coordinate efforts are not perfectly understood, but it is clear that in many activities throughout the economy it is cheaper now to invest in saving a Btu than in producing an additional one. As prices rise in the coming decades, more such opportunities will appear.
Until only the past few years, falling real prices and the availability of new sources made energy supplies seem virtually inexhaustible. The cheapness of energy fostered buildings, consumer products, industrial processes, and personal habits that used energy in ways that are by today’s standards—and by tomorrow’s no doubt even more—inefficient.
During this period the prices consumers paid for energy did not fully reflect its costs to society (as they still do not, though some steps have been made). Some resource costs and diverse social costs were borne by society at large rather than directly by the producers and users of energy. Subsidies, for example, were applied to the production and use of various
|
* |
See statement 2–1, by R.H.Cannon, Jr., Appendix A. |
energy resources, and many of the environmental and other social impacts of producing and using energy were simply unaccounted for.
The underpricing of energy encouraged rapid increases in the use of our most convenient and irreplaceable fossil fuels. At the same time, it provided inadequate incentives to search for additional supplies or substitutes. It is precisely because of this cheap-energy climate, and the consumption patterns it fostered, that there is now so much room for improvement in the efficiency of energy use before we shall begin to feel any serious economic penalties. Transportation (particularly via highway vehicles), comfortably warm or cool buildings, and industrial heat can be provided by much less energy than has been customary. In the future, if current trends in the cost of energy continue, the amount of energy consumed to provide a given economic product will gradually decrease. As the economy moves toward a new economic balance between the costs of energy and those of capital, labor, and other factors of production, it will surely come to produce goods and services with much improved energy efficiency.
DETERMINANTS OF ENERGY DEMAND
Energy is an intermediate good, valued not for itself but for the services it can provide. The amounts and kinds of energy needed to perform a given set of tasks are not fixed but vary from time to time and place to place, depending on a number of technological, economic, and demographic variables. The most important independent variables in this case are the level of economic activity, measured by the gross national (or gross domestic) product,1 and the relative prices of energy in its various forms. These in turn influence the composition of GNP and the efficiency with which energy is used. Secondary influences are provided by such factors as climate and the geographical distribution of population and industry.*
A useful measure of the energy intensity of a society is the ratio of its energy consumption to its economic output, measured in dollars of constant purchasing power. This ratio is expressed for convenience as energy/GDP or energy/GNP. Among the advanced industrial societies it varies by a factor of about 2. The United States energy-to-output ratio is one of the highest.
Some, but not all, of this difference is due to geographical and demographic differences. European configurations of industry and settlement, for example, are more compact than those of this country, and
|
* |
See statement 2–2, by J.P.Holdren, Appendix A. |
transport distances are correspondingly shorter. International variations in this ratio depend most importantly, however, on the price of energy, as it influences the efficiency with which energy is used. Most nations tax energy and energy-consuming equipment in ways calculated to induce efficiency, and such policies have tended to constrain energy consumption. For example, Western European countries have generally taxed gasoline to price levels double those in the United States, and have instituted purchase taxes on automobiles more or less scaled to their fuel consumption. This has resulted in cars with better fuel economy, in heavier use of public transportation, and generally in fewer miles driven per vehicle per year. Higher fuel prices have induced Western European and Japanese industries also to be relatively economical of energy, and to take advantage of technical innovations in energy efficiency that in this country have been of little or no economic benefit until recently.
From the end of World War II until the 1973–1974 OPEC price rise, the real prices of most forms of energy declined steadily, as energy producers took advantage of economies of scale and technical innovation, as well as subsidies like the oil depletion allowance. Declining real prices stimulated demand for energy in all countries, including the United States. Still, the U.S. energy/GNP ratio declined from 1920 until 1945 and then remained fairly constant until very recently, when signs of a further decline began to appear as a consequence of rising prices.
The abrupt oil price rise after the 1973 embargo and the accompanying rise in the prices of other fuels have brought about declines in the energy-to-output ratios of all the industrial nations. However, the full effects on energy consumption have not yet been seen. This is because energy, as an intermediate good, depends on durable goods such as furnaces, automo biles, refrigerators, or buildings to provide its ultimate service. The economy’s adjustment to higher energy prices thus depends largely on the replacement of capital goods and consumer durables with more efficient models as the old ones reach the ends of their useful lives, and only secondarily on such immediate consumer responses as driving less or turning thermostats down.
The response of energy consumption to changes in price is usually specified by a number called the price elasticity of demand, defined as the ratio of a percentage change in consumption to the percentage change in the price of energy that evokes it. Thus, if a 10 percent price rise evokes a 5 percent decrease in consumption, we speak of a price elasticity of demand for energy of −0.5. Because it takes time for consumption to adjust fully to a new price level, economists refer to short-term and long-term elasticities, with implied lags for adjustment. The values of price elasticities are usually deduced from historical data, from international or interregional comparisons, and from microeconomic estimates and engineering
analyses of the feasibility and costs of substituting new, more efficient ways of using energy. These estimates are subject to large uncertainties, and their values have been much debated.
The response of U.S. energy consumption to the OPEC price rise of 1973–1974, for example, is compatible with a wide range of different models. It is equally consistent with a small long-term elasticity and a short adjustment time or a large long-term elasticity and a long adjustment time. Yet the energy consumption for 2010 extrapolated using these two models could vary by almost a factor of 2.2 This matter is pursued further in a later section of this chapter, which describes the CONAES Modeling Resource Group’s econometric analysis of just this question. It is enough to say here that the elasticity value one chooses makes the difference between negligible and profound reduction in GNP growth as a result of large reductions in the energy intensity of the economy. The larger the price elasticity in absolute value, the more it is possible to moderate energy demand without depressing economic growth.
ENERGY PRICES AND EXTERNALITIES
Two obvious questions arise from the foregoing discussion: What is the likely future course of energy prices, and to what extent are they subject to control by policy?
In addressing these questions it is important to realize that the historical decline in the price of energy, due to technical refinements, economies of scale, and neglect of social costs, was reinforced by a variety of direct and indirect subsidies to energy producers and consumers. Examples are the oil depletion allowance, income tax treatment of foreign royalties, and special tax treatment of drilling expenses. This is a complex and controversial question, however. Some policies—notably the oil import quotas of the late 1950s and the oil production controls imposed by the Texas Railroad Commission (applied until the late 1960s)—acted as countervailing factors, tending to raise prices.
Whatever the magnitude of the effect, it is clear that the low price of energy has encouraged consumption and discouraged production and exploration for new supplies. Even after the OPEC price rise, the entitlement policies of the federal government (which spread the costs of imported oil relatively evenly over the domestic market), along with the continuation of price controls on domestic oil and gas, provided effective subsidies to imported oil.
The trend begun in the late 1960s toward incorporating more of the environmental and other social costs of energy into its price is likely to continue pushing prices up. The need to search for and produce energy resources in increasingly inaccessible areas, often in hostile environments,
will also contribute to the upward trend, as will the ability of foreign producers to demand higher prices in an oil market that belongs more and more to the sellers. Energy in most forms is likely to rise in price faster than the rate of general inflation, and consumption will therefore tend to grow more slowly relative to GNP than in the past.
THE ROLE OF MANDATORY STANDARDS
Tax, tariff, and price control policies, as we have seem, are important influences on the demand for energy. But energy consumption can also be molded directly—for example, by the imposition of mandatory standards for the efficiency of energy-using equipment (miles-per-gallon standards for automobiles, thermal performance requirements for new buildings, and so on).
There are reasons to believe that such standards will be necessary in some cases to encourage economically rational demand responses to higher energy prices. This is because most energy-consuming equipment embodies trade-offs between initial costs and lifetime energy consumption; in general one must use extra insulation, larger heat exchangers, or the like to reduce the amount of energy consumed in performing the given task. This increases the initial cost, in exchange for future savings in energy costs. Consumers tend to be more influenced by first cost than by prospective operating costs. Where this is true, they have less economic incentive to purchase equipment on the basis of its energy consumption, even if that would be economically advantageous over its lifetime.* Mandatory standards applied to manufacturers and calculated to minimize life cycle costs (at some increase in initial cost) could serve the need for conservation while actually saving money for consumers in the long term.†
DEMAND AND CONSERVATION PANEL RESULTS
The Demand and Conservation Panel of this study developed a range of energy demand projections for the period 1975–2010.3 They vary from a long-term decrease in per capita energy consumption to a large increase, and were the products of a series of scenarios embodying different assumptions about movements in energy prices. The prices assumed are those experienced by the consumer at the point of consumption and include the effects of any taxes or subsidies. These prices could also be
|
* |
See statement 2–3, by H.Brooks, Appendix A. |
|
† |
See statement 2–4, by E.J.Gornowski, Appendix A. |
regarded as surrogates for various nonprice conservation policies, although no correspondence between prices and policies was actually worked out.
Scenarios of this kind, it should be noted, are not predictions. They are rather the results of calculations based on simplified models of the economy and on more or less plausible and self-consistent assumptions about the future. The panel’s four basic scenarios depend on a 2 percent average annual real GNP growth rate between 1975 and 20104 corresponding to a real GNP in 2010 twice that in 1975. A variant explored the implications of a 3 percent growth rate, corresponding to a 2010 GNP 2.8 times as high as in 1975. (Table 2–1 traces, for reference, the growth of GNP in the United States from 1945 to 1975.)* The use of GNP as a measure of public welfare, of course, has its limitations. The appendix to this chapter discusses them briefly and offers an approach to a more accurate measure.
The basic assumptions included population growth to 279 million people in 2010, labor-force participation somewhat higher than today’s, and other assumptions about key economic variables, including a substantial decline below the historical (pre-1970) rate of increase in labor productivity. Table 2–2 gives the central features of the scenarios, including price assumptions and energy consumption values resulting from them. (For a more detailed account of these assumptions see chapter 11 and the report of the Demand and Conservation Panel.)
In general the movement of primary energy prices tends to be greater than that of prices to the consumer. For example, the 100 percent rise in average primary energy prices between 1970 and 1978 corresponds to only a 30 percent average increase in final energy prices. The Demand and Conservation Panel scenario with the highest annual rate of secondary energy real-price increase uses a value of 4 percent. This is slightly less than the rate experienced between 1972 and 1978 and substantially less than that experienced between 1972 and 1979 (including the 1978–1979 price rises). However, it is hard to make a plausible case that rates of increase significantly greater than this could be sustained out to 2010.
The scenario analysis was made under the assumption that most characteristics of the national economy will behave in the coming decades much as they have in the past. The kinds of goods and services purchased by a consumer with a given income, for example, were assumed to change little, as were general attitudes and ways of life, although shifts in purchasing habits associated with increased affluence were accounted for.
|
‡ |
Statement 2–5, by R.H.Cannon, Jr.: Over the 33-yr period 1946 to present, GNP follows a 3.4 percent growth line remarkably closely. Using 2 percent here predestined dangerously low energy demand projections. |
|
* |
Statement 2–6, by R.H.Cannon, Jr.: Table 2–1 simply displays short-term variations. See my previous note. |
TABLE 2–1 Past Economic Growth in the United States
|
Year |
GNP (billions of 1975 dollars)a |
Five-Year Average Growth Rate (percent) |
|
1945 |
679 |
|
|
|
|
0.0 |
|
1950 |
679 |
|
|
|
|
4.2 |
|
1955 |
833 |
|
|
|
|
2.4 |
|
1960 |
937 |
|
|
|
|
4.7 |
|
1965 |
1178 |
|
|
|
|
3.0 |
|
1970 |
1368 |
|
|
|
|
2.1 |
|
1975 |
1516 |
|
|
aSource: U.S. Department of Commerce, The National Income and Product Accounts of the United States, 1929–1974: Statistical Tables, Bureau of Economic Analysis (Washington, D.C.: U.S. Government Printing Office (003–010–00052–9), 1976). |
||
Fuel price elasticities used in certain analyses of the transportation and buildings sectors are extrapolations consistent with historical data and with engineering projections for each price. No major technical breakthroughs are assumed. The panel used engineering and microeconomic methods in each of the three key sectors of energy use (buildings and appliances, industry, and transportation) to determine likely changes in energy intensities and overall sectoral energy consumption as responses to changes in price. Each of the sectors was analyzed separately, and the results were integrated into a total demand projection using input-output techniques to ensure internal consistency. Over the first decade of its projections, the panel used in addition conventional econometric analysis, which relies heavily on empirical evidence from the recent past and from international comparisons. Consumption, price, income, and other data were used in calculations that reflect the characteristics of existing capital stock, population, and economic activity.
In the panel’s scenarios for 2010, the ratio of energy use to GNP ranged from half its 1975 value to about 20–30 percent higher. The panel found this entire range to be consistent with a level of GNP substantially greater than the present one.4 In physical terms this would be accomplished by consumers’ substituting capital for energy (e.g., insulation for fuel) or vice versa, depending on whether energy were cheap or costly, scarce or
TABLE 2–2 Scenarios of Energy Demand: Totals
|
Scenarioa |
Average Delivered Energy Price in 2010 as Multiple of Average 1975 Price (1975 dollars)b |
Average Annual GNP Growth Rate (percent) |
Energy Conservation Policy |
Energy Consumption (quads) |
|||||
|
Buildings |
Industry |
Transportation |
Total |
Lossesc |
Primary consumptiond |
||||
|
Actual 1975 |
— |
|
— |
16 |
21 |
17 |
54 |
17 |
71 |
|
A* (2010) |
4 |
2 |
Very aggressive, deliberately arrived at reduced demand requiring some life-style changes |
6 |
26 |
10 |
42 |
16 |
58 |
|
A (2010) |
4 |
2 |
Aggressive; aimed at maximum efficiency plus minor life-style changes |
10 |
28 |
14 |
52 |
22 |
74 |
|
B (2010) |
2 |
2 |
Moderate; slowly incorporates more measures to increase efficiency |
13 |
33 |
20 |
66 |
28 |
94 |
|
B′ (2010) |
2 |
3 |
Same as B, but 3 percent average annual GNP growth |
17 |
46 |
27 |
90 |
44 |
134 |
|
Ce (2010) |
1 |
2 |
Unchanged; present policies continue |
20 |
39 |
26 |
85 |
51 |
130 |
|
aScenario D is not included in this table; its price assumption (a one-third decrease by 2010) appears implausible. bOverall average; assumptions by specific fuel type were made reflecting parity and supply; price increases were assumed to occur linearly over time. cLosses include those due to extraction, refining, conversion, transmission, and distribution. Electricity is converted at 10,500 Btu/kWh: coal is converted to synthetic liquids and gases at 68 percent efficiency. dThese totals include only marketed energy. Active solar systems provide additional energy to the buildings and industrial sectors in each scenario. Total energy consumption values are 63, 77, 96, and 137 quads in scenarios A, A*, B, and C, respectively. eThe Demand and Conservation Panel did not develop a scenario combining the assumptions of unchanging price and 3 percent average GNP growth. If scenario B′ is used as an approximate indicator, such an assumption would entail a primary energy demand of about 175 quads. |
|||||||||
abundant (Scarcity and abundance in this context can be thought of as induced by taxes, subsidies, or regulations, as well as by realizations of the actual quantities of various resources available.) Outside this range, the Demand and Conservation Panel hesitated to offer statements based on its analyses. But at some point not far below the lowest energy scenarios examined, appreciable reductions in GNP should be expected.
The panel’s analysis assumed that large variations in the energy required per unit output were compatible with a given level of labor productivity. That this will be so is not certain; there is no available research to indicate the possible effect of energy intensity on labor productivity.
Capital requirements for the entire economy were shown to be relatively constant for all scenarios; investment simply shifts between energy production and energy conservation. (In practice, if there are large shifts in the required allocation of capital, there may be temporary bottlenecks of capital availability to particular sectors for institutional reasons.) Actually, the panel found that at present it takes considerably less capital to save a Btu than to produce one. As the more productive opportunities for saving energy are exploited, this will become less generally true.
The following sections, based on the work of the Demand and Conservation Panel and others, describe this study’s assessments of the opportunities for conservation over the next several decades within the framework of the demand scenarios.
TRANSPORTATION
Energy savings in transportation can be achieved through modest investments in existing technology and improved management. The greatest such savings can be realized in automobiles, aircraft, and freight trucks. Because of the typically dispersed U.S. settlement patterns, the energy-saving potential of mass transportation, particularly fixed-rail transit, is far less, except over periods longer than the 35 years considered in this study.
In total, it may be possible to halve the energy requirement per passenger- or ton-mile in the United States over the next 25–35 years. This could offset the large expected increase in the amount of transportation, and in turn lead to total energy consumption of, for example, 27 quadrillion Btu (quads) for transportation in the Demand and Conservation Panel’s scenario B′, in which real energy prices double and GNP rises by an annual average of 3 percent (corresponding to a total GNP 2.8 times higher in 2010 than in 1975). Under the scenario A assumptions that real energy prices quadruple and GNP growth averages 2 percent, total energy consumption for transportation in 2010 could be as low as 14 quads, below the present total of 17 quads.
Automobiles
The automobile offers the greatest single opportunity to improve the energy efficiency of the U.S. transportation system. The fuel economy of the automobile fleet could be raised to 30–37 miles per gallon by 2010 for less than a 10 percent increase in manufacturing costs (in constant dollars).5 The fuel-efficient automobile fleet for 2010 would consist of light, energy-conserving, 2-, 5-, and 6-passenger cars with performance, comfort, and safety similar to those of 1975 cars except for lower acceleration and somewhat smaller interior size. Energy savings much beyond this, however, would involve major advances in technology, compromises in performance, or higher costs. The fuel savings themselves should be considered in context; steady improvements in fleet fuel economy over the next few years must be achieved, but at the same time efforts must be made to meet increasingly stringent standards for engine emissions. Gains toward one make gains toward the other more difficult.
The potential for energy conservation in replacing today’s automobiles with more efficient ones after their 10–15 years on the road is so great that total annual fuel consumption by automobiles could remain relatively constant over the next 30 years, over which time the total national mileage driven can be expected to increase by 50–100 percent.
The total cost of owning and operating an automobile, however, is not very sensitive to fuel economy, and even a well-informed buyer may find little to prefer in a fuel-efficient car. Thus, fuel economy standards must augment the incentives of the marketplace if the potential energy savings are to be realized.* Other policies might include one or more of the following: allowing the price of gasoline to rise toward its free-market value; advertising accurate miles-per-gallon figures for each model; setting yearly registration fees by vehicle efficiency or weight; taxing new cars according to fuel efficiency; and enacting a gradual rise in gasoline taxes.
Electric vehicles offer some opportunity to moderate the demand for petroleum in the transportation sector, if the electricity is generated from sources other than oil. They may offer other advantages too—for example, shifting pollution from the vehicle to the power plant and raising the off-peak demand for electricity. Available electric vehicles have important limitations (such as range), but may with improvement find an appropriate market, such as driving within metropolitan areas. The energy-conserving potential of electric vehicles depends on the availability and costs of liquid fuels, on institutional and environmental issues, and on the development of high-energy-density batteries. Their attractiveness for a growing number of
|
* |
Statement 2–7, by E.J.Gornowski: My statement 2–4, Appendix A, also applies here. |
applications may be considerably enhanced in the future if (as is likely) the cost of liquid fuels rises more rapidly than the cost of electricity (on a percentage basis). This advantage is not fully reflected in the scenario projections presented here, which assume that the price of electricity rises almost as rapidly as the price of liquid fuel.
Air Travel
The efficiency of the passenger aircraft fleet could be improved 40 percent by 2010.6 This would require aircraft industry investments in development; airline purchases of more efficient airplanes; scheduling and pricing policies that increase load factors (passengers per plane trip); and additional improvements in traffic management. Some of these developments are already occurring as a result of recent airline deregulation and the consequent fleet expansion and rise in load factors.
An interagency task force of the federal government estimates that the research and development required to introduce fuel-conserving jet and turboprop engines, lighter structures with associated control systems, and improved design for laminar-flow control and aerodynamics, all of which would cost $670 million, could make possible savings of 2 billion barrels of oil between 1980 and 2005—$25 billion at 1976 oil prices.7 The airlines’ incentive to invest in fuel-efficient aircraft and management practices depends on favorable long-term prospects for air traffic and profit, as well as on forecasts of the price of fuel and attendant policies.
If the design and load factor improvements described were introduced, new aircraft in 2010 might consume 3180 Btu per passenger-mile, as against 7630 Btu in 1975. If a passenger load factor 44 percent above the 1975 values is included,8 then even at quadrupled energy prices (scenario A), the per capita air travel demand would increase 58 percent. The total energy consumed in scenario A would be 1.0 quad, compared to a 1975 consumption of 1.2 quads.9 For a doubling of energy prices (scenario B), demand would increase from 745 to 1800 passenger-miles per capita, and total energy consumption would be 1.6 quads.
Truck and Rail Freight
Freight-hauling trucks built in the future can be made 30 percent more fuel-efficient by using turbocharged diesel engines, improved axles, radial tires, and declutching fans.10 Some of these options are now being installed in freight trucks. Lighter tractors designed for aerodynamic efficiency would represent an additional 10 percent gain. The fuel economy of the truck fleet can be improved by installing diesel engines in medium- and
light-duty trucks, but this opportunity to conserve fuel depends on resolution of the air quality issues associated with diesel emissions.
The 7–14 percent savings in fuel that can be realized in trucks by conservative driving may not be achieved even at much higher fuel prices, since the costs of labor and capital substantially outweigh that of fuel in the truck freight business, where both wages and depreciation of equipment are time dependent and revenue is distance dependent. Any fuel-conserving measure that increases the time per trip incurs costs in wages and capital that fuel savings would be hard pressed to match.11
Removal of Interstate Commerce Commission restrictions on commodities, routes, and backhauls would allow the trucking industry to plan for fully loaded round trips, improving the industry’s load factor.12
Railroads, which account for about 1 percent of national energy consumption, are highly energy efficient for long-haul freight. A shift of long-distance freight transportation from truck to rail could be accomplished by major changes in regulatory policies, to allow, for example, the formation of integrated transportation companies free to seek optimum combinations of truck and rail freight through competition.
Energy Demand Projections for Transportation in 2010
Table 2–3 sets out demand for energy by the transportation sector in 2010 under the Demand and Conservation Panel’s scenario assumptions. Improvements in energy intensity assumed under the conditions of each scenario are included for ready comparison.
In scenario C, the real price of energy remains constant, but even so the energy intensities of all forms of transportation drop, consistent with historical patterns under falling real prices for energy. Prevailing standards for improvement in automobile fuel economy are assumed to be met, and as automobile travel begins to reach saturation (in cars per owner, minutes spent in automobiles daily, etc.), air travel claims a larger percentage of expenditures for passenger transportation.
In scenario B, prices for energy have climbed steadily to twice the 1975 levels by 2010, and in response the fuel efficiency of automobiles has doubled. Rail freight has expanded by 30 percent, truck freight has grown by 40 percent, and air freight has tripled.
In scenario A energy prices quadruple by 2010, and public policies accelerate the response to this energy conservation incentive. As a result, present federally mandated standards for automobile fuel efficiency are met and superseded by new standards. By the year 2000, advanced fuel-conserving technology (perhaps Brayton and Stirling engines) would begin to be used in new automobiles. Air travel would increase by about 60 percent, and under this intensified demand as well as public policies
TABLE 2–3 Scenarios of Energy Demand for Transportation
|
Scenarioa |
Average Delivered Energy Price in 2010 as Multiple of Average 1975 Price (1975 dollars) |
Energy Conservation Policy |
Energy Intensity by Application |
Total Demand Demand (quads) |
|
|
Application |
Intensityb |
||||
|
A* |
4 |
Very aggressive, deliberately arrived at reduced demand requiring some lifestyle changes |
|
|
10 |
|
A |
4 |
Aggressive; aimed at maximum efficiency plus minor life-style changes |
Automobile Light trucks and vans Air passenger Truck freight Air freight Rail freight |
37 mpg 30 mpg 0.42 0.60 0.60 0.91 |
14 |
|
B |
2 |
Moderate: slowly incorporates more measures to increase efficiency |
Automobile Light trucks and vans Air passenger Truck freight Air freight Rail freight |
27 mpg 21 mpg 0.45 0.80 0.60 0.97 |
20 |
|
B′ |
2 |
Same as B, but 3 percent average annual GNP growth |
|
|
27 |
|
C |
1 |
Unchanged; present policies continue |
Automobile Light trucks and vans Air passenger Truck freight Air freight Rail freight |
20 mpg 16 mpg 0.50 0.90 0.60 1.00 |
26 |
|
aScenario D is not included in this table; its price assumption (a one-third decrease by 2010) appears implausible. bFigures not followed by “mpg” refer to the ratios of new-equipment energy intensities in 2010 to those of 1975. |
|||||
encouraging conservation, perhaps two new generations of aircraft would be introduced by 2010, the last consuming only about half the fuel per seat-mile as the 1975 average. Airplane load factors would reach 70 percent (considered the maximum achievable). Truck freight would improve substantially in fuel efficiency and load factors. Despite significantly higher per capita use, the transportation sector would consume 18 percent less energy in 2010 than in 1975.
Scenario A* was used to test the possibility of reducing energy consumption to levels below those of scenario A, using the same price assumptions. This scenario includes assumed changes in tastes and preferences that produce reductions in energy consumption beyond those available from technological efficiencies. One change of this sort would be a shift to a more service-oriented economy, emphasizing lasting, repairable goods over disposable ones. Another would be a strong trend toward living and working in the same area, reducing by 10 min the time the average person spends in cars each day and yielding energy savings of 1 quad. Under the assumptions of this scenario, freight transportation would also be significantly reduced.* This scenario also includes improvements in the fuel efficiencies of military vehicles, which are not considered in other scenarios.
Although the energy consumption of our principal means of transportation can be moderated by technology and management for improved efficiency, another opportunity to achieve long-term conservation in transportation presents itself in new patterns of living, working, and recreation. These patterns will change regardless of energy prices and policy over the next 35 years, but comprehensive land-use policies combined with incentives and penalties could promote energy-conserving patterns. However, the concentration of metropolitan populations in the United States has been thinning since World War II, along with the concentration of jobs. These patterns have contributed to a general decline in the use of public transit as well as to increased automobile ownership and longer average trips. This trend would have to be reversed if significant energy savings were to be realized from new living patterns.13
It is difficult for a dispersed population to achieve significant energy savings through public transit. Direct shift of travel demand from the private auto to public transit has relatively little benefit in terms of energy conservation. Only when public transit, by altering settlement and industrial location patterns, reduces total travel demand (e.g., as measured by passenger-miles of travel per capita) can it have a significant impact on energy consumption.14
|
* |
See statement 2–8, by H.Brooks, Appendix A. |
Today, for example, 98 percent of the urban passenger-miles covered in this country are by private automobile, and urban travel accounts for half the fuel consumed by automobiles. Even if the use of public transit were 15 times greater and consumed no fuel at all, the overall savings in fuel would amount to only 15 percent if total travel demand remained the same.15 However, with the more fuel-efficient automobiles assumed in all scenarios except scenario IV, the difference in efficiency between private automobiles and rail or even bus transit per passenger-mile is small. The savings in energy consumption that might be achieved by fixed-rail mass transit depend directly on patterns of settlement and land use that run counter to the recent locational trends described above. Such changes could probably be realized only over a period of time well beyond that addressed in this study. Today buses, van pools, and car pools, because they can make flexible use of an already existing network of roads and highways, are the most effective means of reducing energy consumption in commuter travel.16
BUILDINGS AND APPLIANCES
The demand for energy by residential and commercial buildings is expected to grow more slowly from 1975 to 2010 than in the past few decades, as population growth slows and some demands become saturated. Rising energy prices, aided by mandatory building and appliance standards, could foster wider use of such well-known measures as heat pumps, better insulation for buildings, larger heat-exchange surfaces for air conditioners and refrigerators, and passive solar building design. Through these and similar conservation measures, the energy demand for buildings in 2010 could be below today’s level of 16.8 quads, despite a projected 30 percent increase in population and 63 percent increase in residential buildings.17
Existing technology could be incorporated in new buildings and appliances to reduce energy consumption substantially. For example, gas and oil heating systems have been built to use 30 percent less gas or oil than conventional designs, through improved combustion and heat transfer. Electric heat pumps for space heating deliver about 3 times more heat than electric resistance heaters per unit of electricity consumption, and can also be reversed for cooling. The energy consumption of refrigerators can be economically reduced (even at present electricity prices) by 50 percent through better design and construction. Well-insulated new single-family houses need 40 percent less heating than the average house built before 1970.18 An experimental program of retrofitting existing housing has demonstrated that in a New Jersey community nearly
one third of the energy required annually for space conditioning can be saved.19
More comprehensive energy-saving measures, such as community-based utility systems,20 are economically feasible but impractical today for a variety of reasons, including environmental restrictions, the difficulty of making connections with utilities, and developers’ reluctance to assume the burden of resolving technical complexities. Concentrated efforts to remove or reduce these institutional barriers could result in substantial additional energy savings in the buildings sector.
Economic considerations are likely to weigh more heavily than others in the decision to improve thermal integrity21 in buildings. But because many homeowners move frequently, and because the consumer who pays the bills for operating and maintaining a building does not usually make the design and construction decisions, any decision to improve efficiency must be encouraged by building code standards, financial incentives, and information campaigns. Builders have inadequate incentives to minimize life cycle costs; in fact, they tend to favor low initial costs instead. (Of the 1,455,000 single-family homes built in 1977, 904,000 were erected by developers for sale on the open market.)22
Retrofitting an existing structure for greater efficiency in energy use will not appear wise to many consumers, even as energy prices rise. Existing buildings offer less scope for energy conservation than do new ones, but some retrofit measures are generally economical. Caulking, increasing attic insulation to 6 in. and wall insulation to 3 1/2 in., adding foil insulation in the floor, and installing storm doors and windows are the best energy conservation investments. Together, they can reduce heating requirements by as much as 50 percent; savings on air conditioning would be somewhat less. Figure 2–1 illustrates the energy savings possible in new and retrofitted single-family residences as a function of incremental capital costs.
The American Society of Heating, Refrigeration, and Air Conditioning Engineers (ASHRAE) developed a new building code in 1975, setting out construction guidelines for energy-efficient buildings (ASHRAE-90–75). The Energy Policy and Conservation Act of 1975 (Public Law 94–163) requires that states adopt ASHRAE-90–75 or similar standards to be eligible for federal funding of state energy conservation plans. More stringent standards, based on performance, are being prepared and discussed.
High on the list of priorities in any program to accelerate improvements in existing buildings is accurate information for lending institutions, homeowners, and homebuyers on the advantages of retrofitting. Readily available loans, subsidies, and tax incentives can also stimulate retrofitting. A justification for such measures is that the whole society benefits from
reduced dependence on oil imports. An effective means of reducing energy consumption by existing buildings would be to require that they meet thermal efficiency standards at the time of resale. Such a measure has been introduced in Congress but not adopted.*
Energy Demand Projections for Buildings and Appliances in 2010
Table 2–4 sets out the improvements in energy intensity per unit of service that might be achieved under each of the Demand and Conservation Panel’s scenarios, along with the total energy demand by buildings and appliances.
In scenario C, real energy prices remain constant, with the exception of natural gas prices, which double to compensate for past underpricing. The lagged response to public policies now in force brings about improved efficiency in new buildings and appliances through 1980, and to some extent thereafter as older stocks are replaced. Small improvements are introduced in gas appliances, but electric resistance units (rather than heat pumps) continue to dominate electric space heating.
Under the conditions of scenario B, prices for energy double by 2010, with substantial effect in the buildings sector. Energy consumption in this sector decreases at an average annual rate of 0.6 percent (compared to an annual growth rate of 3 percent from 1950 to 1975), mainly because of the reduction in space heating requirements. Because of differences in assumed energy prices, the relative market share of electricity increases from 21 to 51 percent, while the natural gas share declines from 53 to 21 percent Electric heat pumps become cheaper and more efficient because of large-scale production and find widespread use. Solar energy finds a market toward the end of the period for water heating, space heating, and air conditioning. The energy efficiency of new air conditioners in 2010 is close to 10 Btu per watt-hour (compared to 6 Btu in 1975). Higher energy prices translate into increased expenditures for energy in buildings. However, the percentage of personal income spent for household fuel increases only moderately—from 3.1 in 1975 to 3.9 in 2010. The technologies to produce the higher efficiencies in this scenario are either on the market or achievable by well-known means.
Under scenario A, as energy prices quadruple by 2010, energy consumption in the buildings sector declines to 11 quads, from 16 quads in 1975. New energy-efficient appliances find ready markets, and solar energy begins to make a significant contribution near the end of the period: 25 percent of new air conditioners, 50 percent of new space heaters, and 70
|
* |
Statement 2–9, by E.J.Gornowski: My statement 2–4, Appendix A, also applies here. |
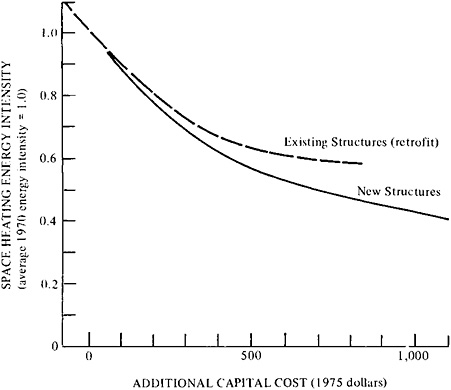
FIGURE 2–1 Space heating energy intensity of single-family residences (average 1970 energy intensity equals 1.0) as a function of increases in capital costs. Source: E.Hirst, J. Cope, S.Cohn, W.Lin, and R.Hoskins, An Improved Economic-Engineering Model of Residential Energy Use (Oak Ridge, Tenn.: Oak Ridge National Laboratory (ORNL/CON-8), 1977).
percent of new water heaters in 2010. Improved retrofit measures and construction practices contribute to the energy savings use in this scenario. Increasing income over the period helps ease the pinch of higher expenditures for fuel, but residential fuel expenditures rise from 3.1 percent of personal income to 4.9 percent.
Along with the improvements noted in scenario A, scenario A* assumes continued migration to sun belt states and acceleration of trends to multifamily residential units. These changes reduce heating and cooling requirements by about a third. Additional savings are achieved by the use of integrated utility systems in residential complexes to cogenerate electricity and heat.23
TABLE 2–4 Scenarios of Energy Demand for Buildings Sector
|
Scenarioa |
Average Delivered Energy Price in 2010 as Multiple of Average 1975 Price (1975 dollars) |
Energy Conservation Policy |
Energy Intensity by Application |
Total Demand (quads) |
|
|
Application |
Intensityb |
||||
|
A* |
4 |
Very aggressive, deliberately arrived at reduced demand requiring some life-style changes |
|
|
6 |
|
A |
4 |
changes Aggressive; aimed at maximum efficiency plus minor life-style changes |
Thermal integrity (heating) |
|
10 |
|
|
|
Residential |
0.63 |
|
|
|
|
|
Commercial |
0.42 |
|
|
|
|
|
Government and education |
0.35 |
|
|
|
|
|
Space conditioning |
|
|
|
|
|
|
Air conditioning |
0.66 |
|
|
|
|
|
Electric heating |
0.52 |
|
|
|
|
|
Gas and oil heating |
0.72 |
|
|
|
|
|
Refrigeration and freezing |
0.58 |
|
|
|
|
|
Lighting |
0.60 |
|
|
INDUSTRY
Industrial energy consumption per unit of output in the United States fell at an annual rate of about 1.6 percent from 1950 to 1970.24 Rising prices for energy will very likely accelerate this trend, as it becomes economical to apply known energy-saving technology in new industrial plants. (Overall, the energy required per unit output in U.S. industry fell by nearly 20 percent between 1973 and 1979.) Where no change in a basic industrial process is possible, somewhat smaller savings can be realized by building more efficient facilities. For example, a new cement manufacturing plant can be made 25 percent less energy intensive than today’s 20-yr-old average plant by capturing and using the high-temperature waste heat now released to the atmosphere.25)
The study’s assessment indicates that new plants in 2010 could consume an average of 40 percent less energy than existing plants with the same outputs.26 However, a third of today’s plants will probably still be in operation by 2010, and it is much more costly to retrofit existing plants than to build the same features into new plants. Furthermore, some of the industries that consume the most energy per unit output—such as petrochemicals—also show the greatest increases in demand (a trend that is likely to continue).27
In part this increased demand will be the result of substituting materials for one another to improve energy efficiency in -other products. For example, increasing the use of aluminum and plastics in automobiles will result in lifetime fuel savings considerably greater than the additional energy required to produce the materials, but this will, of course, be reflected in increased output of such materials. If the costs of improving old plants and the increasing demand for energy-intensive industries are taken into account, the overall energy savings that industry can achieve by 2010 will probably be no more than 30 percent, even for scenario A. Greater savings would require public policy measures to compel increased durability of equipment, so that a given amount of consumer service would be provided by a lower output of manufactured goods than at present
Opportunities for industry to conserve energy can be grouped into four categories.28
-
Improved housekeeping—operating and maintaining equipment at peak performance, turning out unneeded lights, and reducing heat losses—can quickly reduce energy use per unit of industrial output by 5–15 percent in a non-energy-intensive industry.
-
Waste-heat recovery and insulation—modest plant improvements to reduce heat loss and recover the higher-temperature waste-heat streams for use—typically can improve thermal efficiency by 5–10 percent in an
-
energy-intensive industry. Most of the nation’s industry could fully institute these improvements in less than 10 years.
-
Introducing new processes would improve the efficiency of energy use anywhere from 10 to 90 percent in aluminum smelting, uranium enrichment, refining operations, steel making, and other industries; because they generally require new production facilities and equipment, these measures will be introduced only gradually over several decades.
-
Recycling saves energy in factories (for example, by burning wood and scraps in paper mills). Materials such as aluminum, paper, glass, and steel can be recovered for reprocessing, and this becomes economically more attractive as energy costs rise. A number of tax and regulatory policies, however, still favor the use of materials from virgin sources rather than recycled materials; a systematic effort to identify and eliminate such economic distortions would result in additional energy savings that are difficult to estimate at present.
Many industries can reduce their requirements for purchased electricity by the use of cogeneration. This involves the use of the high temperatures available from fuel combustion to generate electricity, with the lower temperature exhaust heat from the generator used for industrial process heat. This can be done, for example, by producing high-pressure steam to operate a steam turbine generator and then using the lower pressure exhaust steam as process steam, or by using combustion gases to operate a gas turbine or diesel generator and then using the exhaust gases to produce low-pressure steam in a waste-heat boiler. If the high-temperature heat can be generated from coal rather than oil or natural gas—for example by on-site medium-Btu coal gasifiers (chapter 4)—then not only is fuel used more efficiently, but scarce natural fluid fuels are conserved.
Cogenerating electricity and steam presents an attractive opportunity to conserve energy, because about 40 percent of industrial energy is used to produce low-pressure process steam. The additional fuel required for cogeneration is about half that required by the most efficient single-purpose utility plant. Cogeneration also produces fewer air pollutants and lower thermal discharges than conventional single-purpose systems, which consume and reject more energy for equivalent service. A number of existing cogeneration systems can be applied in a variety of plants and modified to accept any of a number of fuels.29 As fuel prices rise, the fuel savings resulting from cogeneration will offset the higher investment and operating costs in an increasing number of situations.
Economic and regulatory factors, together with industry reluctance, have discouraged cogeneration over the last 50 years. If all large-scale industrial demands for low-pressure steam were provided through cogeneration in 2010, around 10 quads of by-product electricity could be
generated.30 Nevertheless, we estimate that only 2–5 quads of electric power would actually be supplied by cogeneration in 2010.31 Indeed, strong new incentives and other public policies would be necessary to achieve even this level. The technological, economic, and institutional barriers to the replacement of existing systems with cogeneration, or even to the construction of new cogeneration systems, are formidable.
In spite of its advantages, industrial cogeneration has declined in the United States from supplying 30 percent of industrial electricity in the 1920s to about 8 percent today. Other industrialized countries practice more extensive cogeneration: West German industries, for example, supply 12 percent of their own electricity through cogeneration.32* Cogeneration declined in the United States as the real price of utility-generated electricity fell. Consequently, a huge stock of industrial equipment that cannot be adapted for cogeneration was installed. Today’s typical primary industrial boiler is fabricated inexpensively and fired by natural gas. It requires little or no operating attention or maintenance to supply reliable low-pressure steam; the design and operation of cogeneration systems, by contrast, require highly skilled personnel. Thus, the personnel costs associated with cogeneration, especially in smaller installations, tend to offset the fuel savings and make them economically less attractive.
Furthermore, the close coordination with an electric utility that would be needed by most cogeneration systems, for the sale of surplus cogenerated electricity and the purchase of backup power, might seem disadvantageous to the utility, since demands for heat and electricity often do not balance. Cogeneration may appear disadvantageous to industries that pay up to 3 times as much for the electricity they buy as the utilities pay them for the surplus electricity they sell. Some industries fear that selling cogenerated power may bring them under regulation by the federal and state agencies that regulate power generation, limiting their flexibility to make quick business decisions.
The other cogeneration possibility, so-called district heat—selling heat from utility stations—faces an uncertain market. Many customers would have to be found quickly to justify the commitment in additional capital for by-product steam marketing. The distribution system, particularly if it supplies steam, is difficult to operate, maintain, and meter. And just as with electricity, backup capacity must be provided.†
The economic penalty for scrapping existing energy systems to make
|
* |
Statement 2–10, by B.I.Spinrad: Most West German “cogeneration” is done by the coal industry. Electricity is the primary product, steam is the by-product, and the example is inappropriate. |
|
† |
See statement 2–11, by B.I.Spinrad, Appendix A. |
way for cogeneration can be minimized by careful planning and timing, taking into consideration the expected lifetime of existing equipment, tax advantages, and decisions to build new plants. Other barriers to cogeneration could be overcome by incentives like the following.
-
Priority consideration of cogeneration projects for scarce gas and oil when these fuels are required, and exemption from mandatory conversion to coal from natural gas for cogeneration facilities.†
-
Favorable financial incentives to install cogeneration facilities.
-
Revision of the Federal Power Act and Public Utility Holding Company Act to exclude or limit regulation of industries that sell surplus electrical power.
-
Commercialization of on-site medium-Btu coal gasification in conjunction with gas turbine generators to allow environmentally clean use of coal in cogeneration, thus enlarging the market for cogeneration facilities.
State regulatory commissions can identify opportunities for cogeneration and bring utilities and industries together to explore them. Educational programs could interest students and practicing engineers in cogeneration and train them to design and operate these systems.*
Energy Demand Projections for Industry in 2010
The Demand and Conservation Panel’s projections of total demand for energy in the industrial sector in 2010, exclusive of the energy-producing sector itself, are summarized in Table 2–5. The last column shows the total energy consumed by the industrial sector, measured at the entrance to the factory, as it were, and ignoring losses in the energy sector associated with providing the energy. These losses depend on the particular ways the energy is provided from the primary sources, and are shown in Tables 11–6 through 11–10 in chapter 11 for particular assumed supply mixes, as described in detail in that chapter. Table 2–5 shows only the mix of coal, oil, gas, and electricity consumed in the factory. The electricity component is computed under the assumption that no cogeneration over that used at present will be used in 2010.
|
† |
Statement 2–12, by B.I.Spinrad: So we solve our oil problem by not using coal (at admittedly lower efficiency). I consider this recommendation counterproductive for the problem that exists now. |
|
* |
See statement 2–13, by H.Brooks, Appendix A. |
TABLE 2–5 Scenarios of Energy Demand for Industry
|
Scenarioa |
Average Delivered Energy Price in 2010 as Multiple of Average 1975 Price (1975 dollars) |
Energy Conservation Policy |
Energy Intensity by Industry |
Total Demand (quads) |
|
|
Industry |
Intensityb |
||||
|
A* |
4 |
Very aggressive, deliberately arrived at reduced demand assuming some life-style changes |
|
|
26 |
|
A |
4 |
Aggressive; aimed at maximum efficiency plus minor life-style changes |
Agriculture |
0.85 |
28 |
|
|
|
Aluminum |
0.55 |
|
|
|
|
|
Cement |
0.60 |
|
|
|
|
|
Chemicals |
0.74 |
|
|
|
|
|
Construction |
0.58 |
|
|
|
|
|
Food |
0.66 |
|
|
|
|
|
Glass |
0.69 |
|
|
|
|
|
Iron and Steel |
0.72 |
|
|
|
|
|
Paper |
0.64 |
|
|
|
|
|
Other industry |
0.57 |
|
|
TO WHAT DEGREE WILL MODERATING THE CONSUMPTION OF ENERGY AFFECT THE NATIONAL ECONOMY?
One frequently encounters references to the fixed relationship between energy use and GDP or GNP, with the implication that any reduction in energy use entails a loss of output and hence a lower standard of living. Such an impression has been fostered by the fact that during the 20 years before 1973, energy consumption and economic output followed each other very closely in both Europe and the United States.
In the short run, energy demand and the output of the economy are indeed tightly coupled. Sudden shortages of energy are translated immediately into reduced output, as illustrated by the 1973 oil embargo, the 1977 natural gas shortage, and the 1978 coal strike. At a given time the structure of the economy is characterized by a production function, or input-output matrix, that relates outputs to inputs in a deterministic way. However, GNP includes only the final goods and services demanded by consumers and the capital equipment demanded by producers. Intermediate goods—the materials, commodities, and services used by industry in producing its final outputs—are not included in GNP, and in the long run the mix of these intermediate goods can change substantially in response to changes in prices and technology without changing the composition of final demand nearly as much. Thus, over the long term the same mix of outputs or GNP may be provided through a considerable variety in the mix of inputs, including energy.
The historical record of the energy/GNP ratio in the United States reveals that the relation has not been constant over time.33 Comparing the prevailing ratios of different industrialized nations also presents some intriguing similarities and differences.34 The reverse causal link—from energy use to GNP—has been directly examined through the work of the Modeling Resource Group of the Synthesis Panel.35 The work of this group has been extended by the Energy Modeling Forum of the Electric Power Research Institute36 and others.37 This work supports qualitatively the conclusions of the Modeling Resource Group, with certain qualifications that will be mentioned later.
THE INFLUENCE OF GNP ON ENERGY USE
The direct effect of GNP on the consumption of energy is obvious. If the output of goods and services increases in all industries during a period of little change in relative energy prices and technology, the needed input of
energy increases as well. The increase is roughly proportional to the increase in GNP if total expenditures remain distributed in the same proportions among the various goods and services produced. In mature economies such as that of the United States, energy consumption may in fact grow slightly less than proportionately to GNP because of the gradual shift toward services, which are less energy intensive than material goods. Conversely, in developing economies, energy consumption tends to grow faster than GNP because of the increasing proportion of energy-intensive heavy industries. Thus the composition of consumption tends to change with changes in GNP, and energy intensity is not uniform. Even if energy prices remain constant, therefore, energy consumption and GNP do not necessarily change proportionately as GNP grows.
The economy can adjust over time to reduce energy consumption per unit of GNP significantly, if the reduction is accomplished by improving the energy efficiency of a unit of economic output. Changes in the price of energy are important influences in inducing higher efficiencies. Thus, the causal link from GNP to energy use may be modified by cost-saving technological change, often driven by changes in the real (constant-dollar) price of energy. If the incremental cost of the capital and labor required to save energy is less than the cost of the energy saved (suitably discounted to present value), the corresponding technological change will be made; the result will be less energy consumption per unit of GNP. This effect, of course, is subject to a considerable time lag, corresponding to the time it takes for capital equipment to reach the end of its useful life and be replaced. (Of course, the “useful life” of a piece of energy-consuming equipment is in part determined by the price of energy.) Such cost-saving innovation may also come about simply because a new technology is more cost effective for other reasons, with the energy savings an incidental by-product. It is this latter effect that probably accounts for the decline of the U.S. energy/GNP ratio between the 1920s and the 1950s, which occurred despite declining real energy prices. A substantial increase in the real price of energy evokes an additional conservation effect by increasing the prices of energy-intensive goods and services seen by the ultimate consumers, who in response tend to curtail their direct or indirect use of energy. Consumers will shift away from goods and services that are energy intensive in their production or supply, toward others that serve similar purposes with less energy input. The extent of these substitutions will in general be larger the higher the component of energy cost in the price of the good or service. Some substitutions may be made very quickly, but again most depend on some turnover of capital or consumer durables.
THE HISTORICAL TRENDS
The historical pattern in consumption of purchased energy per dollar of U.S. GNP is shown in index number form (with 1900 as 100) in Figure 2–2 for the period 1885–1975. Throughout this period, the value of energy resources at the point of production has generally accounted for only a few percent of total GNP. Thus, the input-output relationship involved is between a small input (3.1–4.5 percent of GNP) and a very large—and heterogeneous—output. Under these circumstances, it would not be surprising if the relation of energy to national output were to exhibit major changes, especially over long periods. From the late nineteenth century to the second decade of the twentieth century, energy consumption persistently grew more rapidly than GNP. From the end of World War I until the mid-1940s, it grew persistently more slowly than GNP. From 1945 to 1973, numerous short-term fluctuations occurred, with no persistent upward or downward trend.
Four groups of factors should be considered for their parts in explaining these long-term trends; the composition of national output, the thermal efficiency of energy use, the composition of energy consumption, and the behavior of energy prices in relation to those of consumer durables, producer durables, and other energy-using goods.
Composition of National Output
Energy requirements per dollar value of product vary for different types of production. It is therefore reasonable to expect that if the goods and services constituting national output undergo significant change, energy consumption per unit of national product will change with it. To measure the historical effects of this factor in detail requires a quantitative record well beyond anything that is now in hand. Nevertheless, some general points can be made. First, in the period prior to World War I, development of such basic industries as the railroads and iron and steel production dominated national economic growth. Heavier energy consumption relative to national output was thus associated (as might be expected) with the stronger influence of heavy industry. The 1920–1945 period was one in which lighter manufacturing and the broad services component of national output grew rapidly, and the corresponding decline in energy consumption relative to national product was a result.
Thermal Efficiency of Energy Use
The term “thermal efficiency” is used here to mean the ratio between primary energy input and useful energy output. Two cases of increased thermal efficiency are of considerable importance. One is the sharp
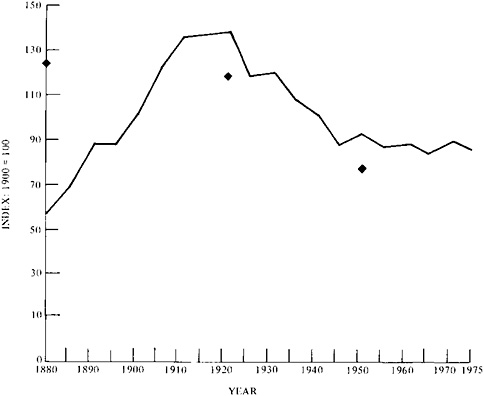
FIGURE 2–2 An index (1900=100) of energy consumed per dollar of real gross national product for the United States from 1880 to 1980 shows successive trends of rise, decline, and stability. This plot excludes fuel wood, whose consumption exceeded that of coal into the 1880s. Single-year points that do include fuel wood are indicated for 1880, 1920, and 1950. Source: Adapted from Sam H.Schurr, Joel Darmstadter, Harry Perry, William Ramsay, and Milton Russell, Energy in America’s Future: The Choices Before Us, Resources for the Future (Baltimore, Md.: Johns Hopkins University Press, 1979). Copyright 1979 by Resources for the Future, Inc.; all rights reserved.
increase over time in the efficiency of converting fuels into electricity, in which there was a decline from almost 7 lb of coal per kilowatt-hour generated in 1900 to 3 lb in 1920, and less than 1 lb by the mid-1950s (but little change since then). The other striking case is the replacement of steam power by diesel power in railroad locomotives in the 1940s and 1950s, a change characterized by an almost sixfold improvement in the efficiency of fuel use.
Measurements of changes in thermal efficiency on an economy-wide basis are not available; however, these two cases cover major areas of energy consumption. Similar changes, not so readily documented, affected
space heating as coal furnaces were replaced by oil- and gas-burning furnaces in residential and commercial use. Railroads, electric power plants, and space heating together accounted for large amounts of energy consumption, and improvements in their thermal efficiencies must have been very important in molding the trends shown in Figure 2–2.
Composition of Energy Consumption
Changes in energy consumption characterized by the expanding use of new energy forms appear to be of major importance. Growth in the use of electricity and internal combustion fuels appears to have been particularly significant.
During the period of declining energy consumption relative to GNP, the consumption of electricity grew far more rapidly than that of other energy forms. From 1920 to 1955, for example, electricity consumption increased more than tenfold while that of all other energy only doubled.
Two subtle points about electrification are essential to a proper understanding of the relationship between energy and GNP. One pertains to the question of thermal efficiency as compared to the economic efficiency of energy use. Compared to other ways of using fuel, generating electricity is thermally inefficient; it takes an average of 3 Btu of fuel to produce 1 Btu of electricity. However, the peculiar characteristics of electricity have made possible the performance of tasks in entirely new ways.
Electrification during the 1910s, 1920s, and 1930s increased the overall productive efficiency of the economy, particularly in manufacturing, where the use of electric motors freed the manufacturing industries from the rigid conditions imposed by the steam engine. (For example, electric motors can be switched on only when actually needed.) It allowed factories in addition to be reorganized into more logical sequences and layouts. This greatly enhanced manufacturing productivity—yielding greater returns per unit of labor and capital employed—and thus the productivity of the total economy.
Through its positive effects on productivity, electrification also enhanced the productivity of energy use, resulting in a decline in the amount of raw energy required per unit of national output. Taken together, improvement in the thermal efficiency of electricity generation and the enhancement of productivity due to the use of electricity were major factors in the decline of the energy/GNP ratio following World War I.
The internal combustion engine, powered by liquid fuels, played a somewhat analogous role by allowing mechanization of agriculture, a development that contributed significantly to the rising productivity of the American economy. The growth of truck transportation at the same time
made possible the movement of industry away from sites dictated by the location of railroad facilities or waterways.
Changes in production techniques made possible by changes in the composition of energy output have thus enhanced the efficiency with which energy itself has been employed as a factor of production. The broad downward trend in the energy/GNP ratio characterizing much of the historical record would, of course, have been even sharper if the thermal efficiency with which energy had been used in automotive transportation had also shown sharp increases.
The Behavior of Prices
It is of interest to examine the behavior of energy prices during the period of persistent long-term decline in the amount of energy consumed in relation to GNP. In general, the prices of the basic fuels in constant dollar terms fell during the two decades following 1920. Thus, energy consumption relative to GNP was declining even while energy prices were falling. This runs counter to the kind of behavior that would be predicted if the price of energy were the primary factor in explaining how much energy is used in relation to other factors of production in yielding the national output. Obviously, other forces have been of overriding importance, particularly changes in technology and in the composition of economic output.
Some General Conclusions About the Historical Record
Since the end of World War II, the numerous short-term fluctuations have more or less canceled to yield a record of comparative constancy in the ratio over the entire period. In the 35-yr period from 1920 to 1955 (35 years is chosen because this study tried to look ahead 35 years), the decline in energy consumption relative to GNP was about 35 percent. This decline was accompanied by fundamental transformations in the energy forms used in such major applications as railroad transportation, electric power generation, and space heating. A case can be made that the 35 percent decline would have been even sharper if energy prices had been rising at the same time instead of generally falling.
INTERNATIONAL COMPARISONS
Figure 2–3 displays correlations between energy use and gross domestic product38 in different nations. In general, countries with high GNP’s use large amounts of energy, and those with low GDP’s use small amounts.
GDP is composed of inherently different elements in different countries,
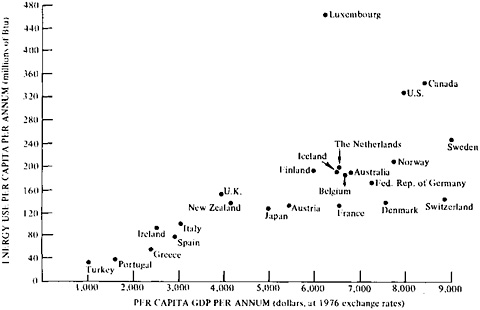
FIGURE 2–3 Correlation between per capita energy use and gross domestic product per annum for various industrialized countries. Source: Data from OECD Observer, OECD Member Countries 1978 Ed., 14th Year, no. 91 (March 1978):20–21.
and these differences as well as others are apparent in the fine structure of the figure, where some of the variation in energy/GDP ratios from country to country can be found within the gross overall correlation already noted between energy and GDP. Sweden, for example, has a per capita GDP comparable to that of the United States, but consumes only 75 percent as much energy per capita, despite the fact that it specializes in inherently energy-intensive industry (steel, paper, metals). Canada and the United States, where energy prices have in the past been markedly lower than elsewhere, are well above the line for most industrialized countries, while Sweden, West Germany, and Japan are well below.39 This variation is important, because reducing the energy/GDP ratio of the United States by, say, 30 percent could make an important contribution to reducing imports of oil.
Comparative international energy analysis points to a variety of reasons for differences between the United States and countries such as West Germany and Sweden. Some, such as patterns of automotive use, appear to be significantly influenced by differences in land areas and the locational patterns of population and industry—particularly the generally greater distances between homes and workplaces or markets in the United States. Other differences stem from years of response to low energy prices in the
United States and higher prices elsewhere. Overall, about 40 percent of the difference between the United States and other industrialized countries can be explained by structural and geographical differences, and the remainder by lower end-use efficiency in the United States.40
Transportation
The greatest difference in energy use among nations is in the transportation sector, especially in the use of automobiles. For example, not only do American passenger cars use about 50 percent more fuel per passenger-mile than European cars, but Americans also drive more than Europeans. A greater percentage of total miles driven in the United States can be attributed to urban, rather than intercity, driving; the foreign energy mix includes more public transit. These differences result partly from the much higher cost (because of taxes) of buying and operating cars abroad, and partly from the compact structure and organization of European cities. European countries have followed policies of high gasoline taxes as well as excise taxes on automobiles assessed by weight or fuel consumption. Their response to the oil embargo was to raise these taxes.
Freight transportation also contributes to the higher energy/GDP ratio of the United States (though the U.S. freight system is the world’s most efficient in terms of energy used per ton-mile) because of the large size of the country and the need for long-distance moving of bulk commodities, such as ores, coal, and grains. In West Germany, for example, the ratio of ton-miles of freight to dollars of GNP is only 40 percent of that in the United States.41
Industry
The U.S. industrial sector forms a smaller fraction of total GNP than those of most other industrial countries, but the overall energy efficiency of its processes is relatively low. Sweden uses about 85 percent as much energy per unit of production, reflecting newer technology and design attention to historically higher fuel prices.42
Households
American households consume more energy than foreign ones relative to income, even if one adjusts for climate. The difference is in space heating and cooling. The single-family homes typical of the United States, and practices that developed in periods of low fuel prices—for example, heating unoccupied rooms and maintaining higher winter temperatures—account for some of the difference. Per square foot of living space, Sweden
appears to consume half as much energy in space heating to achieve similar internal comfort under comparable climatic conditions.43
Implications
Although the influences of a great many factors have been left unexamined, these international comparisons suggest that the energy policies and practices in other countries deserve a closer look, to determine which differences are inherent in geographical and structural characteristics and which might be subject to policy influence, at least in the long run. Because of grossly different geographical circumstances and patterns of industrial and residential location in North America, it would be misleading to conclude that we could simply imitate European per capita energy consumption, but close study of energy consumption in other countries suggests that somewhat more than half the difference is amenable to influence by policy.
ECONOMETRIC STUDIES BY THE MODELING RESOURCE GROUP
The Modeling Resource Group of the CONAES Synthesis Panel, in examining the relation between energy consumption and economic growth, experimented with six computer models that attempt to characterize the response of the economy to various kinds of energy policy.44 The policy variables considered included moratoria or production limits on various energy sources, such as might be fostered by environmental concerns; relaxation of environmental standards now applied to coal and nuclear technologies; and “non-price-induced” energy conservation (due to mandatory standards, public education, and so on). The results suggest substantial flexibility in the ratio of energy consumed to economic output, and thus little relative reduction in economic growth over the next 35 years if energy conservation measures take effect smoothly and gradually enough for the economy to respond rationally.
As inputs to the models, the Modeling Resource Group used “base-case” values (with higher and lower variants) for GNP growth, the costs of major energy supplies (and the availability of the resources and technologies on which they depend), the price and income elasticities of demand for energy, discount rates, and the like.
Of crucial importance in estimating the feedback between energy consumption and economic output are the price and income elasticities of demand, which specify the assumed responses of energy consumers to changes in their incomes and in the price of energy. Energy, like most other commodities, is in greater demand as incomes rise, other things being equal; when its price rises, demand generally falls off. Economists
quantify these responses by means of ratios with the percentage change in income or price as the denominator and the resulting percentage change in consumption as the numerator. Thus, if a 10 percent rise in income produces a 10 percent rise in energy consumption, we speak of an income elasticity of demand for energy equal to 1. Similarly, if a 10 percent rise in the price yields a 10 percent decline in the demand for energy, the price elasticity of demand is equal to −1. Because the full response of consumers to changes in incomes or prices takes time to develop, economists speak of short- and long-run elasticities, with specified lags in response.
It is also important to distinguish between the elasticity of demand measured in terms of end-use energy prices and that measured with respect to the prices of primary energy inputs. Because of conversion and distribution costs, as well as taxes, subsidies, and direct price regulation, consumer prices generally change by smaller proportions than the corresponding primary fuel prices. For example, between 1972 and 1978 the consumption-weighted average primary fuel price increased in real terms by about 100 percent, but the price of net delivered energy averaged over all end-uses increased by only 30 percent. Roughly speaking, price elasticities measured relative to end-use would be expected to be 2–3 times those measured relative to primary energy (but this would tend to fall as primary energy prices rise to constitute a larger fraction of delivered prices).
A comprehensive review of the statistical evidence indicates that the overall income elasticity of demand for energy is slightly less than 1,45 but the possible range is very large. This is important, because small variations in elasticity can have rather large effects on energy consumption. Simple arithmetic, for example, shows that projected energy demand in 2010 will vary within a range of about 20 percent if estimated long-term income elasticities are varied between 0.9 and 1.1, a range that is compatible with historical analysis.
Similarly, small differences in price elasticities can have large effects on the energy-GNP feedback, and the price elasticity for energy is known with even less certainty than the income elasticity. The overall long-term price elasticities assumed in the models used by the Modeling Resource Group ranged between −0.25 and −0.5, measured in terms of primary energy prices. (Corresponding elasticities measured with respect to final energy are between −0.7 and −1.2.)46
Other important uncertainties are whether the capital necessary for the technological responses to energy curtailment will be available, how much more the second and third increments in fuel efficiency would cost than the first, and how the price elasticity of demand may change over long periods
of time and large changes in price. Exploring these questions will require more experience and data gathered over a long time.
To obtain some first estimates of what might happen over a range of assumptions, the Modeling Resource Group made a number of simulation runs under the simple assumption that the price elasticity of primary energy is constant over the entire range of GNP, energy consumption, and price levels realized in the model. It was also assumed that the proportion of GNP going into capital investment would be independent of the level of energy consumption. While the results obtained are certainly speculative, particularly when they address more than small excursions from experience to date, they indicate a range of future states of aflfairs that might accompany one or another set of choices.
From these studies emerges the important conclusion that the rate at which energy use grows may be substantially reduced over several decades with only minimal effect on GNP. Thus, in the Modeling Resource Group’s base case (no major policy changes, approximately doubled energy prices by 2010, GNP assumed to have tripled over the same period—a 3.2 percent average annual GNP growth) the ratio of energy to GNP is calculated to decline to about two thirds its present value by 2010.
For the extreme policies (represented by a strong energy tax) that are assumed necessary to lead to zero energy growth, two of the models used calculated that a 50–60 percent reduction in energy use below the base-case level would produce cumulative GNP reductions (between 1975 and 2010) ranging from about 30 percent to only a few percent for assumed price elasticities of demand of −0.25 and −0.5, respectively.
These results thus show that the relations between energy use, price elasticity, and curtailment of GNP are nonlinear. For the same level of energy consumption, a price elasticity of demand equal to −0.5 has a small effect on GNP while a price elasticity half as big has an effect many times as great.
Implicit in these calculations is the important difference between short-term effects and effects from a long-term adjustment process. Even in a slowly growing economy, the 35-yr period from 1975 to 2010 would be long enough for major changes in the physical composition of the nation’s capital stock, as existing plants and equipment for the production, conversion, and use of energy are replaced. In a more rapidly growing economy, the composition of energy-consuming stocks would change more rapidly. The most important reason for the small feedback effect is that capital and labor can be shifted from the energy supply sector to production of other goods and services without altering the quantity or mix of final goods or services which comprise GNP. In other words it is only the intermediate goods, including energy inputs, that are changed.
One question arises naturally: How are curtailments of energy use by the
amounts implied in some scenarios to be brought about if environmental or other noneconomic considerations compel one or another? In the Modeling Resource Group’s analysis, the question was not addressed as a policy problem; rather, the convenient device of a “conservation tax” on primary energy was employed strictly for the purpose of introducing hypothetical reductions in energy consumption into models of consumers’ and producers’ quantitative response to prices. This tax could be defined as the additional amount that must be added to the price of energy to reduce demand the required amount below the supply that would be elicited at the price. The term conservation tax is used in that sense here, although any non-price-induced reduction in energy use that can be mandated or achieved by other means will correspondingly reduce the tax actually needed to balance supply and demand.
Limitations of the Modeling Resource Group Results
The results of the Modeling Resource Group’s work are evidently very sensitive to the value of price elasticity of demand that is assumed. This parameter represents the local slope of a log-log curve (in this case, one giving the relation between two rates); when large changes are being contemplated, it is inherently a rough approximation. Particularly when the changes will be far beyond experience, it has value mainly as an exploratory tool rather than as a basis for prediction.
However, support for using a constant elasticity, over even as wide a range as that in the Modeling Resource Group’s models, comes from econometric evidence (data for which is relatively inexact and covers a fairly small range), and to a larger extent from technological analysis of economic opportunities for improving efficiency.47 Unless the log-log slope is highly nonlinear, the conclusions are not very sensitive to this assumption; the arbitrary conservation tax can simply be adjusted to give the desired energy consumption in the models.
Four other qualifications must be entered regarding these first-approximation results. First, the calculation constraining energy use by a blanket tax minimizes the feedback effect. Calculations experimenting with alternative constraints on one or two specific energy supply technologies show a significantly greater effect on GNP than that induced by a price increase or a conservation tax. In one calculation, a 10 percent reduction of energy use achieved by restricting particular energy supplies had about the same feedback effect—a 1 percent decrease of GNP—as a roughly 50 percent reduction from imposing a conservation tax. This difference reflects greater flexibility to adjust by substitution when no constraints are placed on particular energy sources.
Second, the availability of capital to be substituted for energy is assumed
to be constant. The assumption of a GNP growth rate averaging 3.2 percent over the period 1975–2010 is based on projections of growth in population, changes in labor-force participation, increases in productivity, and private decisions and public policies that influence the allocation of each year’s GNP between consumption and investment. Should it be found that reduced growth in energy consumption will in some way influence this allocation to decrease the amount of savings that go into capital formation, then the GNP in 2010, and the portion of the GNP trajectory nearer to the year 2010, would be somewhat lower. The estimates assume this effect can be disregarded or counteracted by government policy. This effect has been roughly estimated by the Energy Modeling Forum,48 and the results are discussed in chapter 11 under the heading “Work of the Modeling Resource Group: Feedback from Energy Use to GNP.”
Third, the assumption that choice among fuels is determined exclusively by relative price, in every case where substitution of one fuel for another is technologically possible, may understate differences in the income elasticities of demand for different forms of energy. Specifically, such an assumption may underestimate the demand for electricity and gas, which are more convenient and flexible in use than other forms of energy.*
Fourth is the assumption that channeling innovative effort and investment into materials and energy conservation will not decrease the contributions of technical progress to improving labor productivity. In other words it is assumed that labor productivity growth will be independent of energy growth. If in fact labor productivity growth declined with increasing energy conservation, this would be equivalent to a negative feedback of energy consumption on GNP growth. The same would be true, of course, if energy conservation affected other relevant variables such as labor-force participation or population growth. There is at present no basis for even speculation on the direction or magnitude of these effects. They are clearly an important topic for future research because they could have great impacts on future economic welfare.
Thus, while the calculations made by the Modeling Resource Group involve major simplifications and assumptions, they suggest that a strong economy could well exist three or four decades hence with a ratio of energy use to GNP as low as half the present value. This conclusion is substantially reinforced by similar findings from the Demand and Conservation Panel’s work, conducted by quite different methods. It is also important to realize, however, that the large reductions in energy consumption, while probably not affecting economic growth, imply substantial shifts in the structure of employment and capital investment,
|
* |
See statement 2–14, by H.Brooks, Appendix A. |
principally from the energy-producing sector to the nonenergy sectors of the economy. They also imply large price increases induced by taxes, as well as other public policy measures whose political acceptability may be questionable. CONAES has made no judgment on this; that is for debate in the political arena.* Energy taxes, of course, produce revenues that can be invested elsewhere in the economy. To the extent that these revenues are used to rebate high energy costs to certain regions or groups for equity reasons, the impact of prices on energy consumption will be reduced.
RESEARCH AND DEVELOPMENT FOR ENERGY CONSERVATION
Energy conservation technology characteristically must be closely adapted to the particular circumstances of individual end-uses of energy. One would hope that the fact and prospect of higher energy prices would lead the private sector to develop and commercialize most of the technology required to achieve the energy efficiencies projected in the preceding sections of this chapter.
Thus there is a question as to the appropriate roles of the federal government in stimulating research and development to promote energy efficiency and encouraging adoption of energy-efficient technologies. Just as we saw that mandatory performance standards might be necessary to ensure and accelerate the achievement of energy efficiencies that would be economically rational given projected future prices, so there may be a case for government showing the way in energy conservation technology. In the first place, because of institutional inertia, ingrained patterns of consumption, and uncertainties about how prices will rise in the future, prices alone may not provide sufficient incentive, especially for individual consumers.† There may be a strong case for government-supported research to demonstrate new energy conservation technologies in order to reduce the uncertainties about their potential benefits and hence their market potential. In the second place, the political risks and economic impacts of large petroleum imports may justify looking upon energy conservation as partially a public good, eligible for public subsidy.‡
Despite these justifications, however, there is a question whether government-supported research and development will result in technologies sufficiently well adapted to the true requirements of end-uses. Experience with other government programs to develop civilian technologies, in which the technological choices were made by government itself,
|
* |
See statement 2–15, by H.Brooks, Appendix A. |
|
† |
Statement 2–16, by E.J.Gornowski: My statement 2–4, Appendix A, also applies here. |
|
‡ |
See statement 2–17, by E.J.Gornowski, Appendix A. |
has not been a very happy one. A more efficient government strategy may be to provide conservation incentives that leave the choice of technologies as much as possible to the pluralistic workings of the private sector.
However, government-supported research that contributes to general understanding of the workings of the energy sector of the economy can have several benefits. In the first place, since government-mandated energy performance standards may be a necessary component of national energy policy,‡ research that improves our ability to predict the effectiveness of standards and other government policies designed to influence patterns of energy consumption will be of obvious value. Any knowledge that improves forecasts of the economy’s responses to prices and policies with respect to aggregate demand for various fuels can also help to guide policy. Even engineering or physical research that helps to evaluate the feasibility of various equipment performance standards that are under consideration could be justified, although the actual development of commercial equipment should probably be left to private initiative and funding. Close monitoring of the progress of energy-conserving technology in the private sector may demand some publicly supported research simply to properly inform government policy making. Examples of opportunities for research and development in support of energy conservation policy are listed in Tables 2–6 and 2–7, taken from the work of the Demand and Conservation Panel. Table 2–6 deals with the technological research that could be supported by industry, with government monitoring and disseminating progress data to help accelerate adoption. Table 2–7 lists examples of economic, social, and behavioral research that may provide guidance for federal policy and help inform the private decisions of entrepreneurs and consumers.
CONCLUSIONS AND RECOMMENDATIONS
The economic and engineering analyses of this study in the area of energy demand disclose several principal results. The methods for projecting energy demand as a function of price and public policy are described in chapter 11; here we only summarize the findings.
-
Taking a long view of the historical record, it is evident that the ratio of energy consumed to GNP has varied considerably in this country, depending on the composition of national production, the thermal
|
‡ |
Statement 2–18, by E.J.Gornowski: My statement 2–4, Appendix A, also applies here. |
TABLE 2–6 Opportunities for Technological Research and Development in Support of Energy Conservation
|
|
Buildings and Appliances |
Transportation |
Industry |
|
Basic studies |
Properties of materials Automatic control technology |
Materials properties, e.g., strength-to-weight Thermodynamics of internal/external combustion engines Chemical energy storage Automatic control technology |
Materials properties at high temperatures Characteristics of industrial combustion Heat transfer and recovery methods Automatic control technology |
|
Near-term energy-use patterns |
Automatic set-back thermostats Pilot/burner retrofit |
Specific data on factors that influence fuel economy of existing cars |
Improved methods for energy monitoring and housekeeping Improved methods for scrubbing combustion gases |
|
Intermediate-term retrofit |
Reinsulation methodologies Solar water heating and passive design Metering for time-dependent utility pricing Automatic ventilation control for building and appliances (e.g., clothes dryers) |
Improved power-to-weight ratios, as well as interior volume-to-weight ratio Instrumentation to provide driver with real-time data on fuel efficiency Improved intermodal freight and passenger terminals Improved traffic control |
Process retrofit technologies Improved combustion of marginal fuels Cogeneration of heat and electricity Automated monitoring of energy performance Low-temperature heat utilization |
|
Long-term technologies |
High-performance electric and heat-driven heat pumps Solar space cooling Sophisticated appliance controls and integrated appliance design More sophisticated design of buildings to provide desired amenities at low energy demand |
New motors Improved aerodynamic design for cars, trucks New primary energy sources (liquid, electric) Improved intermodal transfer technology Technology for improved energy efficiency in air transport |
Basic new processes that reduce overall requirements for energy and other resources (e.g., recycling, durability) per unit output Modification of material properties to enable replacement of energy-intensive materials with less energy-intensive material in specific applications |
TABLE 2–7 Opportunities for Economic, Social, and Behavioral Research in Support of Energy Conservation
|
|
Buildings and Appliances |
Transportation |
Industry |
|
Basic studies |
Consumer motivation and decision processes Demand as a function of price, income, and demographic factors Influence of taxes, social factors on first cost or life cycle cost decisions Standardized data (e.g., performance data on new stocks) Analysis of effects of initial cost and energy use on purchase patterns for consumer durables |
Basic consumer purchase motivations Standardized data (e.g., fleet average miles per gallon for cars and trucks, by function) Effect of relative prices on choice of transportation mode Identification of energy subsidies and effects |
Relationship between industrial demand, national economics, and demographic features of our society Consequences for energy use of alternative long-term raw material programs Standardized data (e.g., energy per unit output statistics) |
|
Near-term energy-use patterns |
Identification of information useful in modifying consumer behavior to reduce energy waste (e.g., effects of thermostat setbacks) Ways to induce near-term commitment to solve long-term energy problems (investment choices and behavior patterns) |
Ways to influence drivers’ habits that affect energy consumption in existing cars Ways to induce actions in the near term in response to a long-term problem |
Development and demonstration of improved techniques for corporate energy management (e.g., energy audits, energy accounting, energy information systems, etc.) Evaluation and demonstration of mechanisms, motivation factors, and procedures for minimum life cycle cost |
|
|
|
|
decisions in procurement (e.g., light-weight steel versus plastic for lighter automobiles) Development and demonstration of systems to increase recycling of basic materials (e.g., steel, glass) |
|
Intermediate-term energy-use patterns |
Improved information on benefit/cost of energy performance in new and retrofitted housing, appliances |
Intermodal shifts of freight Reform of driver-training programs Identification and removal of regulatory constraints to more efficient passenger and freight transport |
Ways to encourage energy-related corporate investment decisions on the basis of applicable marginal or future energy costs |
|
Long-term technologies |
Improved quality and craftsmanship in manufacturing and construction Matching desired level and comfort to minimal resource demands |
Increased use of mass transportation Improved design for energy consumption Zoning and land-use strategies that sustain and enhance mass transportation, modal shifts |
Experimentation and analysis of incentives for innovation in industrial energy use Identification and evaluation of incentives to increase product durability |
-
efficiency of energy conversion and end-use, the composition of energy consumption, and movements in energy prices.
-
The energy/GDP ratios of industrialized countries with similarly high levels of GDP per capita vary over a significant range. Although many differences help account for this variance, past energy prices in the different countries are major factors.
-
The analyses of the Demand and Conservation Panel indicate that the energy necessary to produce a given unit of economic output can be substantially reduced by (1) lowering the energy intensity of production, (2) changing the composition of energy consumption, and (3) shifting to an inherently less energy-intensive mix of goods and services.
-
The critical parameter for estimating the extent to which these energy-conserving measures will actually be used in any assumed scenario of future energy prices, and the feedback of this reduction in energy use on GNP, is the long-term price elasticity of demand for energy. For small reductions in energy consumption—10–20 percent below the Modeling Resource Group’s market-equilibrium base case value for 2010—assumed price elasticities between −0.25 and −0.50 yield approximately the same feedback effect on cumulative GNP between 1975 and 2010 (a 1 percent decline). For larger reductions, the high and low elasticity values yield widely different results.
-
This uncertainty in estimating the price elasticity of demand for energy produces a considerable range in estimates of energy demand over the next three decades. Nevertheless, the projections by the Modeling Resource Group all imply a gradual long-term decline in the energy/GNP ratio, without substantial impacts on economic growth.
-
The most powerful influence acting to moderate the growth of energy consumption in the analyses of this study is smoothly rising prices for energy, although realizing the effect of prices may require supplementation by regulations and minimum standards of performance for energy-using equipment.*
-
The economy will need time to change. Opportunities to reduce the consumption of energy are realized primarily through the replacement of present capital stock with less energy-intensive stock; this will generally take 10–40 years even under the pressure of rising energy prices and other incentives.
In sum, it appears that the energy-to-economic-output ratio in the U.S. economy can be lessened, over the long term, and that prudent, sustained
|
* |
Statement 2–19, by E.J.Gornowski: My statement 2–4, Appendix A, also applies here. |
policies can help the economy continue growing with constrained growth of energy consumption.
POLICY RECOMMENDATIONS
The analyses described in this chapter depend generally on the plausible assumption that energy prices will continue rising to reflect scarcity and intensified world competition for supplies; increasingly expensive discovery, extraction, and conversion of energy resources; the costs of environmental protection and repair; and so on. The willingness to invest in capital substitutions for energy and to practice energy conservation clearly rises or falls with changes in the anticipated price of energy. Conservation of energy represents a middle- to long-range investment; if the investment is to be made, the signals the economy reads from prices for energy must be unambiguous, and the trends reasonably predictable over the lifetimes of normal investments.
However, because even accurate, widely noted market signals are sometimes insufficient to guide market decisions in the direction of energy conservation—as, for example, when the total cost of owning and operating a particular facility, appliance, or process is relatively insensitive to energy efficiency—price alone cannot carry the burden of effective conservation policy.*
At a minimum, energy prices should rise smoothly to levels that reflect the incremental cost to society of producing and using additional secure sources of energy. Environmental costs—coal mine reclamation, emission controls, and the like—must be incorporated in the price of energy. Subsidies to energy users, such as price controls and crude oil entitlements, should be eliminated over time.
For such a pricing policy to have its greatest effect, consumers must be provided with the most accurate possible information on its implications. That is, the energy costs of appliances, building features, and industrial equipment must be as clearly as possible referrable to the corresponding initial costs, so that consumers can make the necessary cost trade-offs with ease. Labeling appliances to indicate their energy consumptions is a good first step for the benefit of individual consumers; publicizing the energy trade-offs in various forms of insulation and other building improvements would also yield substantial benefits.
For many industrial processes, adoption of energy-conservative technology is balked by uncertainty about its costs and benefits, and most industrial establishments tend to be conservative in making such decisions
|
* |
Statement 2–20, by E.J.Gornowski: My statement 2–4, Appendix A, also applies here. |
in the face of uncertainty (though when the benefits are obvious, industrial energy consumers are probably quicker to seize them than household consumers). It might therefore be beneficial to carry on a few governmentsupported demonstrations of promising technologies in actual industrial situations. Investment tax credits to encourage conservation investments would also be useful, especially for inducing more efficient use of oil and natural gas, as in cogeneration or integrated utility systems.
Where energy prices are insufficient to induce the appropriate, economically rational responses from consumers—as they are, for example, in the case of the automobile—they could be supplemented by nonprice measures.* Mandatory fuel economy standards, installation of peak load charges or cutoff devices on certain energy-intensive equipment, thermal integrity standards for buildings, and other similar measures may all be useful policy instruments.
The scope of this study did not allow us to explore deeply the potential conflicts between energy policy and other national goals. We are particularly concerned that higher prices for energy may affect inequitably those least able to pay—low-income households in rental housing, small businesses—or particular regions of the country. Public policy must attend to the untoward consequences of higher prices. However, compensation to disadvantaged consumers should take the form of discretionary funds rather than being tied directly to energy (as it would be, for example, with “energy stamps”). Otherwise such consumers would have no incentive to make energy-conserving investments.
Several economic analyses suggest that policies tending to reduce energy consumption per unit of output also tend to increase labor inputs. Thus, investing capital to increase energy efficiency is likely to generate more employment than investing the same capital to increase energy supply, It has been suggested that taxing energy to increase energy prices and devoting the revenue thus derived to reducing employment taxes is likely to reinforce the substitution of labor for energy.49 The committee has not discussed these arguments in detail, nor has it addressed the political feasibility of such adjustments, The several implications for policy justify further investigation and evaluation. Federal and state programs to provide financial resources for conservation investments also encourage job creation.†
While conservation measures can be selected with an eye to other national objectives—the most important of which may be social equity—they should not be unduly encumbered by competing demands. The
|
* |
Statement 2–21, by E.J.Gornowski: My statement 2–4, Appendix A, also applies here. |
|
† |
Statement 2–22, by E.J.Gornowski: The paper hypothesizes—but does not assert—that conservation investments create more employment than production investments. This has not been substantiated. |
resolution of social inequity, for example, deserves its own instruments. The amount of energy consumed in the future will be determined by economic evolution in the market place, and by events and forces many of which cannot now be foreseen. General directions can be selected for the growth of consumption, but attempts to plot the future in detail are likely to founder on the unexpected cumulative effects of many small decisions. We have attempted here only to sketch possible patterns of growth, and to indicate how these might be affected by various near-term choices.
APPENDIX: A WORD ABOUT GNP
GNP is a composite of many items that mean different things to different people—the summation of apples, can openers, bus rides, homes, and other things. Its calculation is made possible by the use of their market prices, a rough reflection of their economic costs of production in quantities determined by the preferences and purchasing power of consumers. Statistical observation of these quantities and market-balancing prices yields GNP estimates for many nations. It also results in a bias toward items whose prices are determined by the market at the expenses of items, perhaps at least as important, for which no market prices exist
Several corrections have been made or proposed for a more ample concept that expresses aggregate economic welfare. One such attempt, for example, is the recent proposal by Nordhaus and Tobin,50 for a measure of economic welfare (MEW), illustrated by their estimates for 1 year as shown in Table 2-A1.
The corrections and extensions made in this table are of two kinds. Some eliminate the cost of necessary activities that do not directly add to welfare but are aimed at preventing its impairment; these are more correctly regarded as inputs than as outputs. Other corrections add nonmarket activities and uses of time that contribute very substantially to welfare. The economic values of these additions are estimated by the market prices on alternative uses of the time or other resources devoted to these activities.
There is one specifically “environmental” effect in the list of corrections, that for disamenities of urbanization, estimated from the wage differential for comparable work that holds people in the cities. The energy problems that are the focus of the CONAES study involve a great many more environmental effects that are difficult to assess economically. The costs of abating air and water pollution by standards already enforced are included in current GNP estimates as costs of production and consumption. These
TABLE 2-A1 Gross National Product (GNP) and Measure of Economic Welfare (MEW), United States, 1965 (billions of dollars at 1958 prices)
|
Gross national product |
|
618 |
|
Allowance for depreciation of capital |
−55 |
|
|
Net national production |
|
563 |
|
Regrettable necessities (defense, police, sanitation, etc.) |
−94 |
|
|
Value imputed to desired leisure (at wage rate) |
627 |
|
|
Value imputed to housework and other nonmarket work |
295 |
|
|
Disamenities of urbanization |
−35 |
|
|
Services of public and private capital, not included in GNP |
79 |
|
|
Additional depreciation of capital |
−93 |
|
|
Measure of economic welfare for 1 year |
|
1343 |
|
Investment needed to sustain per capita MEW over subsequent years as population grows |
−102 |
|
|
Sustainable MEW |
|
1241 |
costs have therefore been reclassified from environmental to economic costs. Instances are the cost of stack gas scrubbers in coal combustion, or the higher price of low-sulfur coal and oil.
Direct economic assessment of the health, safety, and other risks not removed by a given level of protection is much more difficult than estimating the cost of that level of protection. As more experience in measurement and policy is gained, greater consistency between policies addressed to different environmental effects can be expected to help in the measurement of the remaining effects. It is, of course, hard to imagine a market in alleviation of environmental damage. However, one may expect that the inevitable policy debates and struggles will, as time goes on, settle into a more balanced pattern of policies, reflecting with some internal consistency the people’s willingness to pay for the various forms and degrees of protection. If and when this comes about, the economic cost of a given decrease in the ambient standard for sulfur dioxide, or of the further decrease by 1000 tons of the inventory of radioactive waste awaiting safe ultimate disposal, may allow an extrapolation that estimates the remaining unabated detriment as perceived by its representatives. These estimated detriments would be among the items still to be subtracted from GNP or from MEW to form an index of economic welfare. Any particular standards would from there on be further improved if and when the cost of doing so were to fall below the resulting estimated gain in welfare. The
balance of policies might then take the place of the market mechanisms in providing weights by which environmental benefits are combined to measure quality of life.
Meanwhile, the state of the art of energy scenario projection uses the GNP as a stand-in for MEW or quality of life. CONAES has made use of this stand-in, recognizing the limitations it imposes on the findings reported.
NOTES
|
|
|
|
|
36. Institute for Energy Studies, Energy and the Economy, Energy Modeling Forum Report no. 1, vols. 1 and 2 (Stanford, Calif.: Stanford University, 1977). |
|
|
37. Hogan, op. cit. |
|
|
38. See note 1 above. |
|
|
39. Demand and Conservation Panel, op. cit.; and see note 34 above. |
|
|
40. S.Schurr, J.Darmstadter, H.Perry, W.Ramsay, and M. Russell, An Overview and Interpretation of Energy in America’s Future: The Choices Before Us (Washington, D.C.: Resources for the Future, June 1979). |
|
|
41. See note 33 above. |
|
|
42. See note 34 above. |
|
|
43. Lee Schipper, “Raising the Productivity of Energy Utilization,” in Annual Review of Energy, ed. Jack M.Hollander, vol. 1 (Palo Alto, Calif.: Annual Reviews, Inc., 1976), pp. 455–517. |
|
|
44. Synthesis Panel, Modeling Resource Group, op. cit. |
|
|
45. L.A.Taylor, The Demand for Energy: A Survey of Price and Income Elasticities, working paper prepared for CONAES. (Available in CONAES public file, April 1976.) |
|
|
46. Hogan, op. cit. |
|
|
47. Demand and Conservation Panel, op. cit. |
|
|
48. Institute for Energy Studies, op. cit. |
|
|
49. D.Chapman, “Taxation, Energy Use, and Employment,” statement presented at hearings, Subcommittee on Energy, Joint Economic Committee, U.S. Congress, 95th Cong., 2d Sess., March 15–16, 1978. |
|
|
50. W.Nordhaus and J.Tobin, “Is Growth Obsolete?” in Economic Growth. National Bureau of Economic Research (New York: Columbia University Press, 1972). |


